Armenian vs Mongolian Single Male Poverty
COMPARE
Armenian
Mongolian
Single Male Poverty
Single Male Poverty Comparison
Armenians
Mongolians
12.1%
SINGLE MALE POVERTY
98.7/ 100
METRIC RATING
80th/ 347
METRIC RANK
12.2%
SINGLE MALE POVERTY
97.7/ 100
METRIC RATING
95th/ 347
METRIC RANK
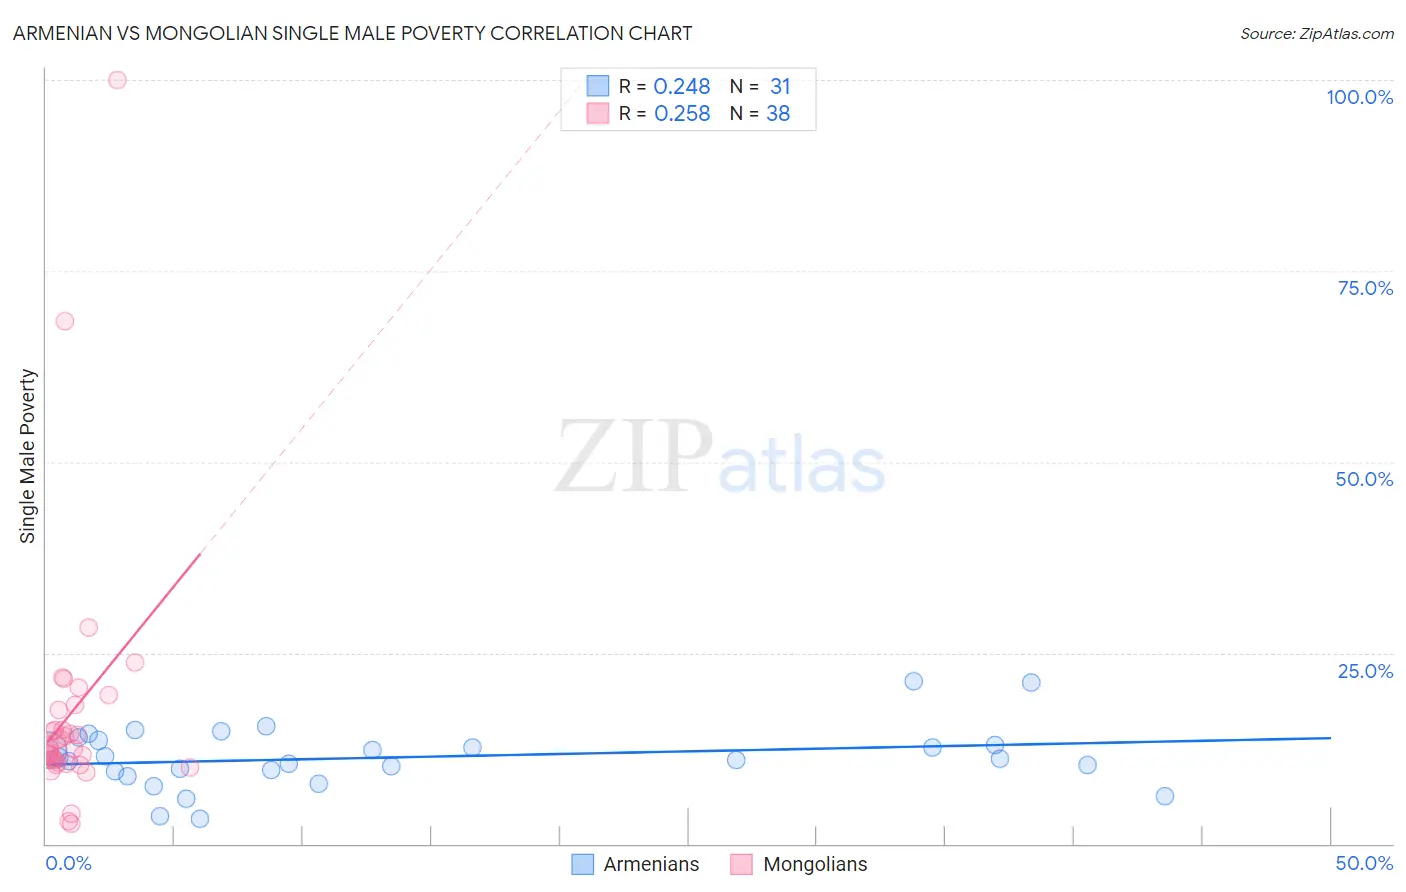
Armenian vs Mongolian Single Male Poverty Correlation Chart
The statistical analysis conducted on geographies consisting of 275,861,464 people shows a weak positive correlation between the proportion of Armenians and poverty level among single males in the United States with a correlation coefficient (R) of 0.248 and weighted average of 12.1%. Similarly, the statistical analysis conducted on geographies consisting of 132,546,705 people shows a weak positive correlation between the proportion of Mongolians and poverty level among single males in the United States with a correlation coefficient (R) of 0.258 and weighted average of 12.2%, a difference of 0.76%.
Single Male Poverty Correlation Summary
| Measurement | Armenian | Mongolian |
| Minimum | 3.3% | 2.7% |
| Maximum | 21.2% | 100.0% |
| Range | 17.9% | 97.3% |
| Mean | 11.3% | 17.1% |
| Median | 11.1% | 12.5% |
| Interquartile 25% (IQ1) | 9.5% | 10.7% |
| Interquartile 75% (IQ3) | 13.5% | 17.6% |
| Interquartile Range (IQR) | 4.0% | 6.9% |
| Standard Deviation (Sample) | 4.0% | 17.3% |
| Standard Deviation (Population) | 4.0% | 17.0% |
Demographics Similar to Armenians and Mongolians by Single Male Poverty
In terms of single male poverty, the demographic groups most similar to Armenians are Immigrants from South America (12.1%, a difference of 0.020%), Immigrants from Colombia (12.1%, a difference of 0.080%), Immigrants from Chile (12.1%, a difference of 0.080%), Immigrants from Czechoslovakia (12.1%, a difference of 0.11%), and Turkish (12.1%, a difference of 0.18%). Similarly, the demographic groups most similar to Mongolians are Colombian (12.2%, a difference of 0.010%), Immigrants from Bosnia and Herzegovina (12.1%, a difference of 0.13%), Immigrants from Sweden (12.2%, a difference of 0.15%), Spanish American Indian (12.1%, a difference of 0.19%), and Immigrants from Italy (12.2%, a difference of 0.20%).
| Demographics | Rating | Rank | Single Male Poverty |
| Immigrants | Malaysia | 99.2 /100 | #77 | Exceptional 12.0% |
| Immigrants | Venezuela | 99.1 /100 | #78 | Exceptional 12.0% |
| Immigrants | Belgium | 99.0 /100 | #79 | Exceptional 12.0% |
| Armenians | 98.7 /100 | #80 | Exceptional 12.1% |
| Immigrants | South America | 98.7 /100 | #81 | Exceptional 12.1% |
| Immigrants | Colombia | 98.6 /100 | #82 | Exceptional 12.1% |
| Immigrants | Chile | 98.6 /100 | #83 | Exceptional 12.1% |
| Immigrants | Czechoslovakia | 98.6 /100 | #84 | Exceptional 12.1% |
| Turks | 98.5 /100 | #85 | Exceptional 12.1% |
| Immigrants | Israel | 98.5 /100 | #86 | Exceptional 12.1% |
| South Americans | 98.5 /100 | #87 | Exceptional 12.1% |
| Immigrants | Eritrea | 98.5 /100 | #88 | Exceptional 12.1% |
| Immigrants | Ireland | 98.3 /100 | #89 | Exceptional 12.1% |
| South American Indians | 98.3 /100 | #90 | Exceptional 12.1% |
| Immigrants | Turkey | 98.2 /100 | #91 | Exceptional 12.1% |
| Spanish American Indians | 98.0 /100 | #92 | Exceptional 12.1% |
| Immigrants | Bosnia and Herzegovina | 97.9 /100 | #93 | Exceptional 12.1% |
| Colombians | 97.8 /100 | #94 | Exceptional 12.2% |
| Mongolians | 97.7 /100 | #95 | Exceptional 12.2% |
| Immigrants | Sweden | 97.5 /100 | #96 | Exceptional 12.2% |
| Immigrants | Italy | 97.4 /100 | #97 | Exceptional 12.2% |