Armenian vs Lumbee Male Poverty
COMPARE
Armenian
Lumbee
Male Poverty
Male Poverty Comparison
Armenians
Lumbee
11.0%
MALE POVERTY
68.0/ 100
METRIC RATING
148th/ 347
METRIC RANK
20.2%
MALE POVERTY
0.0/ 100
METRIC RATING
341st/ 347
METRIC RANK
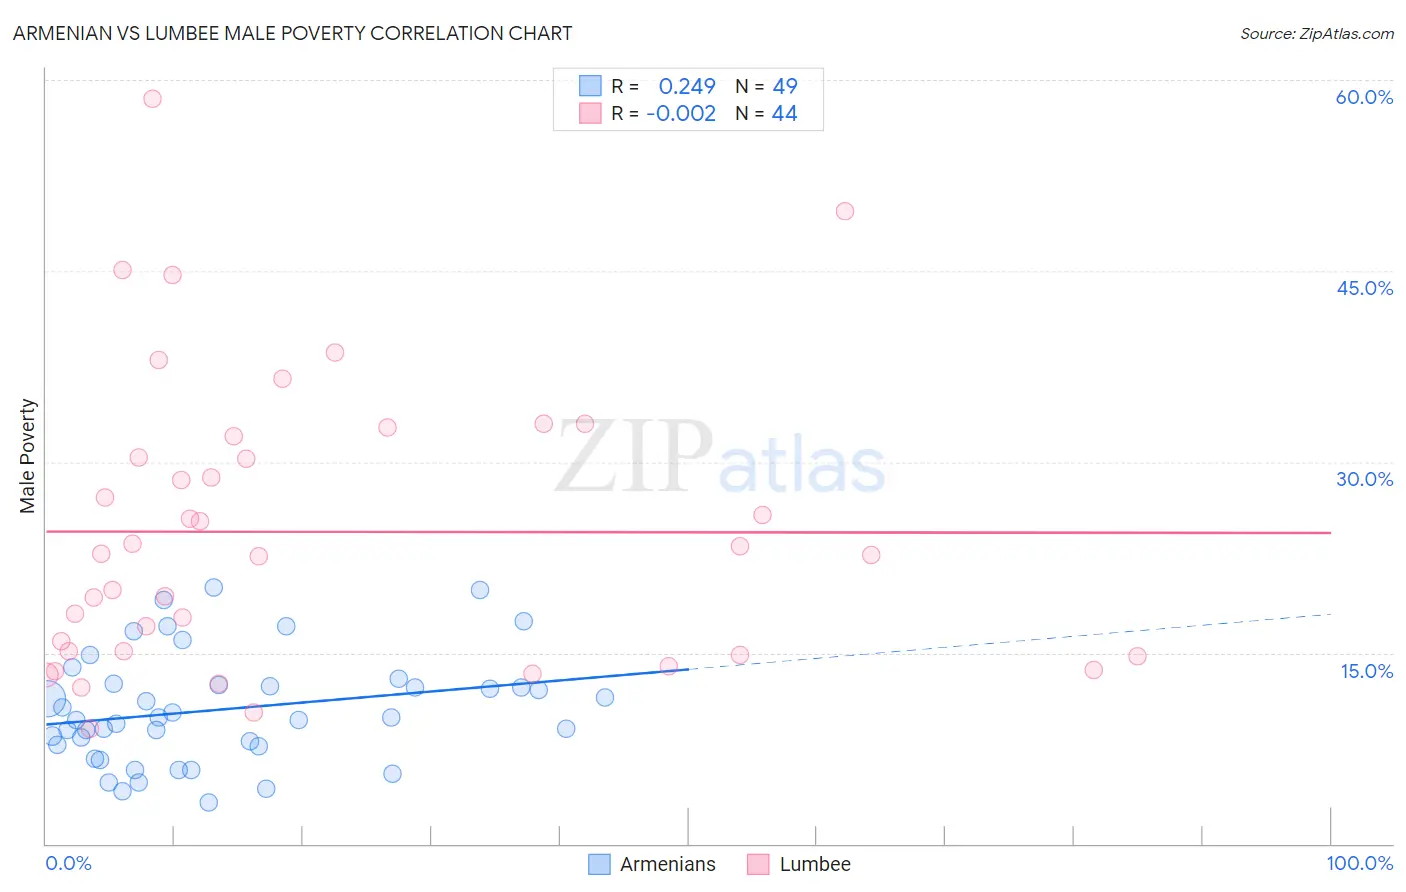
Armenian vs Lumbee Male Poverty Correlation Chart
The statistical analysis conducted on geographies consisting of 310,692,153 people shows a weak positive correlation between the proportion of Armenians and poverty level among males in the United States with a correlation coefficient (R) of 0.249 and weighted average of 11.0%. Similarly, the statistical analysis conducted on geographies consisting of 92,248,821 people shows no correlation between the proportion of Lumbee and poverty level among males in the United States with a correlation coefficient (R) of -0.002 and weighted average of 20.2%, a difference of 84.0%.
Male Poverty Correlation Summary
| Measurement | Armenian | Lumbee |
| Minimum | 3.2% | 9.1% |
| Maximum | 20.1% | 58.5% |
| Range | 16.9% | 49.5% |
| Mean | 10.6% | 24.5% |
| Median | 9.9% | 22.7% |
| Interquartile 25% (IQ1) | 7.7% | 15.0% |
| Interquartile 75% (IQ3) | 12.5% | 31.2% |
| Interquartile Range (IQR) | 4.8% | 16.2% |
| Standard Deviation (Sample) | 4.3% | 11.3% |
| Standard Deviation (Population) | 4.2% | 11.2% |
Similar Demographics by Male Poverty
Demographics Similar to Armenians by Male Poverty
In terms of male poverty, the demographic groups most similar to Armenians are Immigrants from Venezuela (11.0%, a difference of 0.020%), Icelander (11.0%, a difference of 0.050%), Guamanian/Chamorro (11.0%, a difference of 0.050%), Venezuelan (11.0%, a difference of 0.080%), and Immigrants from Nepal (11.0%, a difference of 0.080%).
| Demographics | Rating | Rank | Male Poverty |
| Immigrants | France | 75.8 /100 | #141 | Good 10.9% |
| Basques | 74.6 /100 | #142 | Good 10.9% |
| Afghans | 71.9 /100 | #143 | Good 10.9% |
| Samoans | 71.8 /100 | #144 | Good 10.9% |
| Immigrants | Germany | 71.6 /100 | #145 | Good 10.9% |
| Syrians | 71.4 /100 | #146 | Good 10.9% |
| Icelanders | 68.5 /100 | #147 | Good 11.0% |
| Armenians | 68.0 /100 | #148 | Good 11.0% |
| Immigrants | Venezuela | 67.9 /100 | #149 | Good 11.0% |
| Guamanians/Chamorros | 67.6 /100 | #150 | Good 11.0% |
| Venezuelans | 67.4 /100 | #151 | Good 11.0% |
| Immigrants | Nepal | 67.3 /100 | #152 | Good 11.0% |
| Immigrants | Bosnia and Herzegovina | 65.2 /100 | #153 | Good 11.0% |
| Immigrants | Kazakhstan | 64.8 /100 | #154 | Good 11.0% |
| Immigrants | Malaysia | 64.7 /100 | #155 | Good 11.0% |
Demographics Similar to Lumbee by Male Poverty
In terms of male poverty, the demographic groups most similar to Lumbee are Immigrants from Yemen (20.1%, a difference of 0.30%), Pima (20.4%, a difference of 0.78%), Yup'ik (20.4%, a difference of 0.88%), Hopi (20.8%, a difference of 3.0%), and Yuman (19.5%, a difference of 3.4%).
| Demographics | Rating | Rank | Male Poverty |
| Natives/Alaskans | 0.0 /100 | #333 | Tragic 16.9% |
| Cheyenne | 0.0 /100 | #334 | Tragic 17.6% |
| Apache | 0.0 /100 | #335 | Tragic 17.7% |
| Pueblo | 0.0 /100 | #336 | Tragic 18.5% |
| Sioux | 0.0 /100 | #337 | Tragic 18.7% |
| Crow | 0.0 /100 | #338 | Tragic 19.1% |
| Yuman | 0.0 /100 | #339 | Tragic 19.5% |
| Immigrants | Yemen | 0.0 /100 | #340 | Tragic 20.1% |
| Lumbee | 0.0 /100 | #341 | Tragic 20.2% |
| Pima | 0.0 /100 | #342 | Tragic 20.4% |
| Yup'ik | 0.0 /100 | #343 | Tragic 20.4% |
| Hopi | 0.0 /100 | #344 | Tragic 20.8% |
| Puerto Ricans | 0.0 /100 | #345 | Tragic 22.0% |
| Navajo | 0.0 /100 | #346 | Tragic 22.3% |
| Tohono O'odham | 0.0 /100 | #347 | Tragic 22.9% |