Argentinean vs Slavic Receiving Food Stamps
COMPARE
Argentinean
Slavic
Receiving Food Stamps
Receiving Food Stamps Comparison
Argentineans
Slavs
10.8%
RECEIVING FOOD STAMPS
90.2/ 100
METRIC RATING
135th/ 347
METRIC RANK
10.6%
RECEIVING FOOD STAMPS
93.8/ 100
METRIC RATING
121st/ 347
METRIC RANK
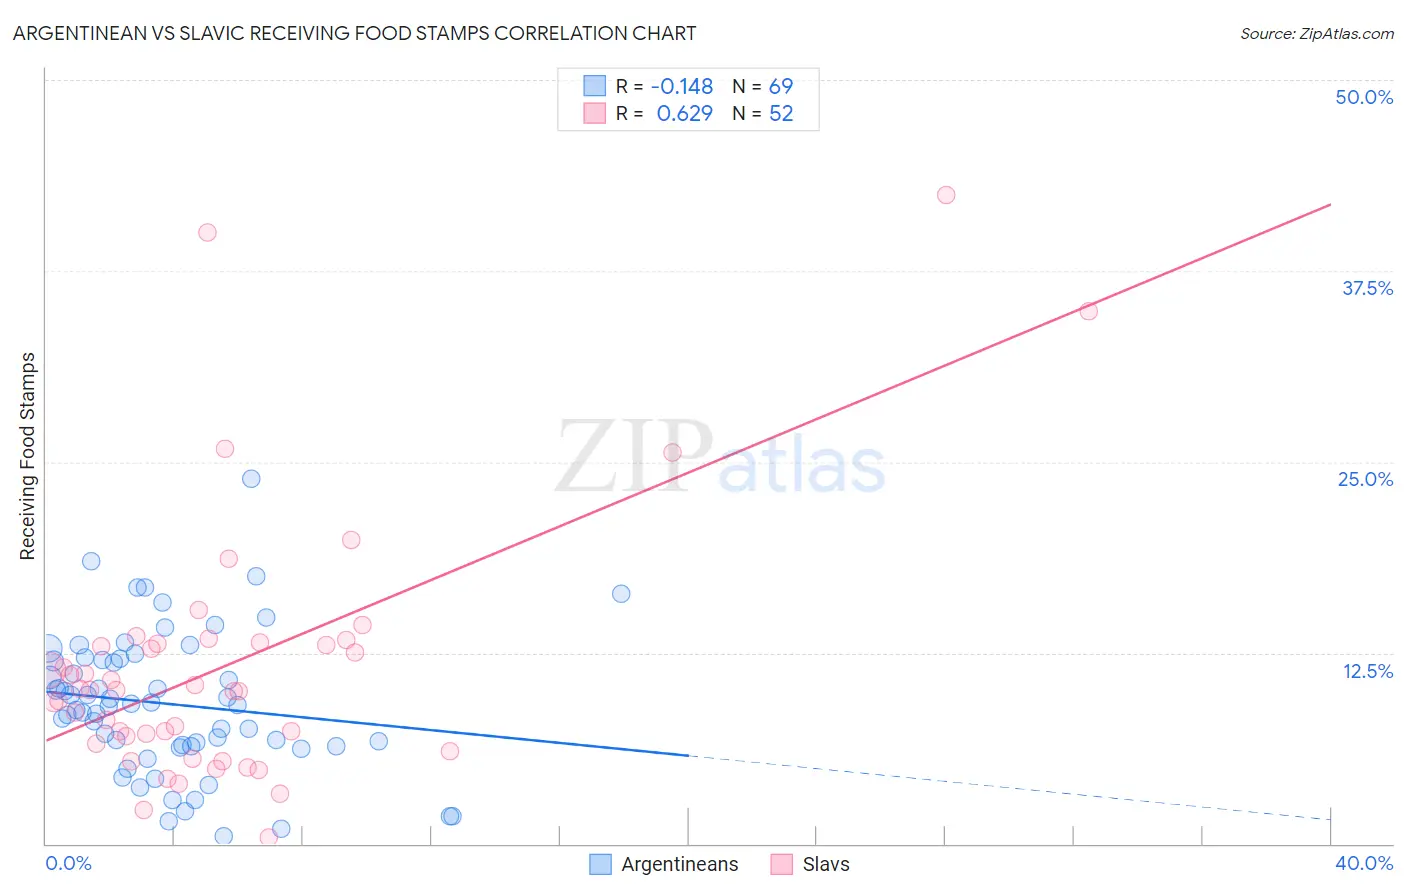
Argentinean vs Slavic Receiving Food Stamps Correlation Chart
The statistical analysis conducted on geographies consisting of 296,410,032 people shows a poor negative correlation between the proportion of Argentineans and percentage of population receiving government assistance and/or food stamps in the United States with a correlation coefficient (R) of -0.148 and weighted average of 10.8%. Similarly, the statistical analysis conducted on geographies consisting of 270,346,460 people shows a significant positive correlation between the proportion of Slavs and percentage of population receiving government assistance and/or food stamps in the United States with a correlation coefficient (R) of 0.629 and weighted average of 10.6%, a difference of 1.9%.
Receiving Food Stamps Correlation Summary
| Measurement | Argentinean | Slavic |
| Minimum | 0.50% | 0.40% |
| Maximum | 23.9% | 42.5% |
| Range | 23.4% | 42.1% |
| Mean | 9.1% | 11.7% |
| Median | 9.1% | 10.1% |
| Interquartile 25% (IQ1) | 6.4% | 6.8% |
| Interquartile 75% (IQ3) | 12.1% | 13.2% |
| Interquartile Range (IQR) | 5.7% | 6.4% |
| Standard Deviation (Sample) | 4.6% | 8.5% |
| Standard Deviation (Population) | 4.6% | 8.5% |
Demographics Similar to Argentineans and Slavs by Receiving Food Stamps
In terms of receiving food stamps, the demographic groups most similar to Argentineans are Immigrants from Brazil (10.8%, a difference of 0.020%), Slovak (10.8%, a difference of 0.17%), Immigrants from Eastern Europe (10.8%, a difference of 0.19%), Immigrants from Russia (10.8%, a difference of 0.32%), and Immigrants from Moldova (10.9%, a difference of 0.70%). Similarly, the demographic groups most similar to Slavs are Immigrants from Poland (10.6%, a difference of 0.030%), Ethiopian (10.6%, a difference of 0.030%), Sri Lankan (10.6%, a difference of 0.070%), Assyrian/Chaldean/Syriac (10.6%, a difference of 0.20%), and Immigrants from Philippines (10.7%, a difference of 0.33%).
| Demographics | Rating | Rank | Receiving Food Stamps |
| Assyrians/Chaldeans/Syriacs | 94.1 /100 | #118 | Exceptional 10.6% |
| Immigrants | Poland | 93.9 /100 | #119 | Exceptional 10.6% |
| Ethiopians | 93.9 /100 | #120 | Exceptional 10.6% |
| Slavs | 93.8 /100 | #121 | Exceptional 10.6% |
| Sri Lankans | 93.7 /100 | #122 | Exceptional 10.6% |
| Immigrants | Philippines | 93.3 /100 | #123 | Exceptional 10.7% |
| Paraguayans | 93.0 /100 | #124 | Exceptional 10.7% |
| Ukrainians | 92.8 /100 | #125 | Exceptional 10.7% |
| Afghans | 92.6 /100 | #126 | Exceptional 10.7% |
| Immigrants | Ethiopia | 92.6 /100 | #127 | Exceptional 10.7% |
| Immigrants | Jordan | 92.5 /100 | #128 | Exceptional 10.7% |
| Yugoslavians | 92.5 /100 | #129 | Exceptional 10.7% |
| Israelis | 92.4 /100 | #130 | Exceptional 10.7% |
| French | 92.3 /100 | #131 | Exceptional 10.7% |
| Immigrants | Germany | 92.0 /100 | #132 | Exceptional 10.7% |
| Immigrants | Russia | 90.9 /100 | #133 | Exceptional 10.8% |
| Immigrants | Brazil | 90.3 /100 | #134 | Exceptional 10.8% |
| Argentineans | 90.2 /100 | #135 | Exceptional 10.8% |
| Slovaks | 89.8 /100 | #136 | Excellent 10.8% |
| Immigrants | Eastern Europe | 89.8 /100 | #137 | Excellent 10.8% |
| Immigrants | Moldova | 88.5 /100 | #138 | Excellent 10.9% |