Argentinean vs Mexican American Indian Seniors Poverty Over the Age of 65
COMPARE
Argentinean
Mexican American Indian
Seniors Poverty Over the Age of 65
Seniors Poverty Over the Age of 65 Comparison
Argentineans
Mexican American Indians
11.7%
SENIORS POVERTY OVER THE AGE OF 65
4.1/ 100
METRIC RATING
221st/ 347
METRIC RANK
12.4%
SENIORS POVERTY OVER THE AGE OF 65
0.3/ 100
METRIC RATING
255th/ 347
METRIC RANK
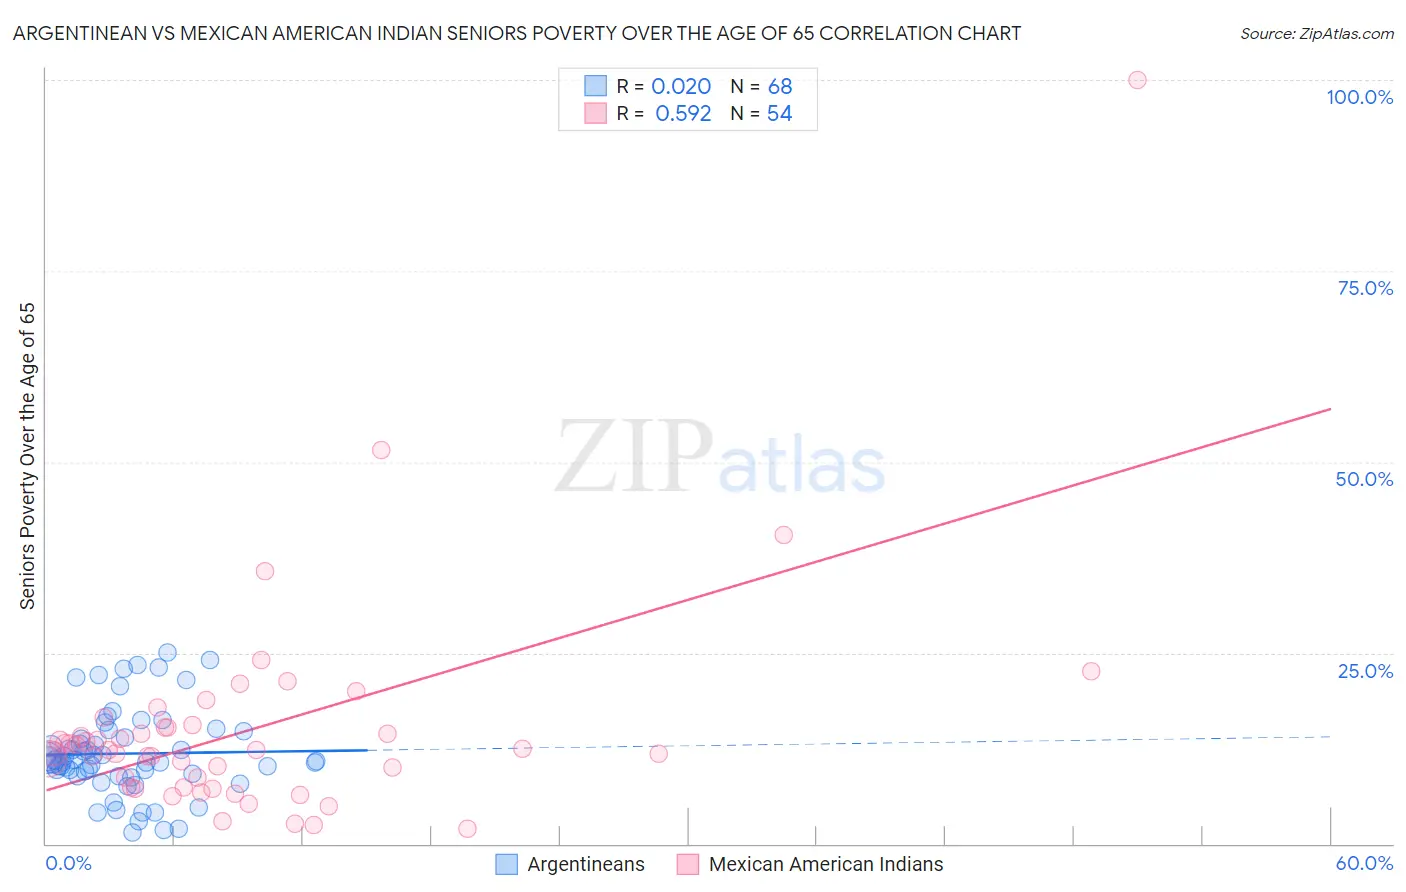
Argentinean vs Mexican American Indian Seniors Poverty Over the Age of 65 Correlation Chart
The statistical analysis conducted on geographies consisting of 296,547,571 people shows no correlation between the proportion of Argentineans and poverty level among seniors over the age of 65 in the United States with a correlation coefficient (R) of 0.020 and weighted average of 11.7%. Similarly, the statistical analysis conducted on geographies consisting of 316,752,558 people shows a substantial positive correlation between the proportion of Mexican American Indians and poverty level among seniors over the age of 65 in the United States with a correlation coefficient (R) of 0.592 and weighted average of 12.4%, a difference of 5.8%.
Seniors Poverty Over the Age of 65 Correlation Summary
| Measurement | Argentinean | Mexican American Indian |
| Minimum | 1.5% | 2.0% |
| Maximum | 25.0% | 100.0% |
| Range | 23.5% | 98.0% |
| Mean | 11.8% | 15.1% |
| Median | 10.8% | 12.3% |
| Interquartile 25% (IQ1) | 9.0% | 7.4% |
| Interquartile 75% (IQ3) | 14.3% | 15.3% |
| Interquartile Range (IQR) | 5.3% | 7.8% |
| Standard Deviation (Sample) | 5.6% | 14.8% |
| Standard Deviation (Population) | 5.5% | 14.6% |
Similar Demographics by Seniors Poverty Over the Age of 65
Demographics Similar to Argentineans by Seniors Poverty Over the Age of 65
In terms of seniors poverty over the age of 65, the demographic groups most similar to Argentineans are Peruvian (11.7%, a difference of 0.070%), Immigrants from Chile (11.7%, a difference of 0.12%), Immigrants from Congo (11.7%, a difference of 0.15%), Immigrants from Nigeria (11.7%, a difference of 0.39%), and Immigrants from Belarus (11.8%, a difference of 0.49%).
| Demographics | Rating | Rank | Seniors Poverty Over the Age of 65 |
| Immigrants | Russia | 8.8 /100 | #214 | Tragic 11.5% |
| French American Indians | 8.7 /100 | #215 | Tragic 11.5% |
| Immigrants | Morocco | 6.8 /100 | #216 | Tragic 11.6% |
| Immigrants | Africa | 6.4 /100 | #217 | Tragic 11.6% |
| Immigrants | Ukraine | 5.7 /100 | #218 | Tragic 11.6% |
| Arapaho | 5.2 /100 | #219 | Tragic 11.6% |
| Peruvians | 4.2 /100 | #220 | Tragic 11.7% |
| Argentineans | 4.1 /100 | #221 | Tragic 11.7% |
| Immigrants | Chile | 3.9 /100 | #222 | Tragic 11.7% |
| Immigrants | Congo | 3.8 /100 | #223 | Tragic 11.7% |
| Immigrants | Nigeria | 3.4 /100 | #224 | Tragic 11.7% |
| Immigrants | Belarus | 3.2 /100 | #225 | Tragic 11.8% |
| Liberians | 3.2 /100 | #226 | Tragic 11.8% |
| Nigerians | 3.2 /100 | #227 | Tragic 11.8% |
| Immigrants | Costa Rica | 2.7 /100 | #228 | Tragic 11.8% |
Demographics Similar to Mexican American Indians by Seniors Poverty Over the Age of 65
In terms of seniors poverty over the age of 65, the demographic groups most similar to Mexican American Indians are Immigrants from Cambodia (12.4%, a difference of 0.13%), Immigrants from Panama (12.4%, a difference of 0.23%), Immigrants (12.4%, a difference of 0.24%), Shoshone (12.3%, a difference of 0.34%), and Armenian (12.3%, a difference of 0.48%).
| Demographics | Rating | Rank | Seniors Poverty Over the Age of 65 |
| Spanish Americans | 0.6 /100 | #248 | Tragic 12.2% |
| Ute | 0.6 /100 | #249 | Tragic 12.2% |
| Immigrants | Liberia | 0.5 /100 | #250 | Tragic 12.2% |
| Somalis | 0.3 /100 | #251 | Tragic 12.3% |
| Armenians | 0.3 /100 | #252 | Tragic 12.3% |
| Shoshone | 0.3 /100 | #253 | Tragic 12.3% |
| Immigrants | Cambodia | 0.3 /100 | #254 | Tragic 12.4% |
| Mexican American Indians | 0.3 /100 | #255 | Tragic 12.4% |
| Immigrants | Panama | 0.2 /100 | #256 | Tragic 12.4% |
| Immigrants | Immigrants | 0.2 /100 | #257 | Tragic 12.4% |
| Dutch West Indians | 0.2 /100 | #258 | Tragic 12.4% |
| Ghanaians | 0.2 /100 | #259 | Tragic 12.4% |
| South Americans | 0.2 /100 | #260 | Tragic 12.5% |
| Colombians | 0.2 /100 | #261 | Tragic 12.5% |
| Venezuelans | 0.1 /100 | #262 | Tragic 12.5% |