Arapaho vs Romanian Receiving Food Stamps

COMPARE

Arapaho
Race
Ancestry
AfghanAfricanAlaska NativeAlaskan AthabascanAlbanianAleutAlsatianAmericanApacheArabArapahoArgentineanArmenianAssyrian/Chaldean/SyriacAustralianAustrianBahamianBangladeshiBarbadianBasqueBelgianBelizeanBermudanBhutaneseBlackfeetBolivianBrazilianBritishBritish West IndianBulgarianBurmeseCajunCambodianCanadianCape VerdeanCarpatho RusynCelticCentral AmericanCentral American IndianCherokeeCheyenneChickasawChileanChineseChippewaChoctawColombianColvilleComancheCosta RicanCreeCreekCroatianCrowCubanCypriotCzechCzechoslovakianDanishDelawareDominicanDutchDutch West IndianEastern EuropeanEcuadorianEgyptianEnglishEstonianEthiopianEuropeanFijianFilipinoFinnishFrenchFrench American IndianFrench CanadianGermanGerman RussianGhanaianGreekGuamanian/ChamorroGuatemalanGuyaneseHaitianHmongHonduranHopiHoumaHungarianIcelanderIndian (Asian)IndonesianInupiatIranianIraqiIrishIroquoisIsraeliItalianJamaicanJapaneseJordanianKenyanKiowaKoreanLaotianLatvianLebaneseLiberianLithuanianLumbeeLuxembourgerMacedonianMalaysianMalteseMarshalleseMenomineeMexicanMexican American IndianMongolianMoroccanNative HawaiianNavajoNepaleseNew ZealanderNicaraguanNigerianNorthern EuropeanNorwegianOkinawanOsageOttawaPaiutePakistaniPalestinianPanamanianParaguayanPennsylvania GermanPeruvianPimaPolishPortuguesePotawatomiPuebloPuerto RicanPuget Sound SalishRussianSalvadoranSamoanScandinavianScotch-IrishScottishSeminoleSenegaleseSerbianShoshoneSierra LeoneanSiouxSlavicSlovakSloveneSomaliSouth AfricanSouth AmericanSouth American IndianSoviet UnionSpaniardSpanishSpanish AmericanSpanish American IndianSri LankanSubsaharan AfricanSudaneseSwedishSwissSyrianTaiwaneseThaiTlingit-HaidaTohono O'OdhamTonganTrinidadian and TobagonianTsimshianTurkishU.S. Virgin IslanderUgandanUkrainianUruguayanUteVenezuelanVietnameseWelshWest IndianYakamaYaquiYugoslavianYumanYup'ikZimbabwean
Immigration
NonimmigrantsImmigrantsAfghanistanAfricaAlbaniaArgentinaArmeniaAsiaAustraliaAustriaBahamasBangladeshBarbadosBelarusBelgiumBelizeBoliviaBosnia and HerzegovinaBrazilBulgariaBurma/MyanmarCabo VerdeCambodiaCameroonCanadaCaribbeanCentral AmericaChileChinaColombiaCongoCosta RicaCroatiaCubaCzechoslovakiaDenmarkDominicaDominican RepublicEastern AfricaEastern AsiaEastern EuropeEcuadorEgyptEl SalvadorEnglandEritreaEthiopiaEuropeFijiFranceGermanyGhanaGreeceGrenadaGuatemalaGuyanaHaitiHondurasHong KongHungaryIndiaIndonesiaIranIraqIrelandIsraelItalyJamaicaJapanJordanKazakhstanKenyaKoreaKuwaitLaosLatin AmericaLatviaLebanonLiberiaLithuaniaMalaysiaMexicoMicronesiaMiddle AfricaMoldovaMoroccoNepalNetherlandsNicaraguaNigeriaNorth AmericaNorth MacedoniaNorthern AfricaNorthern EuropeNorwayOceaniaPakistanPanamaPeruPhilippinesPolandPortugalRomaniaRussiaSaudi ArabiaScotlandSenegalSerbiaSierra LeoneSingaporeSomaliaSouth AfricaSouth AmericaSouth Central AsiaSouth Eastern AsiaSouthern EuropeSpainSri LankaSt. Vincent and the GrenadinesSudanSwedenSwitzerlandSyriaTaiwanThailandTrinidad and TobagoTurkeyUgandaUkraineUruguayUzbekistanVenezuelaVietnamWest IndiesWestern AfricaWestern AsiaWestern EuropeYemenZaireZimbabweAzores
Romanian
Race
Ancestry
AfghanAfricanAlaska NativeAlaskan AthabascanAlbanianAleutAlsatianAmericanApacheArabArgentineanArmenianAssyrian/Chaldean/SyriacAustralianAustrianBahamianBangladeshiBarbadianBasqueBelgianBelizeanBermudanBhutaneseBlackfeetBolivianBrazilianBritishBritish West IndianBulgarianBurmeseCajunCambodianCanadianCape VerdeanCarpatho RusynCelticCentral AmericanCentral American IndianCherokeeCheyenneChickasawChileanChineseChippewaChoctawColombianColvilleComancheCosta RicanCreeCreekCroatianCrowCubanCypriotCzechCzechoslovakianDanishDelawareDominicanDutchDutch West IndianEastern EuropeanEcuadorianEgyptianEnglishEstonianEthiopianEuropeanFijianFilipinoFinnishFrenchFrench American IndianFrench CanadianGermanGerman RussianGhanaianGreekGuamanian/ChamorroGuatemalanGuyaneseHaitianHmongHonduranHopiHoumaHungarianIcelanderIndian (Asian)IndonesianInupiatIranianIraqiIrishIroquoisIsraeliItalianJamaicanJapaneseJordanianKenyanKiowaKoreanLaotianLatvianLebaneseLiberianLithuanianLumbeeLuxembourgerMacedonianMalaysianMalteseMarshalleseMenomineeMexicanMexican American IndianMongolianMoroccanNative HawaiianNavajoNepaleseNew ZealanderNicaraguanNigerianNorthern EuropeanNorwegianOkinawanOsageOttawaPaiutePakistaniPalestinianPanamanianParaguayanPennsylvania GermanPeruvianPimaPolishPortuguesePotawatomiPuebloPuerto RicanPuget Sound SalishRomanianRussianSalvadoranSamoanScandinavianScotch-IrishScottishSeminoleSenegaleseSerbianShoshoneSierra LeoneanSiouxSlavicSlovakSloveneSomaliSouth AfricanSouth AmericanSouth American IndianSoviet UnionSpaniardSpanishSpanish AmericanSpanish American IndianSri LankanSubsaharan AfricanSudaneseSwedishSwissSyrianTaiwaneseThaiTlingit-HaidaTohono O'OdhamTonganTrinidadian and TobagonianTsimshianTurkishU.S. Virgin IslanderUgandanUkrainianUruguayanUteVenezuelanVietnameseWelshWest IndianYakamaYaquiYugoslavianYumanYup'ikZimbabwean
Immigration
NonimmigrantsImmigrantsAfghanistanAfricaAlbaniaArgentinaArmeniaAsiaAustraliaAustriaBahamasBangladeshBarbadosBelarusBelgiumBelizeBoliviaBosnia and HerzegovinaBrazilBulgariaBurma/MyanmarCabo VerdeCambodiaCameroonCanadaCaribbeanCentral AmericaChileChinaColombiaCongoCosta RicaCroatiaCubaCzechoslovakiaDenmarkDominicaDominican RepublicEastern AfricaEastern AsiaEastern EuropeEcuadorEgyptEl SalvadorEnglandEritreaEthiopiaEuropeFijiFranceGermanyGhanaGreeceGrenadaGuatemalaGuyanaHaitiHondurasHong KongHungaryIndiaIndonesiaIranIraqIrelandIsraelItalyJamaicaJapanJordanKazakhstanKenyaKoreaKuwaitLaosLatin AmericaLatviaLebanonLiberiaLithuaniaMalaysiaMexicoMicronesiaMiddle AfricaMoldovaMoroccoNepalNetherlandsNicaraguaNigeriaNorth AmericaNorth MacedoniaNorthern AfricaNorthern EuropeNorwayOceaniaPakistanPanamaPeruPhilippinesPolandPortugalRomaniaRussiaSaudi ArabiaScotlandSenegalSerbiaSierra LeoneSingaporeSomaliaSouth AfricaSouth AmericaSouth Central AsiaSouth Eastern AsiaSouthern EuropeSpainSri LankaSt. Vincent and the GrenadinesSudanSwedenSwitzerlandSyriaTaiwanThailandTrinidad and TobagoTurkeyUgandaUkraineUruguayUzbekistanVenezuelaVietnamWest IndiesWestern AfricaWestern AsiaWestern EuropeYemenZaireZimbabweAzores
Receiving Food Stamps
Income
Poverty
Unemployment
Labor Participation
Family Structure
Vehicle Availability
Education Level
Disability

Receiving Food Stamps Comparison

Arapaho

Romanians

Tragic
Exceptional
14.1%
RECEIVING FOOD STAMPS
0.3/ 100
METRIC RATING
257th/ 347
METRIC RANK
10.4%
RECEIVING FOOD STAMPS
95.8/ 100
METRIC RATING
111th/ 347
METRIC RANK

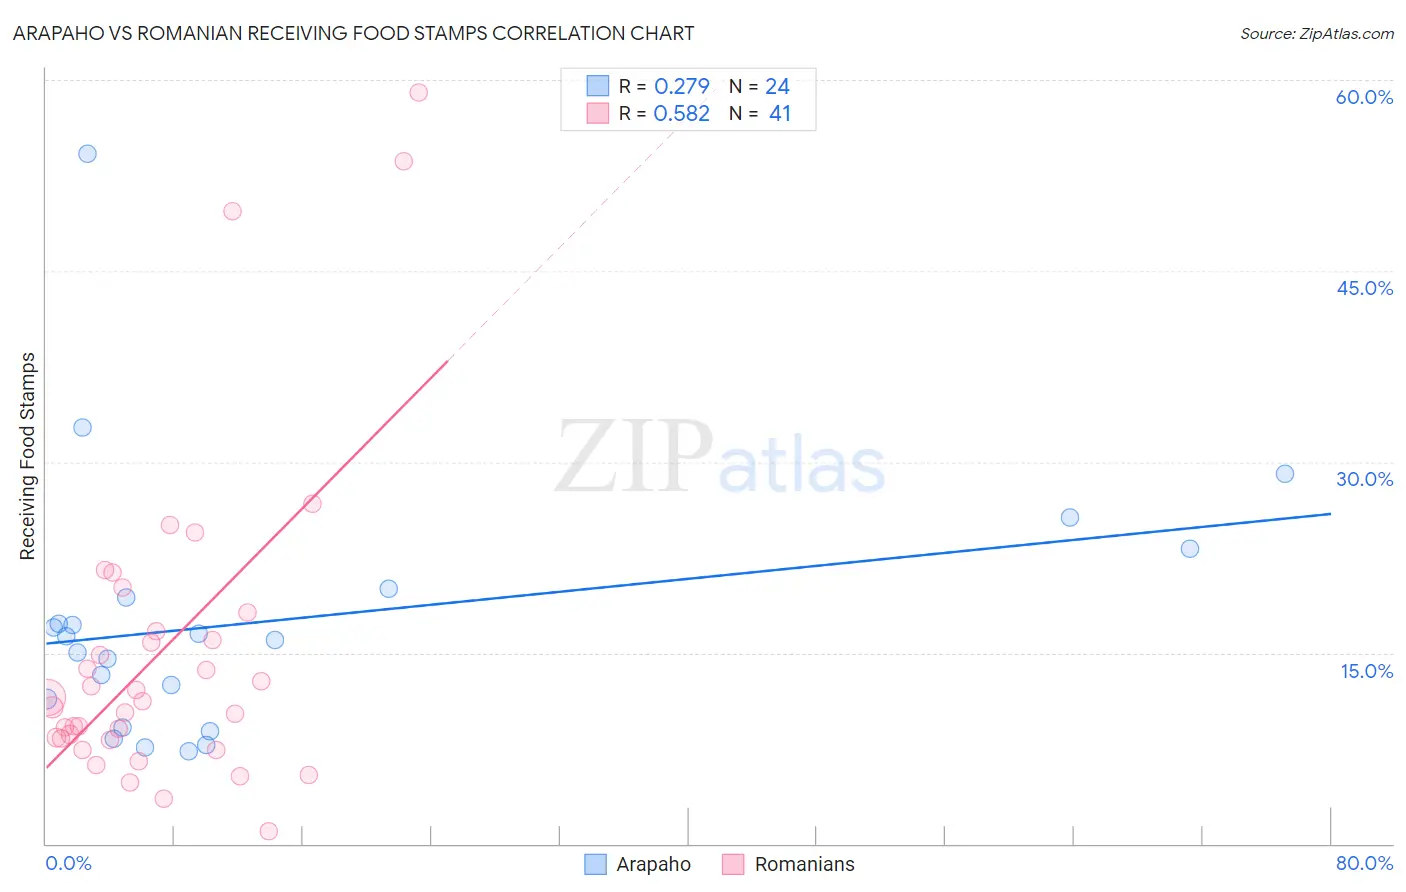
Arapaho vs Romanian Receiving Food Stamps Correlation Chart

The statistical analysis conducted on geographies consisting of 29,772,376 people shows a weak positive correlation between the proportion of Arapaho and percentage of population receiving government assistance and/or food stamps in the United States with a correlation coefficient (R) of 0.279 and weighted average of 14.1%. Similarly, the statistical analysis conducted on geographies consisting of 376,766,958 people shows a substantial positive correlation between the proportion of Romanians and percentage of population receiving government assistance and/or food stamps in the United States with a correlation coefficient (R) of 0.582 and weighted average of 10.4%, a difference of 35.0%.
Arapaho vs Romanian Receiving Food Stamps

Receiving Food Stamps Correlation Summary

MeasurementArapahoRomanian
Minimum7.3%1.0%
Maximum54.2%59.0%
Range46.9%58.0%
Mean17.5%15.1%
Median16.1%11.1%
Interquartile 25% (IQ1)10.2%8.2%
Interquartile 75% (IQ3)19.7%17.4%
Interquartile Range (IQR)9.4%9.2%
Standard Deviation (Sample)10.3%12.6%
Standard Deviation (Population)10.1%12.5%

Similar Demographics by Receiving Food Stamps

Demographics Similar to Arapaho by Receiving Food Stamps

In terms of receiving food stamps, the demographic groups most similar to Arapaho are Immigrants from Ghana (14.1%, a difference of 0.080%), Japanese (14.1%, a difference of 0.10%), Subsaharan African (14.1%, a difference of 0.12%), Marshallese (14.1%, a difference of 0.14%), and Creek (14.1%, a difference of 0.20%).
DemographicsRating | RankReceiving Food Stamps
Immigrants | Cambodia
0.5
/100
|
#250
Tragic
13.9%
Yaqui
0.5
/100
|
#251
Tragic
13.9%
Ghanaians
0.5
/100
|
#252
Tragic
14.0%
Spanish Americans
0.4
/100
|
#253
Tragic
14.0%
Marshallese
0.3
/100
|
#254
Tragic
14.1%
Sub-Saharan Africans
0.3
/100
|
#255
Tragic
14.1%
Japanese
0.3
/100
|
#256
Tragic
14.1%
Arapaho
0.3
/100
|
#257
Tragic
14.1%
Immigrants | Ghana
0.3
/100
|
#258
Tragic
14.1%
Creek
0.3
/100
|
#259
Tragic
14.1%
Central Americans
0.3
/100
|
#260
Tragic
14.1%
Immigrants | Congo
0.3
/100
|
#261
Tragic
14.1%
Paiute
0.2
/100
|
#262
Tragic
14.3%
Immigrants | Portugal
0.2
/100
|
#263
Tragic
14.3%
Immigrants | Uzbekistan
0.2
/100
|
#264
Tragic
14.3%

Demographics Similar to Romanians by Receiving Food Stamps

In terms of receiving food stamps, the demographic groups most similar to Romanians are Mongolian (10.5%, a difference of 0.010%), Pakistani (10.4%, a difference of 0.10%), Immigrants from Pakistan (10.4%, a difference of 0.38%), Icelander (10.5%, a difference of 0.39%), and Carpatho Rusyn (10.4%, a difference of 0.43%).
DemographicsRating | RankReceiving Food Stamps
Immigrants | Hungary
96.7
/100
|
#104
Exceptional
10.3%
Immigrants | Malaysia
96.5
/100
|
#105
Exceptional
10.4%
Immigrants | Italy
96.4
/100
|
#106
Exceptional
10.4%
Koreans
96.3
/100
|
#107
Exceptional
10.4%
Carpatho Rusyns
96.2
/100
|
#108
Exceptional
10.4%
Immigrants | Pakistan
96.2
/100
|
#109
Exceptional
10.4%
Pakistanis
95.9
/100
|
#110
Exceptional
10.4%
Romanians
95.8
/100
|
#111
Exceptional
10.4%
Mongolians
95.8
/100
|
#112
Exceptional
10.5%
Icelanders
95.4
/100
|
#113
Exceptional
10.5%
Scotch-Irish
95.1
/100
|
#114
Exceptional
10.5%
Immigrants | Saudi Arabia
94.9
/100
|
#115
Exceptional
10.5%
Canadians
94.8
/100
|
#116
Exceptional
10.5%
Immigrants | Nepal
94.6
/100
|
#117
Exceptional
10.6%
Assyrians/Chaldeans/Syriacs
94.1
/100
|
#118
Exceptional
10.6%