Arapaho vs Dutch West Indian Single Father Poverty
COMPARE
Arapaho
Dutch West Indian
Single Father Poverty
Single Father Poverty Comparison
Arapaho
Dutch West Indians
24.0%
SINGLE FATHER POVERTY
0.0/ 100
METRIC RATING
338th/ 347
METRIC RANK
19.2%
SINGLE FATHER POVERTY
0.0/ 100
METRIC RATING
318th/ 347
METRIC RANK
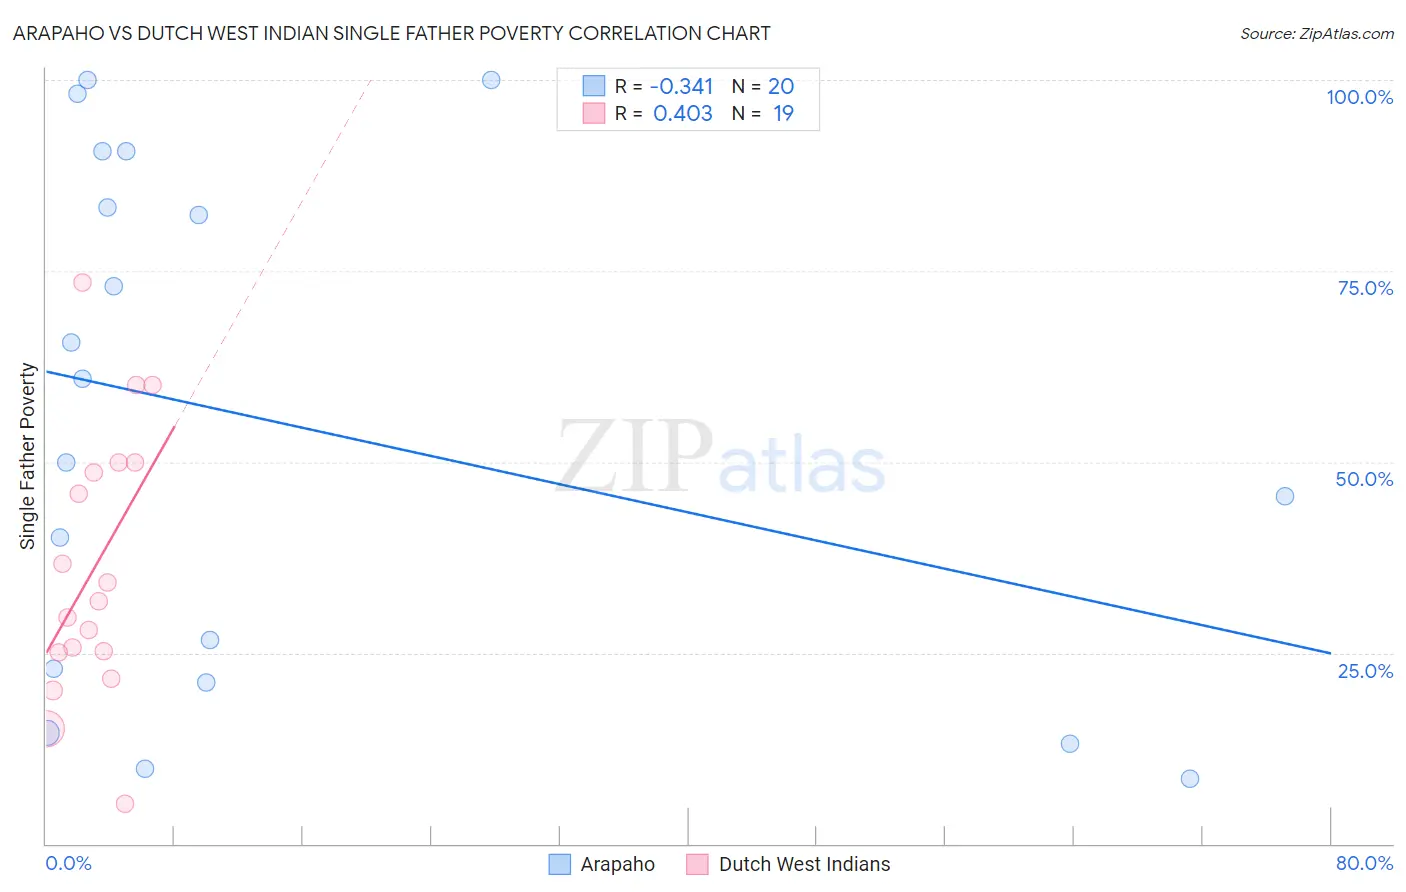
Arapaho vs Dutch West Indian Single Father Poverty Correlation Chart
The statistical analysis conducted on geographies consisting of 28,107,372 people shows a mild negative correlation between the proportion of Arapaho and poverty level among single fathers in the United States with a correlation coefficient (R) of -0.341 and weighted average of 24.0%. Similarly, the statistical analysis conducted on geographies consisting of 78,591,336 people shows a moderate positive correlation between the proportion of Dutch West Indians and poverty level among single fathers in the United States with a correlation coefficient (R) of 0.403 and weighted average of 19.2%, a difference of 24.9%.
Single Father Poverty Correlation Summary
| Measurement | Arapaho | Dutch West Indian |
| Minimum | 8.5% | 5.2% |
| Maximum | 100.0% | 73.5% |
| Range | 91.5% | 68.4% |
| Mean | 54.8% | 36.1% |
| Median | 55.4% | 31.8% |
| Interquartile 25% (IQ1) | 22.0% | 25.0% |
| Interquartile 75% (IQ3) | 87.0% | 50.0% |
| Interquartile Range (IQR) | 65.0% | 25.0% |
| Standard Deviation (Sample) | 33.6% | 17.5% |
| Standard Deviation (Population) | 32.7% | 17.1% |
Demographics Similar to Arapaho and Dutch West Indians by Single Father Poverty
In terms of single father poverty, the demographic groups most similar to Arapaho are Sioux (23.9%, a difference of 0.41%), Cajun (23.1%, a difference of 3.9%), Shoshone (22.9%, a difference of 4.6%), Kiowa (22.5%, a difference of 6.7%), and Native/Alaskan (22.4%, a difference of 7.1%). Similarly, the demographic groups most similar to Dutch West Indians are Slovak (19.3%, a difference of 0.52%), Inupiat (19.5%, a difference of 1.4%), Cherokee (19.6%, a difference of 2.3%), Creek (19.8%, a difference of 3.3%), and Pennsylvania German (20.0%, a difference of 4.3%).
| Demographics | Rating | Rank | Single Father Poverty |
| Dutch West Indians | 0.0 /100 | #318 | Tragic 19.2% |
| Slovaks | 0.0 /100 | #319 | Tragic 19.3% |
| Inupiat | 0.0 /100 | #320 | Tragic 19.5% |
| Cherokee | 0.0 /100 | #321 | Tragic 19.6% |
| Creek | 0.0 /100 | #322 | Tragic 19.8% |
| Pennsylvania Germans | 0.0 /100 | #323 | Tragic 20.0% |
| Americans | 0.0 /100 | #324 | Tragic 20.1% |
| Blacks/African Americans | 0.0 /100 | #325 | Tragic 20.4% |
| Immigrants | Yemen | 0.0 /100 | #326 | Tragic 20.6% |
| Choctaw | 0.0 /100 | #327 | Tragic 20.7% |
| Pueblo | 0.0 /100 | #328 | Tragic 21.1% |
| Colville | 0.0 /100 | #329 | Tragic 21.4% |
| Paiute | 0.0 /100 | #330 | Tragic 21.6% |
| Central American Indians | 0.0 /100 | #331 | Tragic 21.7% |
| Tohono O'odham | 0.0 /100 | #332 | Tragic 22.0% |
| Natives/Alaskans | 0.0 /100 | #333 | Tragic 22.4% |
| Kiowa | 0.0 /100 | #334 | Tragic 22.5% |
| Shoshone | 0.0 /100 | #335 | Tragic 22.9% |
| Cajuns | 0.0 /100 | #336 | Tragic 23.1% |
| Sioux | 0.0 /100 | #337 | Tragic 23.9% |
| Arapaho | 0.0 /100 | #338 | Tragic 24.0% |