American vs Albanian Female Poverty
COMPARE
American
Albanian
Female Poverty
Female Poverty Comparison
Americans
Albanians
14.6%
FEMALE POVERTY
2.8/ 100
METRIC RATING
224th/ 347
METRIC RANK
12.7%
FEMALE POVERTY
90.8/ 100
METRIC RATING
119th/ 347
METRIC RANK
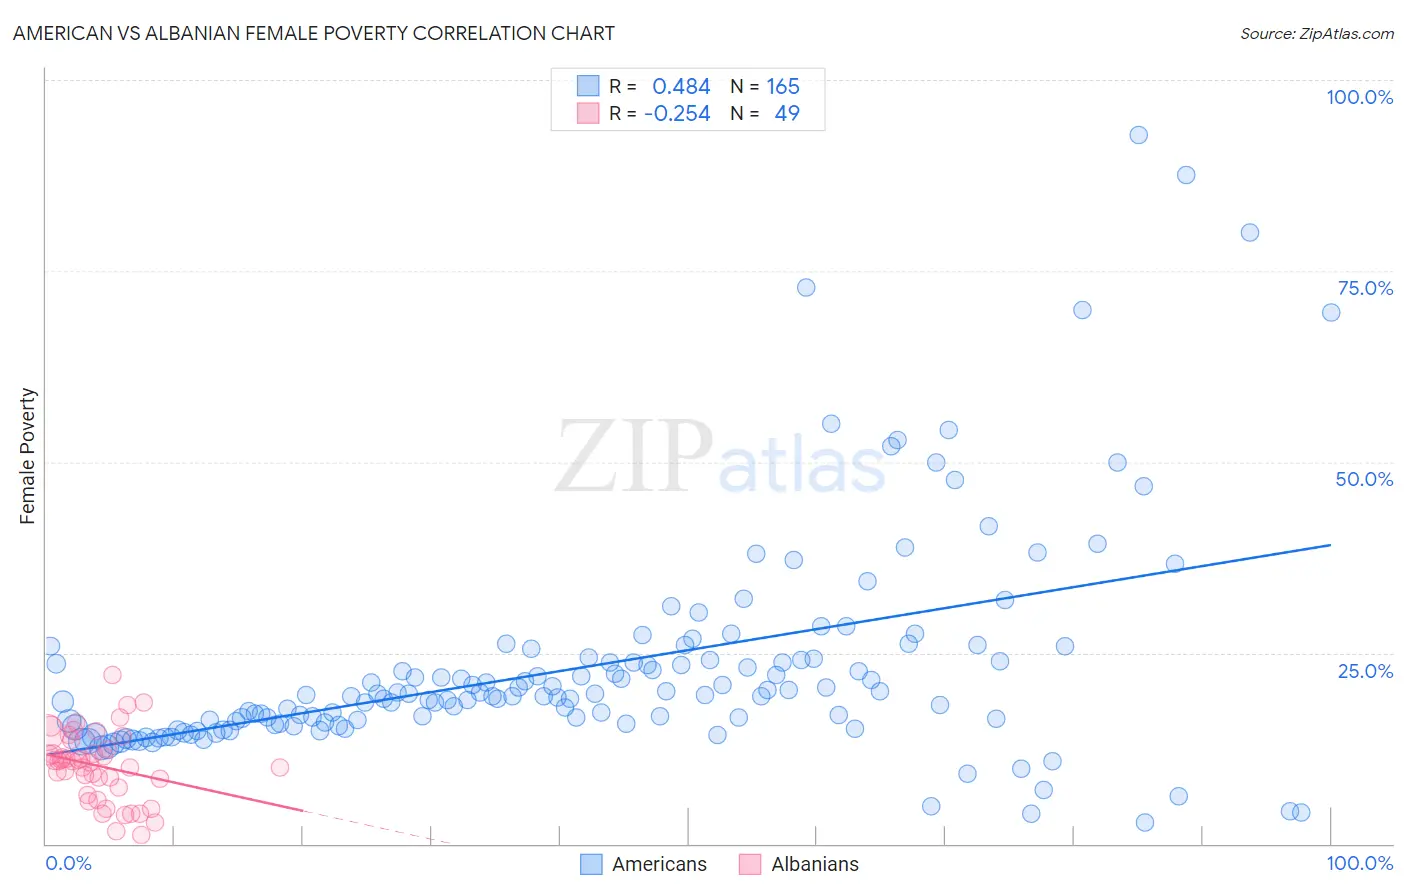
American vs Albanian Female Poverty Correlation Chart
The statistical analysis conducted on geographies consisting of 580,452,032 people shows a moderate positive correlation between the proportion of Americans and poverty level among females in the United States with a correlation coefficient (R) of 0.484 and weighted average of 14.6%. Similarly, the statistical analysis conducted on geographies consisting of 193,134,120 people shows a weak negative correlation between the proportion of Albanians and poverty level among females in the United States with a correlation coefficient (R) of -0.254 and weighted average of 12.7%, a difference of 14.9%.
Female Poverty Correlation Summary
| Measurement | American | Albanian |
| Minimum | 2.7% | 1.2% |
| Maximum | 92.7% | 22.1% |
| Range | 90.0% | 20.9% |
| Mean | 23.2% | 10.2% |
| Median | 19.4% | 10.8% |
| Interquartile 25% (IQ1) | 15.6% | 6.8% |
| Interquartile 75% (IQ3) | 24.2% | 13.0% |
| Interquartile Range (IQR) | 8.5% | 6.1% |
| Standard Deviation (Sample) | 14.5% | 4.6% |
| Standard Deviation (Population) | 14.5% | 4.5% |
Similar Demographics by Female Poverty
Demographics Similar to Americans by Female Poverty
In terms of female poverty, the demographic groups most similar to Americans are Immigrants from Micronesia (14.6%, a difference of 0.0%), Immigrants from Eritrea (14.6%, a difference of 0.33%), Immigrants from Africa (14.5%, a difference of 0.39%), Nonimmigrants (14.5%, a difference of 0.63%), and Immigrants from Nigeria (14.7%, a difference of 0.64%).
| Demographics | Rating | Rank | Female Poverty |
| Immigrants | Immigrants | 4.5 /100 | #217 | Tragic 14.4% |
| Immigrants | Uzbekistan | 4.4 /100 | #218 | Tragic 14.4% |
| Japanese | 4.1 /100 | #219 | Tragic 14.5% |
| Alsatians | 4.0 /100 | #220 | Tragic 14.5% |
| Immigrants | Cambodia | 3.7 /100 | #221 | Tragic 14.5% |
| Immigrants | Nonimmigrants | 3.7 /100 | #222 | Tragic 14.5% |
| Immigrants | Africa | 3.3 /100 | #223 | Tragic 14.5% |
| Americans | 2.8 /100 | #224 | Tragic 14.6% |
| Immigrants | Micronesia | 2.8 /100 | #225 | Tragic 14.6% |
| Immigrants | Eritrea | 2.4 /100 | #226 | Tragic 14.6% |
| Immigrants | Nigeria | 2.1 /100 | #227 | Tragic 14.7% |
| German Russians | 2.0 /100 | #228 | Tragic 14.7% |
| Ghanaians | 1.9 /100 | #229 | Tragic 14.7% |
| Alaska Natives | 1.8 /100 | #230 | Tragic 14.7% |
| Nigerians | 1.7 /100 | #231 | Tragic 14.8% |
Demographics Similar to Albanians by Female Poverty
In terms of female poverty, the demographic groups most similar to Albanians are Sri Lankan (12.7%, a difference of 0.010%), Immigrants from Southern Europe (12.7%, a difference of 0.030%), New Zealander (12.7%, a difference of 0.060%), Immigrants from Russia (12.7%, a difference of 0.10%), and Immigrants from Hungary (12.7%, a difference of 0.16%).
| Demographics | Rating | Rank | Female Poverty |
| Immigrants | Israel | 92.0 /100 | #112 | Exceptional 12.6% |
| Canadians | 92.0 /100 | #113 | Exceptional 12.7% |
| Welsh | 91.6 /100 | #114 | Exceptional 12.7% |
| Puget Sound Salish | 91.5 /100 | #115 | Exceptional 12.7% |
| Immigrants | Russia | 91.2 /100 | #116 | Exceptional 12.7% |
| Immigrants | Southern Europe | 90.9 /100 | #117 | Exceptional 12.7% |
| Sri Lankans | 90.9 /100 | #118 | Exceptional 12.7% |
| Albanians | 90.8 /100 | #119 | Exceptional 12.7% |
| New Zealanders | 90.6 /100 | #120 | Exceptional 12.7% |
| Immigrants | Hungary | 90.3 /100 | #121 | Exceptional 12.7% |
| French Canadians | 90.2 /100 | #122 | Exceptional 12.7% |
| Immigrants | South Eastern Asia | 89.9 /100 | #123 | Excellent 12.7% |
| Immigrants | Norway | 89.3 /100 | #124 | Excellent 12.8% |
| Argentineans | 89.1 /100 | #125 | Excellent 12.8% |
| Immigrants | Ukraine | 88.8 /100 | #126 | Excellent 12.8% |