Alsatian vs Welsh Child Poverty Under the Age of 16
COMPARE
Alsatian
Welsh
Child Poverty Under the Age of 16
Child Poverty Under the Age of 16 Comparison
Alsatians
Welsh
18.6%
CHILD POVERTY UNDER THE AGE OF 16
0.7/ 100
METRIC RATING
241st/ 347
METRIC RANK
15.3%
CHILD POVERTY UNDER THE AGE OF 16
87.2/ 100
METRIC RATING
138th/ 347
METRIC RANK
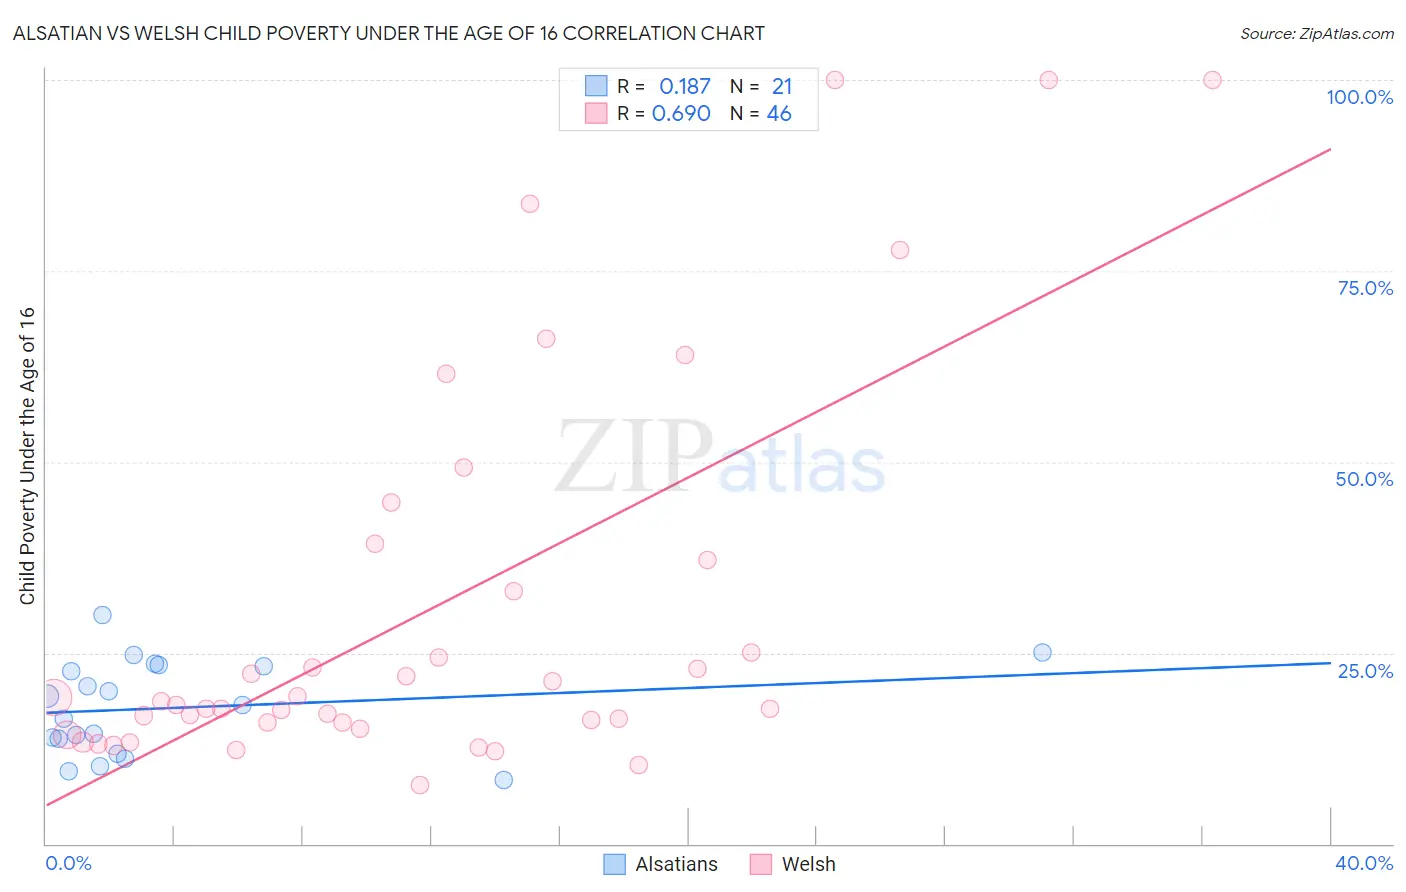
Alsatian vs Welsh Child Poverty Under the Age of 16 Correlation Chart
The statistical analysis conducted on geographies consisting of 82,344,359 people shows a poor positive correlation between the proportion of Alsatians and poverty level among children under the age of 16 in the United States with a correlation coefficient (R) of 0.187 and weighted average of 18.6%. Similarly, the statistical analysis conducted on geographies consisting of 519,115,180 people shows a significant positive correlation between the proportion of Welsh and poverty level among children under the age of 16 in the United States with a correlation coefficient (R) of 0.690 and weighted average of 15.3%, a difference of 22.1%.
Child Poverty Under the Age of 16 Correlation Summary
| Measurement | Alsatian | Welsh |
| Minimum | 8.3% | 7.7% |
| Maximum | 30.0% | 100.0% |
| Range | 21.6% | 92.3% |
| Mean | 17.8% | 30.8% |
| Median | 18.1% | 18.4% |
| Interquartile 25% (IQ1) | 12.8% | 15.9% |
| Interquartile 75% (IQ3) | 23.3% | 37.1% |
| Interquartile Range (IQR) | 10.6% | 21.2% |
| Standard Deviation (Sample) | 6.1% | 25.9% |
| Standard Deviation (Population) | 5.9% | 25.6% |
Similar Demographics by Child Poverty Under the Age of 16
Demographics Similar to Alsatians by Child Poverty Under the Age of 16
In terms of child poverty under the age of 16, the demographic groups most similar to Alsatians are Immigrants from Laos (18.7%, a difference of 0.11%), Immigrants from Cuba (18.7%, a difference of 0.25%), Cape Verdean (18.7%, a difference of 0.32%), Ghanaian (18.6%, a difference of 0.46%), and Immigrants from Sudan (18.5%, a difference of 0.51%).
| Demographics | Rating | Rank | Child Poverty Under the Age of 16 |
| Immigrants | Nigeria | 1.0 /100 | #234 | Tragic 18.4% |
| Nigerians | 1.0 /100 | #235 | Tragic 18.4% |
| Cree | 0.9 /100 | #236 | Tragic 18.5% |
| Sudanese | 0.9 /100 | #237 | Tragic 18.5% |
| Immigrants | Eritrea | 0.8 /100 | #238 | Tragic 18.5% |
| Immigrants | Sudan | 0.8 /100 | #239 | Tragic 18.5% |
| Ghanaians | 0.8 /100 | #240 | Tragic 18.6% |
| Alsatians | 0.7 /100 | #241 | Tragic 18.6% |
| Immigrants | Laos | 0.6 /100 | #242 | Tragic 18.7% |
| Immigrants | Cuba | 0.6 /100 | #243 | Tragic 18.7% |
| Cape Verdeans | 0.6 /100 | #244 | Tragic 18.7% |
| Shoshone | 0.5 /100 | #245 | Tragic 18.8% |
| Immigrants | Nicaragua | 0.4 /100 | #246 | Tragic 18.8% |
| French American Indians | 0.4 /100 | #247 | Tragic 18.9% |
| Ecuadorians | 0.3 /100 | #248 | Tragic 19.0% |
Demographics Similar to Welsh by Child Poverty Under the Age of 16
In terms of child poverty under the age of 16, the demographic groups most similar to Welsh are Peruvian (15.3%, a difference of 0.010%), Immigrants from Spain (15.3%, a difference of 0.040%), Immigrants from Vietnam (15.3%, a difference of 0.040%), New Zealander (15.3%, a difference of 0.10%), and Albanian (15.2%, a difference of 0.41%).
| Demographics | Rating | Rank | Child Poverty Under the Age of 16 |
| Armenians | 89.4 /100 | #131 | Excellent 15.2% |
| Canadians | 89.1 /100 | #132 | Excellent 15.2% |
| Immigrants | South Eastern Asia | 89.0 /100 | #133 | Excellent 15.2% |
| Native Hawaiians | 88.7 /100 | #134 | Excellent 15.2% |
| Albanians | 88.6 /100 | #135 | Excellent 15.2% |
| Immigrants | Spain | 87.3 /100 | #136 | Excellent 15.3% |
| Peruvians | 87.2 /100 | #137 | Excellent 15.3% |
| Welsh | 87.2 /100 | #138 | Excellent 15.3% |
| Immigrants | Vietnam | 87.1 /100 | #139 | Excellent 15.3% |
| New Zealanders | 86.9 /100 | #140 | Excellent 15.3% |
| Slavs | 84.2 /100 | #141 | Excellent 15.4% |
| Brazilians | 82.8 /100 | #142 | Excellent 15.4% |
| Icelanders | 82.5 /100 | #143 | Excellent 15.4% |
| Immigrants | Hungary | 81.9 /100 | #144 | Excellent 15.5% |
| Immigrants | Peru | 81.7 /100 | #145 | Excellent 15.5% |