Aleut vs Tlingit-Haida Seniors Poverty Over the Age of 75
COMPARE
Aleut
Tlingit-Haida
Seniors Poverty Over the Age of 75
Seniors Poverty Over the Age of 75 Comparison
Aleuts
Tlingit-Haida
11.5%
SENIORS POVERTY OVER THE AGE OF 75
94.1/ 100
METRIC RATING
90th/ 347
METRIC RANK
9.7%
SENIORS POVERTY OVER THE AGE OF 75
100.0/ 100
METRIC RATING
2nd/ 347
METRIC RANK
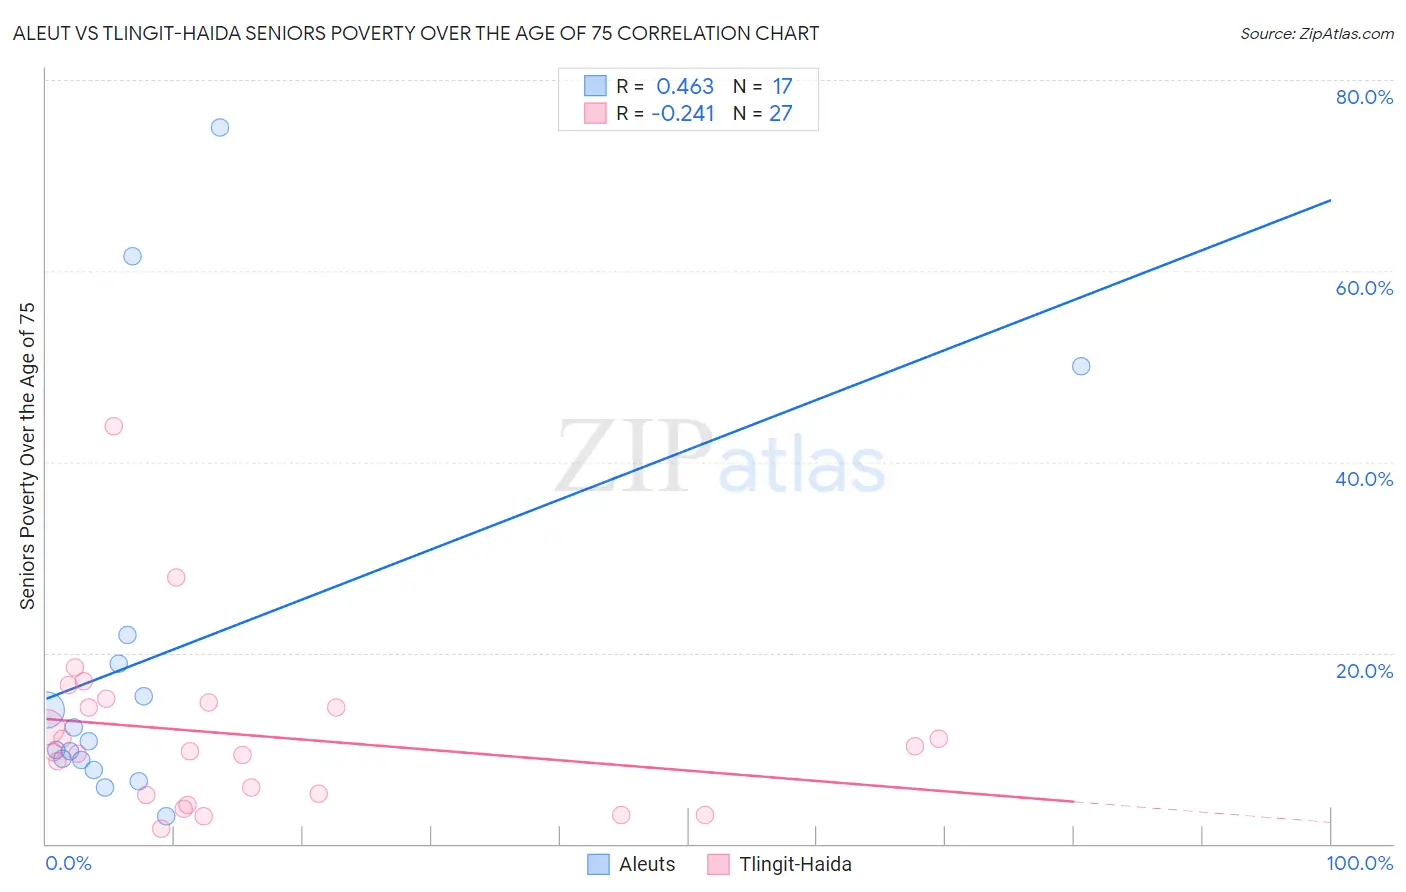
Aleut vs Tlingit-Haida Seniors Poverty Over the Age of 75 Correlation Chart
The statistical analysis conducted on geographies consisting of 61,466,787 people shows a moderate positive correlation between the proportion of Aleuts and poverty level among seniors over the age of 75 in the United States with a correlation coefficient (R) of 0.463 and weighted average of 11.5%. Similarly, the statistical analysis conducted on geographies consisting of 60,526,405 people shows a weak negative correlation between the proportion of Tlingit-Haida and poverty level among seniors over the age of 75 in the United States with a correlation coefficient (R) of -0.241 and weighted average of 9.7%, a difference of 18.5%.
Seniors Poverty Over the Age of 75 Correlation Summary
| Measurement | Aleut | Tlingit-Haida |
| Minimum | 2.9% | 1.5% |
| Maximum | 75.0% | 43.8% |
| Range | 72.1% | 42.2% |
| Mean | 20.0% | 11.4% |
| Median | 10.7% | 9.7% |
| Interquartile 25% (IQ1) | 8.3% | 5.0% |
| Interquartile 75% (IQ3) | 20.4% | 14.8% |
| Interquartile Range (IQR) | 12.1% | 9.8% |
| Standard Deviation (Sample) | 21.1% | 8.8% |
| Standard Deviation (Population) | 20.5% | 8.7% |
Similar Demographics by Seniors Poverty Over the Age of 75
Demographics Similar to Aleuts by Seniors Poverty Over the Age of 75
In terms of seniors poverty over the age of 75, the demographic groups most similar to Aleuts are Immigrants from Germany (11.5%, a difference of 0.020%), Kenyan (11.5%, a difference of 0.080%), Immigrants from Sri Lanka (11.5%, a difference of 0.11%), Immigrants from Croatia (11.5%, a difference of 0.15%), and Korean (11.5%, a difference of 0.16%).
| Demographics | Rating | Rank | Seniors Poverty Over the Age of 75 |
| Immigrants | South Africa | 94.9 /100 | #83 | Exceptional 11.5% |
| Immigrants | Iraq | 94.9 /100 | #84 | Exceptional 11.5% |
| Immigrants | Bulgaria | 94.7 /100 | #85 | Exceptional 11.5% |
| Australians | 94.6 /100 | #86 | Exceptional 11.5% |
| Koreans | 94.5 /100 | #87 | Exceptional 11.5% |
| Immigrants | Croatia | 94.5 /100 | #88 | Exceptional 11.5% |
| Immigrants | Sri Lanka | 94.4 /100 | #89 | Exceptional 11.5% |
| Aleuts | 94.1 /100 | #90 | Exceptional 11.5% |
| Immigrants | Germany | 94.1 /100 | #91 | Exceptional 11.5% |
| Kenyans | 93.9 /100 | #92 | Exceptional 11.5% |
| Immigrants | Poland | 92.9 /100 | #93 | Exceptional 11.6% |
| Creek | 92.7 /100 | #94 | Exceptional 11.6% |
| Immigrants | Bosnia and Herzegovina | 92.6 /100 | #95 | Exceptional 11.6% |
| Immigrants | Sweden | 92.6 /100 | #96 | Exceptional 11.6% |
| Romanians | 92.3 /100 | #97 | Exceptional 11.6% |
Demographics Similar to Tlingit-Haida by Seniors Poverty Over the Age of 75
In terms of seniors poverty over the age of 75, the demographic groups most similar to Tlingit-Haida are Native Hawaiian (10.1%, a difference of 3.8%), Swedish (10.2%, a difference of 4.7%), Norwegian (10.2%, a difference of 5.1%), Danish (10.2%, a difference of 5.4%), and Maltese (10.3%, a difference of 6.1%).
| Demographics | Rating | Rank | Seniors Poverty Over the Age of 75 |
| Chinese | 100.0 /100 | #1 | Exceptional 9.1% |
| Tlingit-Haida | 100.0 /100 | #2 | Exceptional 9.7% |
| Native Hawaiians | 100.0 /100 | #3 | Exceptional 10.1% |
| Swedes | 100.0 /100 | #4 | Exceptional 10.2% |
| Norwegians | 100.0 /100 | #5 | Exceptional 10.2% |
| Danes | 100.0 /100 | #6 | Exceptional 10.2% |
| Maltese | 100.0 /100 | #7 | Exceptional 10.3% |
| Germans | 99.9 /100 | #8 | Exceptional 10.4% |
| English | 99.9 /100 | #9 | Exceptional 10.4% |
| Scandinavians | 99.9 /100 | #10 | Exceptional 10.4% |
| Immigrants | India | 99.9 /100 | #11 | Exceptional 10.4% |
| Tongans | 99.9 /100 | #12 | Exceptional 10.5% |
| Croatians | 99.9 /100 | #13 | Exceptional 10.5% |
| Scottish | 99.9 /100 | #14 | Exceptional 10.5% |
| Europeans | 99.9 /100 | #15 | Exceptional 10.5% |