Aleut vs Immigrants from Moldova Female Poverty Among 25-34 Year Olds
COMPARE
Aleut
Immigrants from Moldova
Female Poverty Among 25-34 Year Olds
Female Poverty Among 25-34 Year Olds Comparison
Aleuts
Immigrants from Moldova
16.1%
FEMALE POVERTY AMONG 25-34 YEAR OLDS
0.0/ 100
METRIC RATING
282nd/ 347
METRIC RANK
12.1%
FEMALE POVERTY AMONG 25-34 YEAR OLDS
99.3/ 100
METRIC RATING
62nd/ 347
METRIC RANK
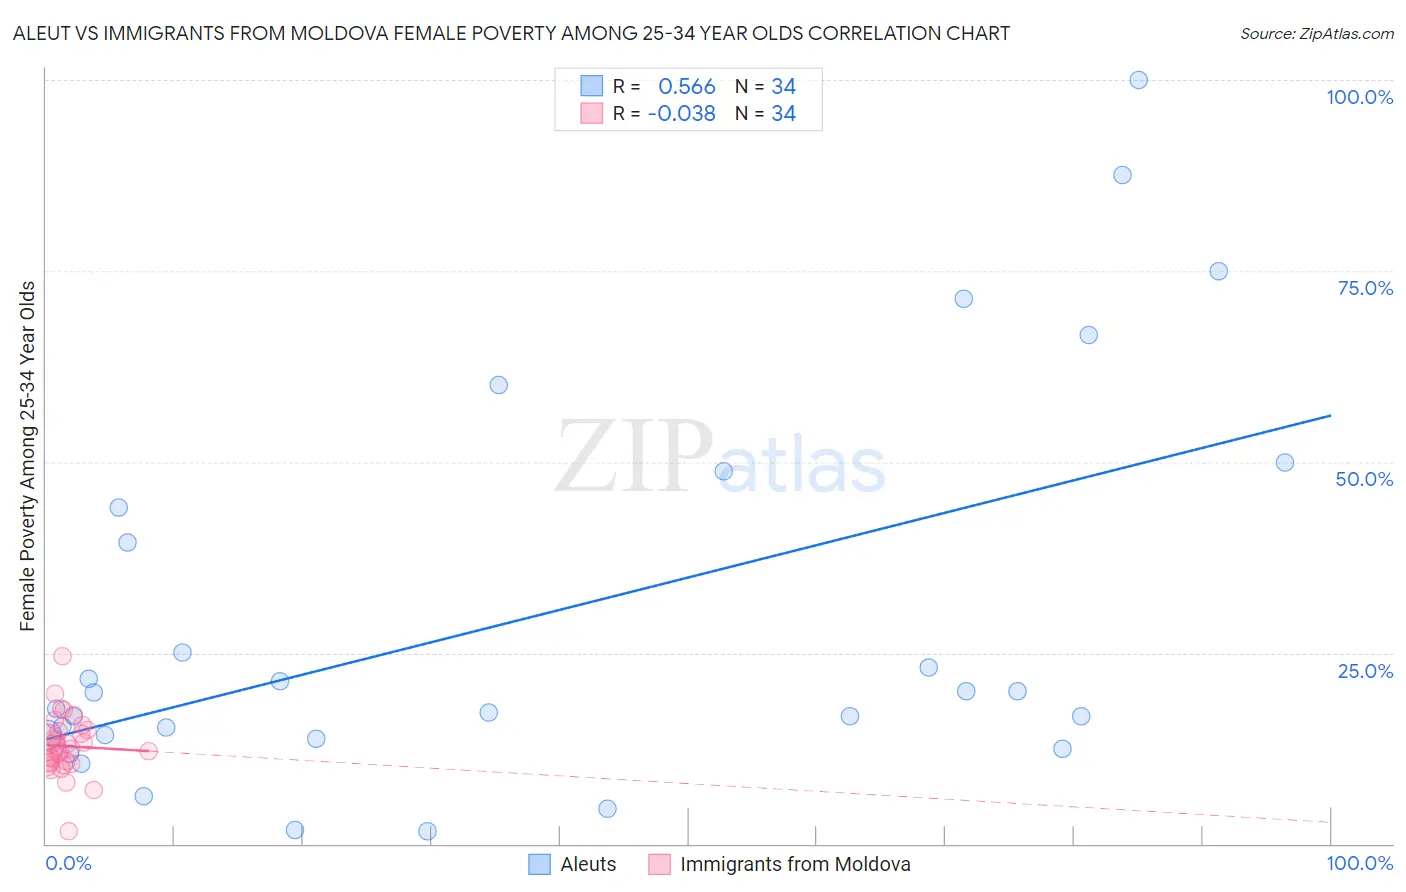
Aleut vs Immigrants from Moldova Female Poverty Among 25-34 Year Olds Correlation Chart
The statistical analysis conducted on geographies consisting of 61,505,480 people shows a substantial positive correlation between the proportion of Aleuts and poverty level among females between the ages 25 and 34 in the United States with a correlation coefficient (R) of 0.566 and weighted average of 16.1%. Similarly, the statistical analysis conducted on geographies consisting of 123,404,281 people shows no correlation between the proportion of Immigrants from Moldova and poverty level among females between the ages 25 and 34 in the United States with a correlation coefficient (R) of -0.038 and weighted average of 12.1%, a difference of 32.7%.
Female Poverty Among 25-34 Year Olds Correlation Summary
| Measurement | Aleut | Immigrants from Moldova |
| Minimum | 1.6% | 1.6% |
| Maximum | 100.0% | 24.6% |
| Range | 98.4% | 23.0% |
| Mean | 29.4% | 12.8% |
| Median | 18.7% | 12.7% |
| Interquartile 25% (IQ1) | 14.2% | 10.6% |
| Interquartile 75% (IQ3) | 44.1% | 14.8% |
| Interquartile Range (IQR) | 29.8% | 4.2% |
| Standard Deviation (Sample) | 25.6% | 4.0% |
| Standard Deviation (Population) | 25.2% | 3.9% |
Similar Demographics by Female Poverty Among 25-34 Year Olds
Demographics Similar to Aleuts by Female Poverty Among 25-34 Year Olds
In terms of female poverty among 25-34 year olds, the demographic groups most similar to Aleuts are Bahamian (16.1%, a difference of 0.030%), Immigrants from Latin America (16.0%, a difference of 0.66%), Shoshone (16.2%, a difference of 0.87%), Bangladeshi (15.9%, a difference of 1.2%), and French American Indian (15.9%, a difference of 1.3%).
| Demographics | Rating | Rank | Female Poverty Among 25-34 Year Olds |
| Immigrants | Azores | 0.0 /100 | #275 | Tragic 15.8% |
| Immigrants | Zaire | 0.0 /100 | #276 | Tragic 15.8% |
| Immigrants | Micronesia | 0.0 /100 | #277 | Tragic 15.8% |
| French American Indians | 0.0 /100 | #278 | Tragic 15.9% |
| Fijians | 0.0 /100 | #279 | Tragic 15.9% |
| Bangladeshis | 0.0 /100 | #280 | Tragic 15.9% |
| Immigrants | Latin America | 0.0 /100 | #281 | Tragic 16.0% |
| Aleuts | 0.0 /100 | #282 | Tragic 16.1% |
| Bahamians | 0.0 /100 | #283 | Tragic 16.1% |
| Shoshone | 0.0 /100 | #284 | Tragic 16.2% |
| Immigrants | Bahamas | 0.0 /100 | #285 | Tragic 16.3% |
| Cape Verdeans | 0.0 /100 | #286 | Tragic 16.3% |
| Americans | 0.0 /100 | #287 | Tragic 16.4% |
| Guatemalans | 0.0 /100 | #288 | Tragic 16.4% |
| Osage | 0.0 /100 | #289 | Tragic 16.4% |
Demographics Similar to Immigrants from Moldova by Female Poverty Among 25-34 Year Olds
In terms of female poverty among 25-34 year olds, the demographic groups most similar to Immigrants from Moldova are Soviet Union (12.1%, a difference of 0.010%), Immigrants from Czechoslovakia (12.1%, a difference of 0.17%), Immigrants from Northern Europe (12.1%, a difference of 0.19%), Immigrants from Russia (12.2%, a difference of 0.25%), and Armenian (12.2%, a difference of 0.27%).
| Demographics | Rating | Rank | Female Poverty Among 25-34 Year Olds |
| Immigrants | Philippines | 99.5 /100 | #55 | Exceptional 12.0% |
| Luxembourgers | 99.5 /100 | #56 | Exceptional 12.1% |
| Jordanians | 99.4 /100 | #57 | Exceptional 12.1% |
| Immigrants | Romania | 99.4 /100 | #58 | Exceptional 12.1% |
| Russians | 99.4 /100 | #59 | Exceptional 12.1% |
| Immigrants | Northern Europe | 99.4 /100 | #60 | Exceptional 12.1% |
| Immigrants | Czechoslovakia | 99.4 /100 | #61 | Exceptional 12.1% |
| Immigrants | Moldova | 99.3 /100 | #62 | Exceptional 12.1% |
| Soviet Union | 99.3 /100 | #63 | Exceptional 12.1% |
| Immigrants | Russia | 99.2 /100 | #64 | Exceptional 12.2% |
| Armenians | 99.2 /100 | #65 | Exceptional 12.2% |
| Immigrants | Europe | 99.2 /100 | #66 | Exceptional 12.2% |
| Laotians | 99.2 /100 | #67 | Exceptional 12.2% |
| Sri Lankans | 99.1 /100 | #68 | Exceptional 12.2% |
| Immigrants | Lebanon | 99.1 /100 | #69 | Exceptional 12.2% |