Albanian vs Immigrants from Kenya Family Poverty
COMPARE
Albanian
Immigrants from Kenya
Family Poverty
Family Poverty Comparison
Albanians
Immigrants from Kenya
8.5%
FAMILY POVERTY
83.3/ 100
METRIC RATING
144th/ 347
METRIC RANK
9.2%
FAMILY POVERTY
34.0/ 100
METRIC RATING
188th/ 347
METRIC RANK
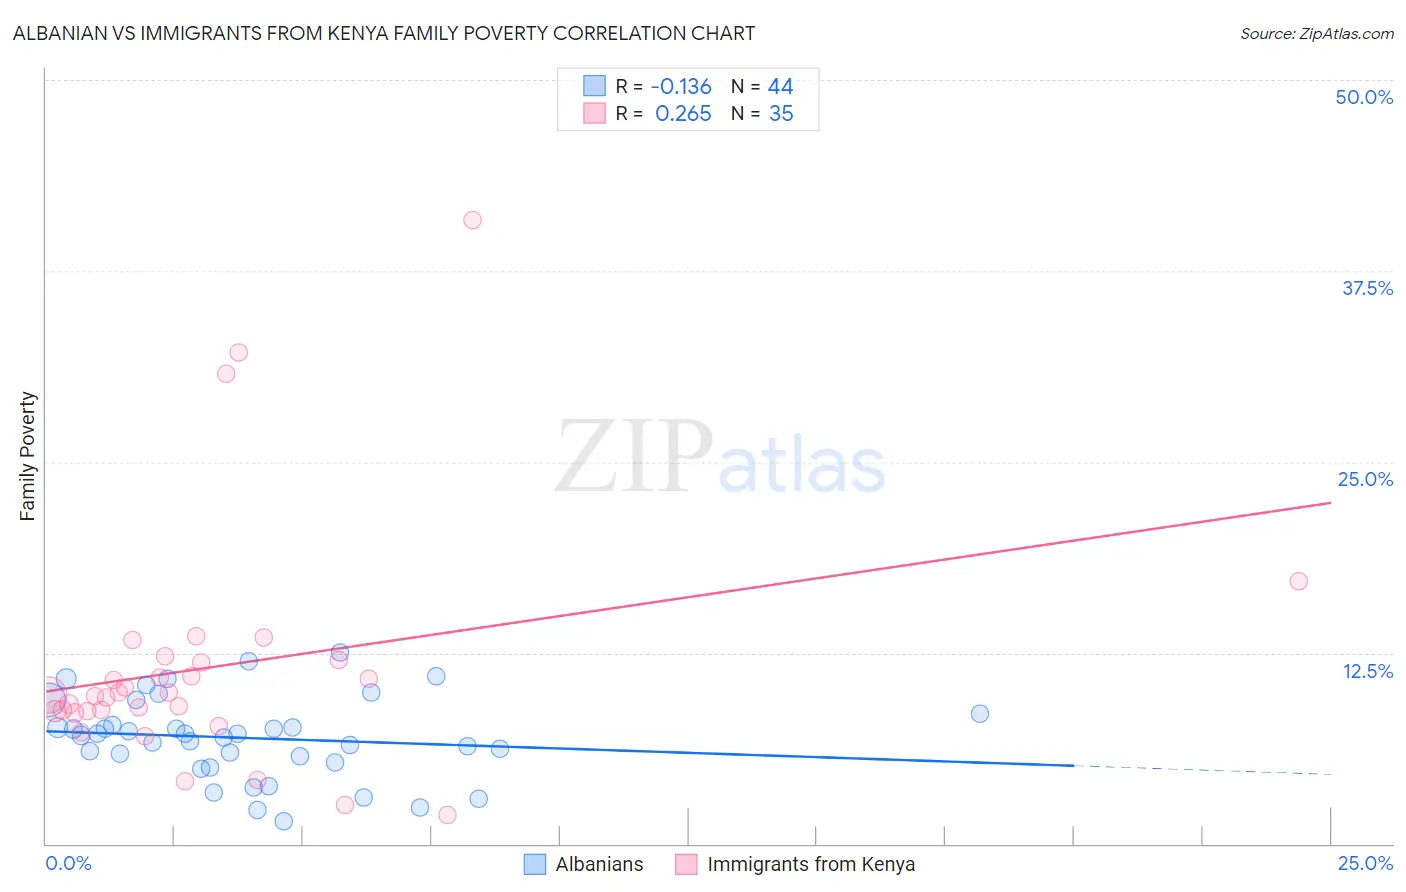
Albanian vs Immigrants from Kenya Family Poverty Correlation Chart
The statistical analysis conducted on geographies consisting of 192,873,103 people shows a poor negative correlation between the proportion of Albanians and poverty level among families in the United States with a correlation coefficient (R) of -0.136 and weighted average of 8.5%. Similarly, the statistical analysis conducted on geographies consisting of 217,776,212 people shows a weak positive correlation between the proportion of Immigrants from Kenya and poverty level among families in the United States with a correlation coefficient (R) of 0.265 and weighted average of 9.2%, a difference of 7.8%.
Family Poverty Correlation Summary
| Measurement | Albanian | Immigrants from Kenya |
| Minimum | 1.4% | 1.9% |
| Maximum | 12.5% | 40.8% |
| Range | 11.1% | 39.0% |
| Mean | 6.9% | 11.6% |
| Median | 7.1% | 9.8% |
| Interquartile 25% (IQ1) | 5.5% | 8.7% |
| Interquartile 75% (IQ3) | 8.1% | 12.0% |
| Interquartile Range (IQR) | 2.6% | 3.3% |
| Standard Deviation (Sample) | 2.7% | 7.9% |
| Standard Deviation (Population) | 2.6% | 7.8% |
Similar Demographics by Family Poverty
Demographics Similar to Albanians by Family Poverty
In terms of family poverty, the demographic groups most similar to Albanians are Immigrants from Germany (8.5%, a difference of 0.020%), Immigrants from South Eastern Asia (8.5%, a difference of 0.020%), Immigrants from Belarus (8.5%, a difference of 0.030%), Yugoslavian (8.5%, a difference of 0.050%), and Immigrants from Jordan (8.5%, a difference of 0.060%).
| Demographics | Rating | Rank | Family Poverty |
| Immigrants | Southern Europe | 86.0 /100 | #137 | Excellent 8.5% |
| Armenians | 84.6 /100 | #138 | Excellent 8.5% |
| Immigrants | Nepal | 84.2 /100 | #139 | Excellent 8.5% |
| Immigrants | Kazakhstan | 84.1 /100 | #140 | Excellent 8.5% |
| Immigrants | Ukraine | 83.9 /100 | #141 | Excellent 8.5% |
| Yugoslavians | 83.5 /100 | #142 | Excellent 8.5% |
| Immigrants | Germany | 83.3 /100 | #143 | Excellent 8.5% |
| Albanians | 83.3 /100 | #144 | Excellent 8.5% |
| Immigrants | South Eastern Asia | 83.2 /100 | #145 | Excellent 8.5% |
| Immigrants | Belarus | 83.2 /100 | #146 | Excellent 8.5% |
| Immigrants | Jordan | 83.0 /100 | #147 | Excellent 8.5% |
| Scotch-Irish | 82.2 /100 | #148 | Excellent 8.6% |
| Mongolians | 80.4 /100 | #149 | Excellent 8.6% |
| Syrians | 80.3 /100 | #150 | Excellent 8.6% |
| Brazilians | 80.1 /100 | #151 | Excellent 8.6% |
Demographics Similar to Immigrants from Kenya by Family Poverty
In terms of family poverty, the demographic groups most similar to Immigrants from Kenya are Delaware (9.2%, a difference of 0.20%), Colombian (9.2%, a difference of 0.29%), Immigrants from Afghanistan (9.2%, a difference of 0.29%), Arab (9.2%, a difference of 0.37%), and Immigrants from Saudi Arabia (9.1%, a difference of 0.63%).
| Demographics | Rating | Rank | Family Poverty |
| Hmong | 40.2 /100 | #181 | Average 9.1% |
| Immigrants | Morocco | 40.2 /100 | #182 | Average 9.1% |
| Uruguayans | 39.2 /100 | #183 | Fair 9.1% |
| South American Indians | 38.7 /100 | #184 | Fair 9.1% |
| Immigrants | Saudi Arabia | 38.6 /100 | #185 | Fair 9.1% |
| Colombians | 36.1 /100 | #186 | Fair 9.2% |
| Delaware | 35.4 /100 | #187 | Fair 9.2% |
| Immigrants | Kenya | 34.0 /100 | #188 | Fair 9.2% |
| Immigrants | Afghanistan | 32.1 /100 | #189 | Fair 9.2% |
| Arabs | 31.5 /100 | #190 | Fair 9.2% |
| Ugandans | 28.7 /100 | #191 | Fair 9.3% |
| Spanish | 28.7 /100 | #192 | Fair 9.3% |
| Immigrants | Western Asia | 28.2 /100 | #193 | Fair 9.3% |
| South Americans | 28.1 /100 | #194 | Fair 9.3% |
| Venezuelans | 27.4 /100 | #195 | Fair 9.3% |