Albanian vs Immigrants from Europe Female Poverty
COMPARE
Albanian
Immigrants from Europe
Female Poverty
Female Poverty Comparison
Albanians
Immigrants from Europe
12.7%
FEMALE POVERTY
90.8/ 100
METRIC RATING
119th/ 347
METRIC RANK
12.1%
FEMALE POVERTY
98.2/ 100
METRIC RATING
59th/ 347
METRIC RANK
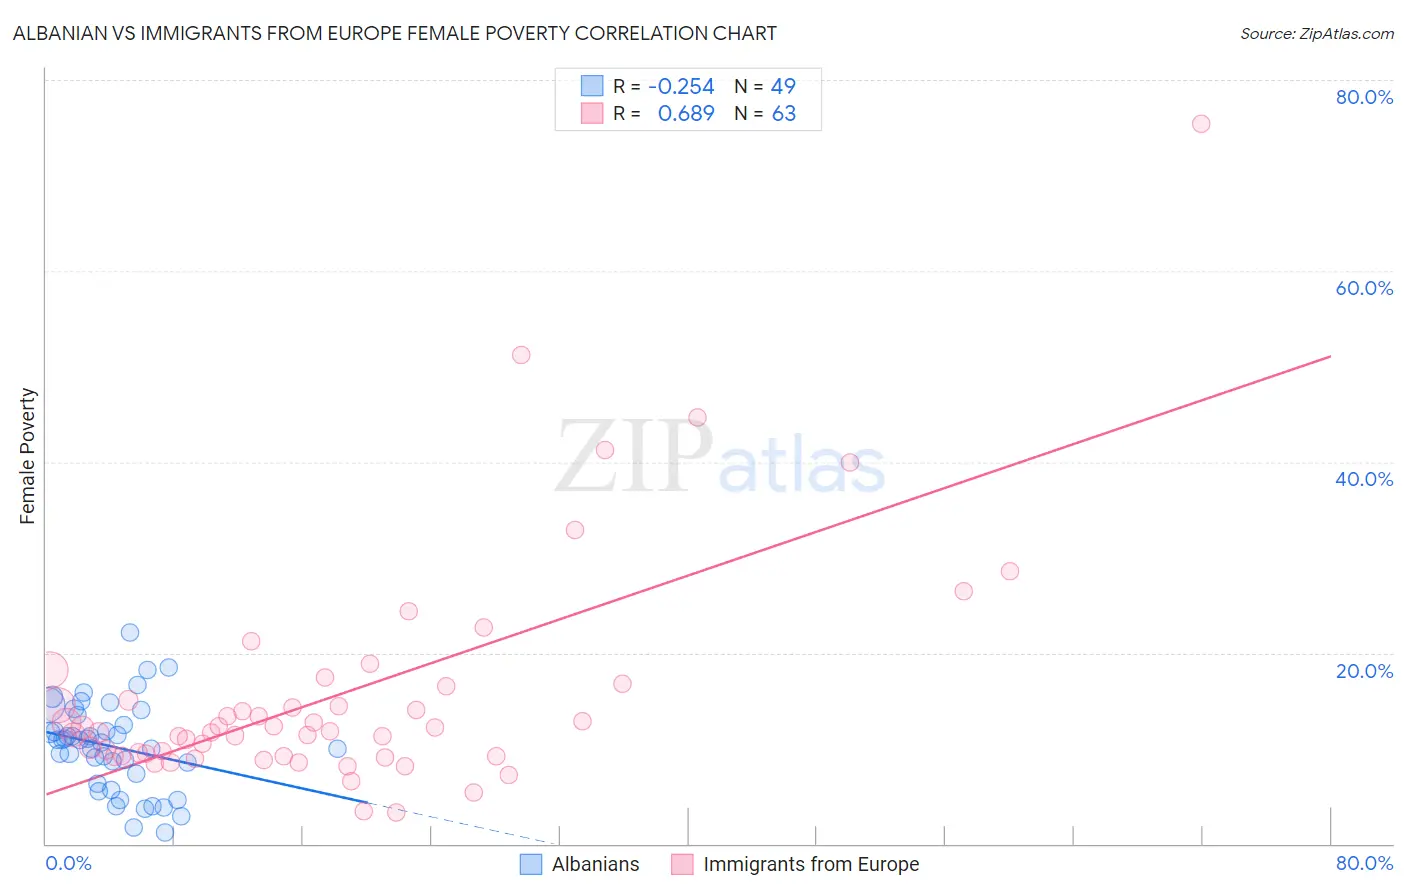
Albanian vs Immigrants from Europe Female Poverty Correlation Chart
The statistical analysis conducted on geographies consisting of 193,134,120 people shows a weak negative correlation between the proportion of Albanians and poverty level among females in the United States with a correlation coefficient (R) of -0.254 and weighted average of 12.7%. Similarly, the statistical analysis conducted on geographies consisting of 546,481,201 people shows a significant positive correlation between the proportion of Immigrants from Europe and poverty level among females in the United States with a correlation coefficient (R) of 0.689 and weighted average of 12.1%, a difference of 4.6%.
Female Poverty Correlation Summary
| Measurement | Albanian | Immigrants from Europe |
| Minimum | 1.2% | 3.3% |
| Maximum | 22.1% | 75.4% |
| Range | 20.9% | 72.1% |
| Mean | 10.2% | 15.7% |
| Median | 10.8% | 11.8% |
| Interquartile 25% (IQ1) | 6.8% | 9.2% |
| Interquartile 75% (IQ3) | 13.0% | 16.5% |
| Interquartile Range (IQR) | 6.1% | 7.3% |
| Standard Deviation (Sample) | 4.6% | 12.2% |
| Standard Deviation (Population) | 4.5% | 12.1% |
Similar Demographics by Female Poverty
Demographics Similar to Albanians by Female Poverty
In terms of female poverty, the demographic groups most similar to Albanians are Sri Lankan (12.7%, a difference of 0.010%), Immigrants from Southern Europe (12.7%, a difference of 0.030%), New Zealander (12.7%, a difference of 0.060%), Immigrants from Russia (12.7%, a difference of 0.10%), and Immigrants from Hungary (12.7%, a difference of 0.16%).
| Demographics | Rating | Rank | Female Poverty |
| Immigrants | Israel | 92.0 /100 | #112 | Exceptional 12.6% |
| Canadians | 92.0 /100 | #113 | Exceptional 12.7% |
| Welsh | 91.6 /100 | #114 | Exceptional 12.7% |
| Puget Sound Salish | 91.5 /100 | #115 | Exceptional 12.7% |
| Immigrants | Russia | 91.2 /100 | #116 | Exceptional 12.7% |
| Immigrants | Southern Europe | 90.9 /100 | #117 | Exceptional 12.7% |
| Sri Lankans | 90.9 /100 | #118 | Exceptional 12.7% |
| Albanians | 90.8 /100 | #119 | Exceptional 12.7% |
| New Zealanders | 90.6 /100 | #120 | Exceptional 12.7% |
| Immigrants | Hungary | 90.3 /100 | #121 | Exceptional 12.7% |
| French Canadians | 90.2 /100 | #122 | Exceptional 12.7% |
| Immigrants | South Eastern Asia | 89.9 /100 | #123 | Excellent 12.7% |
| Immigrants | Norway | 89.3 /100 | #124 | Excellent 12.8% |
| Argentineans | 89.1 /100 | #125 | Excellent 12.8% |
| Immigrants | Ukraine | 88.8 /100 | #126 | Excellent 12.8% |
Demographics Similar to Immigrants from Europe by Female Poverty
In terms of female poverty, the demographic groups most similar to Immigrants from Europe are Scandinavian (12.1%, a difference of 0.010%), Immigrants from Serbia (12.1%, a difference of 0.090%), Estonian (12.1%, a difference of 0.15%), Immigrants from Australia (12.2%, a difference of 0.24%), and Immigrants from Asia (12.2%, a difference of 0.25%).
| Demographics | Rating | Rank | Female Poverty |
| Immigrants | Croatia | 98.7 /100 | #52 | Exceptional 12.0% |
| Immigrants | Austria | 98.7 /100 | #53 | Exceptional 12.0% |
| Immigrants | Philippines | 98.7 /100 | #54 | Exceptional 12.1% |
| Immigrants | Sri Lanka | 98.5 /100 | #55 | Exceptional 12.1% |
| Estonians | 98.3 /100 | #56 | Exceptional 12.1% |
| Immigrants | Serbia | 98.3 /100 | #57 | Exceptional 12.1% |
| Scandinavians | 98.2 /100 | #58 | Exceptional 12.1% |
| Immigrants | Europe | 98.2 /100 | #59 | Exceptional 12.1% |
| Immigrants | Australia | 98.1 /100 | #60 | Exceptional 12.2% |
| Immigrants | Asia | 98.1 /100 | #61 | Exceptional 12.2% |
| Immigrants | Italy | 98.0 /100 | #62 | Exceptional 12.2% |
| Ukrainians | 98.0 /100 | #63 | Exceptional 12.2% |
| Germans | 98.0 /100 | #64 | Exceptional 12.2% |
| Indians (Asian) | 97.9 /100 | #65 | Exceptional 12.2% |
| Austrians | 97.9 /100 | #66 | Exceptional 12.2% |