Alaska Native vs Welsh Female Poverty Among 18-24 Year Olds
COMPARE
Alaska Native
Welsh
Female Poverty Among 18-24 Year Olds
Female Poverty Among 18-24 Year Olds Comparison
Alaska Natives
Welsh
21.5%
FEMALE POVERTY AMONG 18-24 YEAR OLDS
0.3/ 100
METRIC RATING
266th/ 347
METRIC RANK
20.8%
FEMALE POVERTY AMONG 18-24 YEAR OLDS
5.4/ 100
METRIC RATING
234th/ 347
METRIC RANK
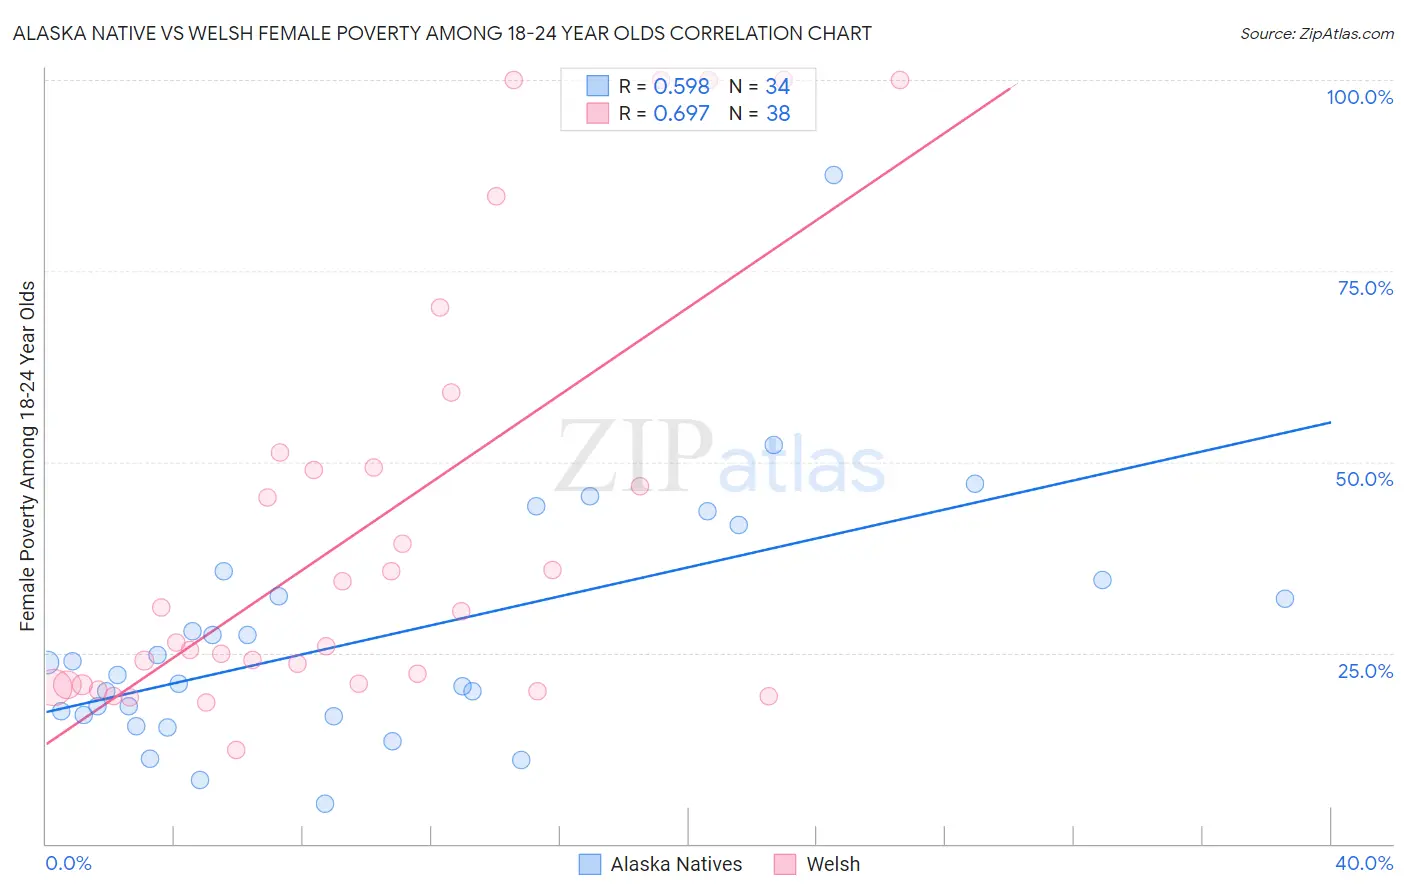
Alaska Native vs Welsh Female Poverty Among 18-24 Year Olds Correlation Chart
The statistical analysis conducted on geographies consisting of 76,299,380 people shows a substantial positive correlation between the proportion of Alaska Natives and poverty level among females between the ages 18 and 24 in the United States with a correlation coefficient (R) of 0.598 and weighted average of 21.5%. Similarly, the statistical analysis conducted on geographies consisting of 502,174,037 people shows a significant positive correlation between the proportion of Welsh and poverty level among females between the ages 18 and 24 in the United States with a correlation coefficient (R) of 0.697 and weighted average of 20.8%, a difference of 3.5%.
Female Poverty Among 18-24 Year Olds Correlation Summary
| Measurement | Alaska Native | Welsh |
| Minimum | 5.2% | 12.3% |
| Maximum | 87.5% | 100.0% |
| Range | 82.3% | 87.7% |
| Mean | 27.1% | 41.3% |
| Median | 22.9% | 28.4% |
| Interquartile 25% (IQ1) | 16.8% | 20.8% |
| Interquartile 75% (IQ3) | 34.6% | 49.2% |
| Interquartile Range (IQR) | 17.8% | 28.4% |
| Standard Deviation (Sample) | 16.0% | 27.8% |
| Standard Deviation (Population) | 15.8% | 27.4% |
Similar Demographics by Female Poverty Among 18-24 Year Olds
Demographics Similar to Alaska Natives by Female Poverty Among 18-24 Year Olds
In terms of female poverty among 18-24 year olds, the demographic groups most similar to Alaska Natives are Honduran (21.5%, a difference of 0.070%), Nonimmigrants (21.5%, a difference of 0.070%), American (21.6%, a difference of 0.080%), Icelander (21.5%, a difference of 0.13%), and Immigrants from Burma/Myanmar (21.6%, a difference of 0.23%).
| Demographics | Rating | Rank | Female Poverty Among 18-24 Year Olds |
| Immigrants | France | 0.6 /100 | #259 | Tragic 21.4% |
| Immigrants | Norway | 0.6 /100 | #260 | Tragic 21.4% |
| Immigrants | Bahamas | 0.5 /100 | #261 | Tragic 21.4% |
| Immigrants | Eastern Africa | 0.4 /100 | #262 | Tragic 21.4% |
| Icelanders | 0.3 /100 | #263 | Tragic 21.5% |
| Hondurans | 0.3 /100 | #264 | Tragic 21.5% |
| Immigrants | Nonimmigrants | 0.3 /100 | #265 | Tragic 21.5% |
| Alaska Natives | 0.3 /100 | #266 | Tragic 21.5% |
| Americans | 0.3 /100 | #267 | Tragic 21.6% |
| Immigrants | Burma/Myanmar | 0.2 /100 | #268 | Tragic 21.6% |
| Celtics | 0.2 /100 | #269 | Tragic 21.6% |
| Mongolians | 0.2 /100 | #270 | Tragic 21.6% |
| Scotch-Irish | 0.2 /100 | #271 | Tragic 21.6% |
| Basques | 0.2 /100 | #272 | Tragic 21.7% |
| New Zealanders | 0.2 /100 | #273 | Tragic 21.7% |
Demographics Similar to Welsh by Female Poverty Among 18-24 Year Olds
In terms of female poverty among 18-24 year olds, the demographic groups most similar to Welsh are Immigrants from Uganda (20.8%, a difference of 0.080%), Immigrants from Denmark (20.8%, a difference of 0.10%), Finnish (20.8%, a difference of 0.13%), Okinawan (20.8%, a difference of 0.13%), and Immigrants from St. Vincent and the Grenadines (20.8%, a difference of 0.14%).
| Demographics | Rating | Rank | Female Poverty Among 18-24 Year Olds |
| Immigrants | Sweden | 6.8 /100 | #227 | Tragic 20.7% |
| Ghanaians | 6.5 /100 | #228 | Tragic 20.8% |
| Australians | 6.1 /100 | #229 | Tragic 20.8% |
| Whites/Caucasians | 6.1 /100 | #230 | Tragic 20.8% |
| Immigrants | St. Vincent and the Grenadines | 6.0 /100 | #231 | Tragic 20.8% |
| Finns | 6.0 /100 | #232 | Tragic 20.8% |
| Immigrants | Denmark | 5.8 /100 | #233 | Tragic 20.8% |
| Welsh | 5.4 /100 | #234 | Tragic 20.8% |
| Immigrants | Uganda | 5.1 /100 | #235 | Tragic 20.8% |
| Okinawans | 4.9 /100 | #236 | Tragic 20.8% |
| Scottish | 4.5 /100 | #237 | Tragic 20.9% |
| Immigrants | Singapore | 4.4 /100 | #238 | Tragic 20.9% |
| Immigrants | Guatemala | 4.3 /100 | #239 | Tragic 20.9% |
| Luxembourgers | 4.2 /100 | #240 | Tragic 20.9% |
| Immigrants | Eritrea | 4.2 /100 | #241 | Tragic 20.9% |