Alaska Native vs Immigrants from Yemen Child Poverty Among Boys Under 16
COMPARE
Alaska Native
Immigrants from Yemen
Child Poverty Among Boys Under 16
Child Poverty Among Boys Under 16 Comparison
Alaska Natives
Immigrants from Yemen
16.8%
CHILD POVERTY AMONG BOYS UNDER 16
29.8/ 100
METRIC RATING
191st/ 347
METRIC RANK
28.9%
CHILD POVERTY AMONG BOYS UNDER 16
0.0/ 100
METRIC RATING
341st/ 347
METRIC RANK
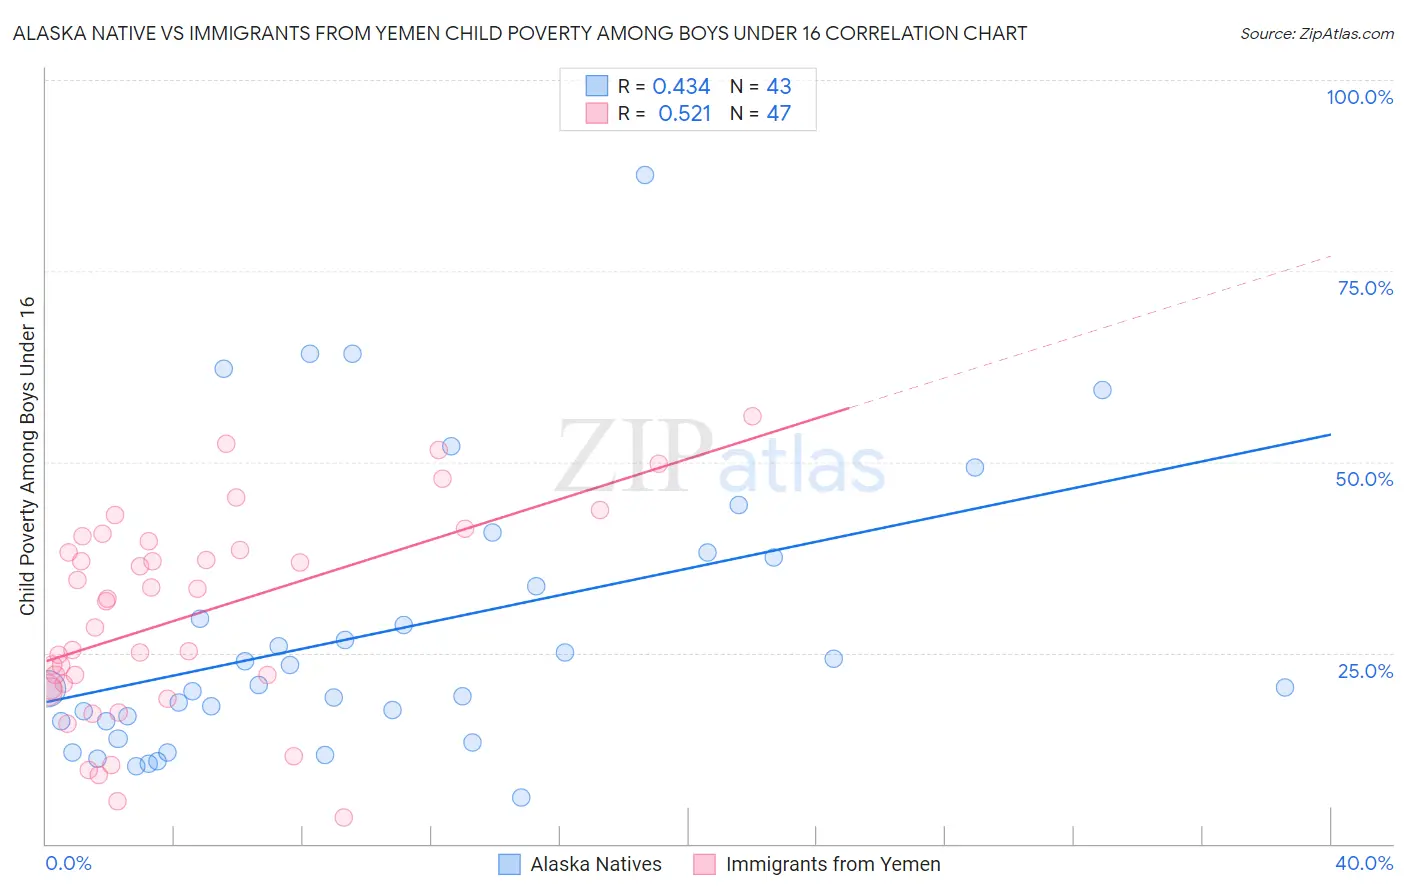
Alaska Native vs Immigrants from Yemen Child Poverty Among Boys Under 16 Correlation Chart
The statistical analysis conducted on geographies consisting of 76,419,189 people shows a moderate positive correlation between the proportion of Alaska Natives and poverty level among boys under the age of 16 in the United States with a correlation coefficient (R) of 0.434 and weighted average of 16.8%. Similarly, the statistical analysis conducted on geographies consisting of 82,297,858 people shows a substantial positive correlation between the proportion of Immigrants from Yemen and poverty level among boys under the age of 16 in the United States with a correlation coefficient (R) of 0.521 and weighted average of 28.9%, a difference of 71.5%.
Child Poverty Among Boys Under 16 Correlation Summary
| Measurement | Alaska Native | Immigrants from Yemen |
| Minimum | 6.1% | 3.4% |
| Maximum | 87.5% | 55.9% |
| Range | 81.4% | 52.5% |
| Mean | 27.7% | 29.8% |
| Median | 20.4% | 31.7% |
| Interquartile 25% (IQ1) | 16.0% | 20.4% |
| Interquartile 75% (IQ3) | 37.5% | 39.7% |
| Interquartile Range (IQR) | 21.5% | 19.3% |
| Standard Deviation (Sample) | 18.4% | 13.2% |
| Standard Deviation (Population) | 18.1% | 13.0% |
Similar Demographics by Child Poverty Among Boys Under 16
Demographics Similar to Alaska Natives by Child Poverty Among Boys Under 16
In terms of child poverty among boys under 16, the demographic groups most similar to Alaska Natives are Arab (16.8%, a difference of 0.17%), Immigrants from Morocco (16.7%, a difference of 0.59%), Immigrants from South America (16.7%, a difference of 0.98%), Immigrants from Costa Rica (16.7%, a difference of 0.99%), and Hmong (16.6%, a difference of 1.1%).
| Demographics | Rating | Rank | Child Poverty Among Boys Under 16 |
| Celtics | 40.6 /100 | #184 | Average 16.6% |
| Immigrants | Western Asia | 40.4 /100 | #185 | Average 16.6% |
| Hmong | 38.4 /100 | #186 | Fair 16.6% |
| Immigrants | Costa Rica | 37.8 /100 | #187 | Fair 16.7% |
| Immigrants | South America | 37.7 /100 | #188 | Fair 16.7% |
| Immigrants | Morocco | 34.5 /100 | #189 | Fair 16.7% |
| Arabs | 31.1 /100 | #190 | Fair 16.8% |
| Alaska Natives | 29.8 /100 | #191 | Fair 16.8% |
| Immigrants | Uganda | 21.6 /100 | #192 | Fair 17.0% |
| Immigrants | Iraq | 21.6 /100 | #193 | Fair 17.0% |
| Immigrants | Lebanon | 21.2 /100 | #194 | Fair 17.0% |
| Spanish | 20.8 /100 | #195 | Fair 17.0% |
| Spaniards | 20.5 /100 | #196 | Fair 17.1% |
| Immigrants | Kenya | 20.1 /100 | #197 | Fair 17.1% |
| Immigrants | Cameroon | 19.0 /100 | #198 | Poor 17.1% |
Demographics Similar to Immigrants from Yemen by Child Poverty Among Boys Under 16
In terms of child poverty among boys under 16, the demographic groups most similar to Immigrants from Yemen are Pima (29.7%, a difference of 3.1%), Navajo (30.3%, a difference of 5.0%), Yuman (30.6%, a difference of 6.2%), Tohono O'odham (31.6%, a difference of 9.4%), and Crow (26.3%, a difference of 9.9%).
| Demographics | Rating | Rank | Child Poverty Among Boys Under 16 |
| Apache | 0.0 /100 | #333 | Tragic 24.5% |
| Blacks/African Americans | 0.0 /100 | #334 | Tragic 24.5% |
| Yup'ik | 0.0 /100 | #335 | Tragic 24.7% |
| Sioux | 0.0 /100 | #336 | Tragic 25.3% |
| Cheyenne | 0.0 /100 | #337 | Tragic 25.8% |
| Hopi | 0.0 /100 | #338 | Tragic 25.9% |
| Houma | 0.0 /100 | #339 | Tragic 26.2% |
| Crow | 0.0 /100 | #340 | Tragic 26.3% |
| Immigrants | Yemen | 0.0 /100 | #341 | Tragic 28.9% |
| Pima | 0.0 /100 | #342 | Tragic 29.7% |
| Navajo | 0.0 /100 | #343 | Tragic 30.3% |
| Yuman | 0.0 /100 | #344 | Tragic 30.6% |
| Tohono O'odham | 0.0 /100 | #345 | Tragic 31.6% |
| Lumbee | 0.0 /100 | #346 | Tragic 31.9% |
| Puerto Ricans | 0.0 /100 | #347 | Tragic 32.8% |