Alaska Native vs Immigrants from South America Female Poverty
COMPARE
Alaska Native
Immigrants from South America
Female Poverty
Female Poverty Comparison
Alaska Natives
Immigrants from South America
14.7%
FEMALE POVERTY
1.8/ 100
METRIC RATING
230th/ 347
METRIC RANK
13.7%
FEMALE POVERTY
30.6/ 100
METRIC RATING
195th/ 347
METRIC RANK
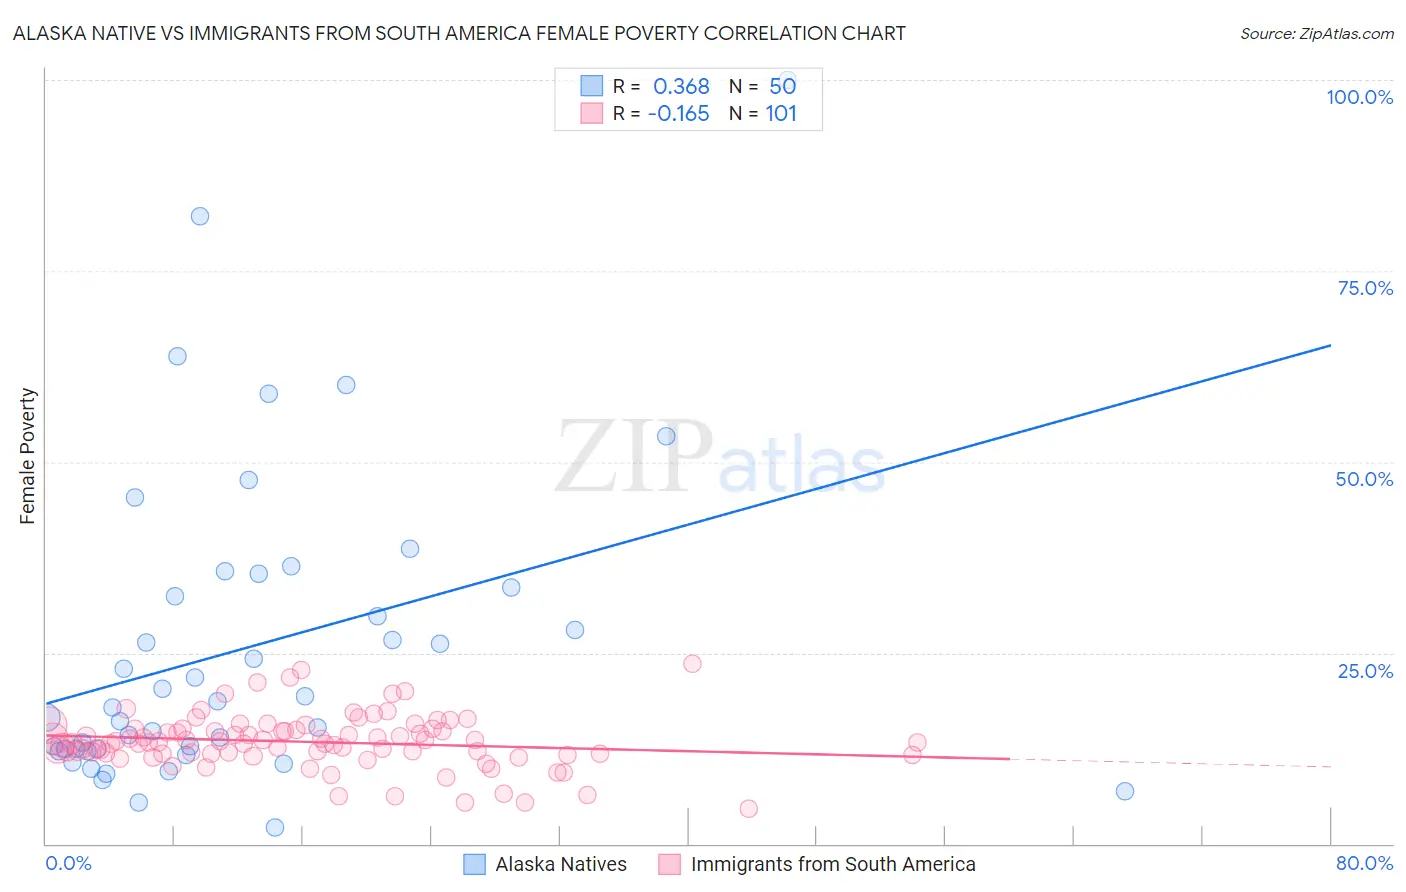
Alaska Native vs Immigrants from South America Female Poverty Correlation Chart
The statistical analysis conducted on geographies consisting of 76,751,650 people shows a mild positive correlation between the proportion of Alaska Natives and poverty level among females in the United States with a correlation coefficient (R) of 0.368 and weighted average of 14.7%. Similarly, the statistical analysis conducted on geographies consisting of 485,828,470 people shows a poor negative correlation between the proportion of Immigrants from South America and poverty level among females in the United States with a correlation coefficient (R) of -0.165 and weighted average of 13.7%, a difference of 7.6%.
Female Poverty Correlation Summary
| Measurement | Alaska Native | Immigrants from South America |
| Minimum | 2.1% | 4.6% |
| Maximum | 100.0% | 23.5% |
| Range | 97.9% | 18.9% |
| Mean | 25.6% | 13.3% |
| Median | 18.2% | 13.3% |
| Interquartile 25% (IQ1) | 12.4% | 11.8% |
| Interquartile 75% (IQ3) | 33.6% | 15.0% |
| Interquartile Range (IQR) | 21.2% | 3.2% |
| Standard Deviation (Sample) | 20.2% | 3.5% |
| Standard Deviation (Population) | 20.0% | 3.5% |
Similar Demographics by Female Poverty
Demographics Similar to Alaska Natives by Female Poverty
In terms of female poverty, the demographic groups most similar to Alaska Natives are Nigerian (14.8%, a difference of 0.10%), Ghanaian (14.7%, a difference of 0.20%), German Russian (14.7%, a difference of 0.27%), Immigrants from Nigeria (14.7%, a difference of 0.41%), and Osage (14.8%, a difference of 0.41%).
| Demographics | Rating | Rank | Female Poverty |
| Immigrants | Africa | 3.3 /100 | #223 | Tragic 14.5% |
| Americans | 2.8 /100 | #224 | Tragic 14.6% |
| Immigrants | Micronesia | 2.8 /100 | #225 | Tragic 14.6% |
| Immigrants | Eritrea | 2.4 /100 | #226 | Tragic 14.6% |
| Immigrants | Nigeria | 2.1 /100 | #227 | Tragic 14.7% |
| German Russians | 2.0 /100 | #228 | Tragic 14.7% |
| Ghanaians | 1.9 /100 | #229 | Tragic 14.7% |
| Alaska Natives | 1.8 /100 | #230 | Tragic 14.7% |
| Nigerians | 1.7 /100 | #231 | Tragic 14.8% |
| Osage | 1.5 /100 | #232 | Tragic 14.8% |
| Immigrants | Saudi Arabia | 1.4 /100 | #233 | Tragic 14.8% |
| Fijians | 1.1 /100 | #234 | Tragic 14.9% |
| Immigrants | Laos | 0.9 /100 | #235 | Tragic 15.0% |
| Cree | 0.7 /100 | #236 | Tragic 15.1% |
| French American Indians | 0.6 /100 | #237 | Tragic 15.1% |
Demographics Similar to Immigrants from South America by Female Poverty
In terms of female poverty, the demographic groups most similar to Immigrants from South America are Delaware (13.7%, a difference of 0.060%), Iraqi (13.7%, a difference of 0.12%), Immigrants from Costa Rica (13.7%, a difference of 0.14%), South American Indian (13.7%, a difference of 0.19%), and Immigrants from Kuwait (13.7%, a difference of 0.23%).
| Demographics | Rating | Rank | Female Poverty |
| Hawaiians | 39.9 /100 | #188 | Fair 13.6% |
| Uruguayans | 39.8 /100 | #189 | Fair 13.6% |
| Sierra Leoneans | 33.1 /100 | #190 | Fair 13.7% |
| Immigrants | Kuwait | 32.7 /100 | #191 | Fair 13.7% |
| Immigrants | Costa Rica | 31.9 /100 | #192 | Fair 13.7% |
| Iraqis | 31.8 /100 | #193 | Fair 13.7% |
| Delaware | 31.1 /100 | #194 | Fair 13.7% |
| Immigrants | South America | 30.6 /100 | #195 | Fair 13.7% |
| South American Indians | 28.9 /100 | #196 | Fair 13.7% |
| Arabs | 28.6 /100 | #197 | Fair 13.7% |
| Immigrants | Uganda | 28.5 /100 | #198 | Fair 13.7% |
| Immigrants | Lebanon | 25.6 /100 | #199 | Fair 13.8% |
| Spanish | 21.4 /100 | #200 | Fair 13.9% |
| Immigrants | Kenya | 21.1 /100 | #201 | Fair 13.9% |
| Hmong | 21.1 /100 | #202 | Fair 13.9% |