Alaska Native vs Immigrants from Central America Family Poverty
COMPARE
Alaska Native
Immigrants from Central America
Family Poverty
Family Poverty Comparison
Alaska Natives
Immigrants from Central America
10.4%
FAMILY POVERTY
1.0/ 100
METRIC RATING
242nd/ 347
METRIC RANK
12.1%
FAMILY POVERTY
0.0/ 100
METRIC RATING
312th/ 347
METRIC RANK
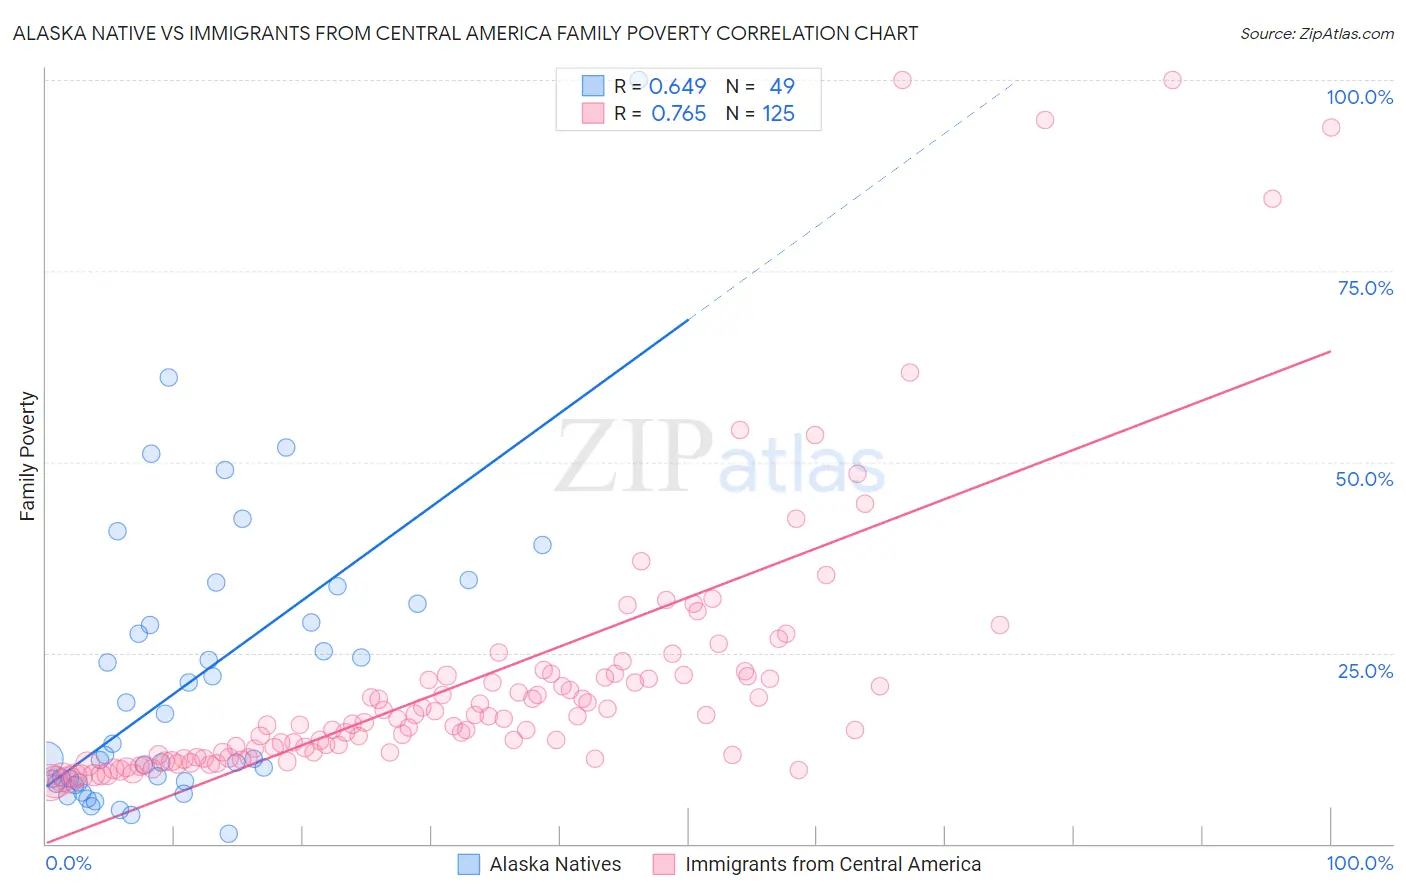
Alaska Native vs Immigrants from Central America Family Poverty Correlation Chart
The statistical analysis conducted on geographies consisting of 76,710,212 people shows a significant positive correlation between the proportion of Alaska Natives and poverty level among families in the United States with a correlation coefficient (R) of 0.649 and weighted average of 10.4%. Similarly, the statistical analysis conducted on geographies consisting of 533,860,839 people shows a strong positive correlation between the proportion of Immigrants from Central America and poverty level among families in the United States with a correlation coefficient (R) of 0.765 and weighted average of 12.1%, a difference of 16.7%.
Family Poverty Correlation Summary
| Measurement | Alaska Native | Immigrants from Central America |
| Minimum | 1.3% | 8.0% |
| Maximum | 100.0% | 100.0% |
| Range | 98.7% | 92.0% |
| Mean | 21.3% | 21.3% |
| Median | 11.6% | 15.8% |
| Interquartile 25% (IQ1) | 8.1% | 11.3% |
| Interquartile 75% (IQ3) | 30.2% | 22.0% |
| Interquartile Range (IQR) | 22.0% | 10.7% |
| Standard Deviation (Sample) | 18.8% | 17.9% |
| Standard Deviation (Population) | 18.6% | 17.8% |
Similar Demographics by Family Poverty
Demographics Similar to Alaska Natives by Family Poverty
In terms of family poverty, the demographic groups most similar to Alaska Natives are Nepalese (10.4%, a difference of 0.48%), Ghanaian (10.3%, a difference of 0.86%), Cree (10.5%, a difference of 0.94%), Immigrants from the Azores (10.3%, a difference of 0.95%), and Potawatomi (10.2%, a difference of 1.3%).
| Demographics | Rating | Rank | Family Poverty |
| Nigerians | 2.0 /100 | #235 | Tragic 10.1% |
| Immigrants | Nigeria | 1.9 /100 | #236 | Tragic 10.2% |
| Immigrants | Laos | 1.7 /100 | #237 | Tragic 10.2% |
| French American Indians | 1.5 /100 | #238 | Tragic 10.2% |
| Potawatomi | 1.5 /100 | #239 | Tragic 10.2% |
| Immigrants | Azores | 1.4 /100 | #240 | Tragic 10.3% |
| Ghanaians | 1.3 /100 | #241 | Tragic 10.3% |
| Alaska Natives | 1.0 /100 | #242 | Tragic 10.4% |
| Nepalese | 0.8 /100 | #243 | Tragic 10.4% |
| Cree | 0.7 /100 | #244 | Tragic 10.5% |
| Immigrants | Burma/Myanmar | 0.6 /100 | #245 | Tragic 10.5% |
| Cherokee | 0.5 /100 | #246 | Tragic 10.6% |
| Liberians | 0.4 /100 | #247 | Tragic 10.6% |
| Nicaraguans | 0.4 /100 | #248 | Tragic 10.6% |
| Cubans | 0.4 /100 | #249 | Tragic 10.6% |
Demographics Similar to Immigrants from Central America by Family Poverty
In terms of family poverty, the demographic groups most similar to Immigrants from Central America are Ute (12.1%, a difference of 0.38%), Immigrants from Caribbean (12.2%, a difference of 0.68%), Kiowa (12.2%, a difference of 1.2%), Hispanic or Latino (12.0%, a difference of 1.2%), and Immigrants from Guatemala (12.0%, a difference of 1.2%).
| Demographics | Rating | Rank | Family Poverty |
| Mexicans | 0.0 /100 | #305 | Tragic 11.8% |
| Cajuns | 0.0 /100 | #306 | Tragic 11.9% |
| Immigrants | Congo | 0.0 /100 | #307 | Tragic 11.9% |
| Seminole | 0.0 /100 | #308 | Tragic 11.9% |
| Hispanics or Latinos | 0.0 /100 | #309 | Tragic 12.0% |
| Immigrants | Guatemala | 0.0 /100 | #310 | Tragic 12.0% |
| Ute | 0.0 /100 | #311 | Tragic 12.1% |
| Immigrants | Central America | 0.0 /100 | #312 | Tragic 12.1% |
| Immigrants | Caribbean | 0.0 /100 | #313 | Tragic 12.2% |
| Kiowa | 0.0 /100 | #314 | Tragic 12.2% |
| Immigrants | Mexico | 0.0 /100 | #315 | Tragic 12.3% |
| Hondurans | 0.0 /100 | #316 | Tragic 12.4% |
| Immigrants | Grenada | 0.0 /100 | #317 | Tragic 12.4% |
| U.S. Virgin Islanders | 0.0 /100 | #318 | Tragic 12.4% |
| British West Indians | 0.0 /100 | #319 | Tragic 12.4% |