African vs Swiss Single Father Poverty
COMPARE
African
Swiss
Single Father Poverty
Single Father Poverty Comparison
Africans
Swiss
18.3%
SINGLE FATHER POVERTY
0.0/ 100
METRIC RATING
298th/ 347
METRIC RANK
17.3%
SINGLE FATHER POVERTY
0.5/ 100
METRIC RATING
261st/ 347
METRIC RANK
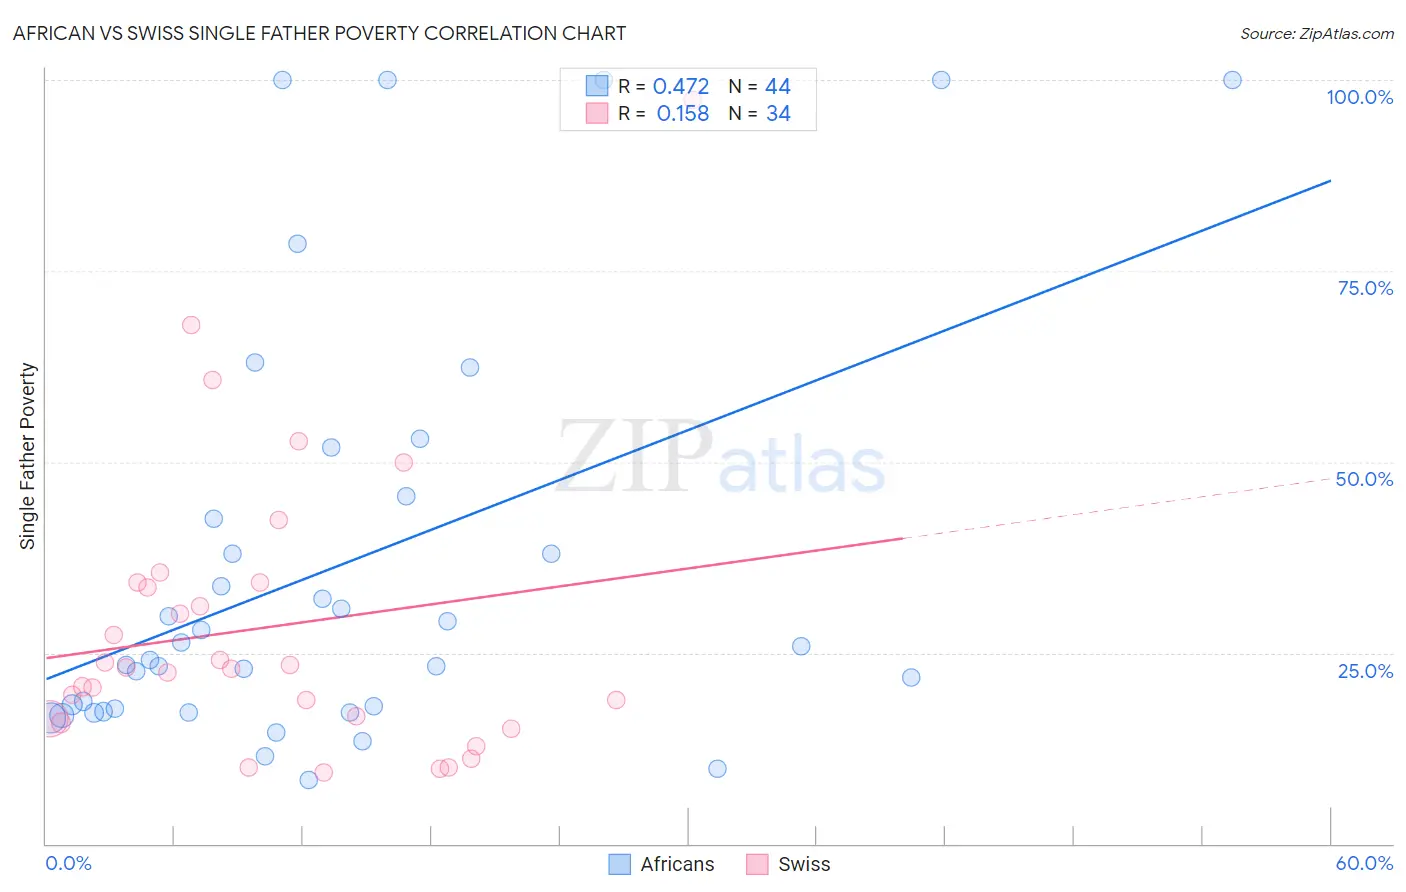
African vs Swiss Single Father Poverty Correlation Chart
The statistical analysis conducted on geographies consisting of 369,651,911 people shows a moderate positive correlation between the proportion of Africans and poverty level among single fathers in the United States with a correlation coefficient (R) of 0.472 and weighted average of 18.3%. Similarly, the statistical analysis conducted on geographies consisting of 347,944,226 people shows a poor positive correlation between the proportion of Swiss and poverty level among single fathers in the United States with a correlation coefficient (R) of 0.158 and weighted average of 17.3%, a difference of 6.1%.
Single Father Poverty Correlation Summary
| Measurement | African | Swiss |
| Minimum | 8.3% | 9.4% |
| Maximum | 100.0% | 97.4% |
| Range | 91.7% | 88.1% |
| Mean | 36.4% | 28.3% |
| Median | 25.0% | 23.0% |
| Interquartile 25% (IQ1) | 17.5% | 16.3% |
| Interquartile 75% (IQ3) | 44.0% | 34.2% |
| Interquartile Range (IQR) | 26.5% | 17.9% |
| Standard Deviation (Sample) | 27.5% | 19.0% |
| Standard Deviation (Population) | 27.1% | 18.7% |
Similar Demographics by Single Father Poverty
Demographics Similar to Africans by Single Father Poverty
In terms of single father poverty, the demographic groups most similar to Africans are White/Caucasian (18.4%, a difference of 0.21%), Immigrants from Dominican Republic (18.4%, a difference of 0.53%), French (18.2%, a difference of 0.75%), Hungarian (18.5%, a difference of 0.75%), and Comanche (18.5%, a difference of 0.86%).
| Demographics | Rating | Rank | Single Father Poverty |
| Alaskan Athabascans | 0.0 /100 | #291 | Tragic 18.1% |
| Immigrants | Bahamas | 0.0 /100 | #292 | Tragic 18.1% |
| Alaska Natives | 0.0 /100 | #293 | Tragic 18.1% |
| U.S. Virgin Islanders | 0.0 /100 | #294 | Tragic 18.1% |
| Yakama | 0.0 /100 | #295 | Tragic 18.1% |
| Seminole | 0.0 /100 | #296 | Tragic 18.1% |
| French | 0.0 /100 | #297 | Tragic 18.2% |
| Africans | 0.0 /100 | #298 | Tragic 18.3% |
| Whites/Caucasians | 0.0 /100 | #299 | Tragic 18.4% |
| Immigrants | Dominican Republic | 0.0 /100 | #300 | Tragic 18.4% |
| Hungarians | 0.0 /100 | #301 | Tragic 18.5% |
| Comanche | 0.0 /100 | #302 | Tragic 18.5% |
| Celtics | 0.0 /100 | #303 | Tragic 18.5% |
| Ute | 0.0 /100 | #304 | Tragic 18.5% |
| Blackfeet | 0.0 /100 | #305 | Tragic 18.5% |
Demographics Similar to Swiss by Single Father Poverty
In terms of single father poverty, the demographic groups most similar to Swiss are Immigrants from Zaire (17.3%, a difference of 0.13%), Lithuanian (17.3%, a difference of 0.14%), Spaniard (17.2%, a difference of 0.22%), Slovene (17.3%, a difference of 0.34%), and Polish (17.3%, a difference of 0.35%).
| Demographics | Rating | Rank | Single Father Poverty |
| Immigrants | Honduras | 0.9 /100 | #254 | Tragic 17.1% |
| Sierra Leoneans | 0.8 /100 | #255 | Tragic 17.2% |
| Immigrants | Haiti | 0.8 /100 | #256 | Tragic 17.2% |
| Immigrants | Albania | 0.7 /100 | #257 | Tragic 17.2% |
| Albanians | 0.7 /100 | #258 | Tragic 17.2% |
| Immigrants | Jamaica | 0.7 /100 | #259 | Tragic 17.2% |
| Spaniards | 0.6 /100 | #260 | Tragic 17.2% |
| Swiss | 0.5 /100 | #261 | Tragic 17.3% |
| Immigrants | Zaire | 0.4 /100 | #262 | Tragic 17.3% |
| Lithuanians | 0.4 /100 | #263 | Tragic 17.3% |
| Slovenes | 0.3 /100 | #264 | Tragic 17.3% |
| Poles | 0.3 /100 | #265 | Tragic 17.3% |
| Jamaicans | 0.3 /100 | #266 | Tragic 17.3% |
| Haitians | 0.3 /100 | #267 | Tragic 17.3% |
| Immigrants | Caribbean | 0.3 /100 | #268 | Tragic 17.4% |