Afghan vs Vietnamese Seniors Poverty Over the Age of 65

COMPARE

Afghan
Race
Ancestry
AfghanAfricanAlaska NativeAlaskan AthabascanAlbanianAleutAlsatianAmericanApacheArabArapahoArgentineanArmenianAssyrian/Chaldean/SyriacAustralianAustrianBahamianBangladeshiBarbadianBasqueBelgianBelizeanBermudanBhutaneseBlackfeetBolivianBrazilianBritishBritish West IndianBulgarianBurmeseCajunCambodianCanadianCape VerdeanCarpatho RusynCelticCentral AmericanCentral American IndianCherokeeCheyenneChickasawChileanChineseChippewaChoctawColombianColvilleComancheCosta RicanCreeCreekCroatianCrowCubanCypriotCzechCzechoslovakianDanishDelawareDominicanDutchDutch West IndianEastern EuropeanEcuadorianEgyptianEnglishEstonianEthiopianEuropeanFijianFilipinoFinnishFrenchFrench American IndianFrench CanadianGermanGerman RussianGhanaianGreekGuamanian/ChamorroGuatemalanGuyaneseHaitianHmongHonduranHopiHoumaHungarianIcelanderIndian (Asian)IndonesianInupiatIranianIraqiIrishIroquoisIsraeliItalianJamaicanJapaneseJordanianKenyanKiowaKoreanLaotianLatvianLebaneseLiberianLithuanianLumbeeLuxembourgerMacedonianMalaysianMalteseMarshalleseMenomineeMexicanMexican American IndianMongolianMoroccanNative HawaiianNavajoNepaleseNew ZealanderNicaraguanNigerianNorthern EuropeanNorwegianOkinawanOsageOttawaPaiutePakistaniPalestinianPanamanianParaguayanPennsylvania GermanPeruvianPimaPolishPortuguesePotawatomiPuebloPuerto RicanPuget Sound SalishRomanianRussianSalvadoranSamoanScandinavianScotch-IrishScottishSeminoleSenegaleseSerbianShoshoneSierra LeoneanSiouxSlavicSlovakSloveneSomaliSouth AfricanSouth AmericanSouth American IndianSoviet UnionSpaniardSpanishSpanish AmericanSpanish American IndianSri LankanSubsaharan AfricanSudaneseSwedishSwissSyrianTaiwaneseThaiTlingit-HaidaTohono O'OdhamTonganTrinidadian and TobagonianTsimshianTurkishU.S. Virgin IslanderUgandanUkrainianUruguayanUteVenezuelanWelshWest IndianYakamaYaquiYugoslavianYumanYup'ikZimbabwean
Immigration
NonimmigrantsImmigrantsAfghanistanAfricaAlbaniaArgentinaArmeniaAsiaAustraliaAustriaBahamasBangladeshBarbadosBelarusBelgiumBelizeBoliviaBosnia and HerzegovinaBrazilBulgariaBurma/MyanmarCabo VerdeCambodiaCameroonCanadaCaribbeanCentral AmericaChileChinaColombiaCongoCosta RicaCroatiaCubaCzechoslovakiaDenmarkDominicaDominican RepublicEastern AfricaEastern AsiaEastern EuropeEcuadorEgyptEl SalvadorEnglandEritreaEthiopiaEuropeFijiFranceGermanyGhanaGreeceGrenadaGuatemalaGuyanaHaitiHondurasHong KongHungaryIndiaIndonesiaIranIraqIrelandIsraelItalyJamaicaJapanJordanKazakhstanKenyaKoreaKuwaitLaosLatin AmericaLatviaLebanonLiberiaLithuaniaMalaysiaMexicoMicronesiaMiddle AfricaMoldovaMoroccoNepalNetherlandsNicaraguaNigeriaNorth AmericaNorth MacedoniaNorthern AfricaNorthern EuropeNorwayOceaniaPakistanPanamaPeruPhilippinesPolandPortugalRomaniaRussiaSaudi ArabiaScotlandSenegalSerbiaSierra LeoneSingaporeSomaliaSouth AfricaSouth AmericaSouth Central AsiaSouth Eastern AsiaSouthern EuropeSpainSri LankaSt. Vincent and the GrenadinesSudanSwedenSwitzerlandSyriaTaiwanThailandTrinidad and TobagoTurkeyUgandaUkraineUruguayUzbekistanVenezuelaVietnamWest IndiesWestern AfricaWestern AsiaWestern EuropeYemenZaireZimbabweAzores
Vietnamese
Race
Ancestry
AfricanAlaska NativeAlaskan AthabascanAlbanianAleutAlsatianAmericanApacheArabArapahoArgentineanArmenianAssyrian/Chaldean/SyriacAustralianAustrianBahamianBangladeshiBarbadianBasqueBelgianBelizeanBermudanBhutaneseBlackfeetBolivianBrazilianBritishBritish West IndianBulgarianBurmeseCajunCambodianCanadianCape VerdeanCarpatho RusynCelticCentral AmericanCentral American IndianCherokeeCheyenneChickasawChileanChineseChippewaChoctawColombianColvilleComancheCosta RicanCreeCreekCroatianCrowCubanCypriotCzechCzechoslovakianDanishDelawareDominicanDutchDutch West IndianEastern EuropeanEcuadorianEgyptianEnglishEstonianEthiopianEuropeanFijianFilipinoFinnishFrenchFrench American IndianFrench CanadianGermanGerman RussianGhanaianGreekGuamanian/ChamorroGuatemalanGuyaneseHaitianHmongHonduranHopiHoumaHungarianIcelanderIndian (Asian)IndonesianInupiatIranianIraqiIrishIroquoisIsraeliItalianJamaicanJapaneseJordanianKenyanKiowaKoreanLaotianLatvianLebaneseLiberianLithuanianLumbeeLuxembourgerMacedonianMalaysianMalteseMarshalleseMenomineeMexicanMexican American IndianMongolianMoroccanNative HawaiianNavajoNepaleseNew ZealanderNicaraguanNigerianNorthern EuropeanNorwegianOkinawanOsageOttawaPaiutePakistaniPalestinianPanamanianParaguayanPennsylvania GermanPeruvianPimaPolishPortuguesePotawatomiPuebloPuerto RicanPuget Sound SalishRomanianRussianSalvadoranSamoanScandinavianScotch-IrishScottishSeminoleSenegaleseSerbianShoshoneSierra LeoneanSiouxSlavicSlovakSloveneSomaliSouth AfricanSouth AmericanSouth American IndianSoviet UnionSpaniardSpanishSpanish AmericanSpanish American IndianSri LankanSubsaharan AfricanSudaneseSwedishSwissSyrianTaiwaneseThaiTlingit-HaidaTohono O'OdhamTonganTrinidadian and TobagonianTsimshianTurkishU.S. Virgin IslanderUgandanUkrainianUruguayanUteVenezuelanVietnameseWelshWest IndianYakamaYaquiYugoslavianYumanYup'ikZimbabwean
Immigration
NonimmigrantsImmigrantsAfghanistanAfricaAlbaniaArgentinaArmeniaAsiaAustraliaAustriaBahamasBangladeshBarbadosBelarusBelgiumBelizeBoliviaBosnia and HerzegovinaBrazilBulgariaBurma/MyanmarCabo VerdeCambodiaCameroonCanadaCaribbeanCentral AmericaChileChinaColombiaCongoCosta RicaCroatiaCubaCzechoslovakiaDenmarkDominicaDominican RepublicEastern AfricaEastern AsiaEastern EuropeEcuadorEgyptEl SalvadorEnglandEritreaEthiopiaEuropeFijiFranceGermanyGhanaGreeceGrenadaGuatemalaGuyanaHaitiHondurasHong KongHungaryIndiaIndonesiaIranIraqIrelandIsraelItalyJamaicaJapanJordanKazakhstanKenyaKoreaKuwaitLaosLatin AmericaLatviaLebanonLiberiaLithuaniaMalaysiaMexicoMicronesiaMiddle AfricaMoldovaMoroccoNepalNetherlandsNicaraguaNigeriaNorth AmericaNorth MacedoniaNorthern AfricaNorthern EuropeNorwayOceaniaPakistanPanamaPeruPhilippinesPolandPortugalRomaniaRussiaSaudi ArabiaScotlandSenegalSerbiaSierra LeoneSingaporeSomaliaSouth AfricaSouth AmericaSouth Central AsiaSouth Eastern AsiaSouthern EuropeSpainSri LankaSt. Vincent and the GrenadinesSudanSwedenSwitzerlandSyriaTaiwanThailandTrinidad and TobagoTurkeyUgandaUkraineUruguayUzbekistanVenezuelaVietnamWest IndiesWestern AfricaWestern AsiaWestern EuropeYemenZaireZimbabweAzores
Seniors Poverty Over the Age of 65
Income
Poverty
Unemployment
Labor Participation
Family Structure
Vehicle Availability
Education Level
Disability

Seniors Poverty Over the Age of 65 Comparison

Afghans

Vietnamese

Exceptional
Tragic
9.8%
SENIORS POVERTY OVER THE AGE OF 65
99.2/ 100
METRIC RATING
55th/ 347
METRIC RANK
14.0%
SENIORS POVERTY OVER THE AGE OF 65
0.0/ 100
METRIC RATING
297th/ 347
METRIC RANK

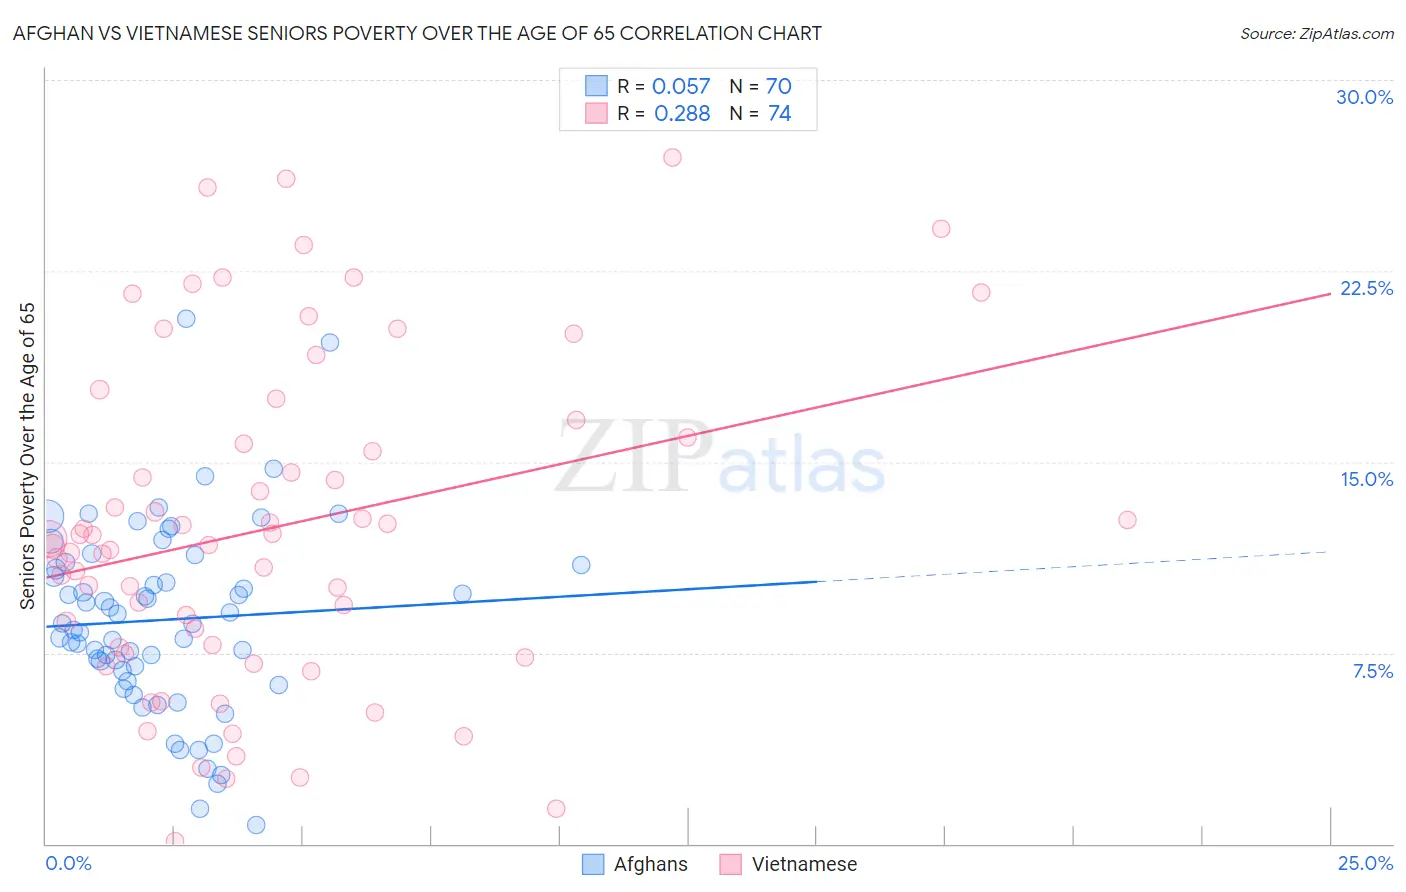
Afghan vs Vietnamese Seniors Poverty Over the Age of 65 Correlation Chart

The statistical analysis conducted on geographies consisting of 148,656,198 people shows a slight positive correlation between the proportion of Afghans and poverty level among seniors over the age of 65 in the United States with a correlation coefficient (R) of 0.057 and weighted average of 9.8%. Similarly, the statistical analysis conducted on geographies consisting of 170,418,192 people shows a weak positive correlation between the proportion of Vietnamese and poverty level among seniors over the age of 65 in the United States with a correlation coefficient (R) of 0.288 and weighted average of 14.0%, a difference of 42.8%.
Afghan vs Vietnamese Seniors Poverty Over the Age of 65

Seniors Poverty Over the Age of 65 Correlation Summary

MeasurementAfghanVietnamese
Minimum0.71%0.093%
Maximum20.6%27.0%
Range19.9%26.9%
Mean8.8%12.4%
Median8.7%11.9%
Interquartile 25% (IQ1)6.8%7.7%
Interquartile 75% (IQ3)11.0%15.9%
Interquartile Range (IQR)4.2%8.2%
Standard Deviation (Sample)3.7%6.4%
Standard Deviation (Population)3.7%6.4%

Similar Demographics by Seniors Poverty Over the Age of 65

Demographics Similar to Afghans by Seniors Poverty Over the Age of 65

In terms of seniors poverty over the age of 65, the demographic groups most similar to Afghans are Immigrants from England (9.8%, a difference of 0.12%), Immigrants from Northern Europe (9.8%, a difference of 0.13%), Slavic (9.8%, a difference of 0.19%), Bolivian (9.8%, a difference of 0.24%), and Filipino (9.7%, a difference of 0.29%).
DemographicsRating | RankSeniors Poverty Over the Age of 65
French
99.5
/100
|
#48
Exceptional
9.7%
Immigrants | Lithuania
99.4
/100
|
#49
Exceptional
9.7%
Hungarians
99.4
/100
|
#50
Exceptional
9.7%
Carpatho Rusyns
99.3
/100
|
#51
Exceptional
9.7%
Filipinos
99.3
/100
|
#52
Exceptional
9.7%
Slavs
99.2
/100
|
#53
Exceptional
9.8%
Immigrants | Northern Europe
99.2
/100
|
#54
Exceptional
9.8%
Afghans
99.2
/100
|
#55
Exceptional
9.8%
Immigrants | England
99.1
/100
|
#56
Exceptional
9.8%
Bolivians
99.1
/100
|
#57
Exceptional
9.8%
Serbians
99.1
/100
|
#58
Exceptional
9.8%
Immigrants | Canada
99.0
/100
|
#59
Exceptional
9.8%
Celtics
99.0
/100
|
#60
Exceptional
9.8%
Iranians
98.9
/100
|
#61
Exceptional
9.8%
French Canadians
98.9
/100
|
#62
Exceptional
9.8%

Demographics Similar to Vietnamese by Seniors Poverty Over the Age of 65

In terms of seniors poverty over the age of 65, the demographic groups most similar to Vietnamese are Immigrants from Jamaica (13.9%, a difference of 0.070%), Immigrants from Belize (14.0%, a difference of 0.28%), Apache (13.9%, a difference of 0.34%), Ecuadorian (14.0%, a difference of 0.35%), and Immigrants from Uzbekistan (14.0%, a difference of 0.43%).
DemographicsRating | RankSeniors Poverty Over the Age of 65
Immigrants | Central America
0.0
/100
|
#290
Tragic
13.6%
Blacks/African Americans
0.0
/100
|
#291
Tragic
13.7%
Spanish American Indians
0.0
/100
|
#292
Tragic
13.8%
Immigrants | Guatemala
0.0
/100
|
#293
Tragic
13.8%
Cheyenne
0.0
/100
|
#294
Tragic
13.9%
Apache
0.0
/100
|
#295
Tragic
13.9%
Immigrants | Jamaica
0.0
/100
|
#296
Tragic
13.9%
Vietnamese
0.0
/100
|
#297
Tragic
14.0%
Immigrants | Belize
0.0
/100
|
#298
Tragic
14.0%
Ecuadorians
0.0
/100
|
#299
Tragic
14.0%
Immigrants | Uzbekistan
0.0
/100
|
#300
Tragic
14.0%
U.S. Virgin Islanders
0.0
/100
|
#301
Tragic
14.0%
Yup'ik
0.0
/100
|
#302
Tragic
14.1%
Immigrants | Bangladesh
0.0
/100
|
#303
Tragic
14.1%
West Indians
0.0
/100
|
#304
Tragic
14.1%