Afghan vs Immigrants from Belgium Male Poverty
COMPARE
Afghan
Immigrants from Belgium
Male Poverty
Male Poverty Comparison
Afghans
Immigrants from Belgium
10.9%
MALE POVERTY
71.9/ 100
METRIC RATING
143rd/ 347
METRIC RANK
10.3%
MALE POVERTY
96.8/ 100
METRIC RATING
77th/ 347
METRIC RANK
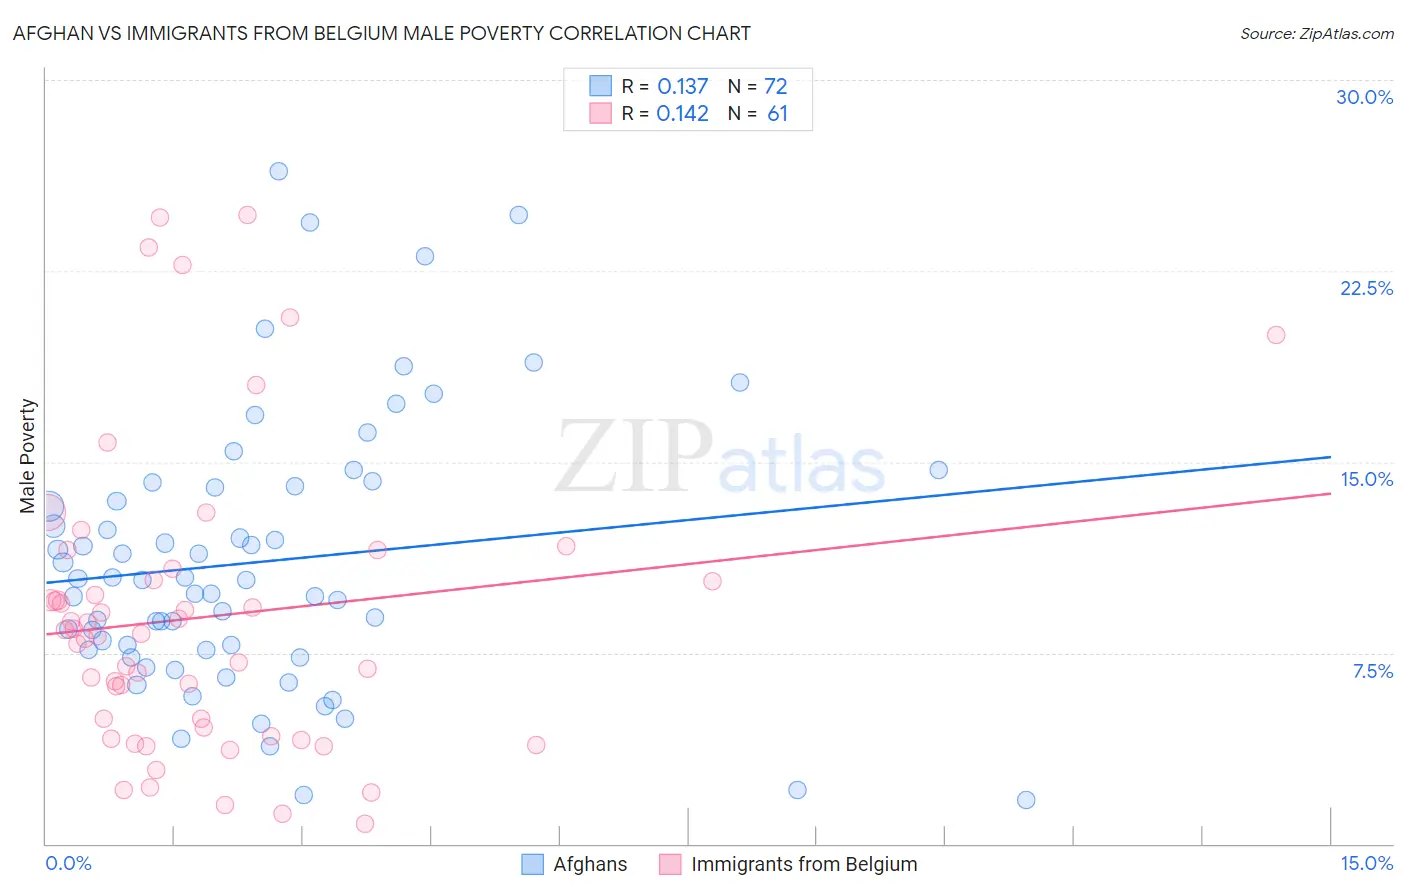
Afghan vs Immigrants from Belgium Male Poverty Correlation Chart
The statistical analysis conducted on geographies consisting of 148,780,421 people shows a poor positive correlation between the proportion of Afghans and poverty level among males in the United States with a correlation coefficient (R) of 0.137 and weighted average of 10.9%. Similarly, the statistical analysis conducted on geographies consisting of 146,693,310 people shows a poor positive correlation between the proportion of Immigrants from Belgium and poverty level among males in the United States with a correlation coefficient (R) of 0.142 and weighted average of 10.3%, a difference of 6.6%.
Male Poverty Correlation Summary
| Measurement | Afghan | Immigrants from Belgium |
| Minimum | 1.7% | 0.79% |
| Maximum | 26.4% | 24.7% |
| Range | 24.7% | 23.9% |
| Mean | 11.1% | 8.9% |
| Median | 10.4% | 8.3% |
| Interquartile 25% (IQ1) | 7.6% | 4.4% |
| Interquartile 75% (IQ3) | 14.0% | 10.6% |
| Interquartile Range (IQR) | 6.4% | 6.2% |
| Standard Deviation (Sample) | 5.3% | 5.8% |
| Standard Deviation (Population) | 5.3% | 5.8% |
Similar Demographics by Male Poverty
Demographics Similar to Afghans by Male Poverty
In terms of male poverty, the demographic groups most similar to Afghans are Samoan (10.9%, a difference of 0.020%), Immigrants from Germany (10.9%, a difference of 0.040%), Syrian (10.9%, a difference of 0.070%), Basque (10.9%, a difference of 0.34%), and Icelander (11.0%, a difference of 0.41%).
| Demographics | Rating | Rank | Male Poverty |
| Immigrants | Israel | 80.9 /100 | #136 | Excellent 10.8% |
| Immigrants | Switzerland | 79.2 /100 | #137 | Good 10.8% |
| Yugoslavians | 78.2 /100 | #138 | Good 10.8% |
| Immigrants | Jordan | 77.5 /100 | #139 | Good 10.8% |
| Tlingit-Haida | 76.1 /100 | #140 | Good 10.9% |
| Immigrants | France | 75.8 /100 | #141 | Good 10.9% |
| Basques | 74.6 /100 | #142 | Good 10.9% |
| Afghans | 71.9 /100 | #143 | Good 10.9% |
| Samoans | 71.8 /100 | #144 | Good 10.9% |
| Immigrants | Germany | 71.6 /100 | #145 | Good 10.9% |
| Syrians | 71.4 /100 | #146 | Good 10.9% |
| Icelanders | 68.5 /100 | #147 | Good 11.0% |
| Armenians | 68.0 /100 | #148 | Good 11.0% |
| Immigrants | Venezuela | 67.9 /100 | #149 | Good 11.0% |
| Guamanians/Chamorros | 67.6 /100 | #150 | Good 11.0% |
Demographics Similar to Immigrants from Belgium by Male Poverty
In terms of male poverty, the demographic groups most similar to Immigrants from Belgium are Irish (10.3%, a difference of 0.020%), Dutch (10.2%, a difference of 0.030%), Immigrants from Eastern Europe (10.2%, a difference of 0.040%), Carpatho Rusyn (10.2%, a difference of 0.040%), and Immigrants from Asia (10.2%, a difference of 0.12%).
| Demographics | Rating | Rank | Male Poverty |
| Paraguayans | 97.1 /100 | #70 | Exceptional 10.2% |
| Europeans | 97.1 /100 | #71 | Exceptional 10.2% |
| Immigrants | Canada | 97.1 /100 | #72 | Exceptional 10.2% |
| Immigrants | Asia | 97.0 /100 | #73 | Exceptional 10.2% |
| Immigrants | Eastern Europe | 96.9 /100 | #74 | Exceptional 10.2% |
| Carpatho Rusyns | 96.9 /100 | #75 | Exceptional 10.2% |
| Dutch | 96.9 /100 | #76 | Exceptional 10.2% |
| Immigrants | Belgium | 96.8 /100 | #77 | Exceptional 10.3% |
| Irish | 96.8 /100 | #78 | Exceptional 10.3% |
| Immigrants | North America | 96.5 /100 | #79 | Exceptional 10.3% |
| English | 96.4 /100 | #80 | Exceptional 10.3% |
| Belgians | 95.9 /100 | #81 | Exceptional 10.3% |
| Egyptians | 95.9 /100 | #82 | Exceptional 10.3% |
| Immigrants | Sweden | 95.7 /100 | #83 | Exceptional 10.3% |
| Czechoslovakians | 95.6 /100 | #84 | Exceptional 10.3% |