Zip Codes with the Highest Percentage of Population Employed in Transportation in Reading, PA
RELATED REPORTS & OPTIONS
Transportation
Reading
Compare Zip Codes
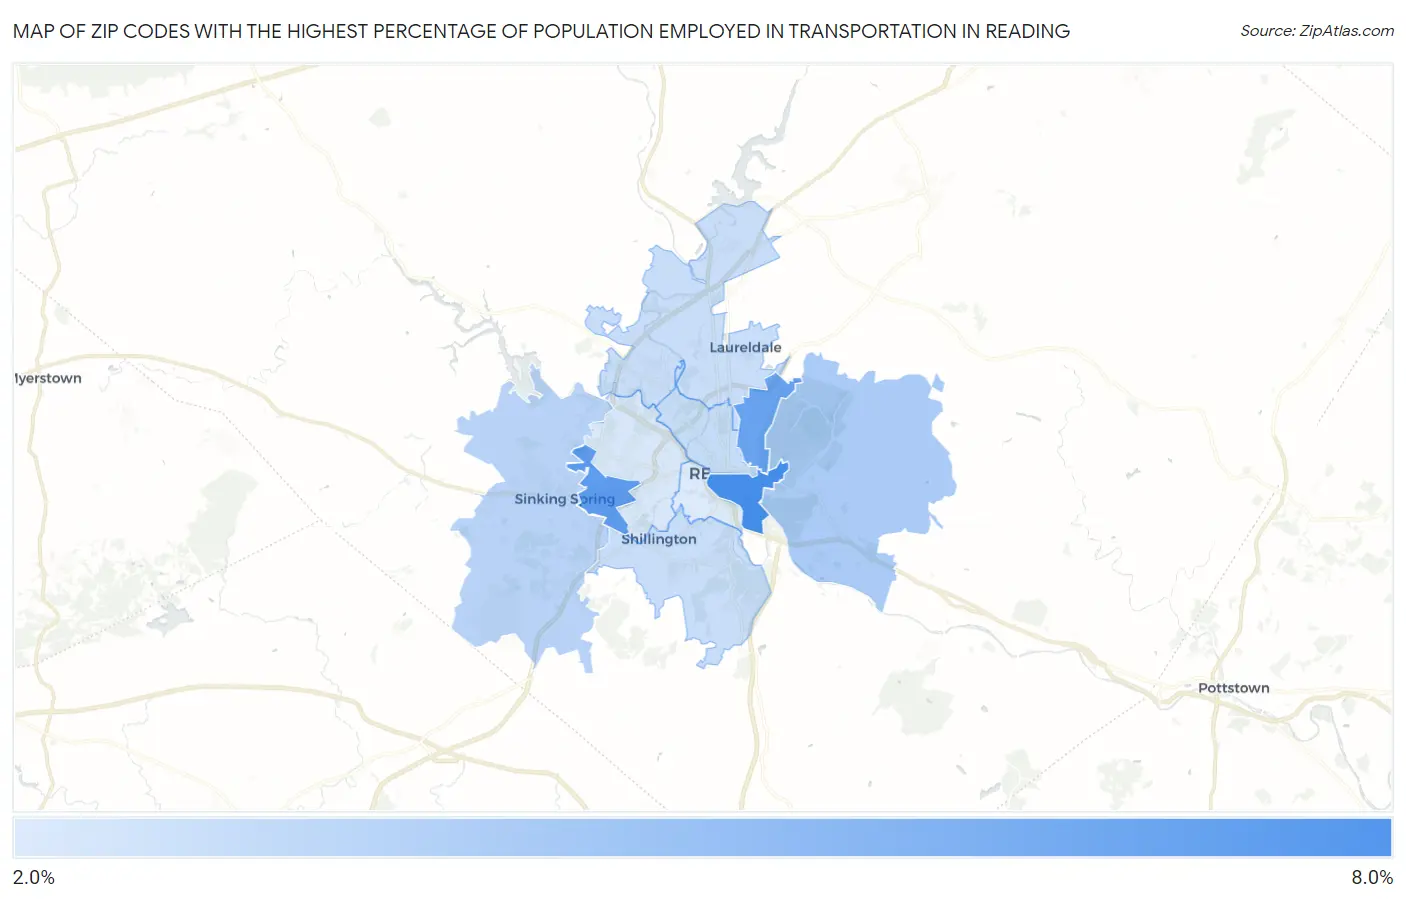
Map of Zip Codes with the Highest Percentage of Population Employed in Transportation in Reading
0.0%
8.0%
Zip Codes with the Highest Percentage of Population Employed in Transportation in Reading, PA
| Zip Code | % Employed | vs State | vs National | |
| 1. | 19602 | 6.7% | 3.8%(+2.89)#351 | 3.8%(+2.90)#5,828 |
| 2. | 19609 | 6.1% | 3.8%(+2.26)#435 | 3.8%(+2.26)#7,199 |
| 3. | 19604 | 5.8% | 3.8%(+1.99)#483 | 3.8%(+1.99)#7,856 |
| 4. | 19606 | 3.9% | 3.8%(+0.068)#905 | 3.8%(+0.071)#14,895 |
| 5. | 19608 | 3.5% | 3.8%(-0.336)#1,014 | 3.8%(-0.333)#16,885 |
| 6. | 19601 | 3.1% | 3.8%(-0.741)#1,115 | 3.8%(-0.738)#18,852 |
| 7. | 19605 | 3.0% | 3.8%(-0.786)#1,125 | 3.8%(-0.783)#19,067 |
| 8. | 19607 | 3.0% | 3.8%(-0.789)#1,128 | 3.8%(-0.786)#19,081 |
| 9. | 19610 | 2.6% | 3.8%(-1.26)#1,223 | 3.8%(-1.25)#21,264 |
| 10. | 19611 | 2.5% | 3.8%(-1.35)#1,240 | 3.8%(-1.35)#21,732 |
1
Common Questions
What are the Top 5 Zip Codes with the Highest Percentage of Population Employed in Transportation in Reading, PA?
Top 5 Zip Codes with the Highest Percentage of Population Employed in Transportation in Reading, PA are:
What zip code has the Highest Percentage of Population Employed in Transportation in Reading, PA?
19602 has the Highest Percentage of Population Employed in Transportation in Reading, PA with 6.7%.
What is the Percentage of Population Employed in Transportation in Reading, PA?
Percentage of Population Employed in Transportation in Reading is 4.2%.
What is the Percentage of Population Employed in Transportation in Pennsylvania?
Percentage of Population Employed in Transportation in Pennsylvania is 3.8%.
What is the Percentage of Population Employed in Transportation in the United States?
Percentage of Population Employed in Transportation in the United States is 3.8%.