Zip Codes with the Highest Percentage of Population Employed in Arts, Entertainment & Recreation in New Castle, PA
RELATED REPORTS & OPTIONS
Arts, Entertainment & Recreation
New Castle
Compare Zip Codes
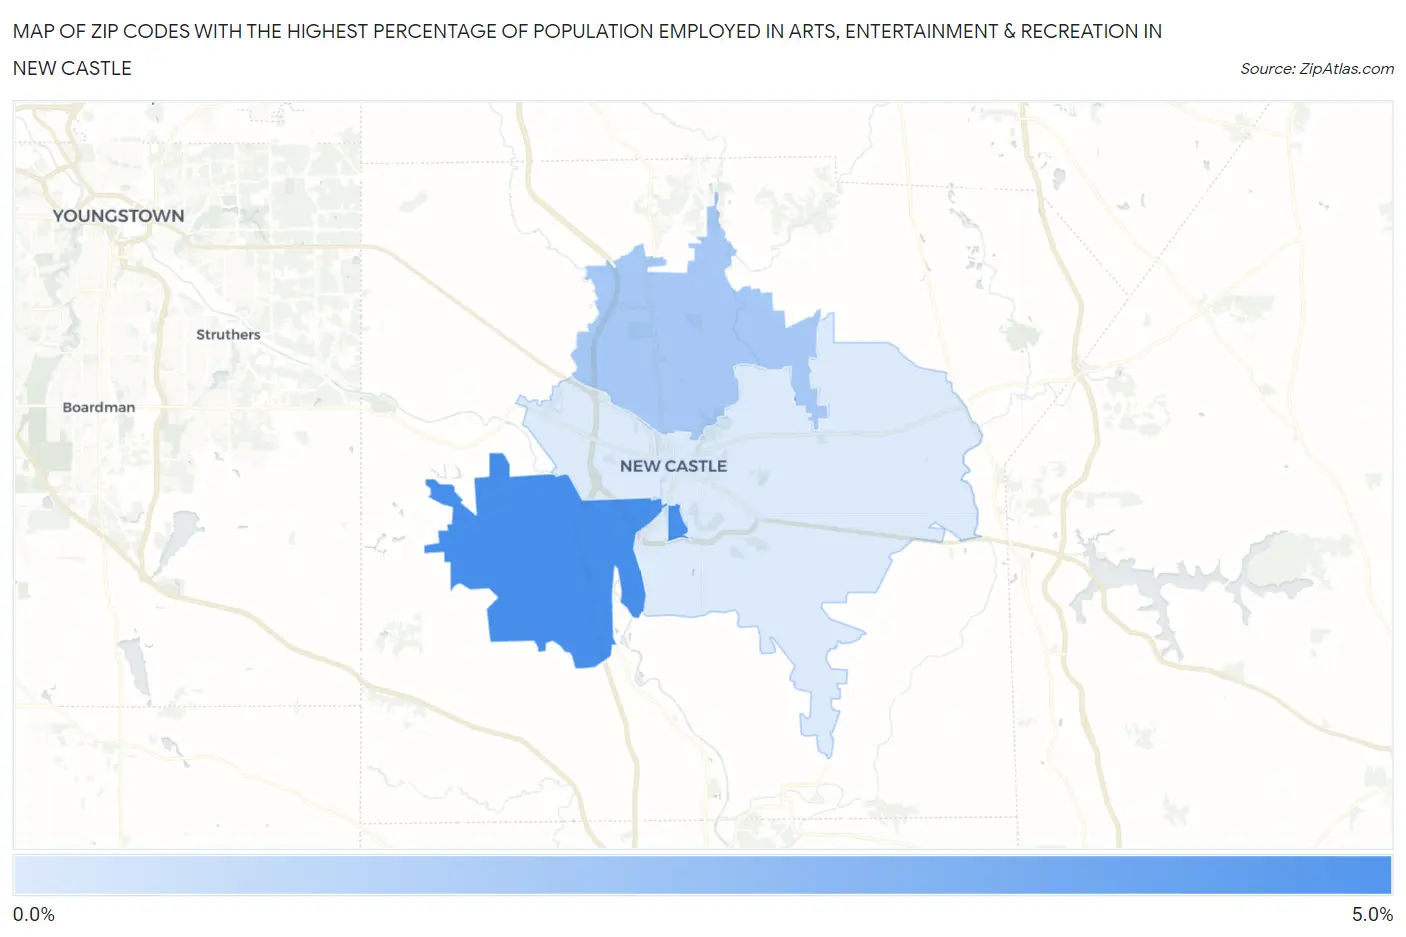
Map of Zip Codes with the Highest Percentage of Population Employed in Arts, Entertainment & Recreation in New Castle
0.0%
5.0%
Zip Codes with the Highest Percentage of Population Employed in Arts, Entertainment & Recreation in New Castle, PA
| Zip Code | % Employed | vs State | vs National | |
| 1. | 16102 | 4.3% | 1.8%(+2.52)#89 | 2.1%(+2.24)#2,938 |
| 2. | 16105 | 2.2% | 1.8%(+0.404)#379 | 2.1%(+0.121)#8,624 |
| 3. | 16101 | 0.96% | 1.8%(-0.843)#853 | 2.1%(-1.13)#17,297 |
1
Common Questions
What are the Top Zip Codes with the Highest Percentage of Population Employed in Arts, Entertainment & Recreation in New Castle, PA?
Top Zip Codes with the Highest Percentage of Population Employed in Arts, Entertainment & Recreation in New Castle, PA are:
What zip code has the Highest Percentage of Population Employed in Arts, Entertainment & Recreation in New Castle, PA?
16102 has the Highest Percentage of Population Employed in Arts, Entertainment & Recreation in New Castle, PA with 4.3%.
What is the Percentage of Population Employed in Arts, Entertainment & Recreation in New Castle, PA?
Percentage of Population Employed in Arts, Entertainment & Recreation in New Castle is 0.23%.
What is the Percentage of Population Employed in Arts, Entertainment & Recreation in Pennsylvania?
Percentage of Population Employed in Arts, Entertainment & Recreation in Pennsylvania is 1.8%.
What is the Percentage of Population Employed in Arts, Entertainment & Recreation in the United States?
Percentage of Population Employed in Arts, Entertainment & Recreation in the United States is 2.1%.