Zip Codes with the Highest Percentage of Population Employed in Sales & Related in Butler, PA
RELATED REPORTS & OPTIONS
Sales & Related
Butler
Compare Zip Codes
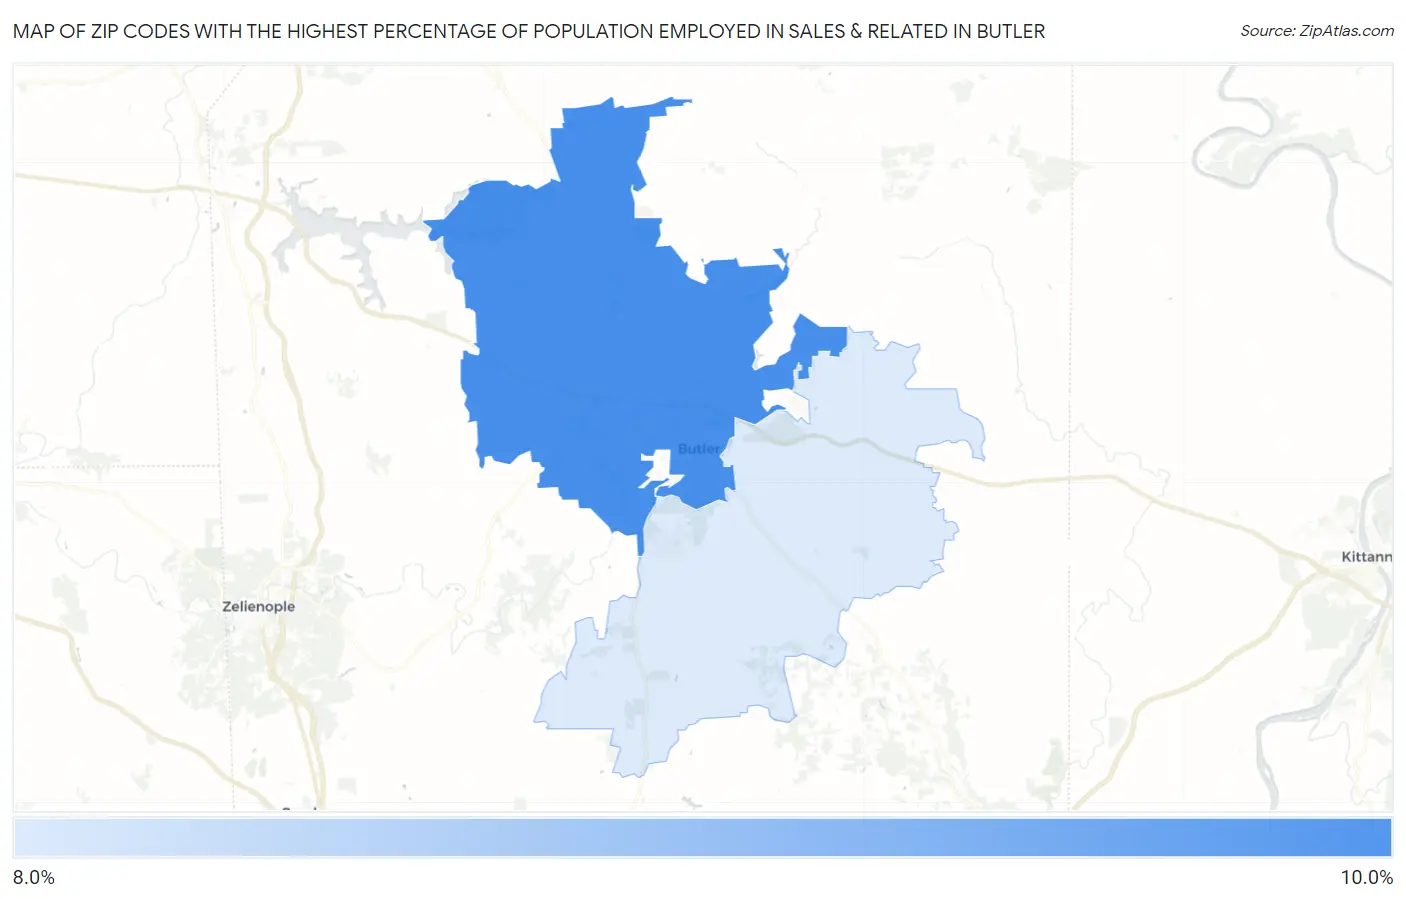
Map of Zip Codes with the Highest Percentage of Population Employed in Sales & Related in Butler
8.9%
9.8%
Zip Codes with the Highest Percentage of Population Employed in Sales & Related in Butler, PA
| Zip Code | % Employed | vs State | vs National | |
| 1. | 16001 | 9.8% | 9.1%(+0.612)#576 | 9.6%(+0.158)#11,846 |
| 2. | 16002 | 8.9% | 9.1%(-0.274)#746 | 9.6%(-0.728)#15,004 |
1
Common Questions
What are the Top Zip Codes with the Highest Percentage of Population Employed in Sales & Related in Butler, PA?
Top Zip Codes with the Highest Percentage of Population Employed in Sales & Related in Butler, PA are:
What zip code has the Highest Percentage of Population Employed in Sales & Related in Butler, PA?
16001 has the Highest Percentage of Population Employed in Sales & Related in Butler, PA with 9.8%.
What is the Percentage of Population Employed in Sales & Related in Butler, PA?
Percentage of Population Employed in Sales & Related in Butler is 10.1%.
What is the Percentage of Population Employed in Sales & Related in Pennsylvania?
Percentage of Population Employed in Sales & Related in Pennsylvania is 9.1%.
What is the Percentage of Population Employed in Sales & Related in the United States?
Percentage of Population Employed in Sales & Related in the United States is 9.6%.