Zip Codes with the Highest Percentage of Population Employed in Arts, Entertainment & Recreation in Springfield, OR
RELATED REPORTS & OPTIONS
Arts, Entertainment & Recreation
Springfield
Compare Zip Codes
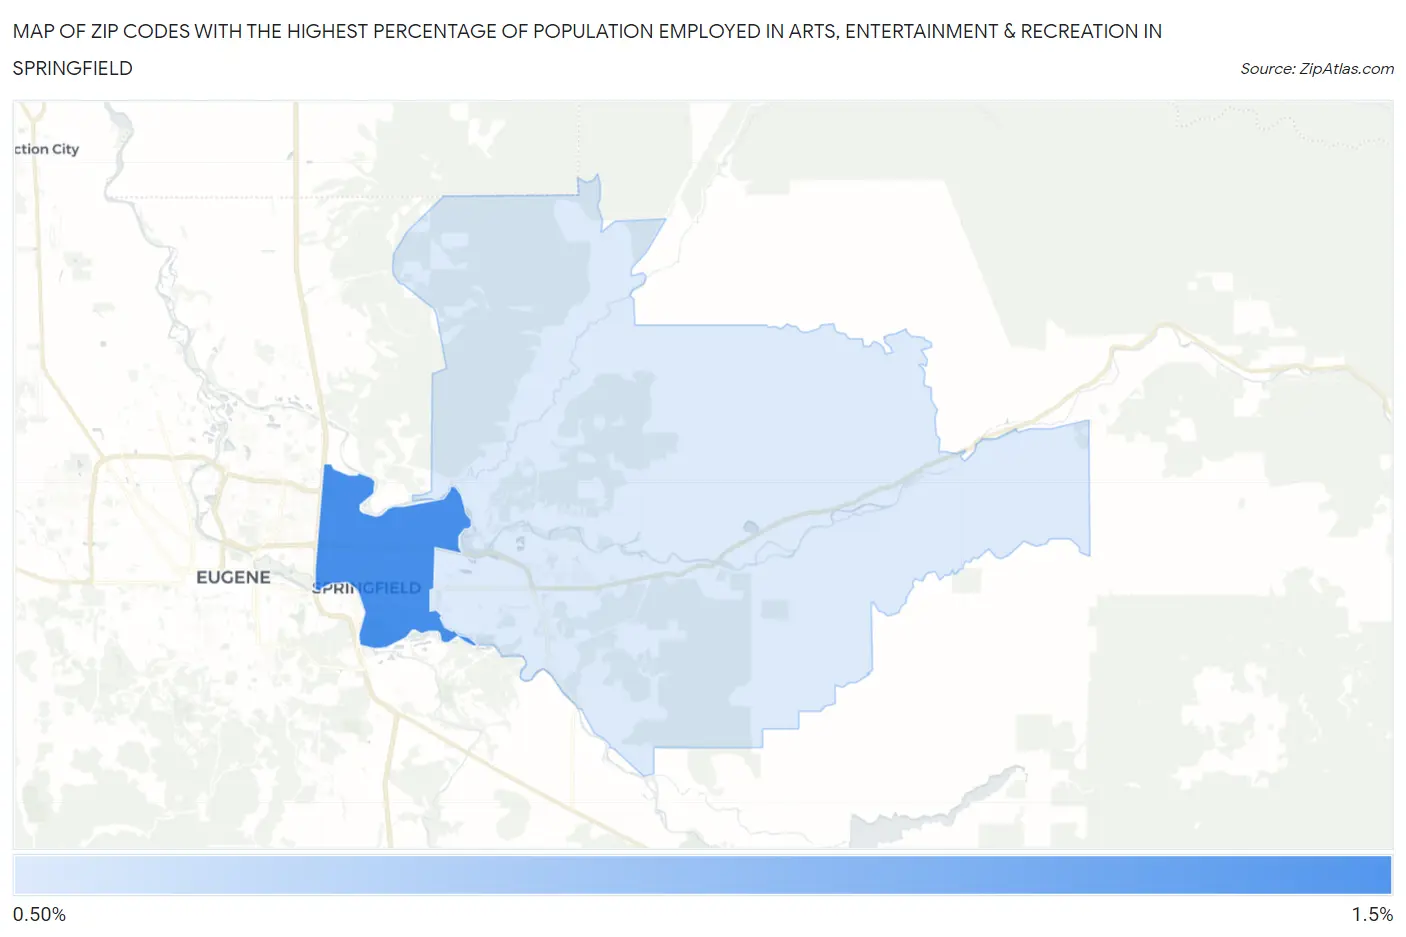
Map of Zip Codes with the Highest Percentage of Population Employed in Arts, Entertainment & Recreation in Springfield
0.0%
1.5%
Zip Codes with the Highest Percentage of Population Employed in Arts, Entertainment & Recreation in Springfield, OR
| Zip Code | % Employed | vs State | vs National | |
| 1. | 97477 | 1.4% | 2.1%(-0.650)#199 | 2.1%(-0.638)#13,647 |
| 2. | 97478 | 1.2% | 2.1%(-0.922)#218 | 2.1%(-0.910)#15,674 |
1
Common Questions
What are the Top Zip Codes with the Highest Percentage of Population Employed in Arts, Entertainment & Recreation in Springfield, OR?
Top Zip Codes with the Highest Percentage of Population Employed in Arts, Entertainment & Recreation in Springfield, OR are:
What zip code has the Highest Percentage of Population Employed in Arts, Entertainment & Recreation in Springfield, OR?
97477 has the Highest Percentage of Population Employed in Arts, Entertainment & Recreation in Springfield, OR with 1.4%.
What is the Percentage of Population Employed in Arts, Entertainment & Recreation in Springfield, OR?
Percentage of Population Employed in Arts, Entertainment & Recreation in Springfield is 1.5%.
What is the Percentage of Population Employed in Arts, Entertainment & Recreation in Oregon?
Percentage of Population Employed in Arts, Entertainment & Recreation in Oregon is 2.1%.
What is the Percentage of Population Employed in Arts, Entertainment & Recreation in the United States?
Percentage of Population Employed in Arts, Entertainment & Recreation in the United States is 2.1%.