Zip Codes with the Highest Percentage of Population Employed in Installation, Maintenance & Repair in Corvallis, OR
RELATED REPORTS & OPTIONS
Installation, Maintenance & Repair
Corvallis
Compare Zip Codes
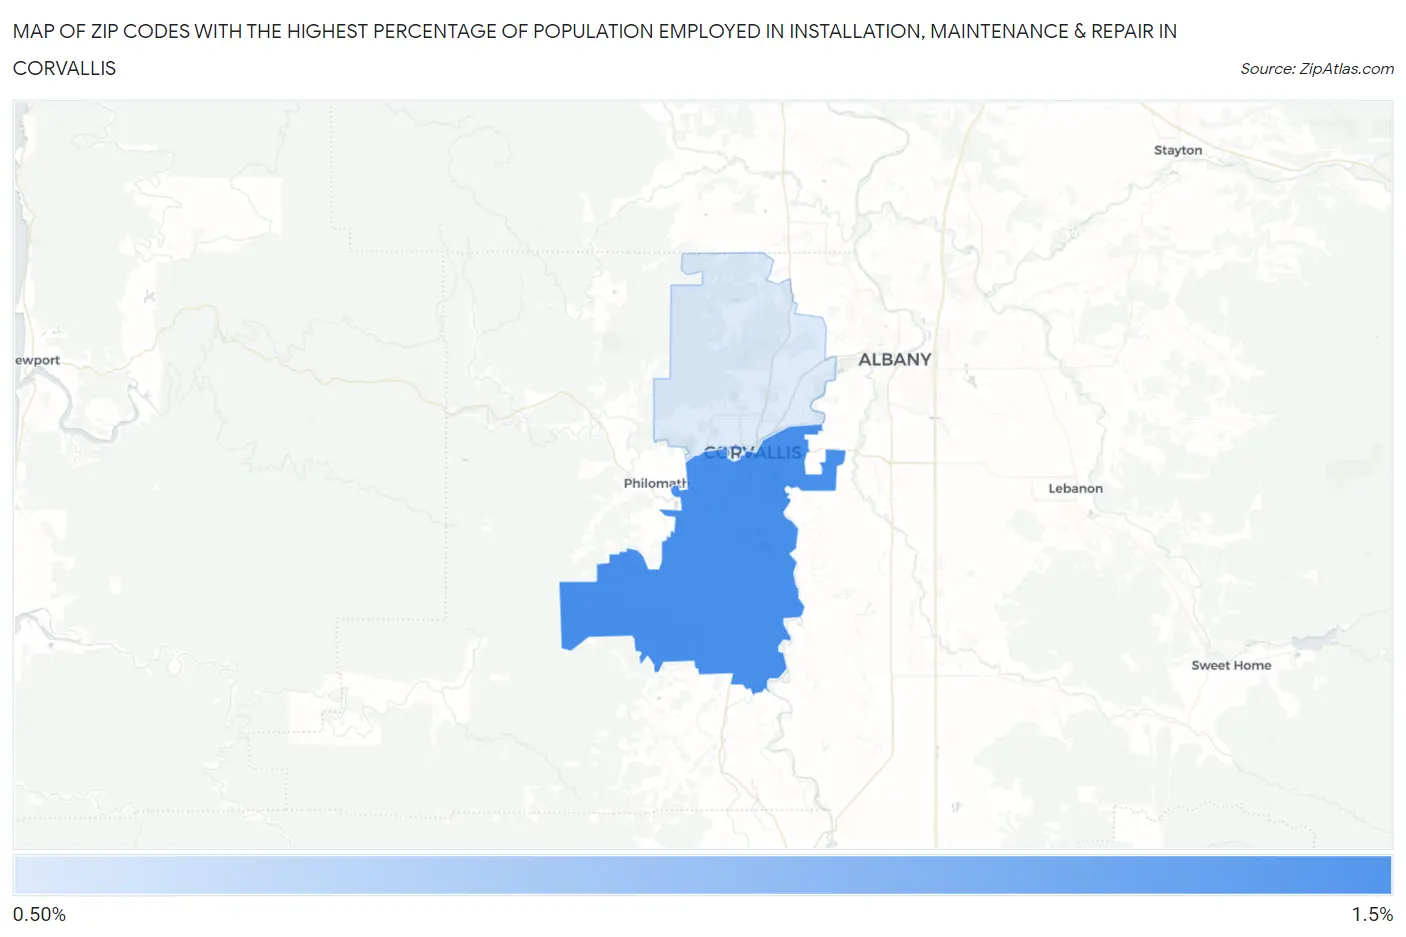
Map of Zip Codes with the Highest Percentage of Population Employed in Installation, Maintenance & Repair in Corvallis
0.0%
1.5%
Zip Codes with the Highest Percentage of Population Employed in Installation, Maintenance & Repair in Corvallis, OR
| Zip Code | % Employed | vs State | vs National | |
| 1. | 97333 | 1.2% | 2.7%(-1.48)#286 | 3.1%(-1.83)#25,141 |
| 2. | 97330 | 1.1% | 2.7%(-1.63)#297 | 3.1%(-1.98)#25,643 |
1
Common Questions
What are the Top Zip Codes with the Highest Percentage of Population Employed in Installation, Maintenance & Repair in Corvallis, OR?
Top Zip Codes with the Highest Percentage of Population Employed in Installation, Maintenance & Repair in Corvallis, OR are:
What zip code has the Highest Percentage of Population Employed in Installation, Maintenance & Repair in Corvallis, OR?
97333 has the Highest Percentage of Population Employed in Installation, Maintenance & Repair in Corvallis, OR with 1.2%.
What is the Percentage of Population Employed in Installation, Maintenance & Repair in Corvallis, OR?
Percentage of Population Employed in Installation, Maintenance & Repair in Corvallis is 0.71%.
What is the Percentage of Population Employed in Installation, Maintenance & Repair in Oregon?
Percentage of Population Employed in Installation, Maintenance & Repair in Oregon is 2.7%.
What is the Percentage of Population Employed in Installation, Maintenance & Repair in the United States?
Percentage of Population Employed in Installation, Maintenance & Repair in the United States is 3.1%.