Zip Codes with the Highest Percentage of Households Residing in Condos/Apartments in Youngstown, OH
RELATED REPORTS & OPTIONS
Condo/Apartment Residency
Youngstown
Compare Zip Codes
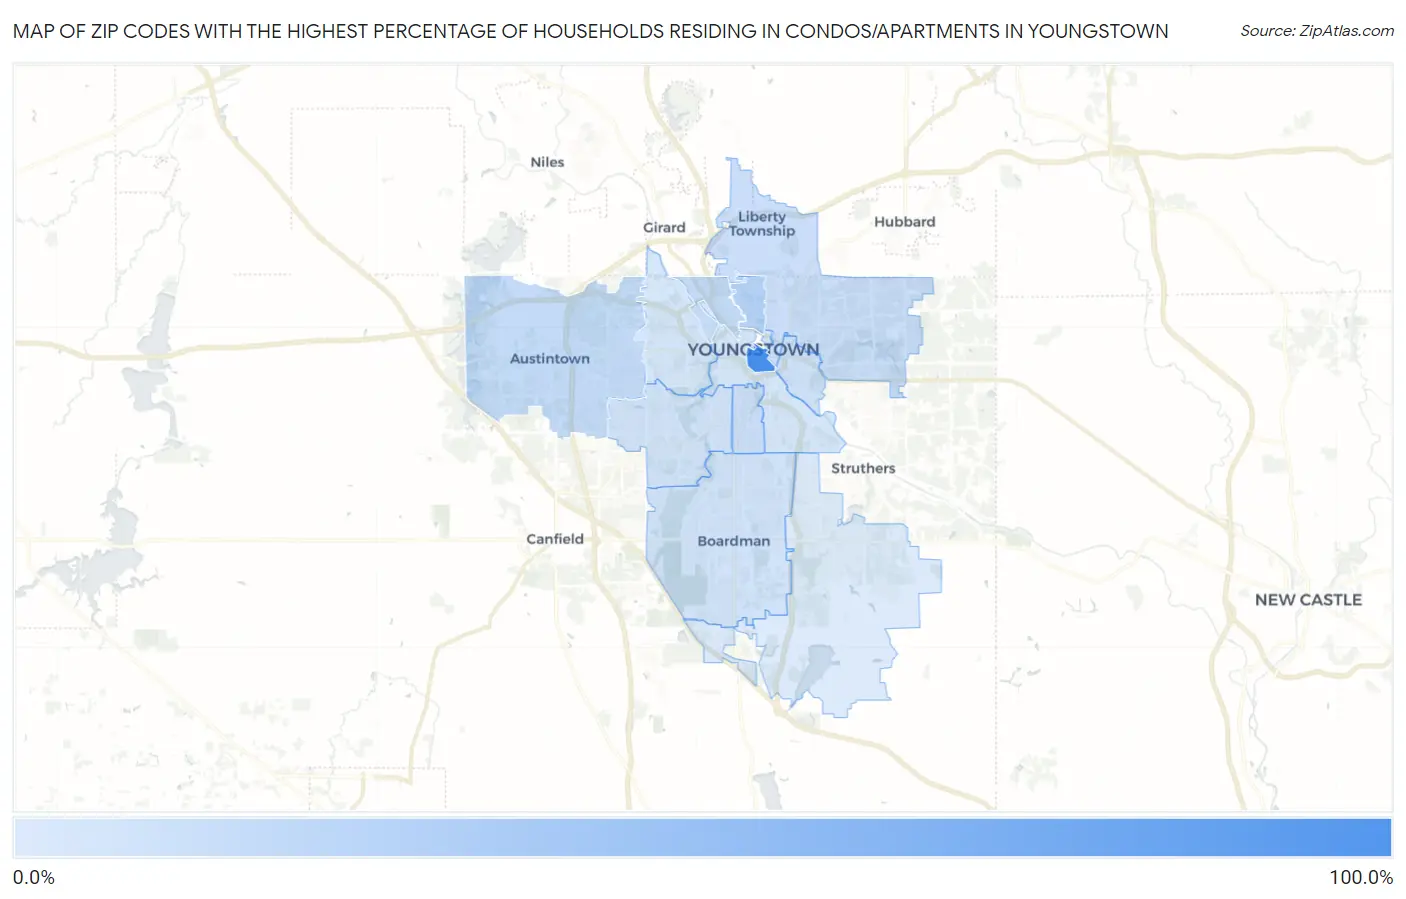
Map of Zip Codes with the Highest Percentage of Households Residing in Condos/Apartments in Youngstown
0.0%
100.0%
Zip Codes with the Highest Percentage of Households Residing in Condos/Apartments in Youngstown, OH
| Zip Code | Detached Home Residency | vs State | vs National | |
| 1. | 44503 | 98.7% | 9.6%(+89.1)#1 | 13.8%(+84.9)#62 |
| 2. | 44504 | 22.0% | 9.6%(+12.4)#50 | 13.8%(+8.20)#2,096 |
| 3. | 44515 | 14.3% | 9.6%(+4.70)#118 | 13.8%(+0.500)#3,806 |
| 4. | 44510 | 13.8% | 9.6%(+4.20)#127 | 13.8%(=0.000)#3,979 |
| 5. | 44507 | 11.1% | 9.6%(+1.50)#161 | 13.8%(-2.70)#5,002 |
| 6. | 44505 | 10.4% | 9.6%(+0.800)#174 | 13.8%(-3.40)#5,309 |
| 7. | 44506 | 8.4% | 9.6%(-1.20)#221 | 13.8%(-5.40)#6,432 |
| 8. | 44511 | 8.0% | 9.6%(-1.60)#226 | 13.8%(-5.80)#6,675 |
| 9. | 44512 | 7.8% | 9.6%(-1.80)#228 | 13.8%(-6.00)#6,802 |
| 10. | 44509 | 5.6% | 9.6%(-4.00)#307 | 13.8%(-8.20)#8,607 |
| 11. | 44502 | 4.9% | 9.6%(-4.70)#336 | 13.8%(-8.90)#9,228 |
| 12. | 44514 | 2.1% | 9.6%(-7.50)#499 | 13.8%(-11.7)#13,165 |
1
Common Questions
What are the Top 10 Zip Codes with the Highest Percentage of Households Residing in Condos/Apartments in Youngstown, OH?
Top 10 Zip Codes with the Highest Percentage of Households Residing in Condos/Apartments in Youngstown, OH are:
What zip code has the Highest Percentage of Households Residing in Condos/Apartments in Youngstown, OH?
44503 has the Highest Percentage of Households Residing in Condos/Apartments in Youngstown, OH with 98.7%.
What is the Percentage of Households Residing in Condos/Apartments in Youngstown, OH?
Percentage of Households Residing in Condos/Apartments in Youngstown is 10.4%.
What is the Percentage of Households Residing in Condos/Apartments in Ohio?
Percentage of Households Residing in Condos/Apartments in Ohio is 9.6%.
What is the Percentage of Households Residing in Condos/Apartments in the United States?
Percentage of Households Residing in Condos/Apartments in the United States is 13.8%.