Zip Codes with the Highest Percentage of Population Employed in Agriculture, Fishing & Hunting in Dayton, OH
RELATED REPORTS & OPTIONS
Agriculture, Fishing & Hunting
Dayton
Compare Zip Codes
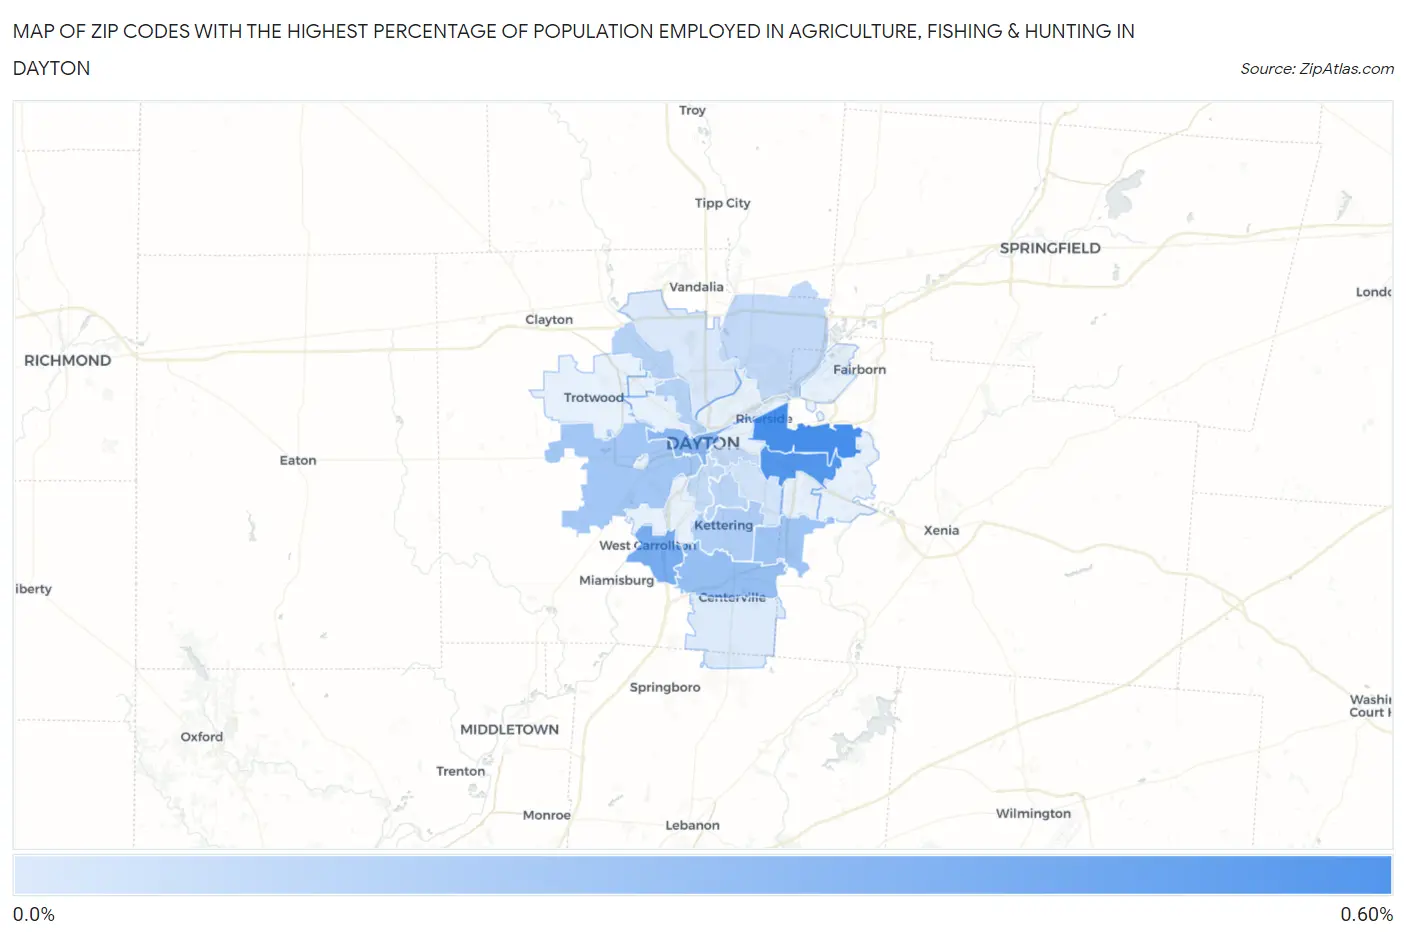
Map of Zip Codes with the Highest Percentage of Population Employed in Agriculture, Fishing & Hunting in Dayton
0.0%
0.60%
Zip Codes with the Highest Percentage of Population Employed in Agriculture, Fishing & Hunting in Dayton, OH
| Zip Code | % Employed | vs State | vs National | |
| 1. | 45431 | 0.57% | 0.71%(-0.142)#539 | 1.2%(-0.627)#18,685 |
| 2. | 45432 | 0.53% | 0.71%(-0.183)#548 | 1.2%(-0.668)#18,998 |
| 3. | 45449 | 0.41% | 0.71%(-0.309)#596 | 1.2%(-0.794)#20,108 |
| 4. | 45402 | 0.34% | 0.71%(-0.372)#615 | 1.2%(-0.856)#20,716 |
| 5. | 45459 | 0.30% | 0.71%(-0.411)#630 | 1.2%(-0.895)#21,129 |
| 6. | 45440 | 0.28% | 0.71%(-0.438)#646 | 1.2%(-0.923)#21,451 |
| 7. | 45417 | 0.26% | 0.71%(-0.455)#653 | 1.2%(-0.940)#21,662 |
| 8. | 45429 | 0.23% | 0.71%(-0.490)#665 | 1.2%(-0.974)#22,042 |
| 9. | 45405 | 0.20% | 0.71%(-0.514)#687 | 1.2%(-0.999)#22,358 |
| 10. | 45415 | 0.20% | 0.71%(-0.516)#689 | 1.2%(-1.00)#22,373 |
| 11. | 45419 | 0.18% | 0.71%(-0.531)#696 | 1.2%(-1.02)#22,550 |
| 12. | 45410 | 0.16% | 0.71%(-0.555)#712 | 1.2%(-1.04)#22,882 |
| 13. | 45424 | 0.16% | 0.71%(-0.556)#714 | 1.2%(-1.04)#22,896 |
| 14. | 45409 | 0.15% | 0.71%(-0.562)#716 | 1.2%(-1.05)#22,972 |
| 15. | 45420 | 0.10% | 0.71%(-0.610)#740 | 1.2%(-1.10)#23,613 |
| 16. | 45414 | 0.076% | 0.71%(-0.638)#758 | 1.2%(-1.12)#24,008 |
| 17. | 45458 | 0.066% | 0.71%(-0.648)#763 | 1.2%(-1.13)#24,149 |
1
Common Questions
What are the Top 10 Zip Codes with the Highest Percentage of Population Employed in Agriculture, Fishing & Hunting in Dayton, OH?
Top 10 Zip Codes with the Highest Percentage of Population Employed in Agriculture, Fishing & Hunting in Dayton, OH are:
What zip code has the Highest Percentage of Population Employed in Agriculture, Fishing & Hunting in Dayton, OH?
45431 has the Highest Percentage of Population Employed in Agriculture, Fishing & Hunting in Dayton, OH with 0.57%.
What is the Percentage of Population Employed in Agriculture, Fishing & Hunting in Dayton, OH?
Percentage of Population Employed in Agriculture, Fishing & Hunting in Dayton is 0.091%.
What is the Percentage of Population Employed in Agriculture, Fishing & Hunting in Ohio?
Percentage of Population Employed in Agriculture, Fishing & Hunting in Ohio is 0.71%.
What is the Percentage of Population Employed in Agriculture, Fishing & Hunting in the United States?
Percentage of Population Employed in Agriculture, Fishing & Hunting in the United States is 1.2%.