Winthrop, NY Map & Demographics
Winthrop Map
Winthrop Overview
$52,333
PER CAPITA INCOME
$144,250
AVG FAMILY INCOME
0.33
INEQUALITY / GINI INDEX
235
TOTAL POPULATION
134
MALE POPULATION
101
FEMALE POPULATION
132.67
MALES / 100 FEMALES
75.37
FEMALES / 100 MALES
49.6
MEDIAN AGE
2.3
AVG FAMILY SIZE
1.8
AVG HOUSEHOLD SIZE
125
LABOR FORCE [ PEOPLE ]
58.4%
PERCENT IN LABOR FORCE
Winthrop Zip Codes
Winthrop Area Codes
Income in Winthrop
Income Overview in Winthrop
| Characteristic | Number | Measure |
| Per Capita Income | 235 | $52,333 |
| Median Family Income | 77 | $144,250 |
| Mean Family Income | 77 | $135,140 |
| Median Household Income | 133 | $0 |
| Mean Household Income | 133 | $93,839 |
| Income Deficit | 77 | $0 |
| Wage / Income Gap (%) | 235 | 0.00% |
| Wage / Income Gap ($) | 235 | 100.00¢ per $1 |
| Gini / Inequality Index | 235 | 0.33 |
Earnings by Sex in Winthrop
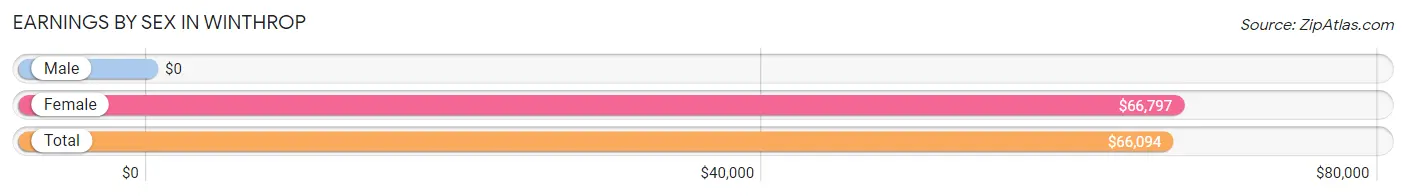
| Sex | Number | Average Earnings |
| Male | 69 (48.6%) | $0 |
| Female | 73 (51.4%) | $66,797 |
| Total | 142 (100.0%) | $66,094 |
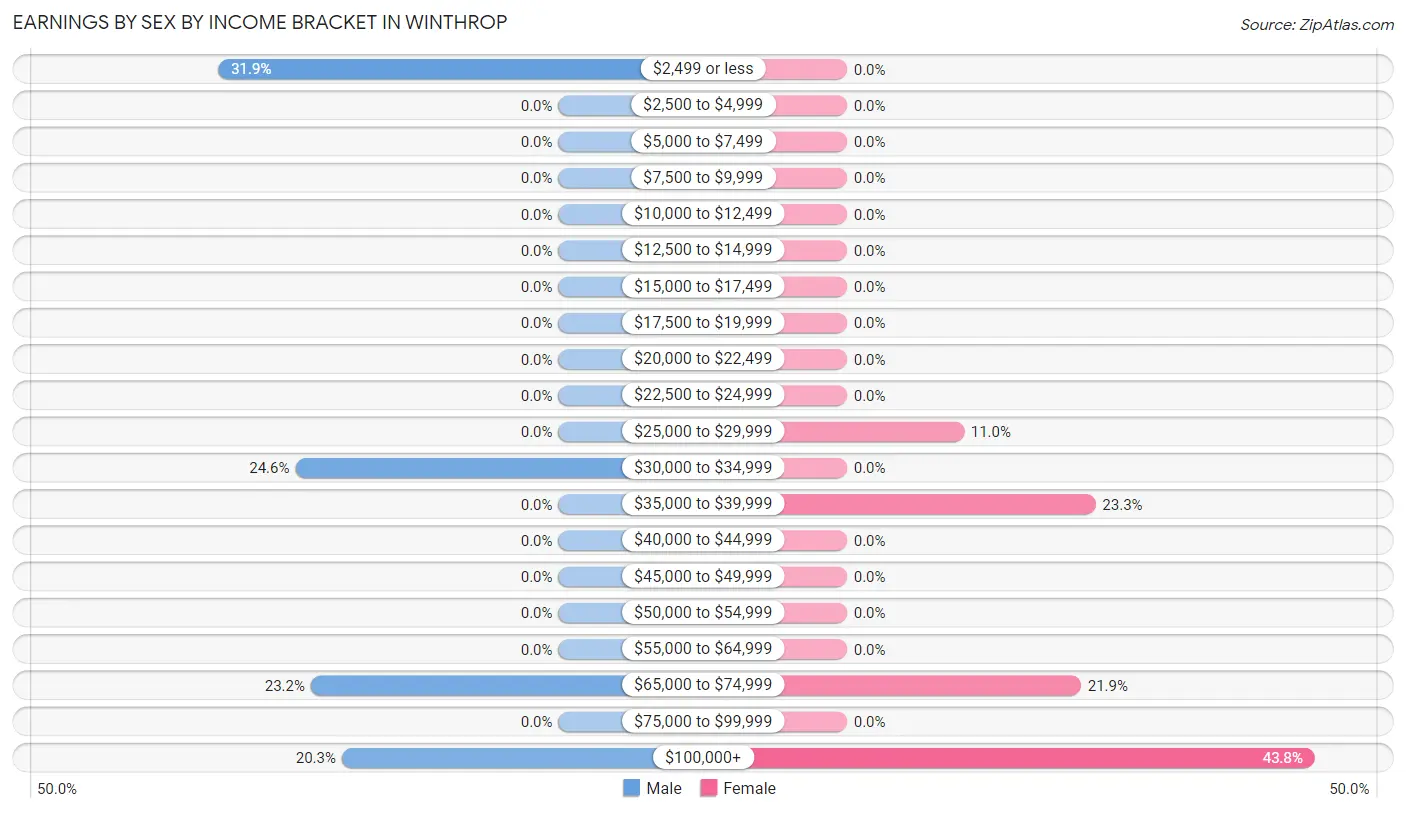
Earnings by Sex by Income Bracket in Winthrop
The most common earnings brackets in Winthrop are $2,499 or less for men (22 | 31.9%) and $100,000+ for women (32 | 43.8%).
| Income | Male | Female |
| $2,499 or less | 22 (31.9%) | 0 (0.0%) |
| $2,500 to $4,999 | 0 (0.0%) | 0 (0.0%) |
| $5,000 to $7,499 | 0 (0.0%) | 0 (0.0%) |
| $7,500 to $9,999 | 0 (0.0%) | 0 (0.0%) |
| $10,000 to $12,499 | 0 (0.0%) | 0 (0.0%) |
| $12,500 to $14,999 | 0 (0.0%) | 0 (0.0%) |
| $15,000 to $17,499 | 0 (0.0%) | 0 (0.0%) |
| $17,500 to $19,999 | 0 (0.0%) | 0 (0.0%) |
| $20,000 to $22,499 | 0 (0.0%) | 0 (0.0%) |
| $22,500 to $24,999 | 0 (0.0%) | 0 (0.0%) |
| $25,000 to $29,999 | 0 (0.0%) | 8 (11.0%) |
| $30,000 to $34,999 | 17 (24.6%) | 0 (0.0%) |
| $35,000 to $39,999 | 0 (0.0%) | 17 (23.3%) |
| $40,000 to $44,999 | 0 (0.0%) | 0 (0.0%) |
| $45,000 to $49,999 | 0 (0.0%) | 0 (0.0%) |
| $50,000 to $54,999 | 0 (0.0%) | 0 (0.0%) |
| $55,000 to $64,999 | 0 (0.0%) | 0 (0.0%) |
| $65,000 to $74,999 | 16 (23.2%) | 16 (21.9%) |
| $75,000 to $99,999 | 0 (0.0%) | 0 (0.0%) |
| $100,000+ | 14 (20.3%) | 32 (43.8%) |
| Total | 69 (100.0%) | 73 (100.0%) |
Earnings by Sex by Educational Attainment in Winthrop
| Educational Attainment | Male Income | Female Income |
| Less than High School | - | - |
| High School Diploma | - | - |
| College or Associate's Degree | - | - |
| Bachelor's Degree | - | - |
| Graduate Degree | - | - |
| Total | - | - |
Family Income in Winthrop
Family Income Brackets in Winthrop
According to the Winthrop family income data, there are 34 families falling into the $150,000 to $199,999 income range, which is the most common income bracket and makes up 44.2% of all families.
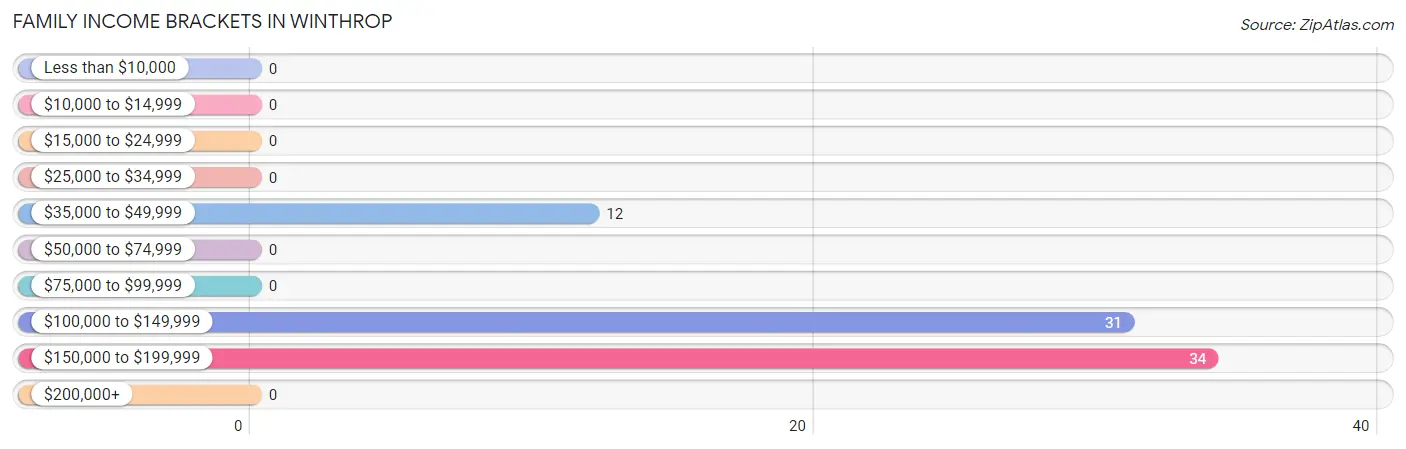
| Income Bracket | # Families | % Families |
| Less than $10,000 | 0 | 0.0% |
| $10,000 to $14,999 | 0 | 0.0% |
| $15,000 to $24,999 | 0 | 0.0% |
| $25,000 to $34,999 | 0 | 0.0% |
| $35,000 to $49,999 | 12 | 15.6% |
| $50,000 to $74,999 | 0 | 0.0% |
| $75,000 to $99,999 | 0 | 0.0% |
| $100,000 to $149,999 | 31 | 40.3% |
| $150,000 to $199,999 | 34 | 44.2% |
| $200,000+ | 0 | 0.0% |
Family Income by Famaliy Size in Winthrop
2-person families (50 | 64.9%) account for the highest median family income in Winthrop with $153,824 per family, while 2-person families (50 | 64.9%) have the highest median income of $76,912 per family member.
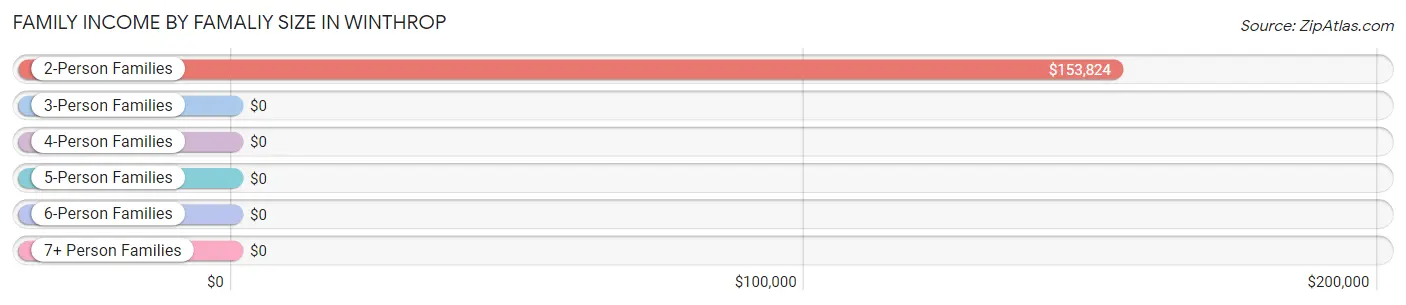
| Income Bracket | # Families | Median Income |
| 2-Person Families | 50 (64.9%) | $153,824 |
| 3-Person Families | 27 (35.1%) | $0 |
| 4-Person Families | 0 (0.0%) | $0 |
| 5-Person Families | 0 (0.0%) | $0 |
| 6-Person Families | 0 (0.0%) | $0 |
| 7+ Person Families | 0 (0.0%) | $0 |
| Total | 77 (100.0%) | $144,250 |
Family Income by Number of Earners in Winthrop
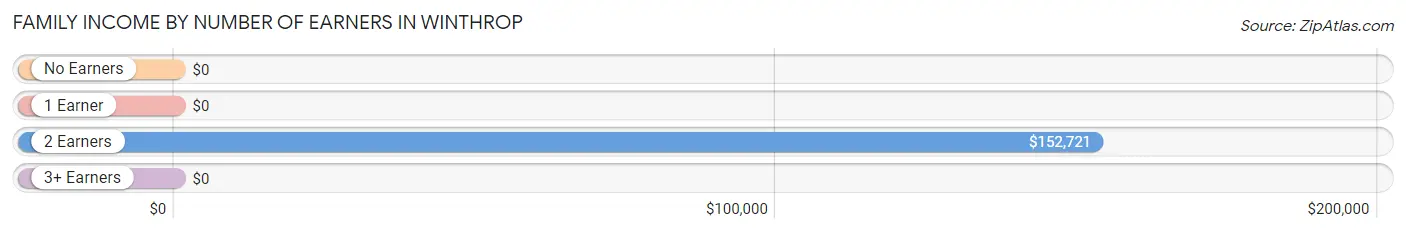
| Number of Earners | # Families | Median Income |
| No Earners | 0 (0.0%) | $0 |
| 1 Earner | 12 (15.6%) | $0 |
| 2 Earners | 65 (84.4%) | $152,721 |
| 3+ Earners | 0 (0.0%) | $0 |
| Total | 77 (100.0%) | $144,250 |
Household Income in Winthrop
Household Income Brackets in Winthrop
With 65 households falling in the category, the $35,000 to $49,999 income range is the most frequent in Winthrop, accounting for 48.9% of all households.
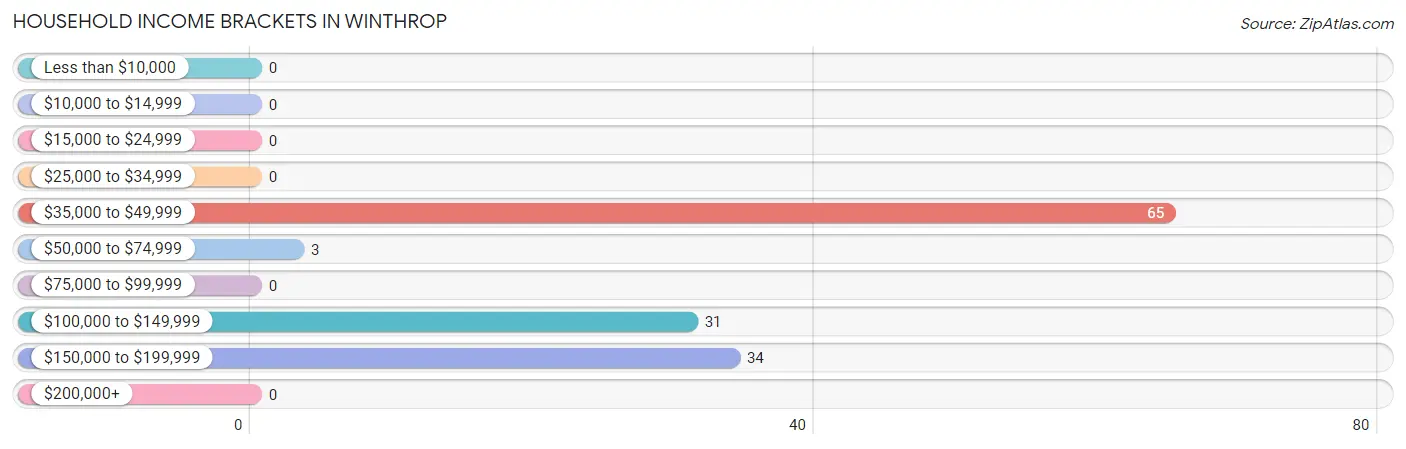
| Income Bracket | # Households | % Households |
| Less than $10,000 | 0 | 0.0% |
| $10,000 to $14,999 | 0 | 0.0% |
| $15,000 to $24,999 | 0 | 0.0% |
| $25,000 to $34,999 | 0 | 0.0% |
| $35,000 to $49,999 | 65 | 48.9% |
| $50,000 to $74,999 | 3 | 2.3% |
| $75,000 to $99,999 | 0 | 0.0% |
| $100,000 to $149,999 | 31 | 23.3% |
| $150,000 to $199,999 | 34 | 25.6% |
| $200,000+ | 0 | 0.0% |
Household Income by Householder Age in Winthrop
The median household income in Winthrop is $0, with the highest median household income of $144,167 found in the 25 to 44 years age bracket for the primary householder. A total of 44 households (33.1%) fall into this category.
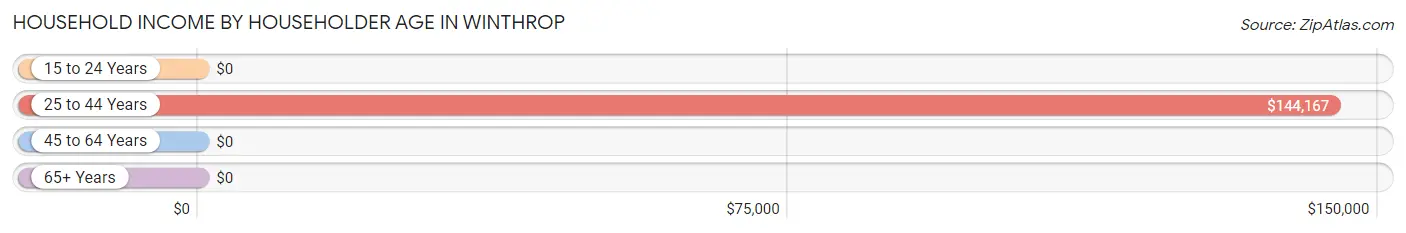
| Income Bracket | # Households | Median Income |
| 15 to 24 Years | 0 (0.0%) | $0 |
| 25 to 44 Years | 44 (33.1%) | $144,167 |
| 45 to 64 Years | 17 (12.8%) | $0 |
| 65+ Years | 72 (54.1%) | $0 |
| Total | 133 (100.0%) | $0 |
Poverty in Winthrop
Income Below Poverty by Sex and Age in Winthrop
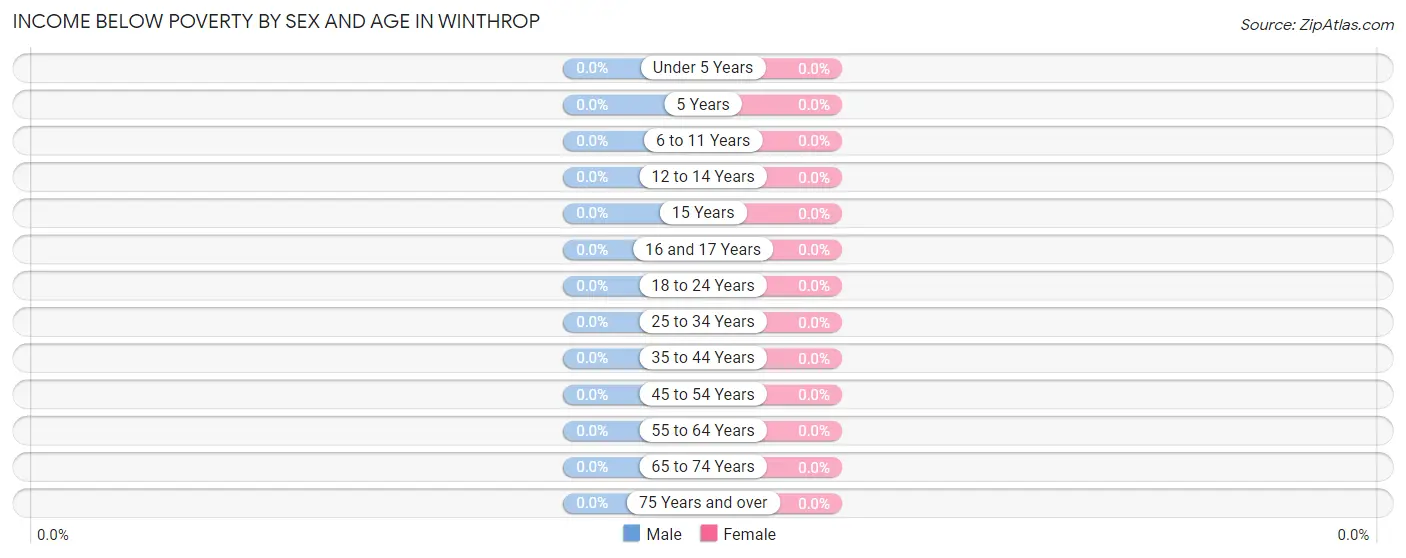
| Age Bracket | Male | Female |
| Under 5 Years | 0 (0.0%) | 0 (0.0%) |
| 5 Years | 0 (0.0%) | 0 (0.0%) |
| 6 to 11 Years | 0 (0.0%) | 0 (0.0%) |
| 12 to 14 Years | 0 (0.0%) | 0 (0.0%) |
| 15 Years | 0 (0.0%) | 0 (0.0%) |
| 16 and 17 Years | 0 (0.0%) | 0 (0.0%) |
| 18 to 24 Years | 0 (0.0%) | 0 (0.0%) |
| 25 to 34 Years | 0 (0.0%) | 0 (0.0%) |
| 35 to 44 Years | 0 (0.0%) | 0 (0.0%) |
| 45 to 54 Years | 0 (0.0%) | 0 (0.0%) |
| 55 to 64 Years | 0 (0.0%) | 0 (0.0%) |
| 65 to 74 Years | 0 (0.0%) | 0 (0.0%) |
| 75 Years and over | 0 (0.0%) | 0 (0.0%) |
| Total | 0 (0.0%) | 0 (0.0%) |
Income Above Poverty by Sex and Age in Winthrop
According to the poverty statistics in Winthrop, males aged 25 to 34 years and females aged under 5 years are the age groups that are most secure financially, with 100.0% of males and 100.0% of females in these age groups living above the poverty line.
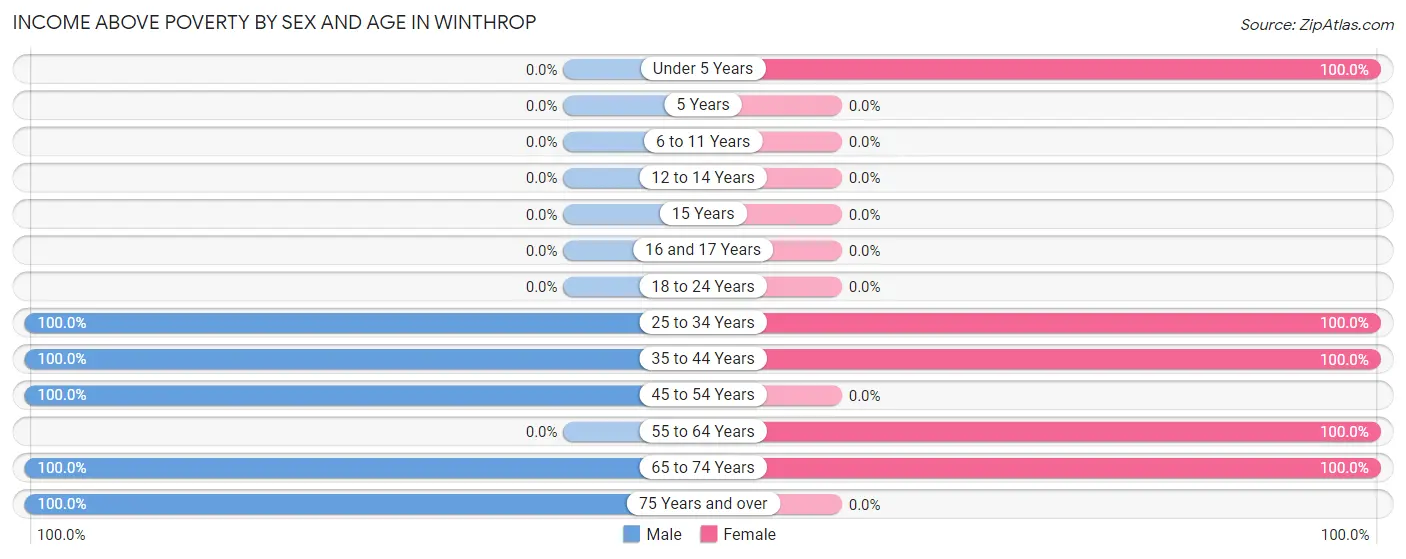
| Age Bracket | Male | Female |
| Under 5 Years | 0 (0.0%) | 21 (100.0%) |
| 5 Years | 0 (0.0%) | 0 (0.0%) |
| 6 to 11 Years | 0 (0.0%) | 0 (0.0%) |
| 12 to 14 Years | 0 (0.0%) | 0 (0.0%) |
| 15 Years | 0 (0.0%) | 0 (0.0%) |
| 16 and 17 Years | 0 (0.0%) | 0 (0.0%) |
| 18 to 24 Years | 0 (0.0%) | 0 (0.0%) |
| 25 to 34 Years | 14 (100.0%) | 15 (100.0%) |
| 35 to 44 Years | 29 (100.0%) | 25 (100.0%) |
| 45 to 54 Years | 22 (100.0%) | 0 (0.0%) |
| 55 to 64 Years | 0 (0.0%) | 33 (100.0%) |
| 65 to 74 Years | 16 (100.0%) | 7 (100.0%) |
| 75 Years and over | 53 (100.0%) | 0 (0.0%) |
| Total | 134 (100.0%) | 101 (100.0%) |
Income Below Poverty Among Married-Couple Families in Winthrop
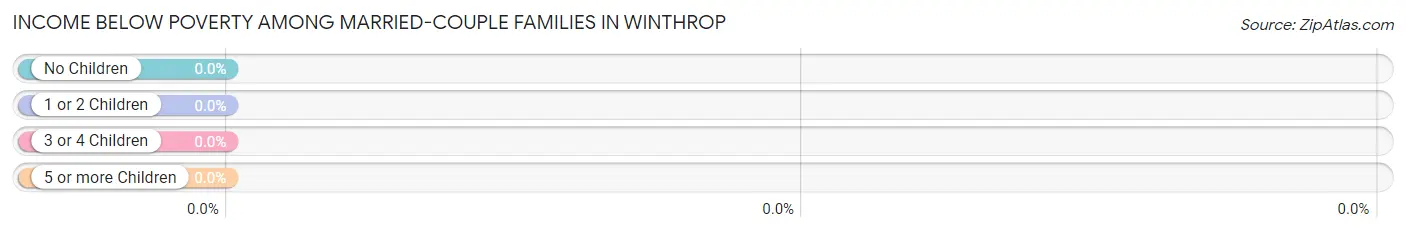
| Children | Above Poverty | Below Poverty |
| No Children | 50 (100.0%) | 0 (0.0%) |
| 1 or 2 Children | 27 (100.0%) | 0 (0.0%) |
| 3 or 4 Children | 0 (0.0%) | 0 (0.0%) |
| 5 or more Children | 0 (0.0%) | 0 (0.0%) |
| Total | 77 (100.0%) | 0 (0.0%) |
Income Below Poverty Among Single-Parent Households in Winthrop
| Children | Single Father | Single Mother |
| No Children | 0 (0.0%) | 0 (0.0%) |
| 1 or 2 Children | 0 (0.0%) | 0 (0.0%) |
| 3 or 4 Children | 0 (0.0%) | 0 (0.0%) |
| 5 or more Children | 0 (0.0%) | 0 (0.0%) |
| Total | 0 (0.0%) | 0 (0.0%) |
Income Below Poverty Among Married-Couple vs Single-Parent Households in Winthrop
| Children | Married-Couple Families | Single-Parent Households |
| No Children | 0 (0.0%) | 0 (0.0%) |
| 1 or 2 Children | 0 (0.0%) | 0 (0.0%) |
| 3 or 4 Children | 0 (0.0%) | 0 (0.0%) |
| 5 or more Children | 0 (0.0%) | 0 (0.0%) |
| Total | 0 (0.0%) | 0 (0.0%) |
Race in Winthrop
The most populous races in Winthrop are , and White / Caucasian (235 | 100.0%).
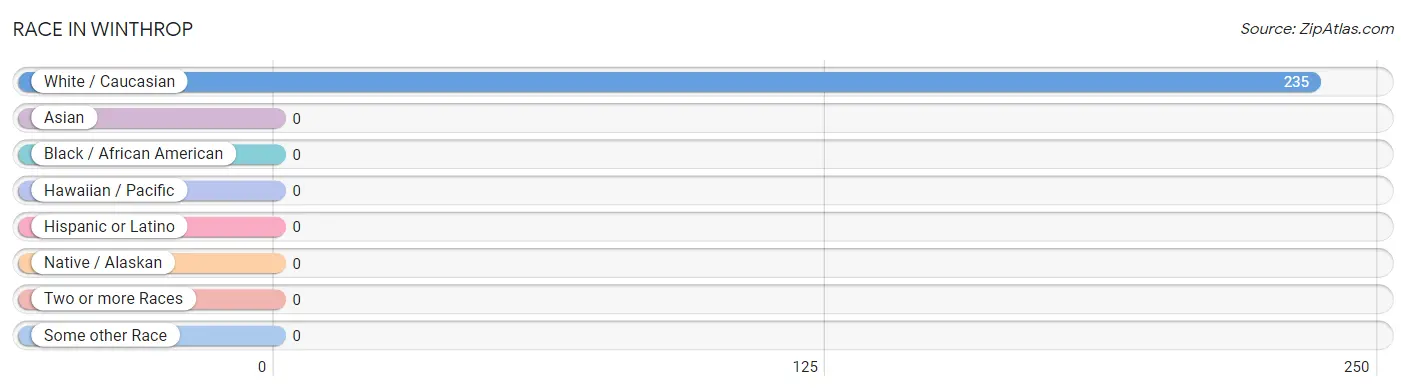
| Race | # Population | % Population |
| Asian | 0 | 0.0% |
| Black / African American | 0 | 0.0% |
| Hawaiian / Pacific | 0 | 0.0% |
| Hispanic or Latino | 0 | 0.0% |
| Native / Alaskan | 0 | 0.0% |
| White / Caucasian | 235 | 100.0% |
| Two or more Races | 0 | 0.0% |
| Some other Race | 0 | 0.0% |
| Total | 235 | 100.0% |
Ancestry in Winthrop
The most populous ancestries reported in Winthrop are American (39 | 16.6%), British (31 | 13.2%), Turkish (28 | 11.9%), Scandinavian (17 | 7.2%), and Danish (16 | 6.8%), together accounting for 55.7% of all Winthrop residents.
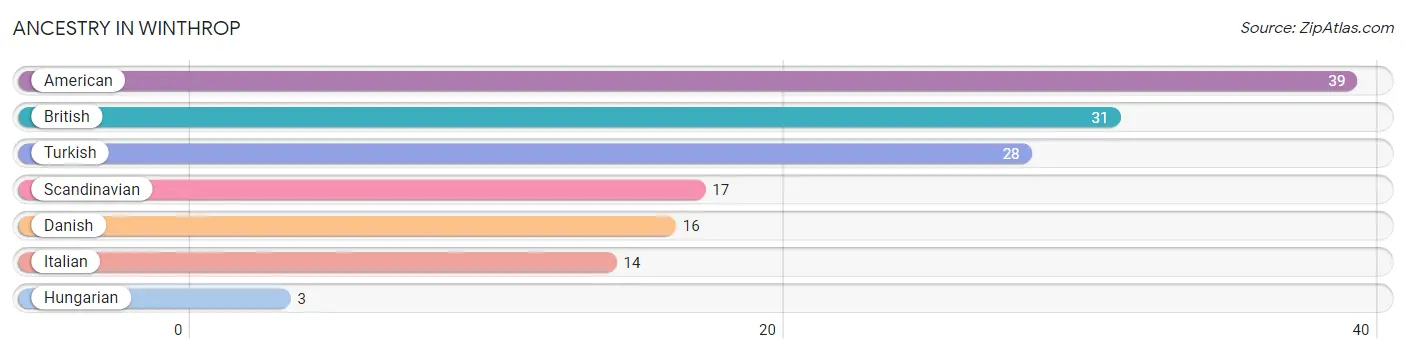
| Ancestry | # Population | % Population |
| American | 39 | 16.6% |
| British | 31 | 13.2% |
| Danish | 16 | 6.8% |
| Hungarian | 3 | 1.3% |
| Italian | 14 | 6.0% |
| Scandinavian | 17 | 7.2% |
| Turkish | 28 | 11.9% | View All 7 Rows |
Immigrants in Winthrop
The most numerous immigrant groups reported in Winthrop came from Asia (28 | 11.9%), Turkey (20 | 8.5%), Western Asia (20 | 8.5%), Malaysia (8 | 3.4%), and South Eastern Asia (8 | 3.4%), together accounting for 35.7% of all Winthrop residents.
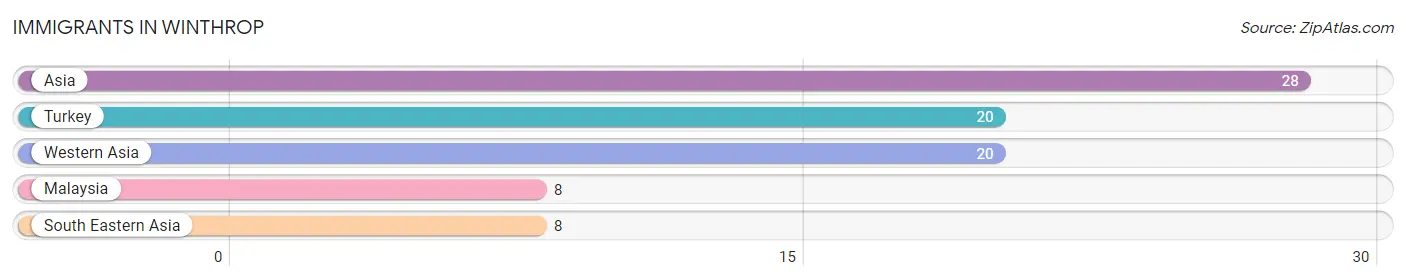
| Immigration Origin | # Population | % Population |
| Asia | 28 | 11.9% |
| Malaysia | 8 | 3.4% |
| South Eastern Asia | 8 | 3.4% |
| Turkey | 20 | 8.5% |
| Western Asia | 20 | 8.5% | View All 5 Rows |
Sex and Age in Winthrop
Sex and Age in Winthrop
The most populous age groups in Winthrop are 85 Years and over (53 | 39.6%) for men and Under 5 Years (21 | 20.8%) for women.
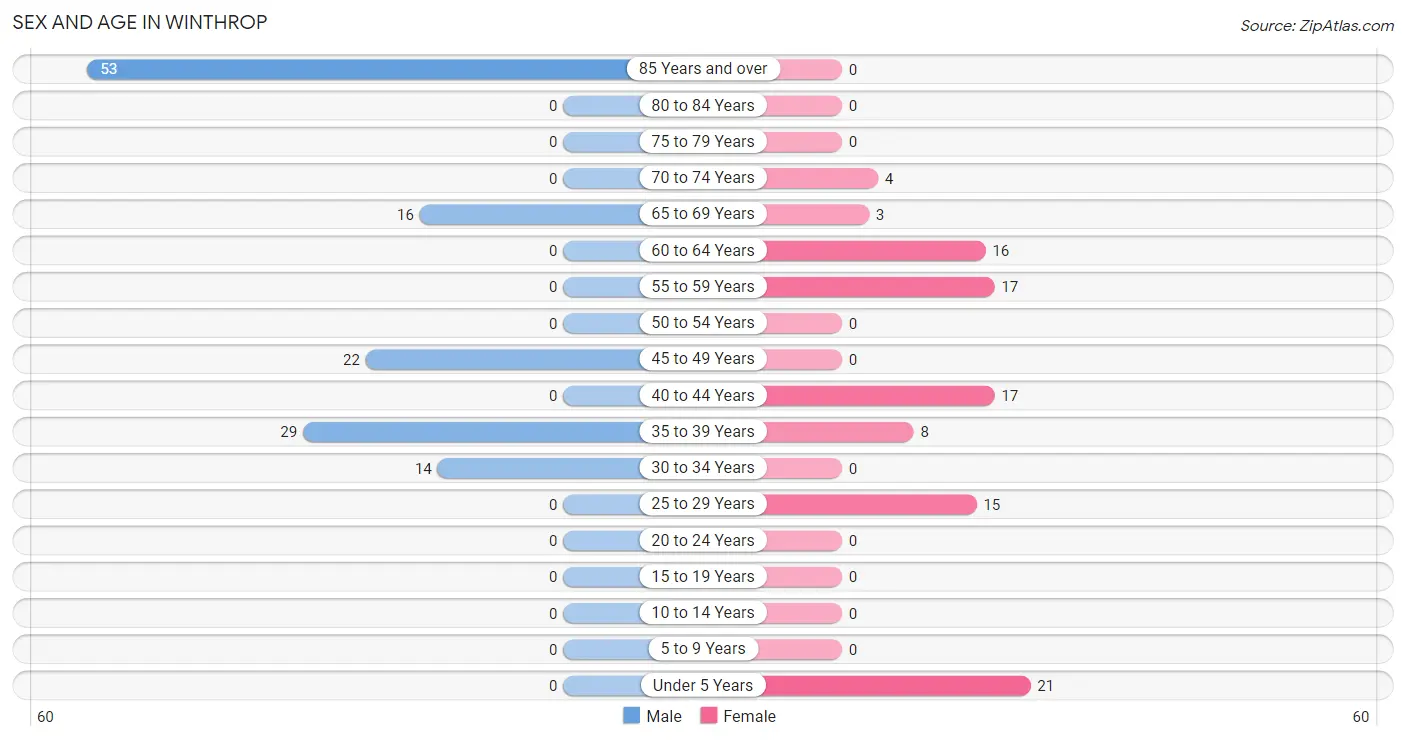
| Age Bracket | Male | Female |
| Under 5 Years | 0 (0.0%) | 21 (20.8%) |
| 5 to 9 Years | 0 (0.0%) | 0 (0.0%) |
| 10 to 14 Years | 0 (0.0%) | 0 (0.0%) |
| 15 to 19 Years | 0 (0.0%) | 0 (0.0%) |
| 20 to 24 Years | 0 (0.0%) | 0 (0.0%) |
| 25 to 29 Years | 0 (0.0%) | 15 (14.8%) |
| 30 to 34 Years | 14 (10.4%) | 0 (0.0%) |
| 35 to 39 Years | 29 (21.6%) | 8 (7.9%) |
| 40 to 44 Years | 0 (0.0%) | 17 (16.8%) |
| 45 to 49 Years | 22 (16.4%) | 0 (0.0%) |
| 50 to 54 Years | 0 (0.0%) | 0 (0.0%) |
| 55 to 59 Years | 0 (0.0%) | 17 (16.8%) |
| 60 to 64 Years | 0 (0.0%) | 16 (15.8%) |
| 65 to 69 Years | 16 (11.9%) | 3 (3.0%) |
| 70 to 74 Years | 0 (0.0%) | 4 (4.0%) |
| 75 to 79 Years | 0 (0.0%) | 0 (0.0%) |
| 80 to 84 Years | 0 (0.0%) | 0 (0.0%) |
| 85 Years and over | 53 (39.6%) | 0 (0.0%) |
| Total | 134 (100.0%) | 101 (100.0%) |
Families and Households in Winthrop
Median Family Size in Winthrop
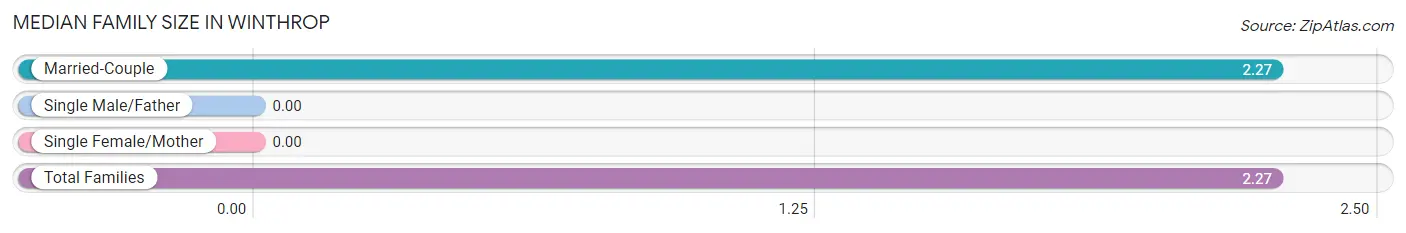
| Family Type | # Families | Family Size |
| Married-Couple | 77 (100.0%) | 2.27 |
| Single Male/Father | 0 (0.0%) | - |
| Single Female/Mother | 0 (0.0%) | - |
| Total Families | 77 (100.0%) | 2.27 |
Median Household Size in Winthrop
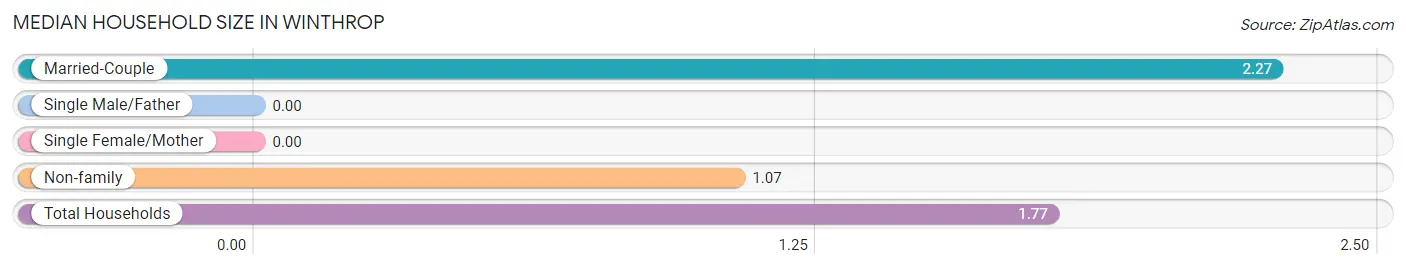
| Household Type | # Households | Household Size |
| Married-Couple | 77 (57.9%) | 2.27 |
| Single Male/Father | 0 (0.0%) | - |
| Single Female/Mother | 0 (0.0%) | - |
| Non-family | 56 (42.1%) | 1.07 |
| Total Households | 133 (100.0%) | 1.77 |
Household Size by Marriage Status in Winthrop
Out of a total of 133 households in Winthrop, 77 (57.9%) are family households, while 56 (42.1%) are nonfamily households. The most numerous type of family households are 2-person households, comprising 50, and the most common type of nonfamily households are 1-person households, comprising 53.
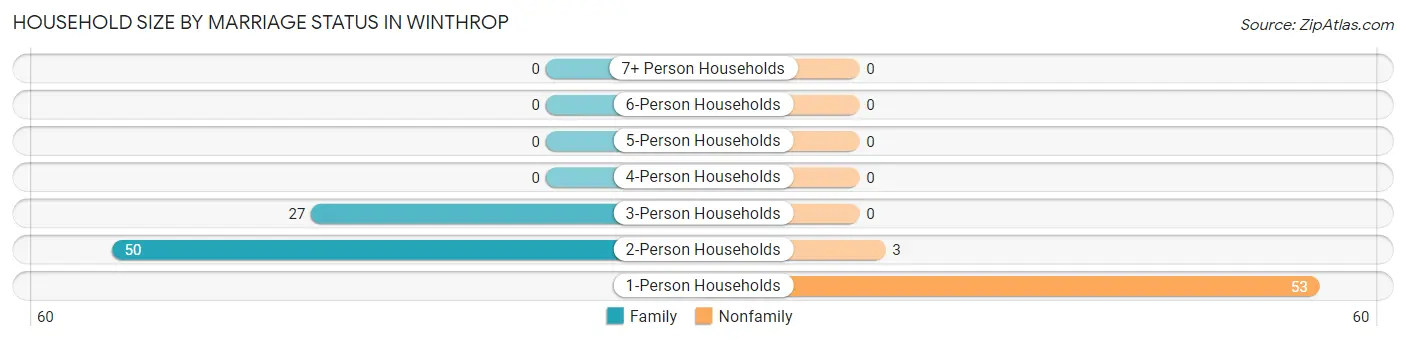
| Household Size | Family Households | Nonfamily Households |
| 1-Person Households | - | 53 (39.9%) |
| 2-Person Households | 50 (37.6%) | 3 (2.3%) |
| 3-Person Households | 27 (20.3%) | 0 (0.0%) |
| 4-Person Households | 0 (0.0%) | 0 (0.0%) |
| 5-Person Households | 0 (0.0%) | 0 (0.0%) |
| 6-Person Households | 0 (0.0%) | 0 (0.0%) |
| 7+ Person Households | 0 (0.0%) | 0 (0.0%) |
| Total | 77 (57.9%) | 56 (42.1%) |
Female Fertility in Winthrop
Fertility by Age in Winthrop
Average fertility rate in Winthrop is 375.0 births per 1,000 women. Women in the age bracket of 20 to 34 years have the highest fertility rate with 1,000.0 births per 1,000 women. Women in the age bracket of 20 to 34 years acount for 100.0% of all women with births.
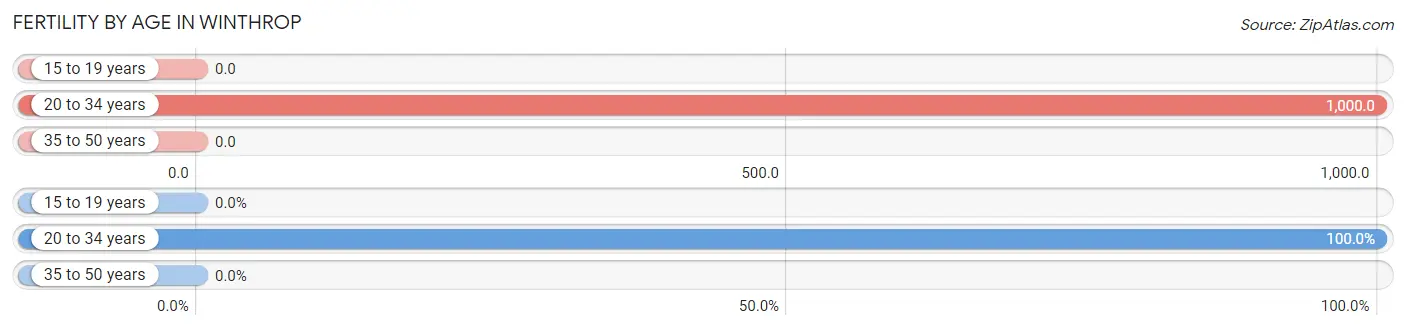
| Age Bracket | Women with Births | Births / 1,000 Women |
| 15 to 19 years | 0 (0.0%) | 0.0 |
| 20 to 34 years | 15 (100.0%) | 1,000.0 |
| 35 to 50 years | 0 (0.0%) | 0.0 |
| Total | 15 (100.0%) | 375.0 |
Fertility by Age by Marriage Status in Winthrop
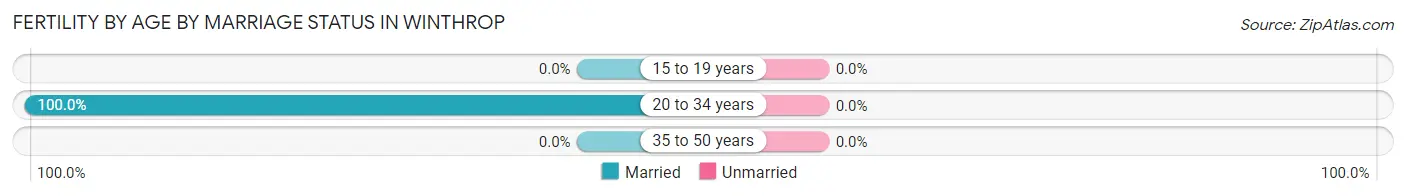
| Age Bracket | Married | Unmarried |
| 15 to 19 years | 0 (0.0%) | 0 (0.0%) |
| 20 to 34 years | 15 (100.0%) | 0 (0.0%) |
| 35 to 50 years | 0 (0.0%) | 0 (0.0%) |
| Total | 15 (100.0%) | 0 (0.0%) |
Fertility by Education in Winthrop
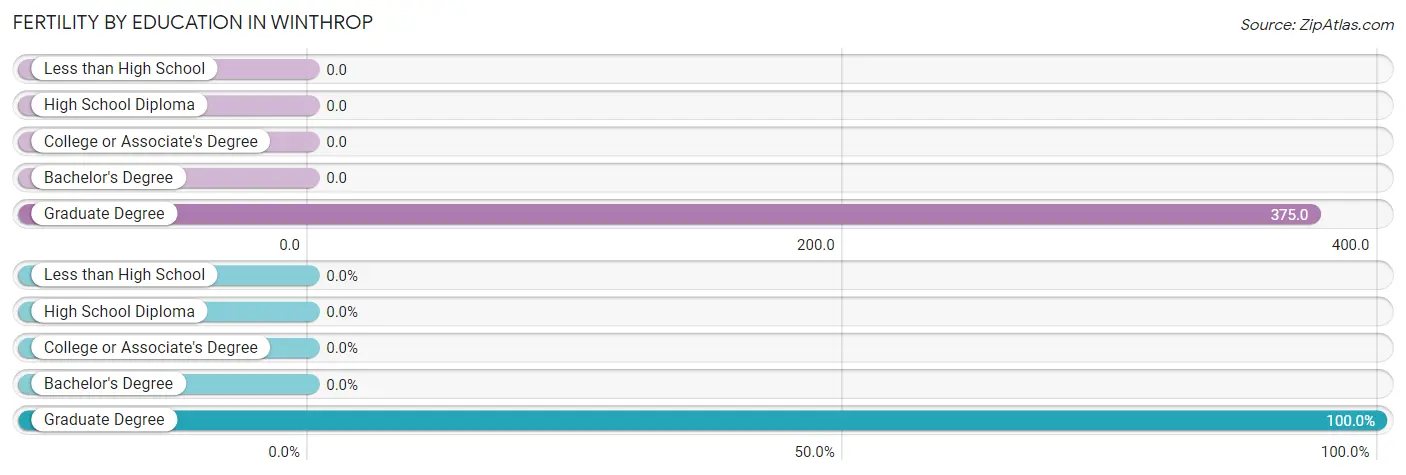
| Educational Attainment | Women with Births | Births / 1,000 Women |
| Less than High School | 0 (0.0%) | 0.0 |
| High School Diploma | 0 (0.0%) | 0.0 |
| College or Associate's Degree | 0 (0.0%) | 0.0 |
| Bachelor's Degree | 0 (0.0%) | 0.0 |
| Graduate Degree | 15 (100.0%) | 375.0 |
| Total | 15 (100.0%) | 375.0 |
Fertility by Education by Marriage Status in Winthrop
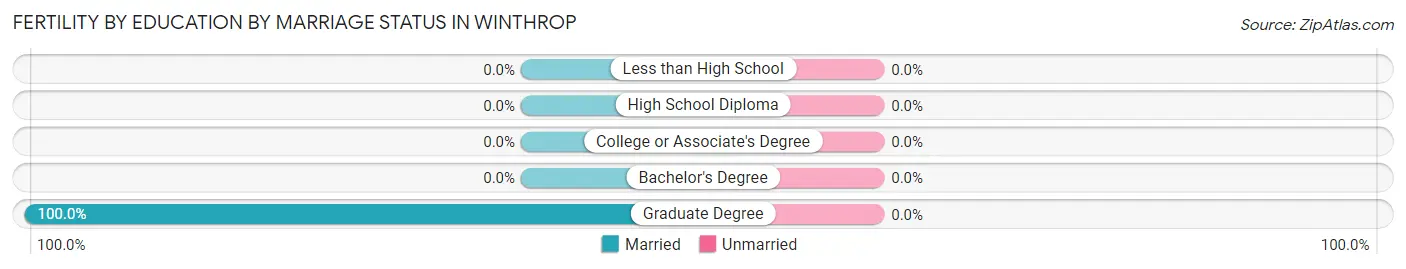
| Educational Attainment | Married | Unmarried |
| Less than High School | 0 (0.0%) | 0 (0.0%) |
| High School Diploma | 0 (0.0%) | 0 (0.0%) |
| College or Associate's Degree | 0 (0.0%) | 0 (0.0%) |
| Bachelor's Degree | 0 (0.0%) | 0 (0.0%) |
| Graduate Degree | 15 (100.0%) | 0 (0.0%) |
| Total | 15 (100.0%) | 0 (0.0%) |
Employment Characteristics in Winthrop
Employment by Class of Employer in Winthrop
Among the 125 employed individuals in Winthrop, not-for-profit organizations (40 | 32.0%), private company employees (32 | 25.6%), and local government employees (22 | 17.6%) make up the most common classes of employment.
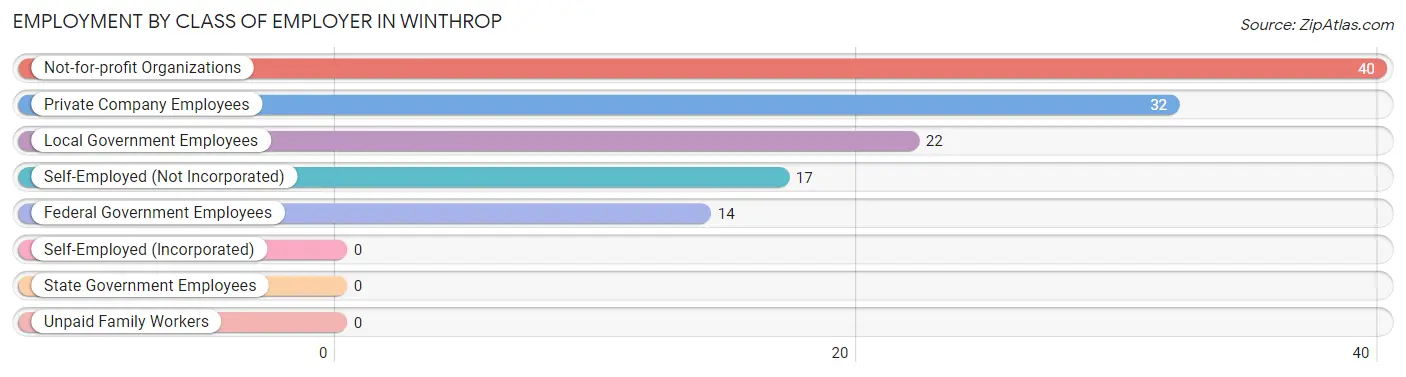
| Employer Class | # Employees | % Employees |
| Private Company Employees | 32 | 25.6% |
| Self-Employed (Incorporated) | 0 | 0.0% |
| Self-Employed (Not Incorporated) | 17 | 13.6% |
| Not-for-profit Organizations | 40 | 32.0% |
| Local Government Employees | 22 | 17.6% |
| State Government Employees | 0 | 0.0% |
| Federal Government Employees | 14 | 11.2% |
| Unpaid Family Workers | 0 | 0.0% |
| Total | 125 | 100.0% |
Employment Status by Age in Winthrop
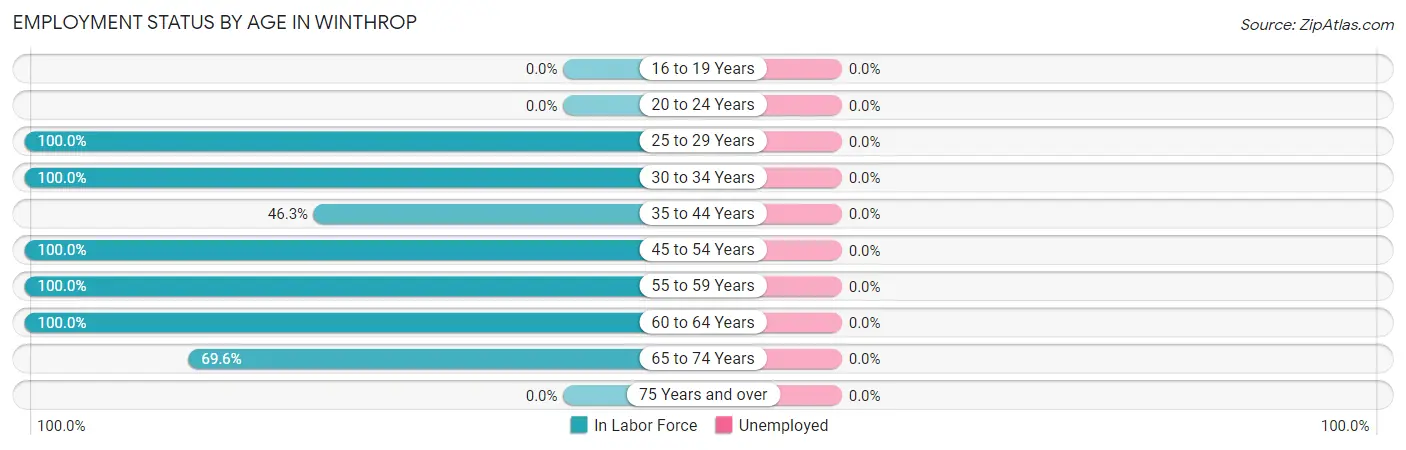
| Age Bracket | In Labor Force | Unemployed |
| 16 to 19 Years | 0 (0.0%) | 0 (0.0%) |
| 20 to 24 Years | 0 (0.0%) | 0 (0.0%) |
| 25 to 29 Years | 15 (100.0%) | 0 (0.0%) |
| 30 to 34 Years | 14 (100.0%) | 0 (0.0%) |
| 35 to 44 Years | 25 (46.3%) | 0 (0.0%) |
| 45 to 54 Years | 22 (100.0%) | 0 (0.0%) |
| 55 to 59 Years | 17 (100.0%) | 0 (0.0%) |
| 60 to 64 Years | 16 (100.0%) | 0 (0.0%) |
| 65 to 74 Years | 16 (69.6%) | 0 (0.0%) |
| 75 Years and over | 0 (0.0%) | 0 (0.0%) |
| Total | 125 (58.4%) | 0 (0.0%) |
Employment Status by Educational Attainment in Winthrop
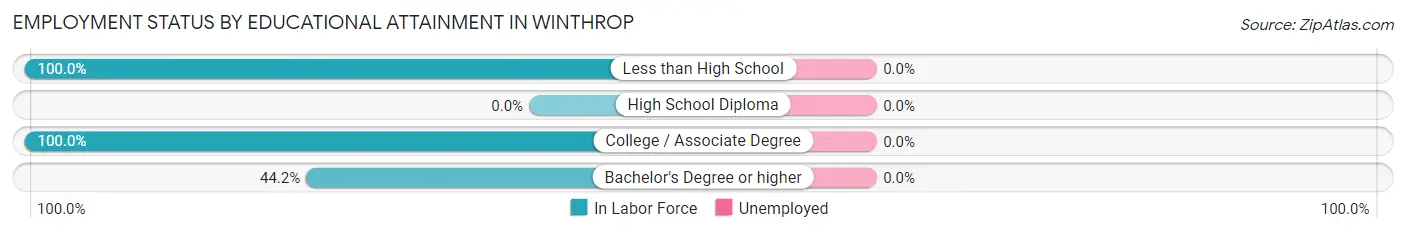
| Educational Attainment | In Labor Force | Unemployed |
| Less than High School | 17 (100.0%) | 0 (0.0%) |
| High School Diploma | 0 (0.0%) | 0 (0.0%) |
| College / Associate Degree | 69 (100.0%) | 0 (0.0%) |
| Bachelor's Degree or higher | 23 (44.2%) | 0 (0.0%) |
| Total | 109 (79.0%) | 0 (0.0%) |
Employment Occupations by Sex in Winthrop
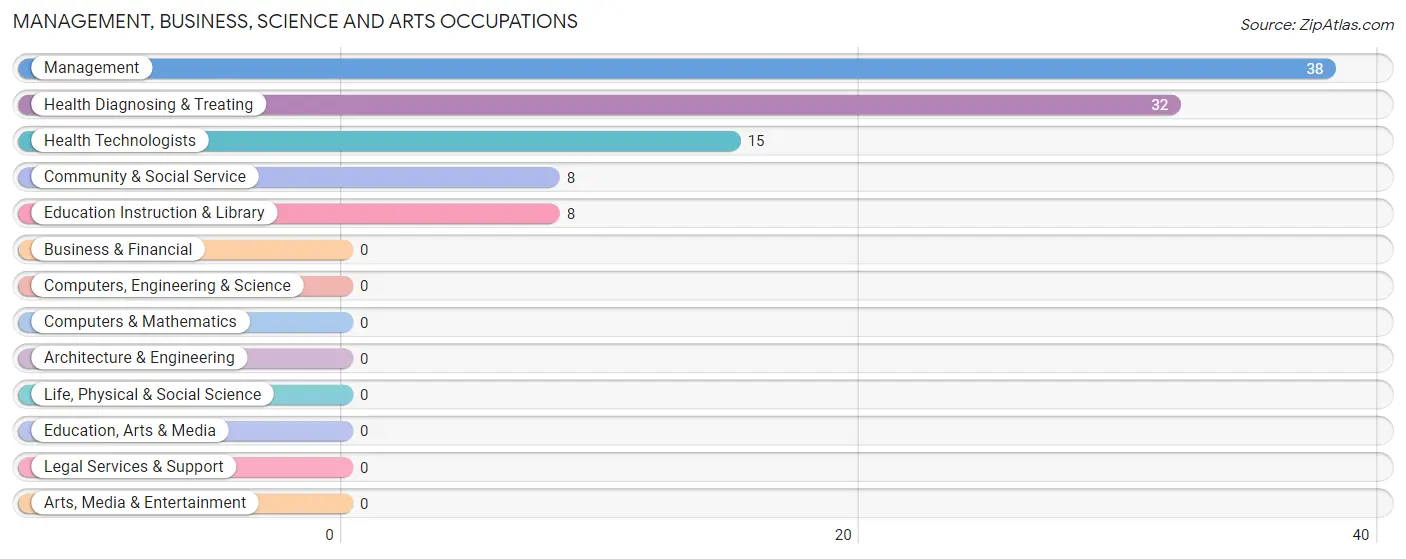
Management, Business, Science and Arts Occupations
The most common Management, Business, Science and Arts occupations in Winthrop are Management (38 | 30.4%), Health Diagnosing & Treating (32 | 25.6%), Health Technologists (15 | 12.0%), Community & Social Service (8 | 6.4%), and Education Instruction & Library (8 | 6.4%).
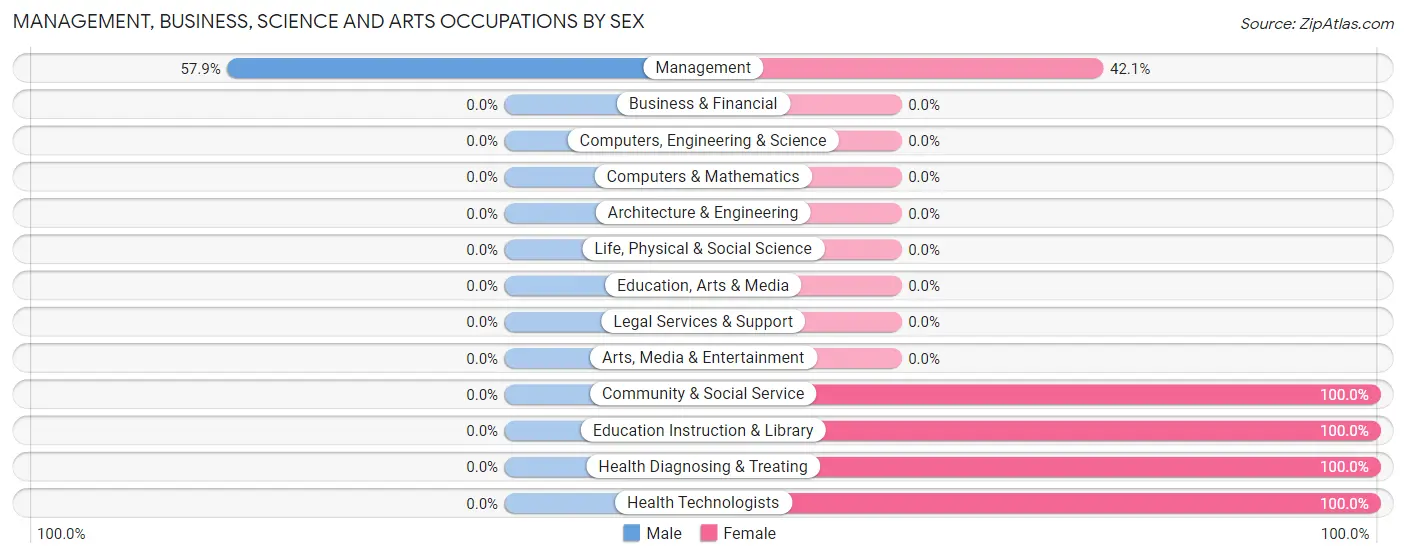
Management, Business, Science and Arts Occupations by Sex
| Occupation | Male | Female |
| Management | 22 (57.9%) | 16 (42.1%) |
| Business & Financial | 0 (0.0%) | 0 (0.0%) |
| Computers, Engineering & Science | 0 (0.0%) | 0 (0.0%) |
| Computers & Mathematics | 0 (0.0%) | 0 (0.0%) |
| Architecture & Engineering | 0 (0.0%) | 0 (0.0%) |
| Life, Physical & Social Science | 0 (0.0%) | 0 (0.0%) |
| Community & Social Service | 0 (0.0%) | 8 (100.0%) |
| Education, Arts & Media | 0 (0.0%) | 0 (0.0%) |
| Legal Services & Support | 0 (0.0%) | 0 (0.0%) |
| Education Instruction & Library | 0 (0.0%) | 8 (100.0%) |
| Arts, Media & Entertainment | 0 (0.0%) | 0 (0.0%) |
| Health Diagnosing & Treating | 0 (0.0%) | 32 (100.0%) |
| Health Technologists | 0 (0.0%) | 15 (100.0%) |
| Total (Category) | 22 (28.2%) | 56 (71.8%) |
| Total (Overall) | 69 (55.2%) | 56 (44.8%) |
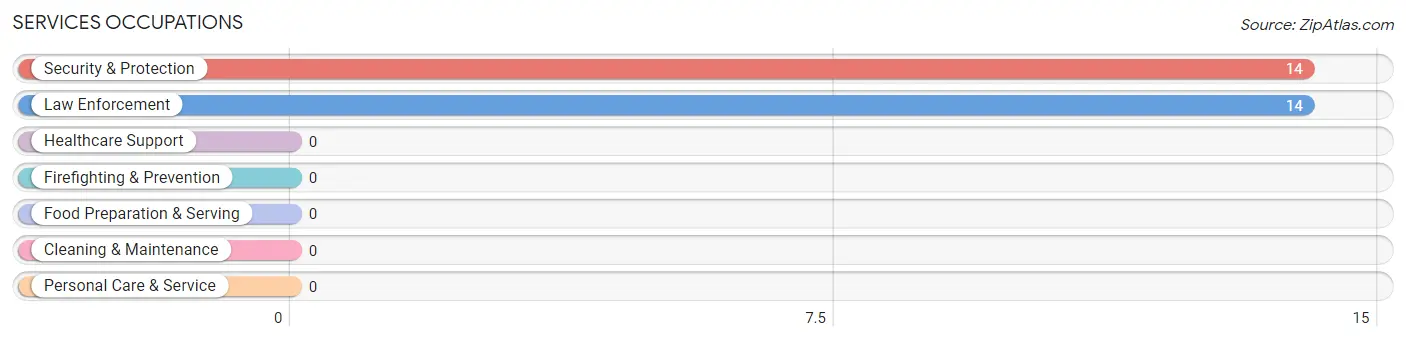
Services Occupations
The most common Services occupations in Winthrop are Security & Protection (14 | 11.2%), and Law Enforcement (14 | 11.2%).
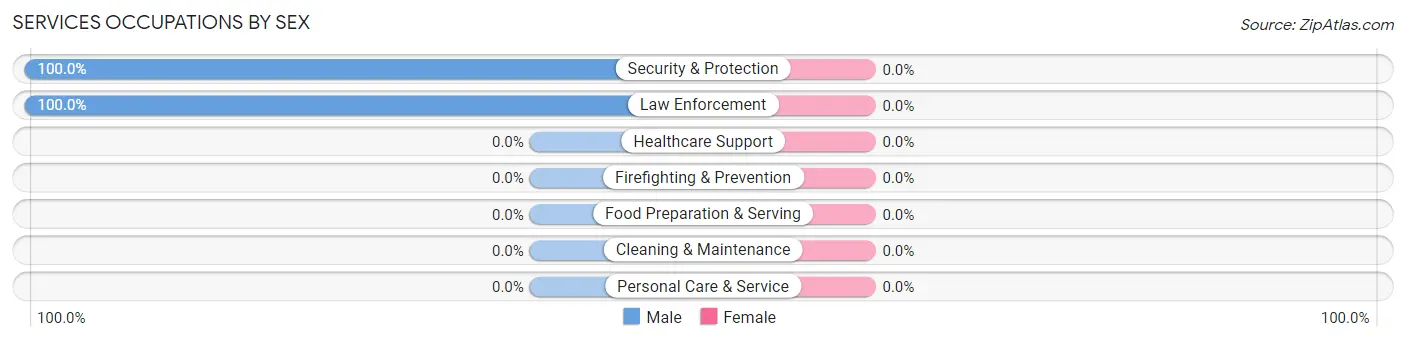
Services Occupations by Sex
| Occupation | Male | Female |
| Healthcare Support | 0 (0.0%) | 0 (0.0%) |
| Security & Protection | 14 (100.0%) | 0 (0.0%) |
| Firefighting & Prevention | 0 (0.0%) | 0 (0.0%) |
| Law Enforcement | 14 (100.0%) | 0 (0.0%) |
| Food Preparation & Serving | 0 (0.0%) | 0 (0.0%) |
| Cleaning & Maintenance | 0 (0.0%) | 0 (0.0%) |
| Personal Care & Service | 0 (0.0%) | 0 (0.0%) |
| Total (Category) | 14 (100.0%) | 0 (0.0%) |
| Total (Overall) | 69 (55.2%) | 56 (44.8%) |
Sales and Office Occupations
Sales and Office Occupations by Sex
| Occupation | Male | Female |
| Sales & Related | 0 (0.0%) | 0 (0.0%) |
| Office & Administration | 0 (0.0%) | 0 (0.0%) |
| Total (Category) | 0 (0.0%) | 0 (0.0%) |
| Total (Overall) | 69 (55.2%) | 56 (44.8%) |
Natural Resources, Construction and Maintenance Occupations
Natural Resources, Construction and Maintenance Occupations by Sex
| Occupation | Male | Female |
| Farming, Fishing & Forestry | 0 (0.0%) | 0 (0.0%) |
| Construction & Extraction | 0 (0.0%) | 0 (0.0%) |
| Installation, Maintenance & Repair | 0 (0.0%) | 0 (0.0%) |
| Total (Category) | 0 (0.0%) | 0 (0.0%) |
| Total (Overall) | 69 (55.2%) | 56 (44.8%) |
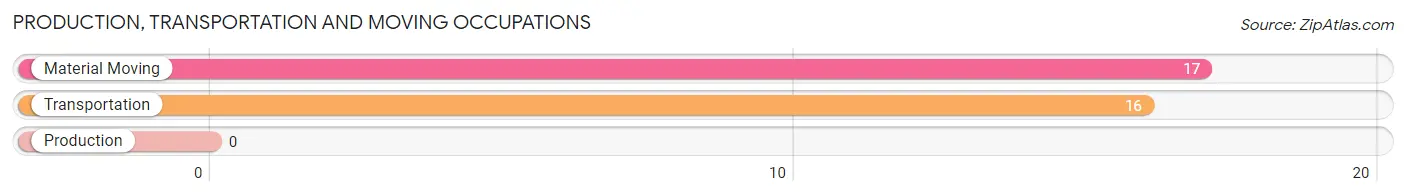
Production, Transportation and Moving Occupations
The most common Production, Transportation and Moving occupations in Winthrop are Material Moving (17 | 13.6%), and Transportation (16 | 12.8%).
Production, Transportation and Moving Occupations by Sex
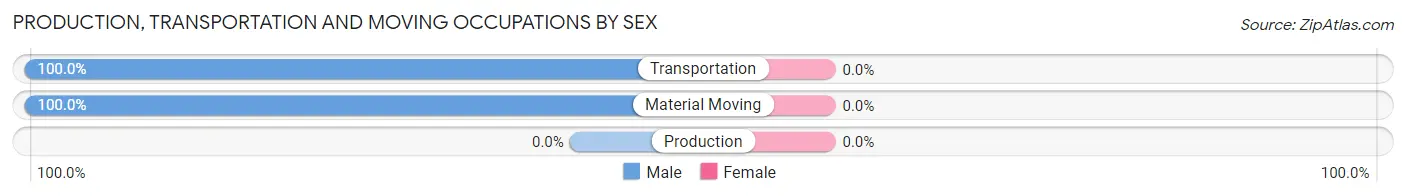
| Occupation | Male | Female |
| Production | 0 (0.0%) | 0 (0.0%) |
| Transportation | 16 (100.0%) | 0 (0.0%) |
| Material Moving | 17 (100.0%) | 0 (0.0%) |
| Total (Category) | 33 (100.0%) | 0 (0.0%) |
| Total (Overall) | 69 (55.2%) | 56 (44.8%) |
Employment Industries by Sex in Winthrop
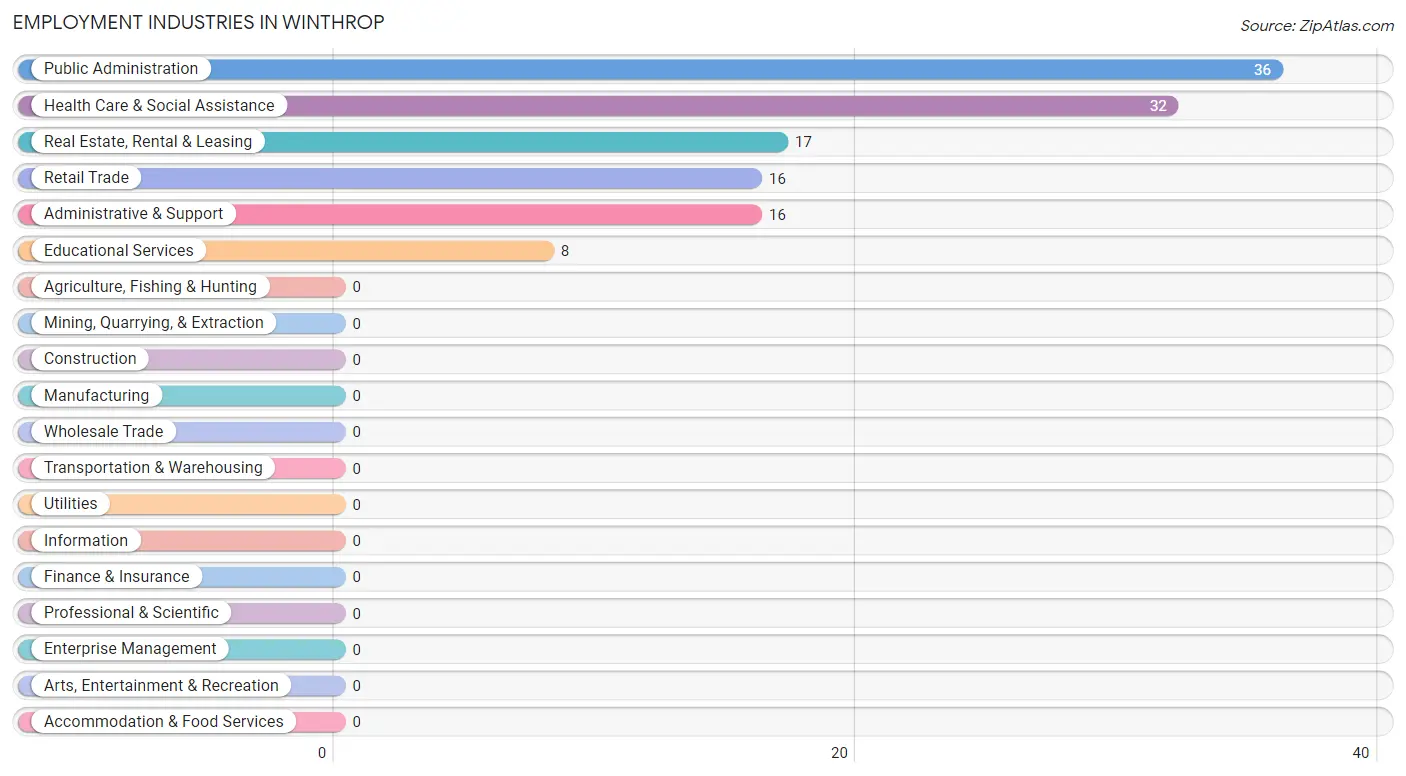
Employment Industries in Winthrop
The major employment industries in Winthrop include Public Administration (36 | 28.8%), Health Care & Social Assistance (32 | 25.6%), Real Estate, Rental & Leasing (17 | 13.6%), Retail Trade (16 | 12.8%), and Administrative & Support (16 | 12.8%).
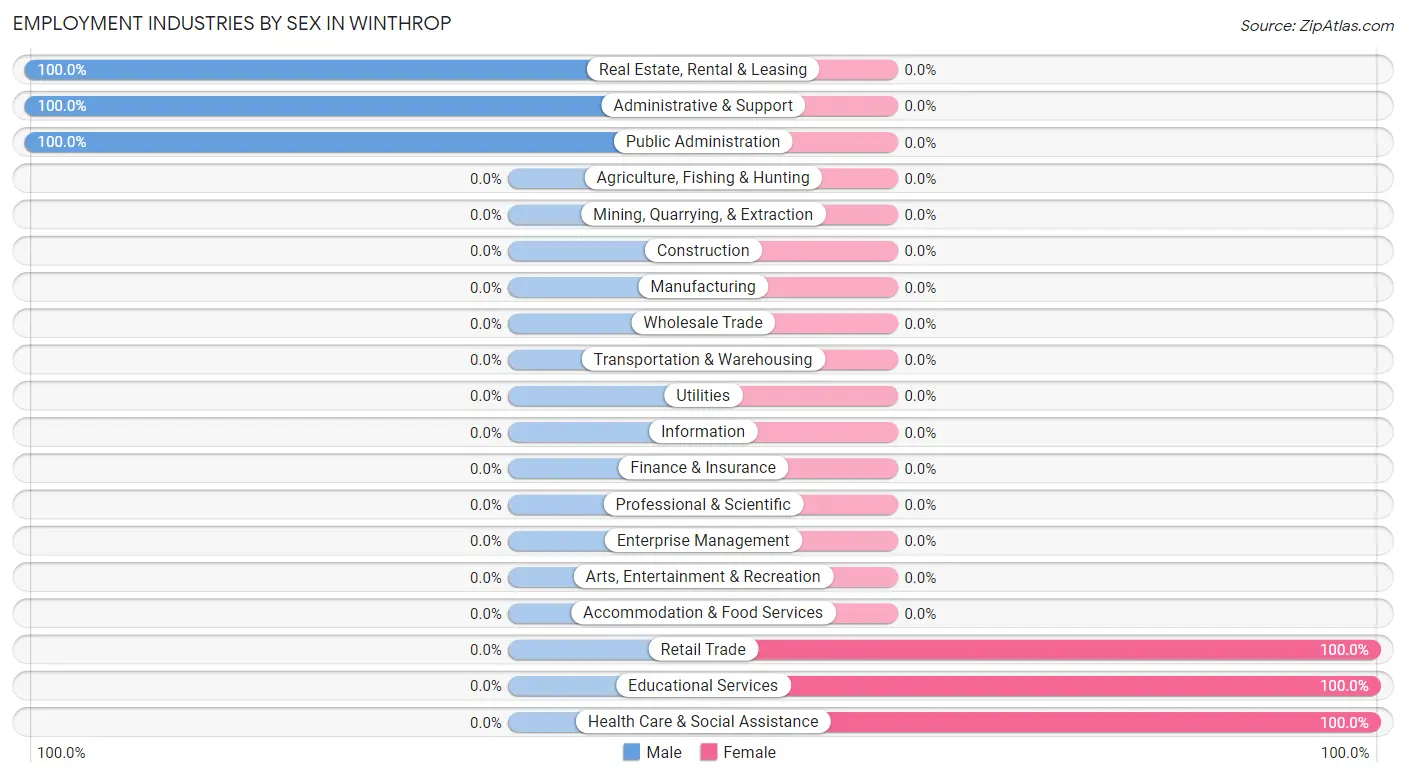
Employment Industries by Sex in Winthrop
The Winthrop industries that see more men than women are Real Estate, Rental & Leasing (100.0%), Administrative & Support (100.0%), and Public Administration (100.0%), whereas the industries that tend to have a higher number of women are Retail Trade (100.0%), Educational Services (100.0%), and Health Care & Social Assistance (100.0%).
| Industry | Male | Female |
| Agriculture, Fishing & Hunting | 0 (0.0%) | 0 (0.0%) |
| Mining, Quarrying, & Extraction | 0 (0.0%) | 0 (0.0%) |
| Construction | 0 (0.0%) | 0 (0.0%) |
| Manufacturing | 0 (0.0%) | 0 (0.0%) |
| Wholesale Trade | 0 (0.0%) | 0 (0.0%) |
| Retail Trade | 0 (0.0%) | 16 (100.0%) |
| Transportation & Warehousing | 0 (0.0%) | 0 (0.0%) |
| Utilities | 0 (0.0%) | 0 (0.0%) |
| Information | 0 (0.0%) | 0 (0.0%) |
| Finance & Insurance | 0 (0.0%) | 0 (0.0%) |
| Real Estate, Rental & Leasing | 17 (100.0%) | 0 (0.0%) |
| Professional & Scientific | 0 (0.0%) | 0 (0.0%) |
| Enterprise Management | 0 (0.0%) | 0 (0.0%) |
| Administrative & Support | 16 (100.0%) | 0 (0.0%) |
| Educational Services | 0 (0.0%) | 8 (100.0%) |
| Health Care & Social Assistance | 0 (0.0%) | 32 (100.0%) |
| Arts, Entertainment & Recreation | 0 (0.0%) | 0 (0.0%) |
| Accommodation & Food Services | 0 (0.0%) | 0 (0.0%) |
| Public Administration | 36 (100.0%) | 0 (0.0%) |
| Total | 69 (55.2%) | 56 (44.8%) |
Education in Winthrop
School Enrollment in Winthrop
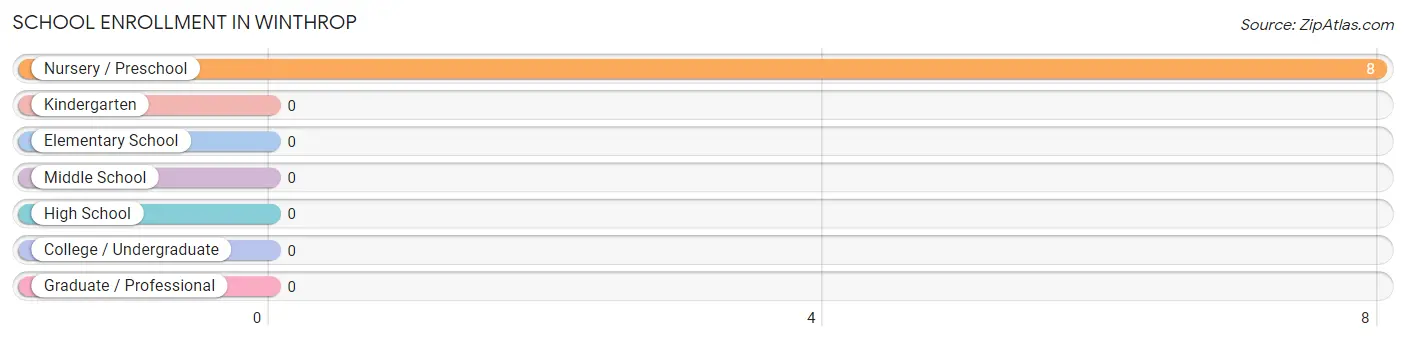
| School Level | # Students | % Students |
| Nursery / Preschool | 8 | 100.0% |
| Kindergarten | 0 | 0.0% |
| Elementary School | 0 | 0.0% |
| Middle School | 0 | 0.0% |
| High School | 0 | 0.0% |
| College / Undergraduate | 0 | 0.0% |
| Graduate / Professional | 0 | 0.0% |
| Total | 8 | 100.0% |
School Enrollment by Age by Funding Source in Winthrop
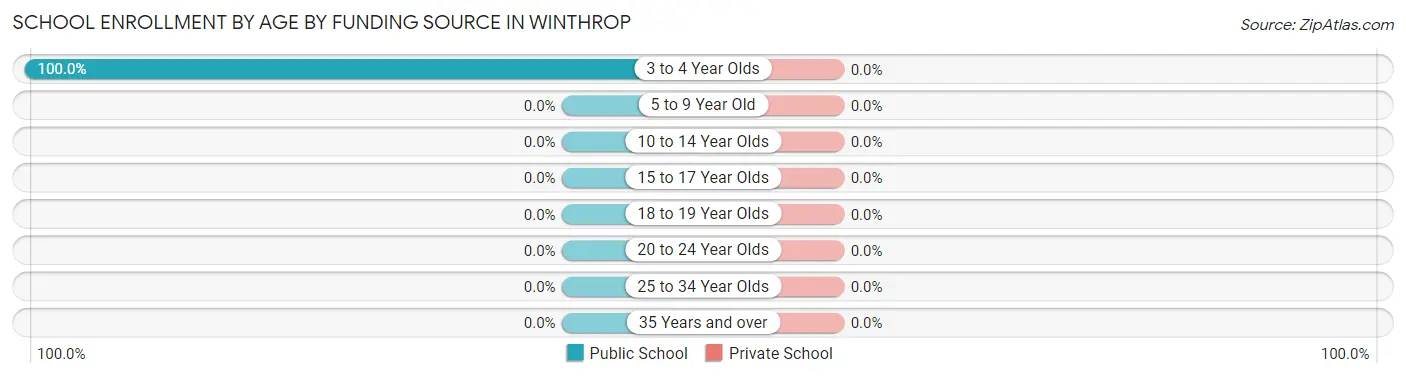
| Age Bracket | Public School | Private School |
| 3 to 4 Year Olds | 8 (100.0%) | 0 (0.0%) |
| 5 to 9 Year Old | 0 (0.0%) | 0 (0.0%) |
| 10 to 14 Year Olds | 0 (0.0%) | 0 (0.0%) |
| 15 to 17 Year Olds | 0 (0.0%) | 0 (0.0%) |
| 18 to 19 Year Olds | 0 (0.0%) | 0 (0.0%) |
| 20 to 24 Year Olds | 0 (0.0%) | 0 (0.0%) |
| 25 to 34 Year Olds | 0 (0.0%) | 0 (0.0%) |
| 35 Years and over | 0 (0.0%) | 0 (0.0%) |
| Total | 8 (100.0%) | 0 (0.0%) |
Educational Attainment by Field of Study in Winthrop
Arts & humanities (17 | 25.4%), bio, nature & agricultural (15 | 22.4%), psychology (15 | 22.4%), social sciences (12 | 17.9%), and visual & performing arts (8 | 11.9%) are the most common fields of study among 67 individuals in Winthrop who have obtained a bachelor's degree or higher.
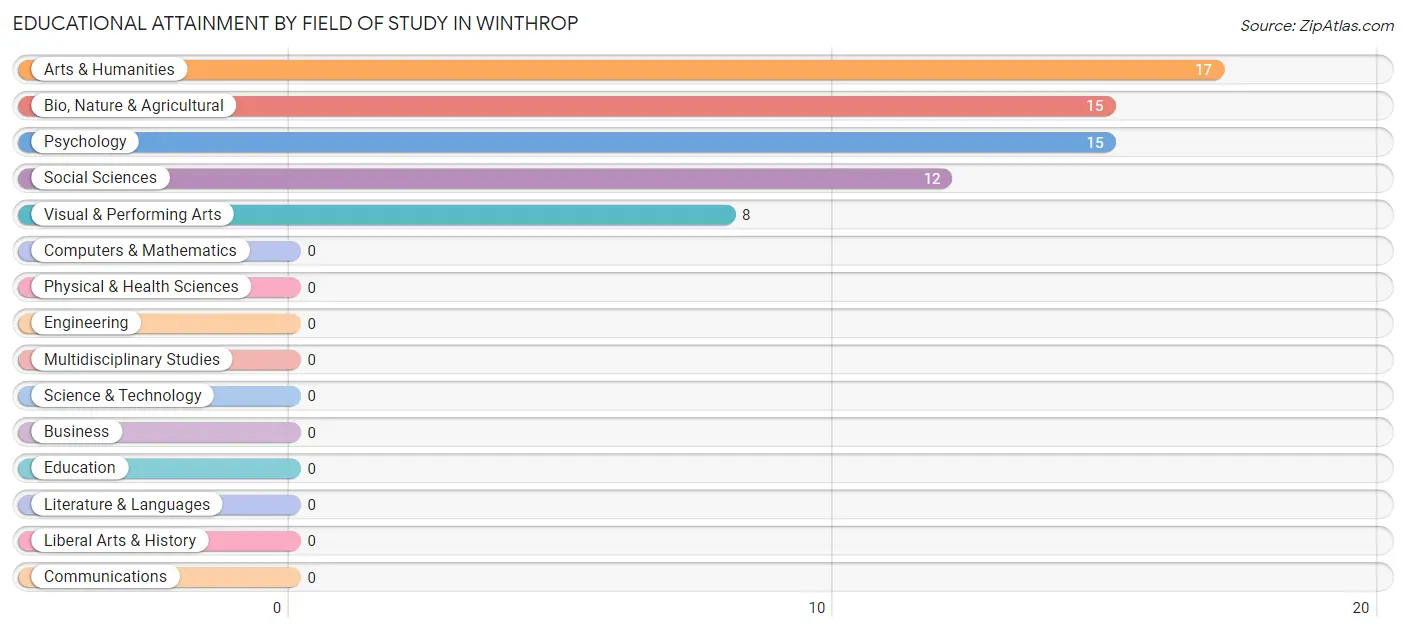
| Field of Study | # Graduates | % Graduates |
| Computers & Mathematics | 0 | 0.0% |
| Bio, Nature & Agricultural | 15 | 22.4% |
| Physical & Health Sciences | 0 | 0.0% |
| Psychology | 15 | 22.4% |
| Social Sciences | 12 | 17.9% |
| Engineering | 0 | 0.0% |
| Multidisciplinary Studies | 0 | 0.0% |
| Science & Technology | 0 | 0.0% |
| Business | 0 | 0.0% |
| Education | 0 | 0.0% |
| Literature & Languages | 0 | 0.0% |
| Liberal Arts & History | 0 | 0.0% |
| Visual & Performing Arts | 8 | 11.9% |
| Communications | 0 | 0.0% |
| Arts & Humanities | 17 | 25.4% |
| Total | 67 | 100.0% |
Transportation & Commute in Winthrop
Vehicle Availability by Sex in Winthrop
The most prevalent vehicle ownership categories in Winthrop are males with 2 vehicles (69, accounting for 100.0%) and females with 2 vehicles (48, making up 123.2%).
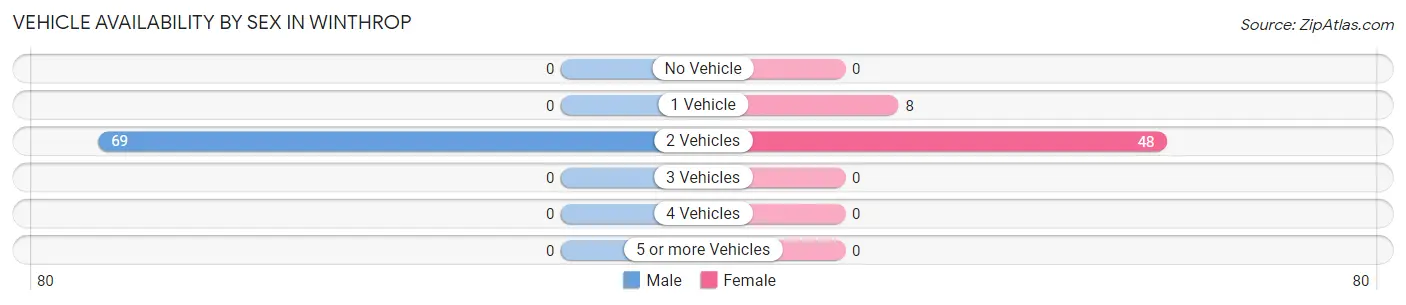
| Vehicles Available | Male | Female |
| No Vehicle | 0 (0.0%) | 0 (0.0%) |
| 1 Vehicle | 0 (0.0%) | 8 (14.3%) |
| 2 Vehicles | 69 (100.0%) | 48 (85.7%) |
| 3 Vehicles | 0 (0.0%) | 0 (0.0%) |
| 4 Vehicles | 0 (0.0%) | 0 (0.0%) |
| 5 or more Vehicles | 0 (0.0%) | 0 (0.0%) |
| Total | 69 (100.0%) | 56 (100.0%) |
Commute Time in Winthrop
The most frequently occuring commute durations in Winthrop are 20 to 24 minutes (47 commuters, 37.6%), 25 to 29 minutes (33 commuters, 26.4%), and 30 to 34 minutes (23 commuters, 18.4%).
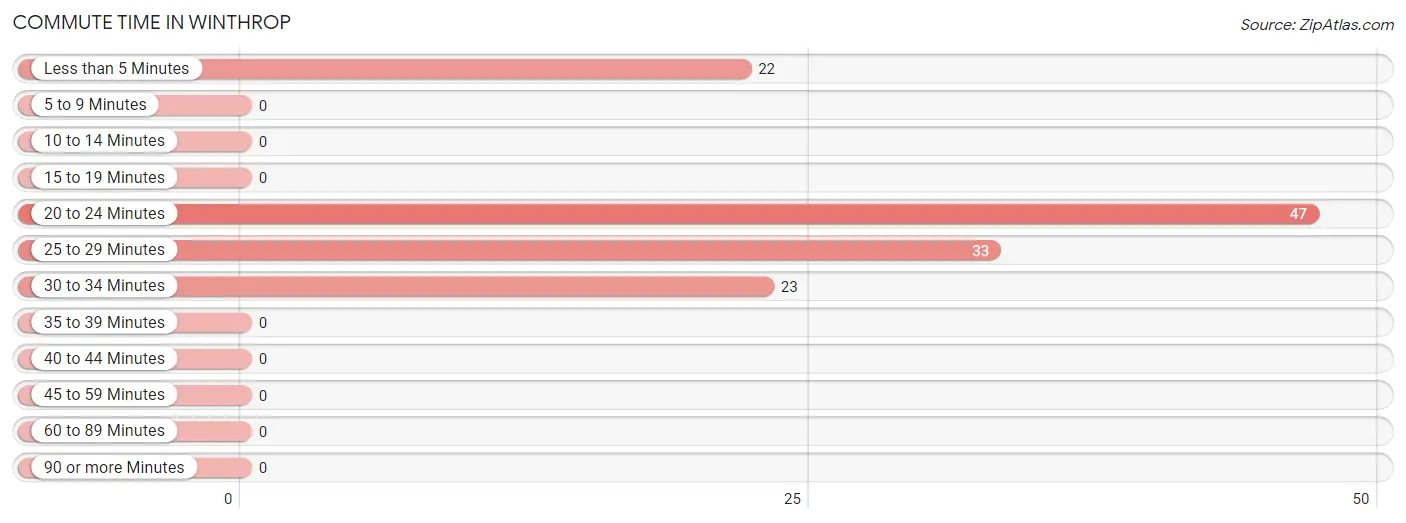
| Commute Time | # Commuters | % Commuters |
| Less than 5 Minutes | 22 | 17.6% |
| 5 to 9 Minutes | 0 | 0.0% |
| 10 to 14 Minutes | 0 | 0.0% |
| 15 to 19 Minutes | 0 | 0.0% |
| 20 to 24 Minutes | 47 | 37.6% |
| 25 to 29 Minutes | 33 | 26.4% |
| 30 to 34 Minutes | 23 | 18.4% |
| 35 to 39 Minutes | 0 | 0.0% |
| 40 to 44 Minutes | 0 | 0.0% |
| 45 to 59 Minutes | 0 | 0.0% |
| 60 to 89 Minutes | 0 | 0.0% |
| 90 or more Minutes | 0 | 0.0% |
Commute Time by Sex in Winthrop
The most common commute times in Winthrop are 25 to 29 minutes (33 commuters, 47.8%) for males and 20 to 24 minutes (33 commuters, 58.9%) for females.
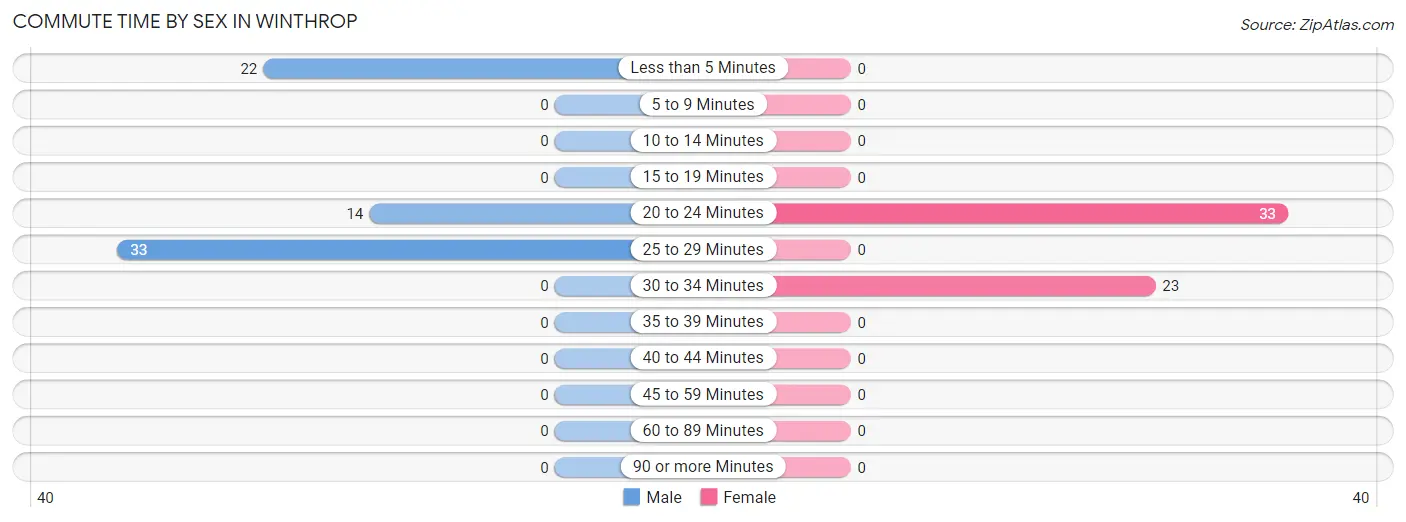
| Commute Time | Male | Female |
| Less than 5 Minutes | 22 (31.9%) | 0 (0.0%) |
| 5 to 9 Minutes | 0 (0.0%) | 0 (0.0%) |
| 10 to 14 Minutes | 0 (0.0%) | 0 (0.0%) |
| 15 to 19 Minutes | 0 (0.0%) | 0 (0.0%) |
| 20 to 24 Minutes | 14 (20.3%) | 33 (58.9%) |
| 25 to 29 Minutes | 33 (47.8%) | 0 (0.0%) |
| 30 to 34 Minutes | 0 (0.0%) | 23 (41.1%) |
| 35 to 39 Minutes | 0 (0.0%) | 0 (0.0%) |
| 40 to 44 Minutes | 0 (0.0%) | 0 (0.0%) |
| 45 to 59 Minutes | 0 (0.0%) | 0 (0.0%) |
| 60 to 89 Minutes | 0 (0.0%) | 0 (0.0%) |
| 90 or more Minutes | 0 (0.0%) | 0 (0.0%) |
Time of Departure to Work by Sex in Winthrop
The most frequent times of departure to work in Winthrop are 6:30 AM to 6:59 AM (33, 47.8%) for males and 5:30 AM to 5:59 AM (17, 30.4%) for females.
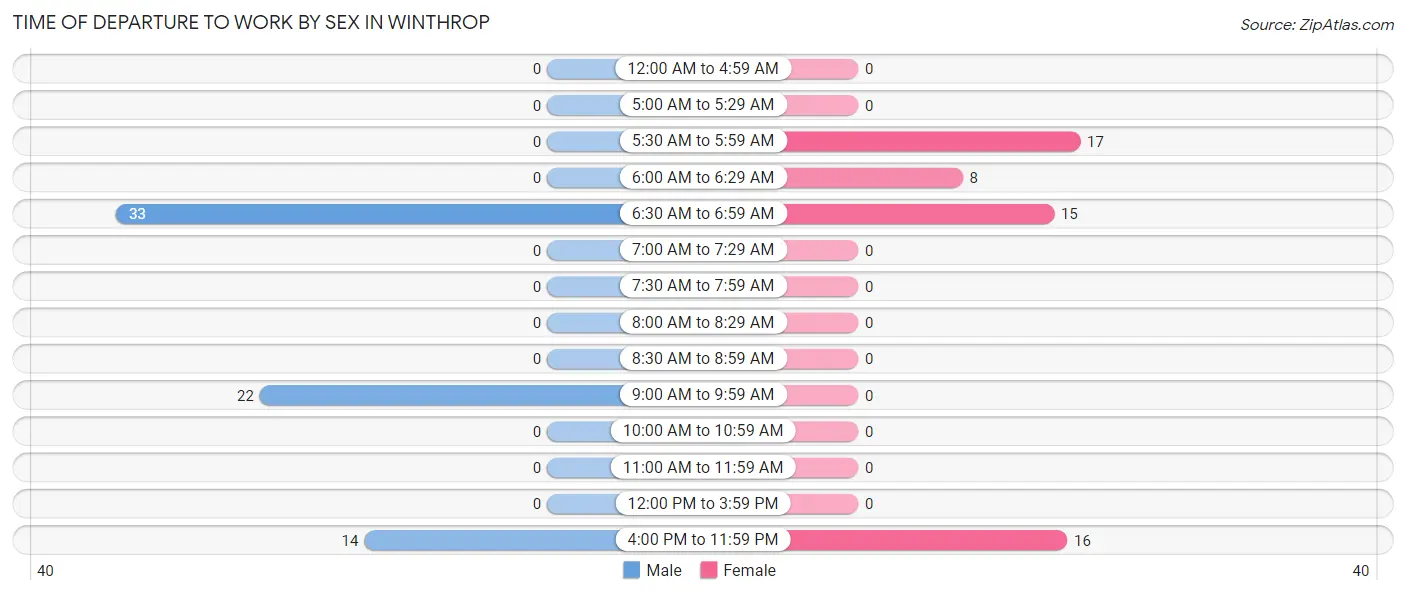
| Time of Departure | Male | Female |
| 12:00 AM to 4:59 AM | 0 (0.0%) | 0 (0.0%) |
| 5:00 AM to 5:29 AM | 0 (0.0%) | 0 (0.0%) |
| 5:30 AM to 5:59 AM | 0 (0.0%) | 17 (30.4%) |
| 6:00 AM to 6:29 AM | 0 (0.0%) | 8 (14.3%) |
| 6:30 AM to 6:59 AM | 33 (47.8%) | 15 (26.8%) |
| 7:00 AM to 7:29 AM | 0 (0.0%) | 0 (0.0%) |
| 7:30 AM to 7:59 AM | 0 (0.0%) | 0 (0.0%) |
| 8:00 AM to 8:29 AM | 0 (0.0%) | 0 (0.0%) |
| 8:30 AM to 8:59 AM | 0 (0.0%) | 0 (0.0%) |
| 9:00 AM to 9:59 AM | 22 (31.9%) | 0 (0.0%) |
| 10:00 AM to 10:59 AM | 0 (0.0%) | 0 (0.0%) |
| 11:00 AM to 11:59 AM | 0 (0.0%) | 0 (0.0%) |
| 12:00 PM to 3:59 PM | 0 (0.0%) | 0 (0.0%) |
| 4:00 PM to 11:59 PM | 14 (20.3%) | 16 (28.6%) |
| Total | 69 (100.0%) | 56 (100.0%) |
Housing Occupancy in Winthrop
Occupancy by Ownership in Winthrop
Of the total 133 dwellings in Winthrop, owner-occupied units account for 121 (91.0%), while renter-occupied units make up 12 (9.0%).
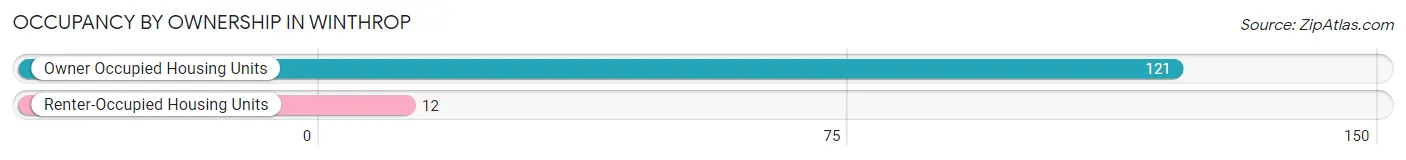
| Occupancy | # Housing Units | % Housing Units |
| Owner Occupied Housing Units | 121 | 91.0% |
| Renter-Occupied Housing Units | 12 | 9.0% |
| Total Occupied Housing Units | 133 | 100.0% |
Occupancy by Household Size in Winthrop
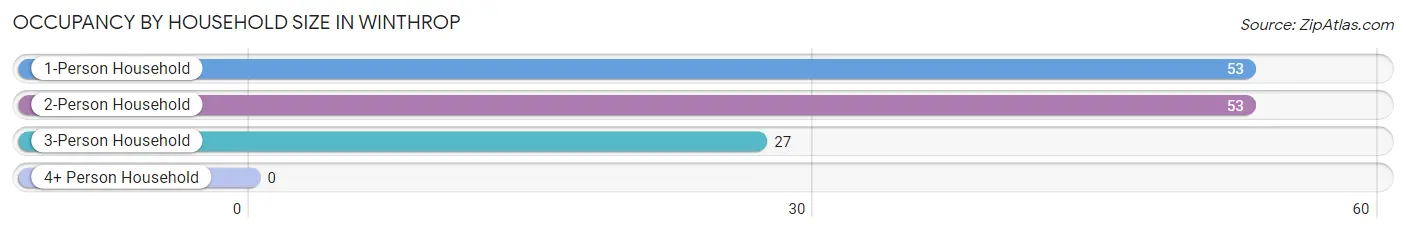
| Household Size | # Housing Units | % Housing Units |
| 1-Person Household | 53 | 39.9% |
| 2-Person Household | 53 | 39.9% |
| 3-Person Household | 27 | 20.3% |
| 4+ Person Household | 0 | 0.0% |
| Total Housing Units | 133 | 100.0% |
Occupancy by Ownership by Household Size in Winthrop
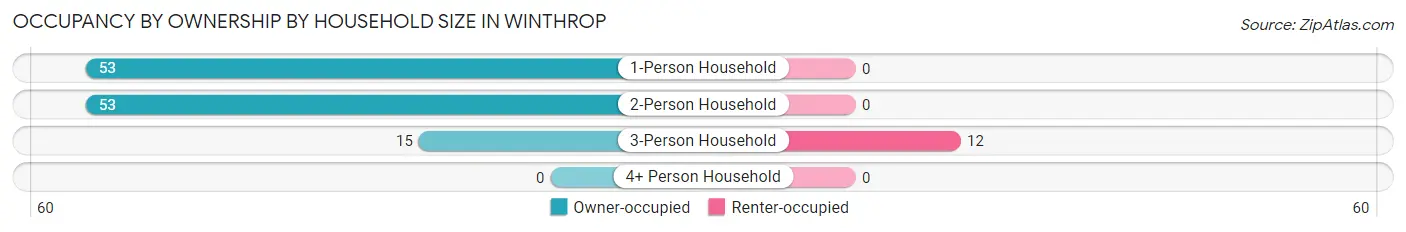
| Household Size | Owner-occupied | Renter-occupied |
| 1-Person Household | 53 (100.0%) | 0 (0.0%) |
| 2-Person Household | 53 (100.0%) | 0 (0.0%) |
| 3-Person Household | 15 (55.6%) | 12 (44.4%) |
| 4+ Person Household | 0 (0.0%) | 0 (0.0%) |
| Total Housing Units | 121 (91.0%) | 12 (9.0%) |
Occupancy by Educational Attainment in Winthrop
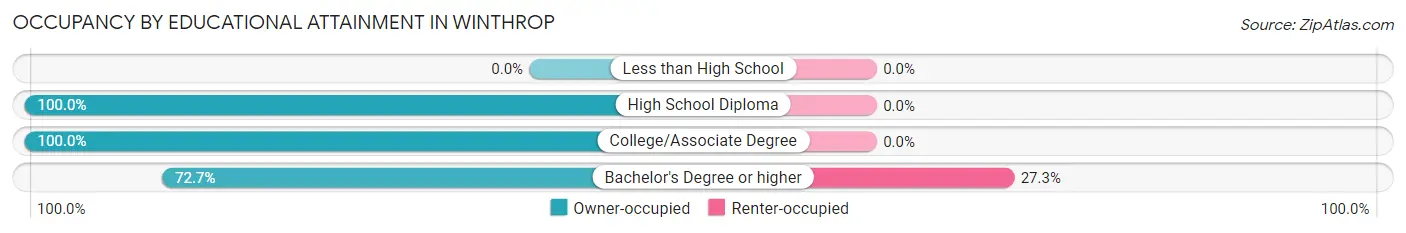
| Household Size | Owner-occupied | Renter-occupied |
| Less than High School | 0 (0.0%) | 0 (0.0%) |
| High School Diploma | 19 (100.0%) | 0 (0.0%) |
| College/Associate Degree | 70 (100.0%) | 0 (0.0%) |
| Bachelor's Degree or higher | 32 (72.7%) | 12 (27.3%) |
Occupancy by Age of Householder in Winthrop
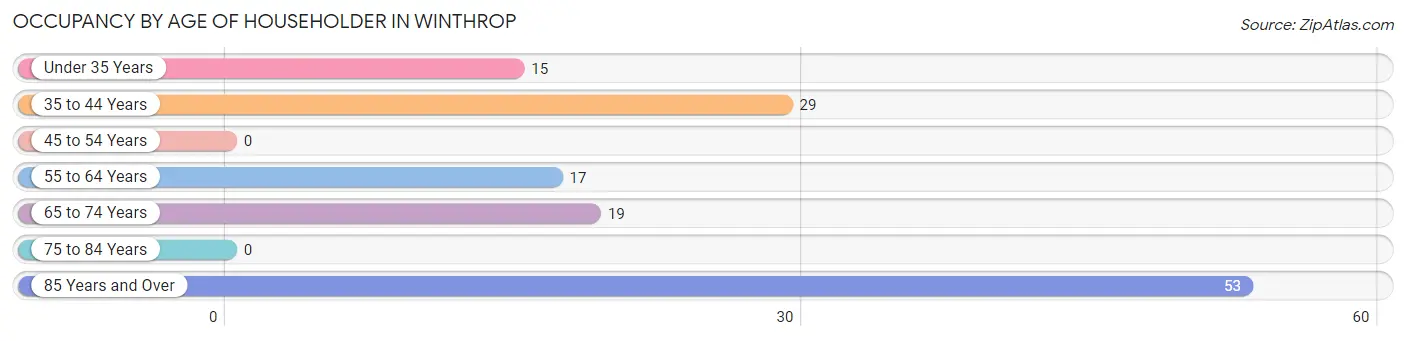
| Age Bracket | # Households | % Households |
| Under 35 Years | 15 | 11.3% |
| 35 to 44 Years | 29 | 21.8% |
| 45 to 54 Years | 0 | 0.0% |
| 55 to 64 Years | 17 | 12.8% |
| 65 to 74 Years | 19 | 14.3% |
| 75 to 84 Years | 0 | 0.0% |
| 85 Years and Over | 53 | 39.9% |
| Total | 133 | 100.0% |
Housing Finances in Winthrop
Median Income by Occupancy in Winthrop
| Occupancy Type | # Households | Median Income |
| Owner-Occupied | 121 (91.0%) | $0 |
| Renter-Occupied | 12 (9.0%) | $0 |
| Average | 133 (100.0%) | $0 |
Occupancy by Householder Income Bracket in Winthrop
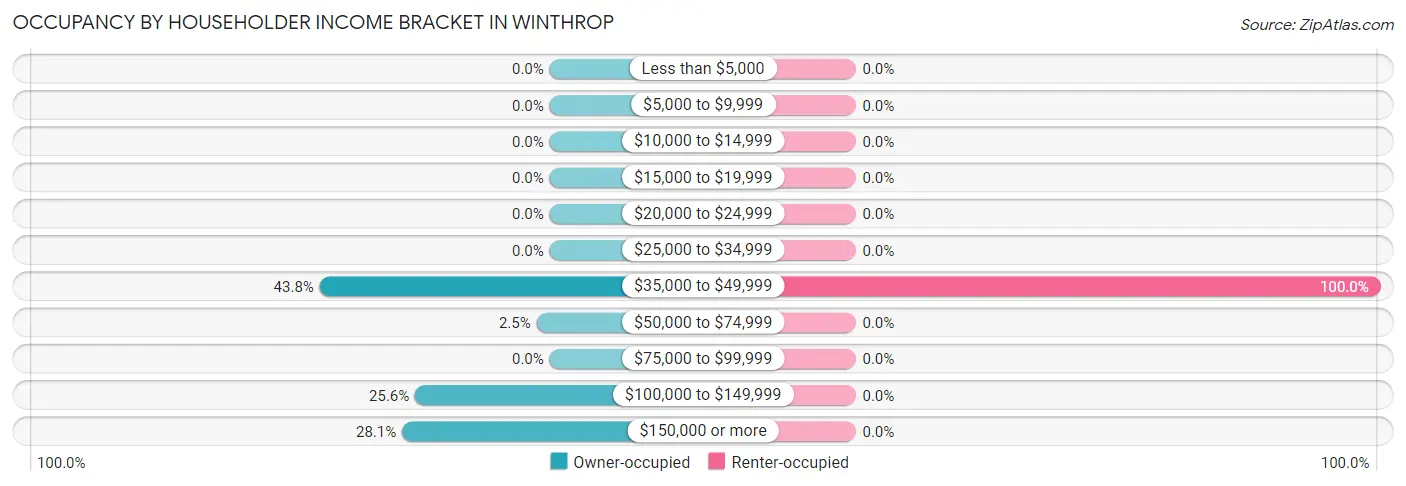
| Income Bracket | Owner-occupied | Renter-occupied |
| Less than $5,000 | 0 (0.0%) | 0 (0.0%) |
| $5,000 to $9,999 | 0 (0.0%) | 0 (0.0%) |
| $10,000 to $14,999 | 0 (0.0%) | 0 (0.0%) |
| $15,000 to $19,999 | 0 (0.0%) | 0 (0.0%) |
| $20,000 to $24,999 | 0 (0.0%) | 0 (0.0%) |
| $25,000 to $34,999 | 0 (0.0%) | 0 (0.0%) |
| $35,000 to $49,999 | 53 (43.8%) | 12 (100.0%) |
| $50,000 to $74,999 | 3 (2.5%) | 0 (0.0%) |
| $75,000 to $99,999 | 0 (0.0%) | 0 (0.0%) |
| $100,000 to $149,999 | 31 (25.6%) | 0 (0.0%) |
| $150,000 or more | 34 (28.1%) | 0 (0.0%) |
| Total | 121 (100.0%) | 12 (100.0%) |
Monthly Housing Cost Tiers in Winthrop
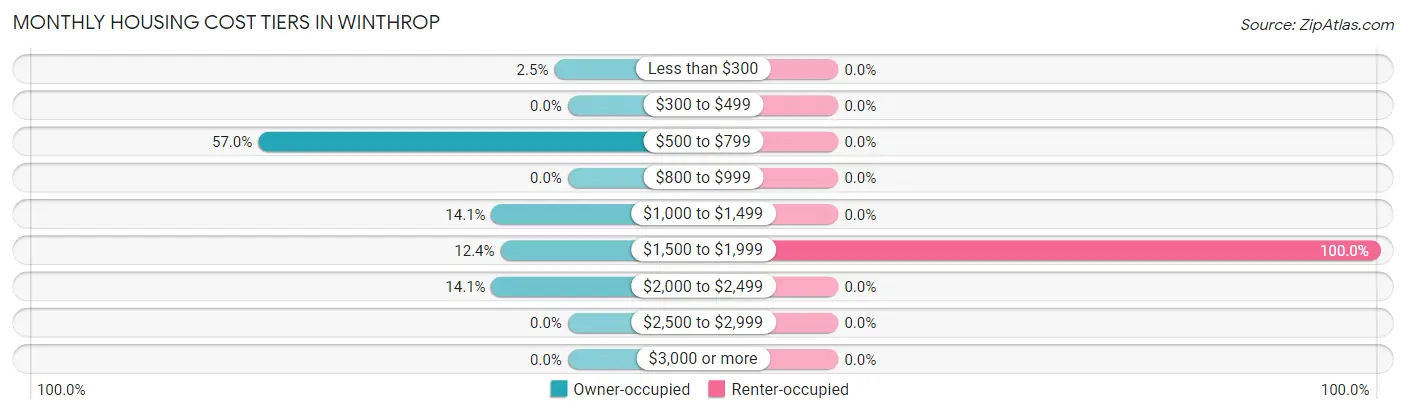
| Monthly Cost | Owner-occupied | Renter-occupied |
| Less than $300 | 3 (2.5%) | 0 (0.0%) |
| $300 to $499 | 0 (0.0%) | 0 (0.0%) |
| $500 to $799 | 69 (57.0%) | 0 (0.0%) |
| $800 to $999 | 0 (0.0%) | 0 (0.0%) |
| $1,000 to $1,499 | 17 (14.1%) | 0 (0.0%) |
| $1,500 to $1,999 | 15 (12.4%) | 12 (100.0%) |
| $2,000 to $2,499 | 17 (14.1%) | 0 (0.0%) |
| $2,500 to $2,999 | 0 (0.0%) | 0 (0.0%) |
| $3,000 or more | 0 (0.0%) | 0 (0.0%) |
| Total | 121 (100.0%) | 12 (100.0%) |
Physical Housing Characteristics in Winthrop
Housing Structures in Winthrop
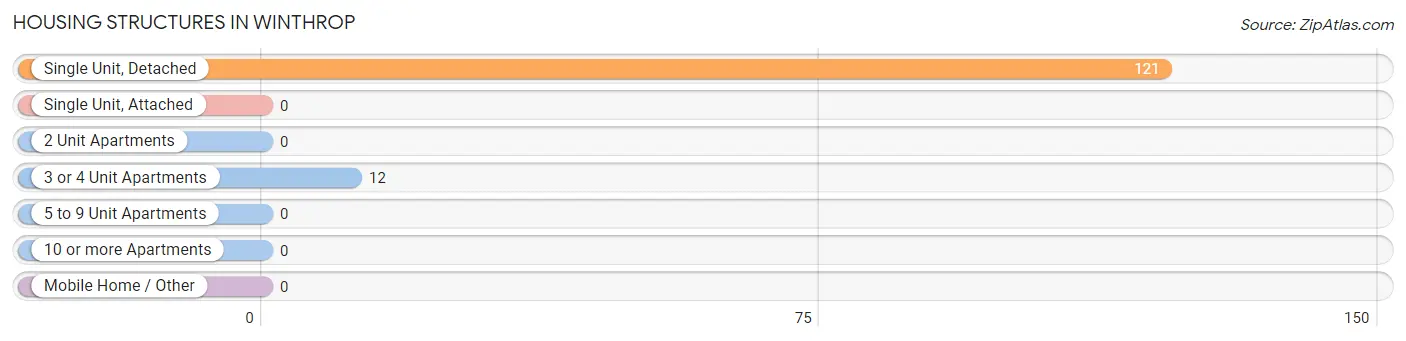
| Structure Type | # Housing Units | % Housing Units |
| Single Unit, Detached | 121 | 91.0% |
| Single Unit, Attached | 0 | 0.0% |
| 2 Unit Apartments | 0 | 0.0% |
| 3 or 4 Unit Apartments | 12 | 9.0% |
| 5 to 9 Unit Apartments | 0 | 0.0% |
| 10 or more Apartments | 0 | 0.0% |
| Mobile Home / Other | 0 | 0.0% |
| Total | 133 | 100.0% |
Housing Structures by Occupancy in Winthrop
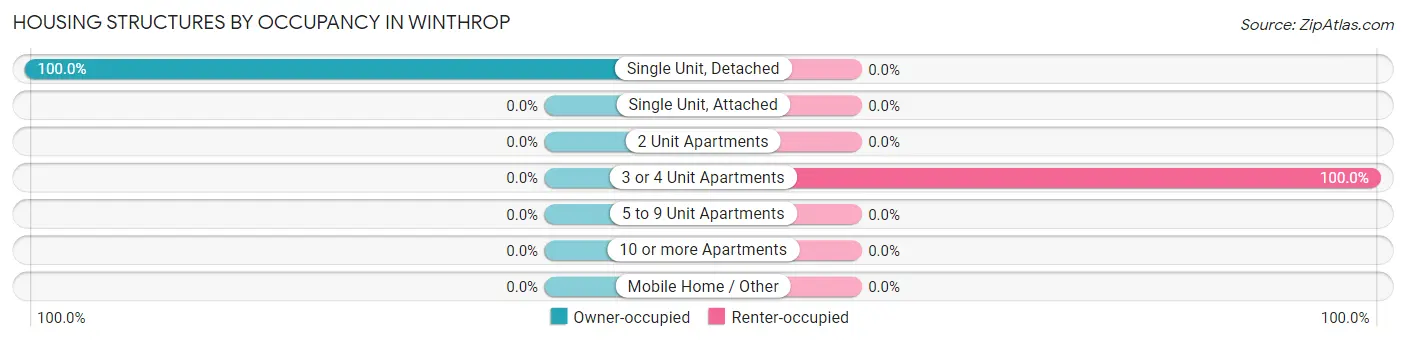
| Structure Type | Owner-occupied | Renter-occupied |
| Single Unit, Detached | 121 (100.0%) | 0 (0.0%) |
| Single Unit, Attached | 0 (0.0%) | 0 (0.0%) |
| 2 Unit Apartments | 0 (0.0%) | 0 (0.0%) |
| 3 or 4 Unit Apartments | 0 (0.0%) | 12 (100.0%) |
| 5 to 9 Unit Apartments | 0 (0.0%) | 0 (0.0%) |
| 10 or more Apartments | 0 (0.0%) | 0 (0.0%) |
| Mobile Home / Other | 0 (0.0%) | 0 (0.0%) |
| Total | 121 (91.0%) | 12 (9.0%) |
Housing Structures by Number of Rooms in Winthrop
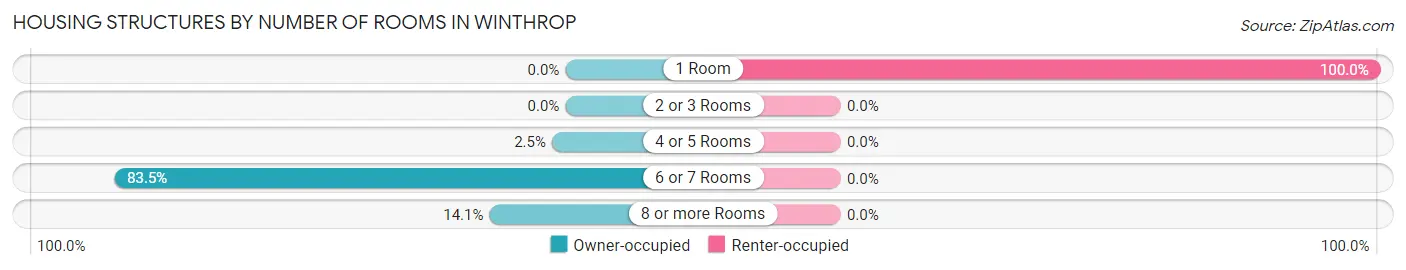
| Number of Rooms | Owner-occupied | Renter-occupied |
| 1 Room | 0 (0.0%) | 12 (100.0%) |
| 2 or 3 Rooms | 0 (0.0%) | 0 (0.0%) |
| 4 or 5 Rooms | 3 (2.5%) | 0 (0.0%) |
| 6 or 7 Rooms | 101 (83.5%) | 0 (0.0%) |
| 8 or more Rooms | 17 (14.1%) | 0 (0.0%) |
| Total | 121 (100.0%) | 12 (100.0%) |
Housing Structure by Heating Type in Winthrop
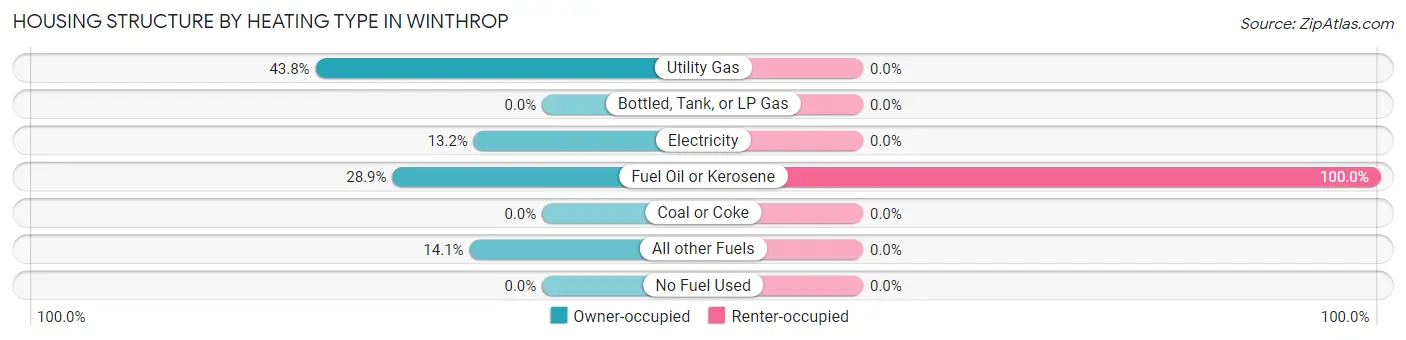
| Heating Type | Owner-occupied | Renter-occupied |
| Utility Gas | 53 (43.8%) | 0 (0.0%) |
| Bottled, Tank, or LP Gas | 0 (0.0%) | 0 (0.0%) |
| Electricity | 16 (13.2%) | 0 (0.0%) |
| Fuel Oil or Kerosene | 35 (28.9%) | 12 (100.0%) |
| Coal or Coke | 0 (0.0%) | 0 (0.0%) |
| All other Fuels | 17 (14.1%) | 0 (0.0%) |
| No Fuel Used | 0 (0.0%) | 0 (0.0%) |
| Total | 121 (100.0%) | 12 (100.0%) |
Household Vehicle Usage in Winthrop
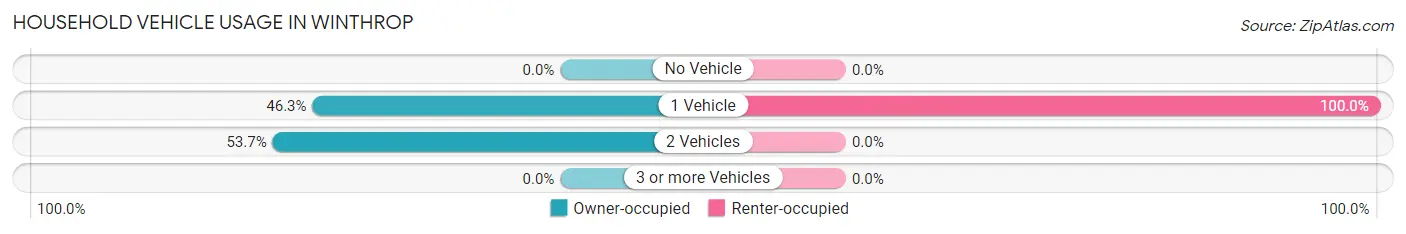
| Vehicles per Household | Owner-occupied | Renter-occupied |
| No Vehicle | 0 (0.0%) | 0 (0.0%) |
| 1 Vehicle | 56 (46.3%) | 12 (100.0%) |
| 2 Vehicles | 65 (53.7%) | 0 (0.0%) |
| 3 or more Vehicles | 0 (0.0%) | 0 (0.0%) |
| Total | 121 (100.0%) | 12 (100.0%) |
Real Estate & Mortgages in Winthrop
Real Estate and Mortgage Overview in Winthrop
| Characteristic | Without Mortgage | With Mortgage |
| Housing Units | 72 | 49 |
| Median Property Value | $108,000 | $225,000 |
| Median Household Income | - | - |
| Monthly Housing Costs | $548 | $0 |
| Real Estate Taxes | - | - |
Property Value by Mortgage Status in Winthrop
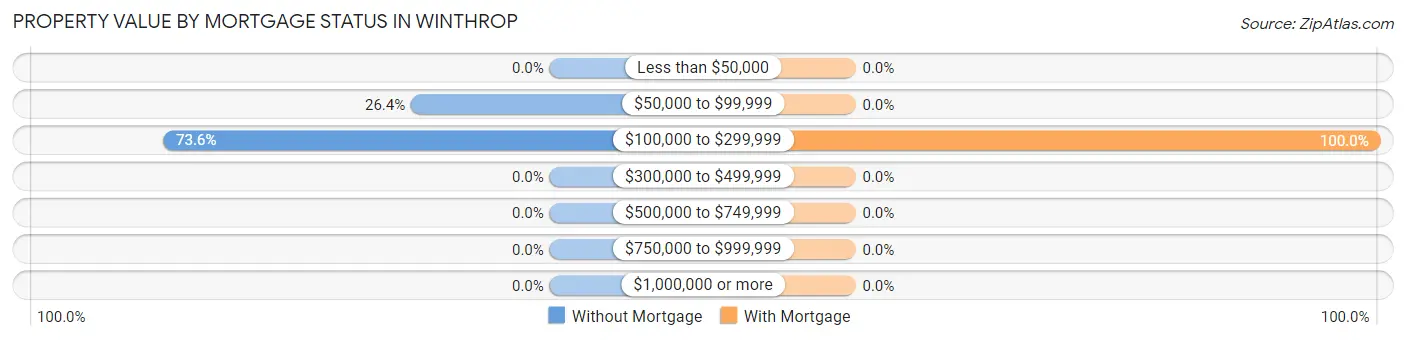
| Property Value | Without Mortgage | With Mortgage |
| Less than $50,000 | 0 (0.0%) | 0 (0.0%) |
| $50,000 to $99,999 | 19 (26.4%) | 0 (0.0%) |
| $100,000 to $299,999 | 53 (73.6%) | 49 (100.0%) |
| $300,000 to $499,999 | 0 (0.0%) | 0 (0.0%) |
| $500,000 to $749,999 | 0 (0.0%) | 0 (0.0%) |
| $750,000 to $999,999 | 0 (0.0%) | 0 (0.0%) |
| $1,000,000 or more | 0 (0.0%) | 0 (0.0%) |
| Total | 72 (100.0%) | 49 (100.0%) |
Household Income by Mortgage Status in Winthrop
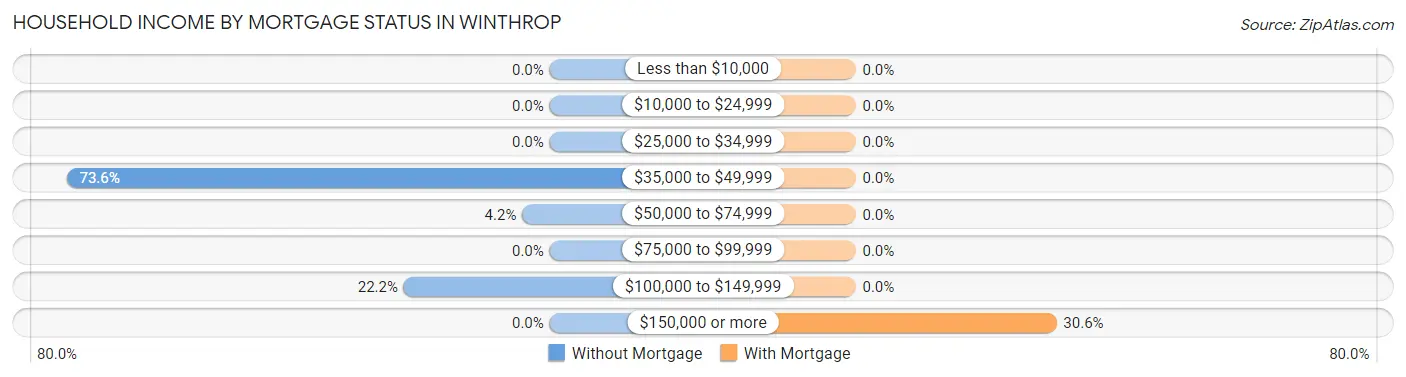
| Household Income | Without Mortgage | With Mortgage |
| Less than $10,000 | 0 (0.0%) | 0 (0.0%) |
| $10,000 to $24,999 | 0 (0.0%) | 0 (0.0%) |
| $25,000 to $34,999 | 0 (0.0%) | 0 (0.0%) |
| $35,000 to $49,999 | 53 (73.6%) | 0 (0.0%) |
| $50,000 to $74,999 | 3 (4.2%) | 0 (0.0%) |
| $75,000 to $99,999 | 0 (0.0%) | 0 (0.0%) |
| $100,000 to $149,999 | 16 (22.2%) | 0 (0.0%) |
| $150,000 or more | 0 (0.0%) | 15 (30.6%) |
| Total | 72 (100.0%) | 49 (100.0%) |
Property Value to Household Income Ratio in Winthrop
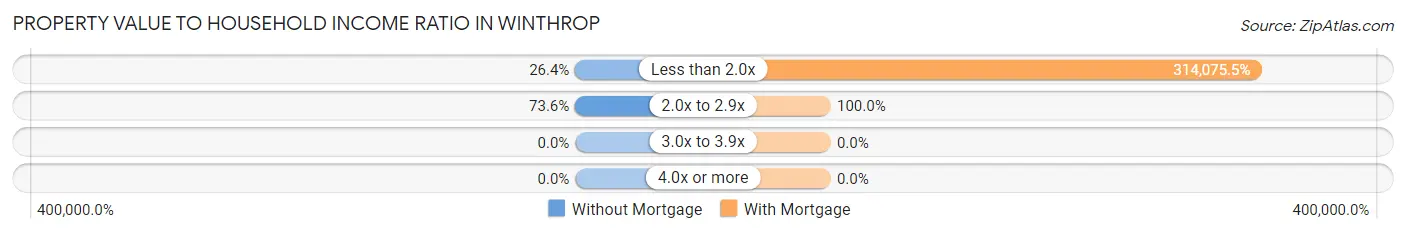
| Value-to-Income Ratio | Without Mortgage | With Mortgage |
| Less than 2.0x | 19 (26.4%) | 153,897 (314,075.5%) |
| 2.0x to 2.9x | 53 (73.6%) | 49 (100.0%) |
| 3.0x to 3.9x | 0 (0.0%) | 0 (0.0%) |
| 4.0x or more | 0 (0.0%) | 0 (0.0%) |
| Total | 72 (100.0%) | 49 (100.0%) |
Real Estate Taxes by Mortgage Status in Winthrop
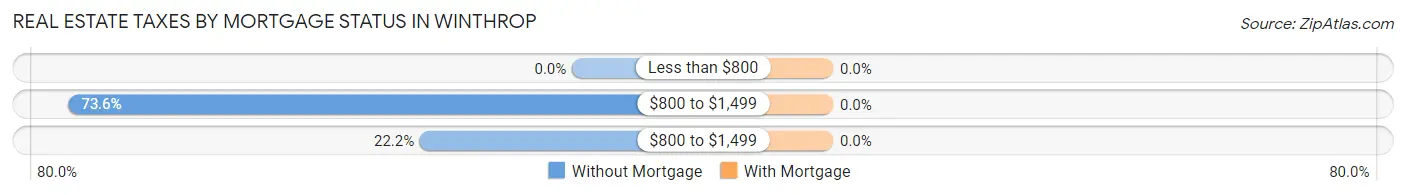
| Property Taxes | Without Mortgage | With Mortgage |
| Less than $800 | 0 (0.0%) | 0 (0.0%) |
| $800 to $1,499 | 53 (73.6%) | 0 (0.0%) |
| $800 to $1,499 | 16 (22.2%) | 0 (0.0%) |
| Total | 72 (100.0%) | 49 (100.0%) |
Health & Disability in Winthrop
Health Insurance Coverage by Age in Winthrop
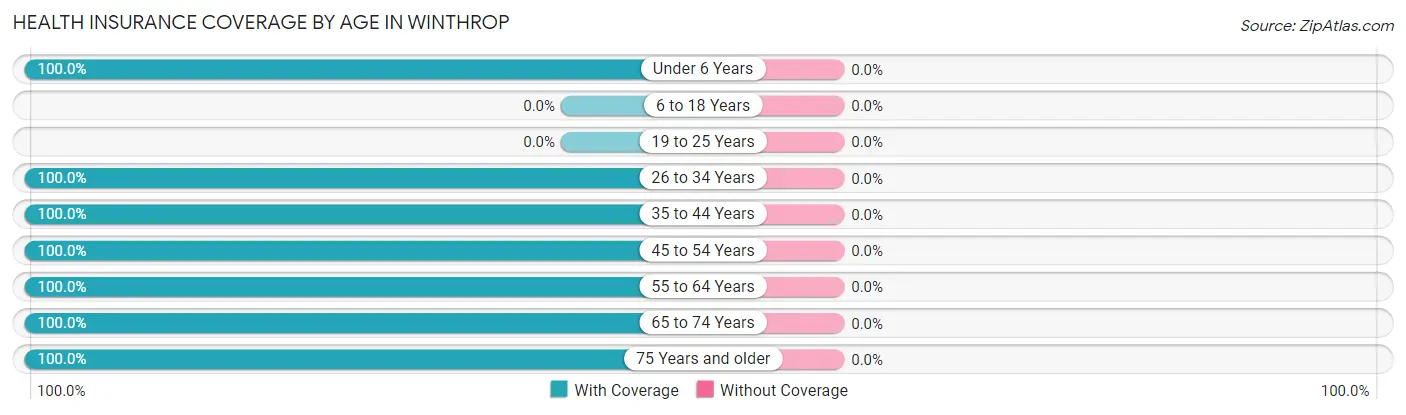
| Age Bracket | With Coverage | Without Coverage |
| Under 6 Years | 21 (100.0%) | 0 (0.0%) |
| 6 to 18 Years | 0 (0.0%) | 0 (0.0%) |
| 19 to 25 Years | 0 (0.0%) | 0 (0.0%) |
| 26 to 34 Years | 29 (100.0%) | 0 (0.0%) |
| 35 to 44 Years | 54 (100.0%) | 0 (0.0%) |
| 45 to 54 Years | 22 (100.0%) | 0 (0.0%) |
| 55 to 64 Years | 33 (100.0%) | 0 (0.0%) |
| 65 to 74 Years | 23 (100.0%) | 0 (0.0%) |
| 75 Years and older | 53 (100.0%) | 0 (0.0%) |
| Total | 235 (100.0%) | 0 (0.0%) |
Health Insurance Coverage by Citizenship Status in Winthrop
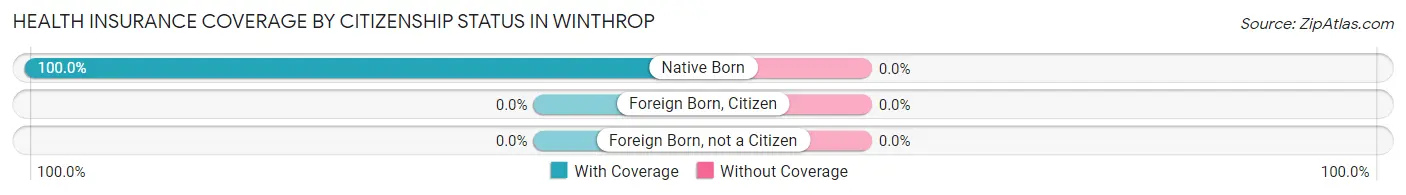
| Citizenship Status | With Coverage | Without Coverage |
| Native Born | 21 (100.0%) | 0 (0.0%) |
| Foreign Born, Citizen | 0 (0.0%) | 0 (0.0%) |
| Foreign Born, not a Citizen | 0 (0.0%) | 0 (0.0%) |
Health Insurance Coverage by Household Income in Winthrop
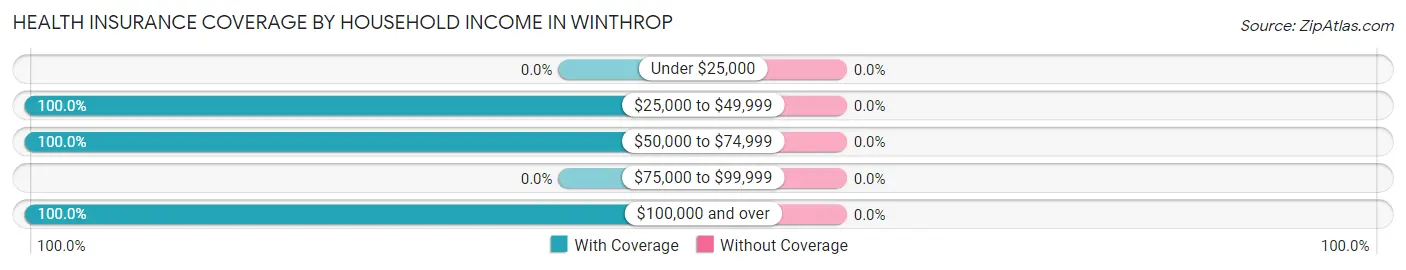
| Household Income | With Coverage | Without Coverage |
| Under $25,000 | 0 (0.0%) | 0 (0.0%) |
| $25,000 to $49,999 | 81 (100.0%) | 0 (0.0%) |
| $50,000 to $74,999 | 7 (100.0%) | 0 (0.0%) |
| $75,000 to $99,999 | 0 (0.0%) | 0 (0.0%) |
| $100,000 and over | 147 (100.0%) | 0 (0.0%) |
Public vs Private Health Insurance Coverage by Age in Winthrop
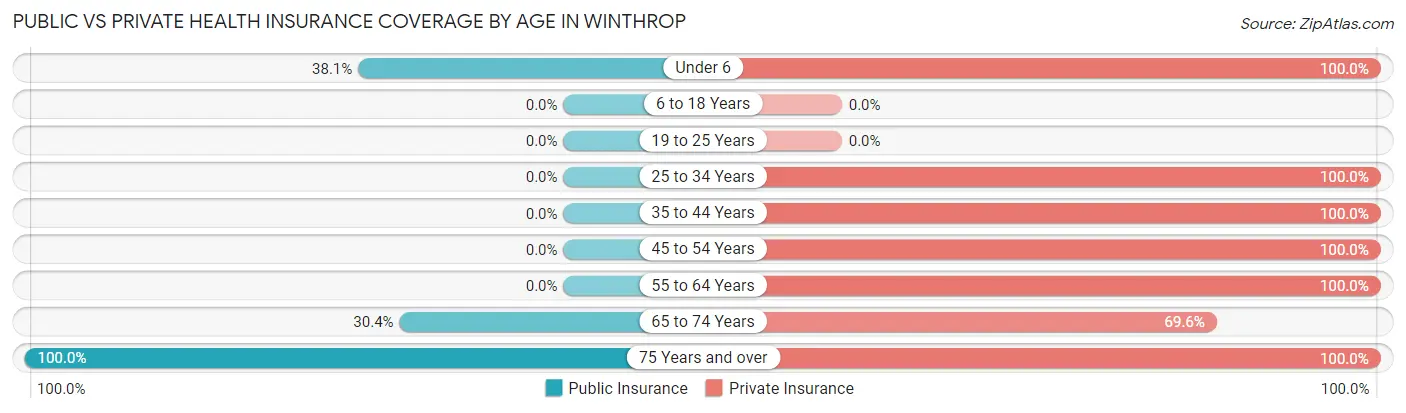
| Age Bracket | Public Insurance | Private Insurance |
| Under 6 | 8 (38.1%) | 21 (100.0%) |
| 6 to 18 Years | 0 (0.0%) | 0 (0.0%) |
| 19 to 25 Years | 0 (0.0%) | 0 (0.0%) |
| 25 to 34 Years | 0 (0.0%) | 29 (100.0%) |
| 35 to 44 Years | 0 (0.0%) | 54 (100.0%) |
| 45 to 54 Years | 0 (0.0%) | 22 (100.0%) |
| 55 to 64 Years | 0 (0.0%) | 33 (100.0%) |
| 65 to 74 Years | 7 (30.4%) | 16 (69.6%) |
| 75 Years and over | 53 (100.0%) | 53 (100.0%) |
| Total | 68 (28.9%) | 228 (97.0%) |
Disability Status by Sex by Age in Winthrop
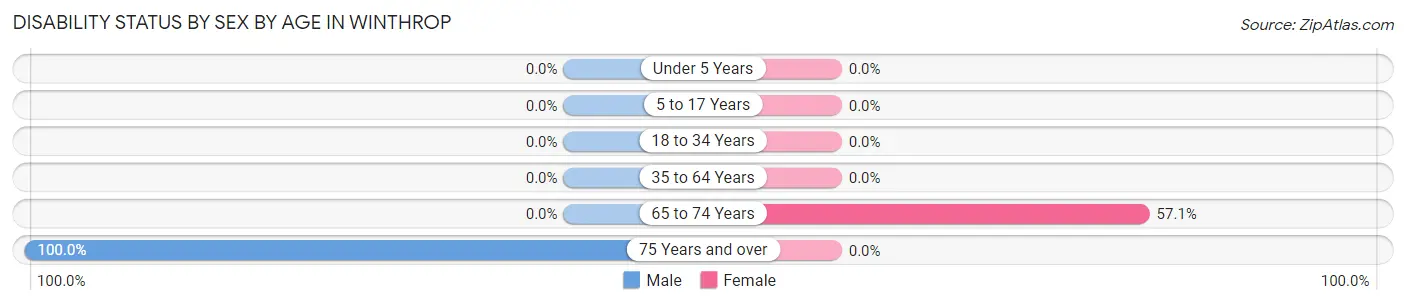
| Age Bracket | Male | Female |
| Under 5 Years | 0 (0.0%) | 0 (0.0%) |
| 5 to 17 Years | 0 (0.0%) | 0 (0.0%) |
| 18 to 34 Years | 0 (0.0%) | 0 (0.0%) |
| 35 to 64 Years | 0 (0.0%) | 0 (0.0%) |
| 65 to 74 Years | 0 (0.0%) | 4 (57.1%) |
| 75 Years and over | 53 (100.0%) | 0 (0.0%) |
Disability Class by Sex by Age in Winthrop
Disability Class: Hearing Difficulty
| Age Bracket | Male | Female |
| Under 5 Years | 0 (0.0%) | 0 (0.0%) |
| 5 to 17 Years | 0 (0.0%) | 0 (0.0%) |
| 18 to 34 Years | 0 (0.0%) | 0 (0.0%) |
| 35 to 64 Years | 0 (0.0%) | 0 (0.0%) |
| 65 to 74 Years | 0 (0.0%) | 0 (0.0%) |
| 75 Years and over | 0 (0.0%) | 0 (0.0%) |
Disability Class: Vision Difficulty
| Age Bracket | Male | Female |
| Under 5 Years | 0 (0.0%) | 0 (0.0%) |
| 5 to 17 Years | 0 (0.0%) | 0 (0.0%) |
| 18 to 34 Years | 0 (0.0%) | 0 (0.0%) |
| 35 to 64 Years | 0 (0.0%) | 0 (0.0%) |
| 65 to 74 Years | 0 (0.0%) | 0 (0.0%) |
| 75 Years and over | 0 (0.0%) | 0 (0.0%) |
Disability Class: Cognitive Difficulty
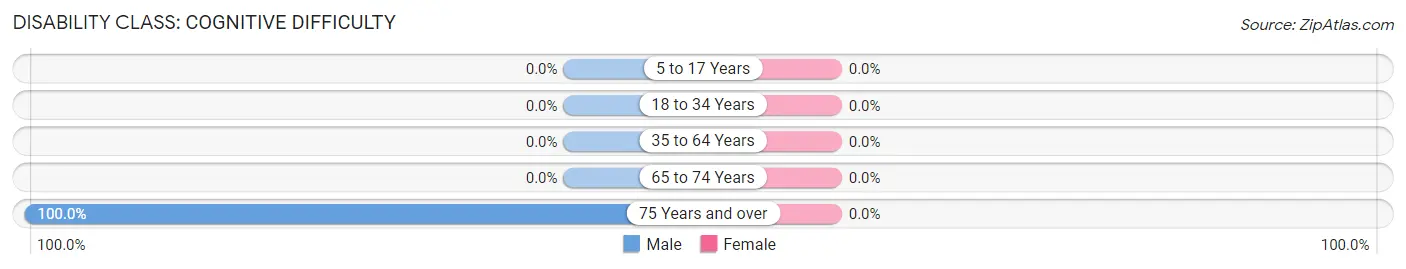
| Age Bracket | Male | Female |
| 5 to 17 Years | 0 (0.0%) | 0 (0.0%) |
| 18 to 34 Years | 0 (0.0%) | 0 (0.0%) |
| 35 to 64 Years | 0 (0.0%) | 0 (0.0%) |
| 65 to 74 Years | 0 (0.0%) | 0 (0.0%) |
| 75 Years and over | 53 (100.0%) | 0 (0.0%) |
Disability Class: Ambulatory Difficulty
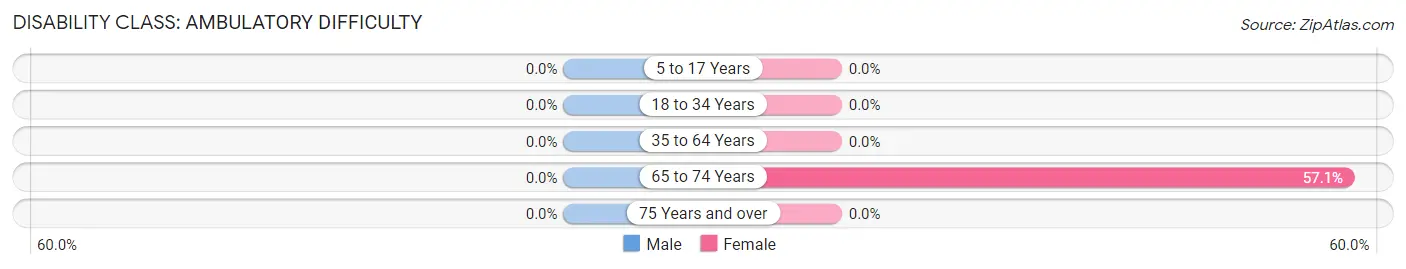
| Age Bracket | Male | Female |
| 5 to 17 Years | 0 (0.0%) | 0 (0.0%) |
| 18 to 34 Years | 0 (0.0%) | 0 (0.0%) |
| 35 to 64 Years | 0 (0.0%) | 0 (0.0%) |
| 65 to 74 Years | 0 (0.0%) | 4 (57.1%) |
| 75 Years and over | 0 (0.0%) | 0 (0.0%) |
Disability Class: Self-Care Difficulty
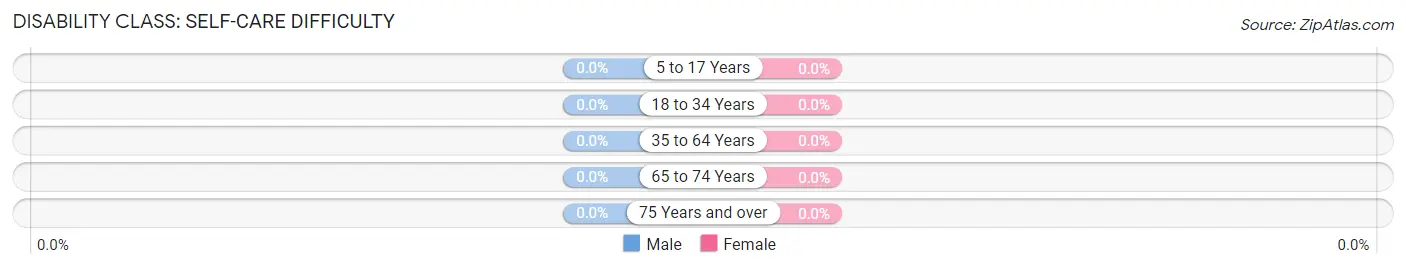
| Age Bracket | Male | Female |
| 5 to 17 Years | 0 (0.0%) | 0 (0.0%) |
| 18 to 34 Years | 0 (0.0%) | 0 (0.0%) |
| 35 to 64 Years | 0 (0.0%) | 0 (0.0%) |
| 65 to 74 Years | 0 (0.0%) | 0 (0.0%) |
| 75 Years and over | 0 (0.0%) | 0 (0.0%) |
Technology Access in Winthrop
Computing Device Access in Winthrop
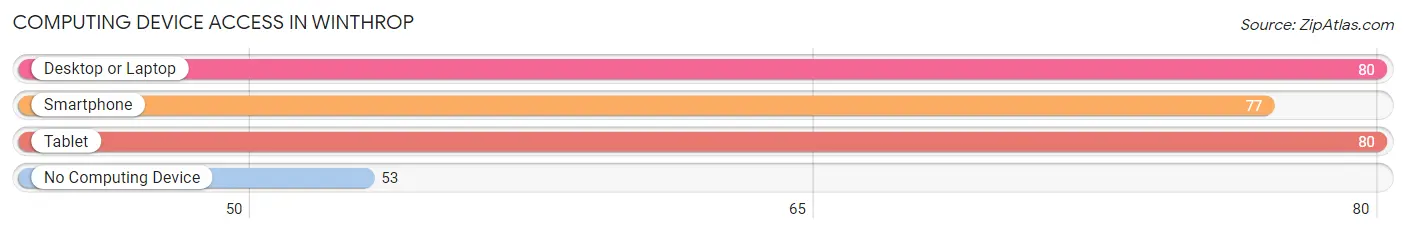
| Device Type | # Households | % Households |
| Desktop or Laptop | 80 | 60.2% |
| Smartphone | 77 | 57.9% |
| Tablet | 80 | 60.2% |
| No Computing Device | 53 | 39.9% |
| Total | 133 | 100.0% |
Internet Access in Winthrop
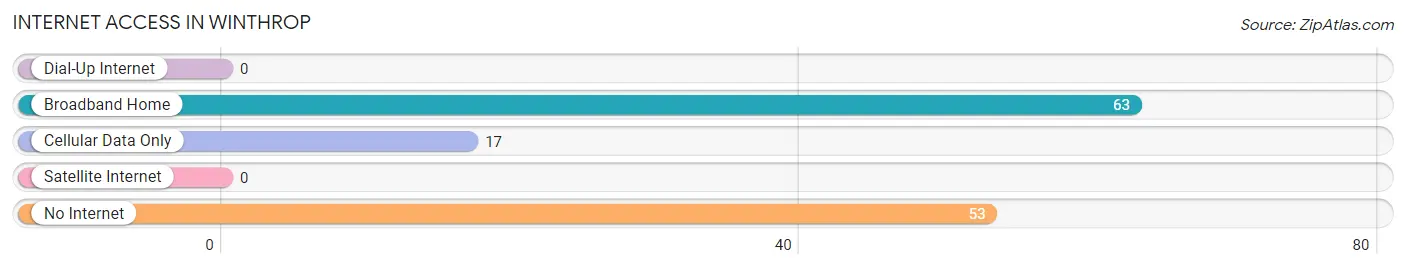
| Internet Type | # Households | % Households |
| Dial-Up Internet | 0 | 0.0% |
| Broadband Home | 63 | 47.4% |
| Cellular Data Only | 17 | 12.8% |
| Satellite Internet | 0 | 0.0% |
| No Internet | 53 | 39.9% |
| Total | 133 | 100.0% |
Winthrop Summary
Winthrop is a small town located in the St. Lawrence County of New York. It is situated on the banks of the Oswegatchie River, and is part of the Town of Fine. The town has a population of approximately 1,000 people, and is known for its rural charm and small-town atmosphere.
History
Winthrop was first settled in 1802 by a group of settlers from Massachusetts. The town was named after John Winthrop, the first governor of the Massachusetts Bay Colony. The town was originally part of the Town of Fine, but was incorporated as its own town in 1817.
In the early 19th century, Winthrop was a thriving agricultural community. The town was home to several mills, including a sawmill, gristmill, and a woolen mill. The town also had a blacksmith shop, a tannery, and a general store.
In the late 19th century, the town began to decline as the population shifted to larger cities. The mills and other businesses closed, and the town became a quiet, rural community.
Geography
Winthrop is located in the St. Lawrence County of New York. It is situated on the banks of the Oswegatchie River, and is part of the Town of Fine. The town is bordered by the towns of Edwards, Hermon, and Russell.
The town has a total area of 4.2 square miles, all of which is land. The terrain is mostly flat, with some rolling hills. The town is located in the Adirondack Mountains, and is surrounded by forests and lakes.
Economy
Winthrop is a small, rural town with a limited economy. The town is home to several small businesses, including a general store, a gas station, and a few restaurants. The town also has a few small farms, which produce a variety of crops.
The town is also home to a few small manufacturing companies, which produce a variety of products, including furniture, clothing, and electronics.
Demographics
As of the 2010 census, Winthrop had a population of 1,000 people. The racial makeup of the town was 97.2% White, 0.7% African American, 0.2% Native American, 0.2% Asian, 0.1% Pacific Islander, 0.2% from other races, and 1.0% from two or more races. Hispanic or Latino of any race were 1.2% of the population.
The median household income in Winthrop was $37,500, and the median family income was $45,000. The per capita income for the town was $18,000. About 10.2% of families and 13.2% of the population were below the poverty line, including 16.7% of those under age 18 and 8.3% of those age 65 or over.
Common Questions
What is Per Capita Income in Winthrop?
Per Capita income in Winthrop is $52,333.
What is the Median Family Income in Winthrop?
Median Family Income in Winthrop is $144,250.
What is Inequality or Gini Index in Winthrop?
Inequality or Gini Index in Winthrop is 0.33.
What is the Total Population of Winthrop?
Total Population of Winthrop is 235.
What is the Total Male Population of Winthrop?
Total Male Population of Winthrop is 134.
What is the Total Female Population of Winthrop?
Total Female Population of Winthrop is 101.
What is the Ratio of Males per 100 Females in Winthrop?
There are 132.67 Males per 100 Females in Winthrop.
What is the Ratio of Females per 100 Males in Winthrop?
There are 75.37 Females per 100 Males in Winthrop.
What is the Median Population Age in Winthrop?
Median Population Age in Winthrop is 49.6 Years.
What is the Average Family Size in Winthrop
Average Family Size in Winthrop is 2.3 People.
What is the Average Household Size in Winthrop
Average Household Size in Winthrop is 1.8 People.
How Large is the Labor Force in Winthrop?
There are 125 People in the Labor Forcein in Winthrop.
What is the Percentage of People in the Labor Force in Winthrop?
58.4% of People are in the Labor Force in Winthrop.