Wellsburg, NY Map & Demographics
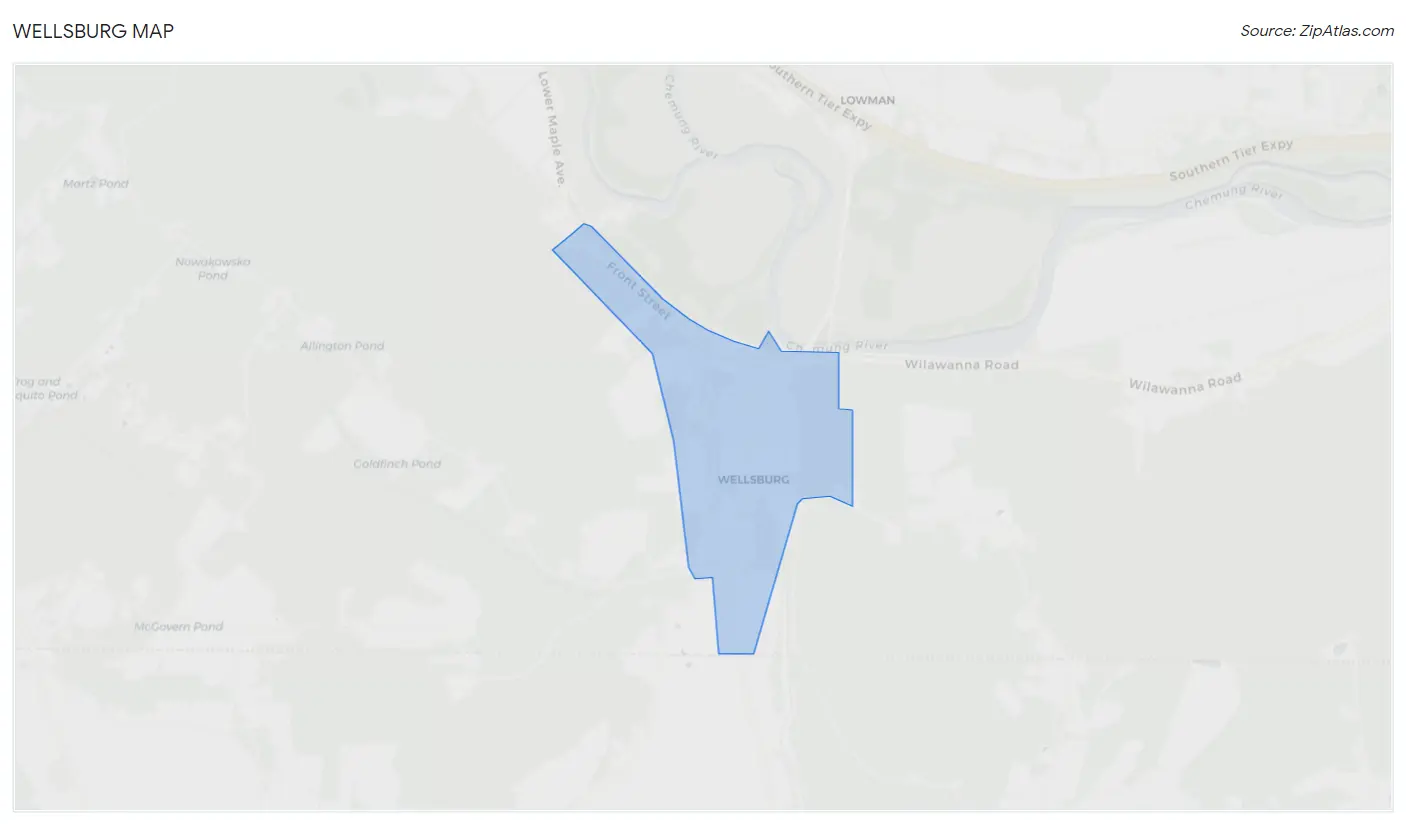
Wellsburg Map
Wellsburg Overview
$26,584
PER CAPITA INCOME
$58,750
AVG FAMILY INCOME
$65,536
AVG HOUSEHOLD INCOME
43.1%
WAGE / INCOME GAP [ % ]
56.9¢/ $1
WAGE / INCOME GAP [ $ ]
0.36
INEQUALITY / GINI INDEX
440
TOTAL POPULATION
209
MALE POPULATION
231
FEMALE POPULATION
90.48
MALES / 100 FEMALES
110.53
FEMALES / 100 MALES
30.0
MEDIAN AGE
2.9
AVG FAMILY SIZE
2.6
AVG HOUSEHOLD SIZE
233
LABOR FORCE [ PEOPLE ]
67.7%
PERCENT IN LABOR FORCE
7.3%
UNEMPLOYMENT RATE
Wellsburg Zip Codes
Wellsburg Area Codes
Income in Wellsburg
Income Overview in Wellsburg
Per Capita Income in Wellsburg is $26,584, while median incomes of families and households are $58,750 and $65,536 respectively.
| Characteristic | Number | Measure |
| Per Capita Income | 440 | $26,584 |
| Median Family Income | 109 | $58,750 |
| Mean Family Income | 109 | $62,914 |
| Median Household Income | 163 | $65,536 |
| Mean Household Income | 163 | $69,726 |
| Income Deficit | 109 | $0 |
| Wage / Income Gap (%) | 440 | 43.14% |
| Wage / Income Gap ($) | 440 | 56.86¢ per $1 |
| Gini / Inequality Index | 440 | 0.36 |
Earnings by Sex in Wellsburg
Average Earnings in Wellsburg are $34,886, $57,841 for men and $32,891 for women, a difference of 43.1%.
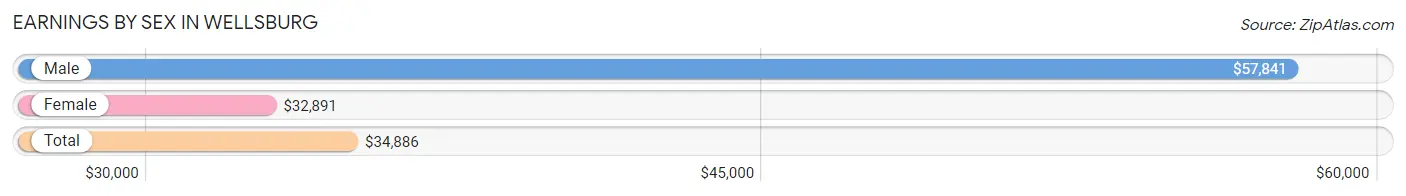
| Sex | Number | Average Earnings |
| Male | 111 (50.0%) | $57,841 |
| Female | 111 (50.0%) | $32,891 |
| Total | 222 (100.0%) | $34,886 |
Earnings by Sex by Income Bracket in Wellsburg
The most common earnings brackets in Wellsburg are $75,000 to $99,999 for men (29 | 26.1%) and $30,000 to $34,999 for women (23 | 20.7%).
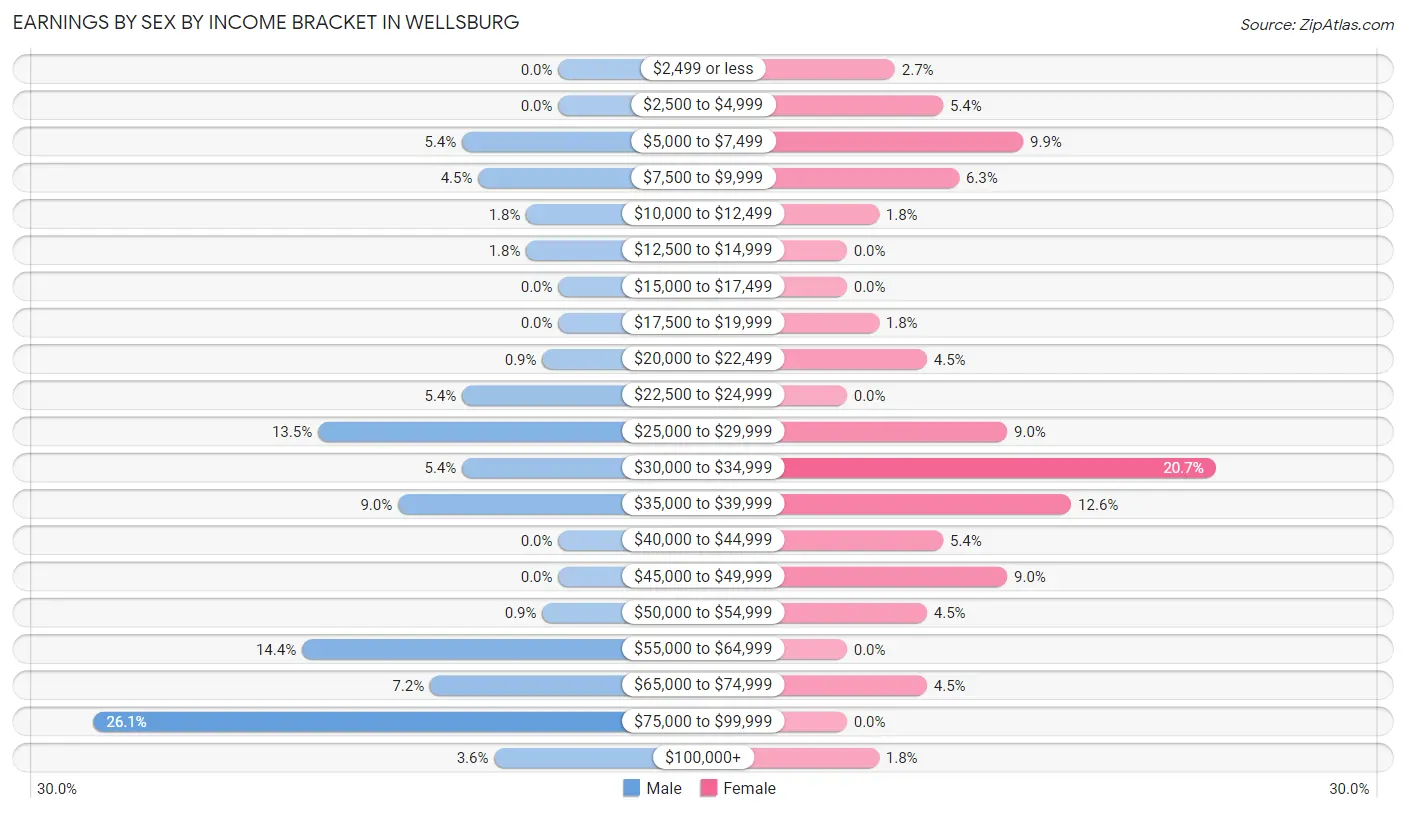
| Income | Male | Female |
| $2,499 or less | 0 (0.0%) | 3 (2.7%) |
| $2,500 to $4,999 | 0 (0.0%) | 6 (5.4%) |
| $5,000 to $7,499 | 6 (5.4%) | 11 (9.9%) |
| $7,500 to $9,999 | 5 (4.5%) | 7 (6.3%) |
| $10,000 to $12,499 | 2 (1.8%) | 2 (1.8%) |
| $12,500 to $14,999 | 2 (1.8%) | 0 (0.0%) |
| $15,000 to $17,499 | 0 (0.0%) | 0 (0.0%) |
| $17,500 to $19,999 | 0 (0.0%) | 2 (1.8%) |
| $20,000 to $22,499 | 1 (0.9%) | 5 (4.5%) |
| $22,500 to $24,999 | 6 (5.4%) | 0 (0.0%) |
| $25,000 to $29,999 | 15 (13.5%) | 10 (9.0%) |
| $30,000 to $34,999 | 6 (5.4%) | 23 (20.7%) |
| $35,000 to $39,999 | 10 (9.0%) | 14 (12.6%) |
| $40,000 to $44,999 | 0 (0.0%) | 6 (5.4%) |
| $45,000 to $49,999 | 0 (0.0%) | 10 (9.0%) |
| $50,000 to $54,999 | 1 (0.9%) | 5 (4.5%) |
| $55,000 to $64,999 | 16 (14.4%) | 0 (0.0%) |
| $65,000 to $74,999 | 8 (7.2%) | 5 (4.5%) |
| $75,000 to $99,999 | 29 (26.1%) | 0 (0.0%) |
| $100,000+ | 4 (3.6%) | 2 (1.8%) |
| Total | 111 (100.0%) | 111 (100.0%) |
Earnings by Sex by Educational Attainment in Wellsburg
Average earnings in Wellsburg are $58,864 for men and $34,531 for women, a difference of 41.3%. Men with an educational attainment of high school diploma enjoy the highest average annual earnings of $59,659, while those with high school diploma education earn the least with $59,659. Women with an educational attainment of college or associate's degree earn the most with the average annual earnings of $47,917, while those with high school diploma education have the smallest earnings of $32,250.
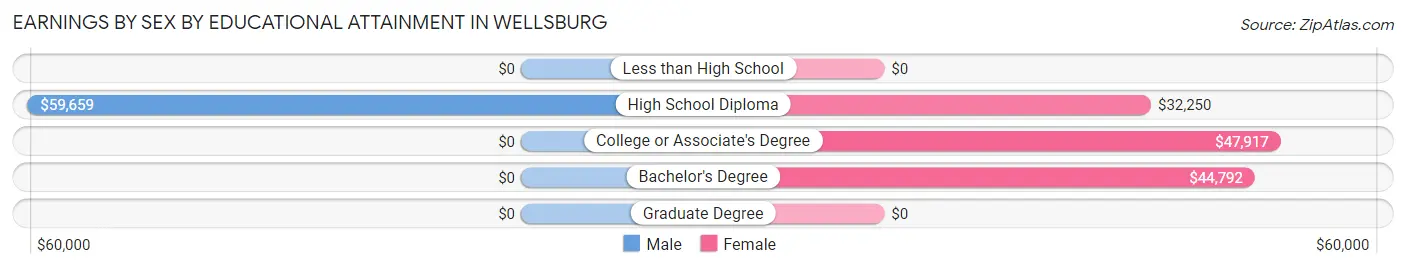
| Educational Attainment | Male Income | Female Income |
| Less than High School | - | - |
| High School Diploma | $59,659 | $32,250 |
| College or Associate's Degree | - | - |
| Bachelor's Degree | - | - |
| Graduate Degree | - | - |
| Total | $58,864 | $34,531 |
Family Income in Wellsburg
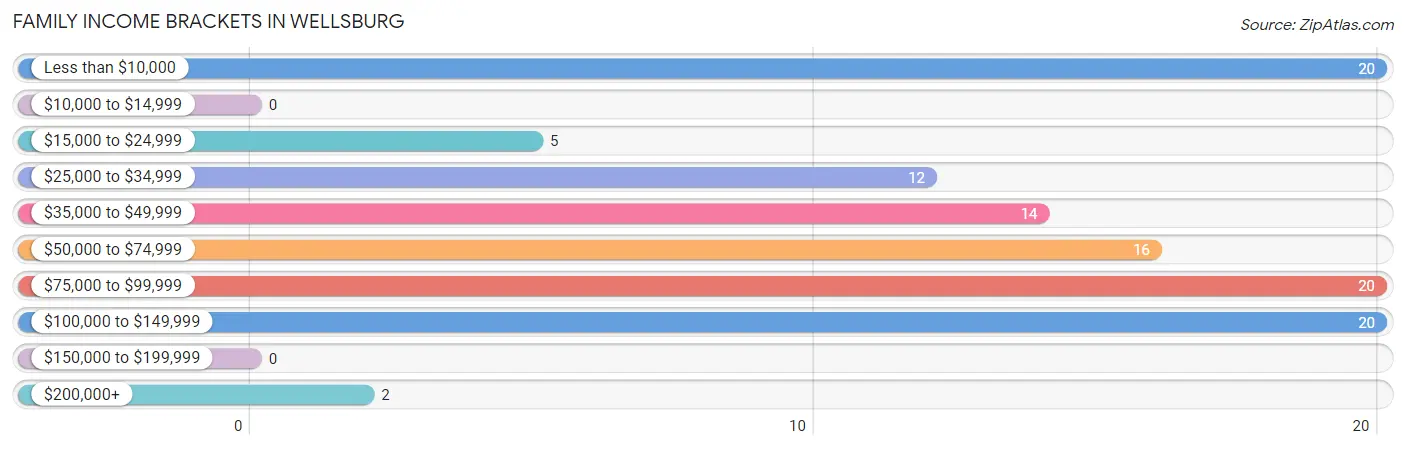
Family Income Brackets in Wellsburg
According to the Wellsburg family income data, there are 20 families falling into the less than $10,000 income range, which is the most common income bracket and makes up 18.3% of all families.
| Income Bracket | # Families | % Families |
| Less than $10,000 | 20 | 18.3% |
| $10,000 to $14,999 | 0 | 0.0% |
| $15,000 to $24,999 | 5 | 4.6% |
| $25,000 to $34,999 | 12 | 11.0% |
| $35,000 to $49,999 | 14 | 12.8% |
| $50,000 to $74,999 | 16 | 14.7% |
| $75,000 to $99,999 | 20 | 18.3% |
| $100,000 to $149,999 | 20 | 18.3% |
| $150,000 to $199,999 | 0 | 0.0% |
| $200,000+ | 2 | 1.8% |
Family Income by Famaliy Size in Wellsburg
2-person families (61 | 56.0%) account for the highest median family income in Wellsburg with $44,464 per family, while 2-person families (61 | 56.0%) have the highest median income of $22,232 per family member.
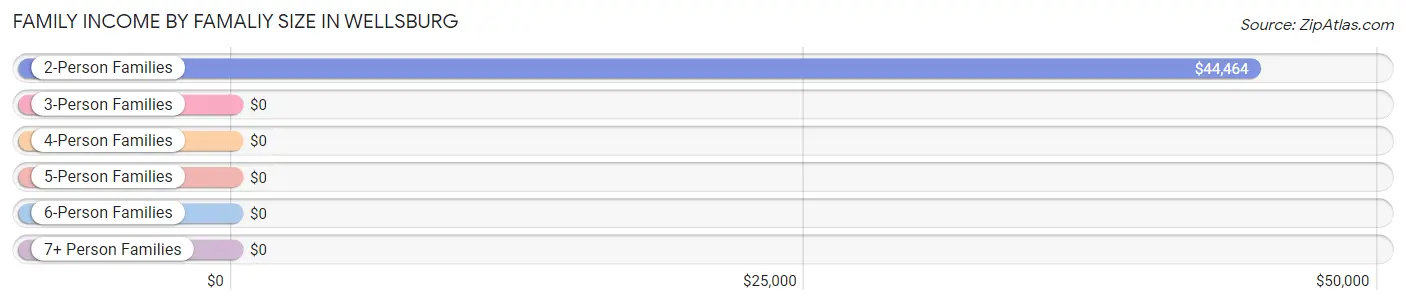
| Income Bracket | # Families | Median Income |
| 2-Person Families | 61 (56.0%) | $44,464 |
| 3-Person Families | 8 (7.3%) | $0 |
| 4-Person Families | 30 (27.5%) | $0 |
| 5-Person Families | 6 (5.5%) | $0 |
| 6-Person Families | 4 (3.7%) | $0 |
| 7+ Person Families | 0 (0.0%) | $0 |
| Total | 109 (100.0%) | $58,750 |
Family Income by Number of Earners in Wellsburg
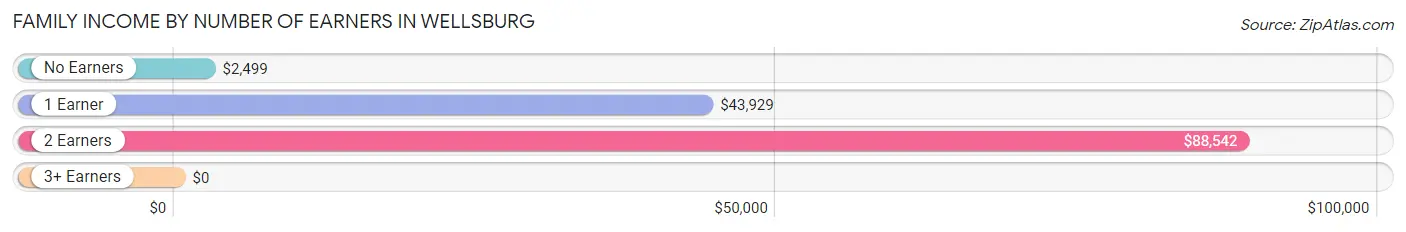
| Number of Earners | # Families | Median Income |
| No Earners | 26 (23.8%) | $2,499 |
| 1 Earner | 44 (40.4%) | $43,929 |
| 2 Earners | 27 (24.8%) | $88,542 |
| 3+ Earners | 12 (11.0%) | $0 |
| Total | 109 (100.0%) | $58,750 |
Household Income in Wellsburg
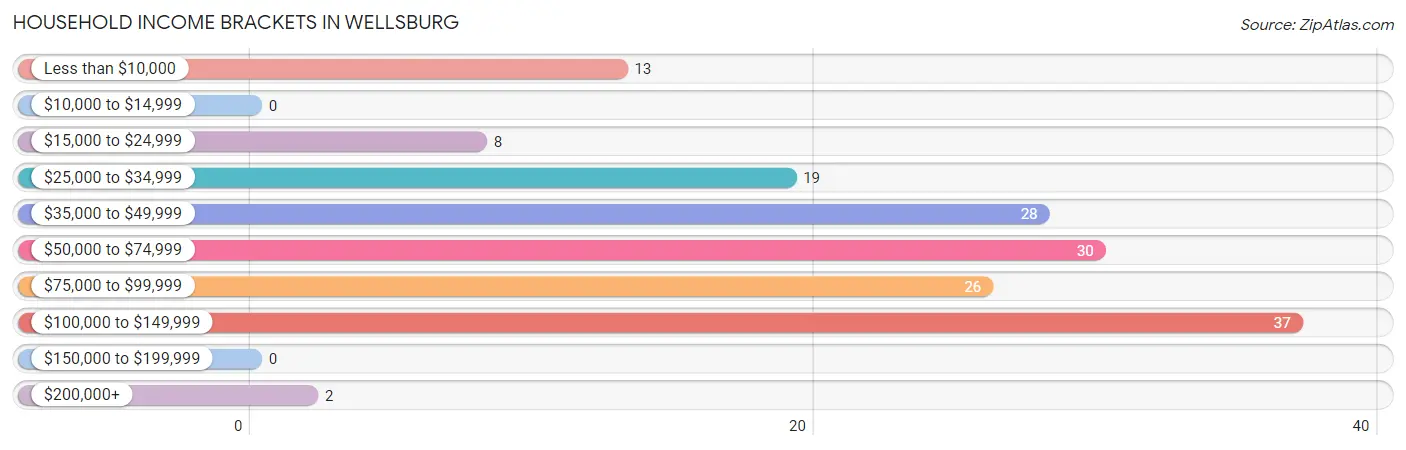
Household Income Brackets in Wellsburg
With 37 households falling in the category, the $100,000 to $149,999 income range is the most frequent in Wellsburg, accounting for 22.7% of all households.
| Income Bracket | # Households | % Households |
| Less than $10,000 | 13 | 8.0% |
| $10,000 to $14,999 | 0 | 0.0% |
| $15,000 to $24,999 | 8 | 4.9% |
| $25,000 to $34,999 | 19 | 11.7% |
| $35,000 to $49,999 | 28 | 17.2% |
| $50,000 to $74,999 | 30 | 18.4% |
| $75,000 to $99,999 | 26 | 16.0% |
| $100,000 to $149,999 | 37 | 22.7% |
| $150,000 to $199,999 | 0 | 0.0% |
| $200,000+ | 2 | 1.2% |
Household Income by Householder Age in Wellsburg
The median household income in Wellsburg is $65,536, with the highest median household income of $85,139 found in the 25 to 44 years age bracket for the primary householder. A total of 69 households (42.3%) fall into this category. Meanwhile, the 15 to 24 years age bracket for the primary householder has the lowest median household income of $0, with 16 households (9.8%) in this group.
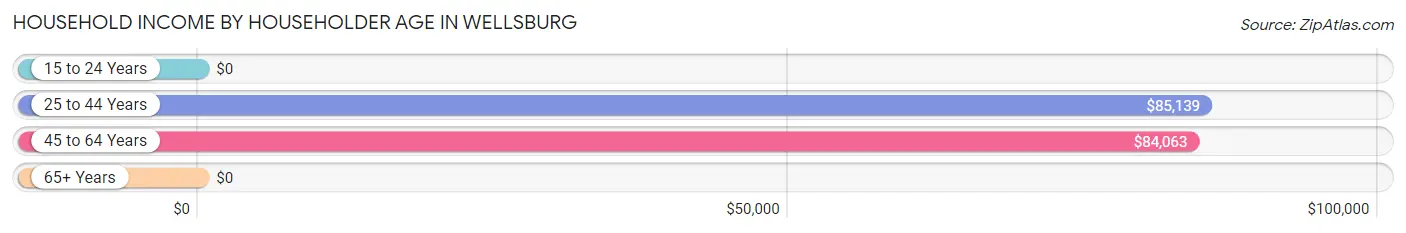
| Income Bracket | # Households | Median Income |
| 15 to 24 Years | 16 (9.8%) | $0 |
| 25 to 44 Years | 69 (42.3%) | $85,139 |
| 45 to 64 Years | 41 (25.2%) | $84,063 |
| 65+ Years | 37 (22.7%) | $0 |
| Total | 163 (100.0%) | $65,536 |
Poverty in Wellsburg
Income Below Poverty by Sex and Age in Wellsburg
With 17.2% poverty level for males and 22.1% for females among the residents of Wellsburg, 6 to 11 year old males and under 5 year old females are the most vulnerable to poverty, with 12 males (57.1%) and 24 females (82.8%) in their respective age groups living below the poverty level.
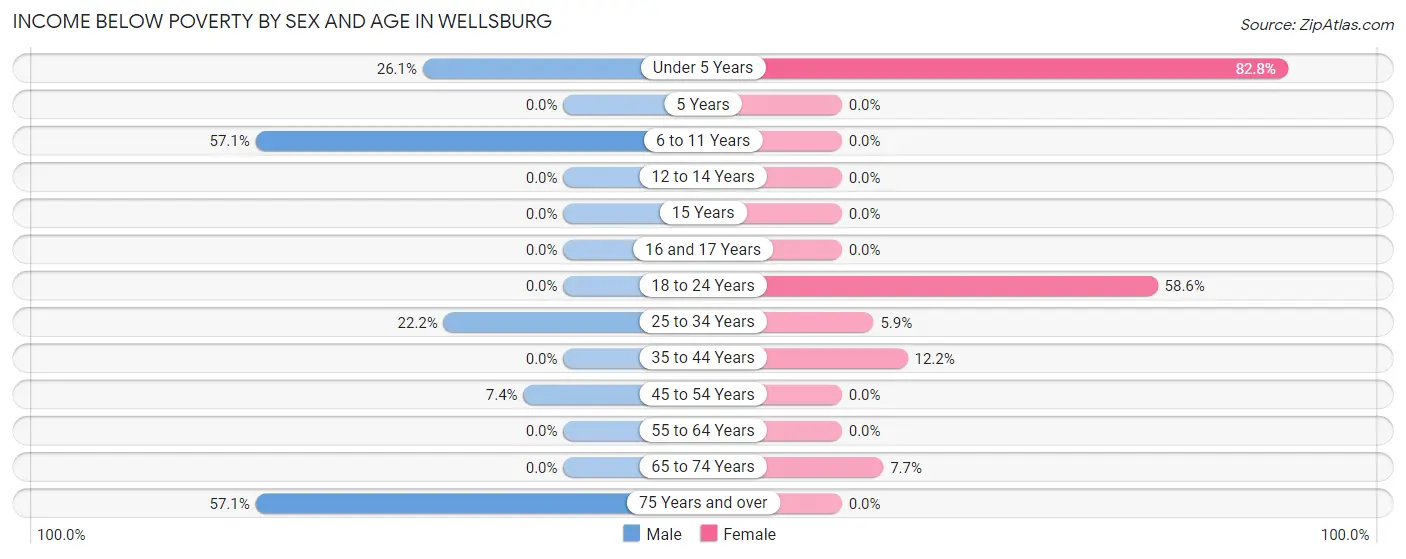
| Age Bracket | Male | Female |
| Under 5 Years | 6 (26.1%) | 24 (82.8%) |
| 5 Years | 0 (0.0%) | 0 (0.0%) |
| 6 to 11 Years | 12 (57.1%) | 0 (0.0%) |
| 12 to 14 Years | 0 (0.0%) | 0 (0.0%) |
| 15 Years | 0 (0.0%) | 0 (0.0%) |
| 16 and 17 Years | 0 (0.0%) | 0 (0.0%) |
| 18 to 24 Years | 0 (0.0%) | 17 (58.6%) |
| 25 to 34 Years | 12 (22.2%) | 3 (5.9%) |
| 35 to 44 Years | 0 (0.0%) | 5 (12.2%) |
| 45 to 54 Years | 2 (7.4%) | 0 (0.0%) |
| 55 to 64 Years | 0 (0.0%) | 0 (0.0%) |
| 65 to 74 Years | 0 (0.0%) | 2 (7.7%) |
| 75 Years and over | 4 (57.1%) | 0 (0.0%) |
| Total | 36 (17.2%) | 51 (22.1%) |
Income Above Poverty by Sex and Age in Wellsburg
According to the poverty statistics in Wellsburg, males aged 5 years and females aged 6 to 11 years are the age groups that are most secure financially, with 100.0% of males and 100.0% of females in these age groups living above the poverty line.
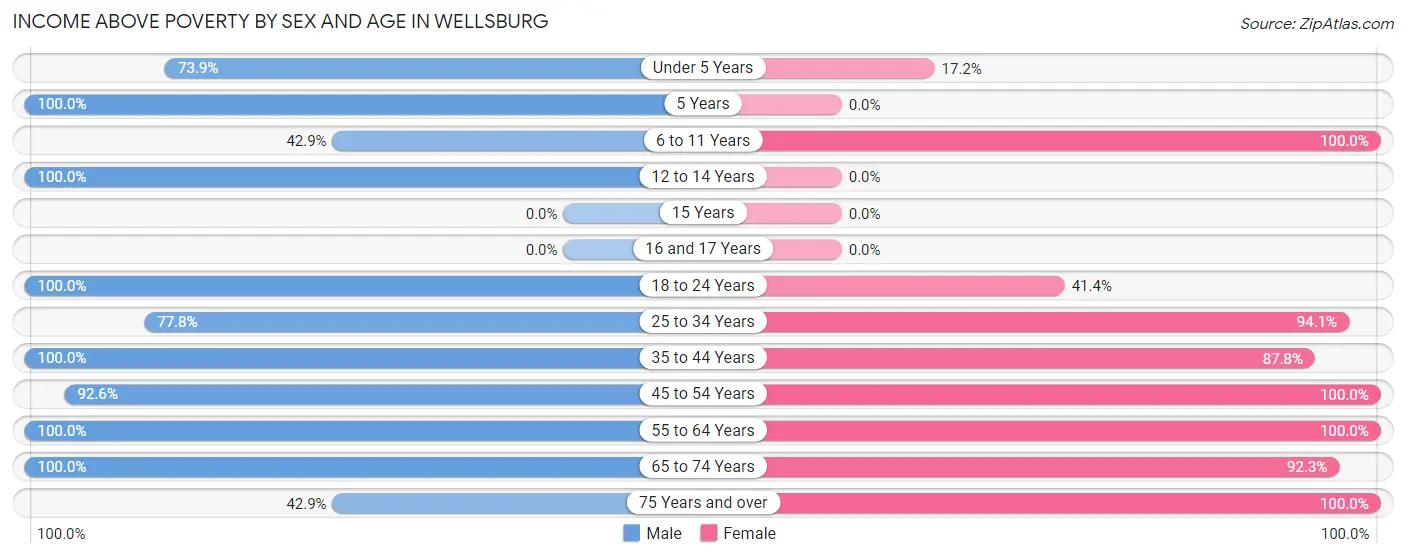
| Age Bracket | Male | Female |
| Under 5 Years | 17 (73.9%) | 5 (17.2%) |
| 5 Years | 6 (100.0%) | 0 (0.0%) |
| 6 to 11 Years | 9 (42.9%) | 4 (100.0%) |
| 12 to 14 Years | 13 (100.0%) | 0 (0.0%) |
| 15 Years | 0 (0.0%) | 0 (0.0%) |
| 16 and 17 Years | 0 (0.0%) | 0 (0.0%) |
| 18 to 24 Years | 9 (100.0%) | 12 (41.4%) |
| 25 to 34 Years | 42 (77.8%) | 48 (94.1%) |
| 35 to 44 Years | 21 (100.0%) | 36 (87.8%) |
| 45 to 54 Years | 25 (92.6%) | 17 (100.0%) |
| 55 to 64 Years | 17 (100.0%) | 18 (100.0%) |
| 65 to 74 Years | 11 (100.0%) | 24 (92.3%) |
| 75 Years and over | 3 (42.9%) | 16 (100.0%) |
| Total | 173 (82.8%) | 180 (77.9%) |
Income Below Poverty Among Married-Couple Families in Wellsburg
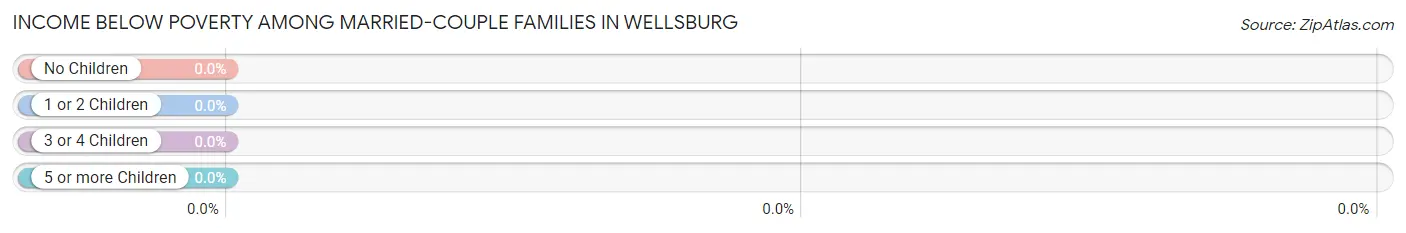
| Children | Above Poverty | Below Poverty |
| No Children | 39 (100.0%) | 0 (0.0%) |
| 1 or 2 Children | 14 (100.0%) | 0 (0.0%) |
| 3 or 4 Children | 6 (100.0%) | 0 (0.0%) |
| 5 or more Children | 0 (0.0%) | 0 (0.0%) |
| Total | 59 (100.0%) | 0 (0.0%) |
Income Below Poverty Among Single-Parent Households in Wellsburg
According to the poverty data in Wellsburg, 70.6% or 12 single-father households and 39.4% or 13 single-mother households are living below the poverty line. Among single-father households, those with 3 or 4 children have the highest poverty rate, with 9 households (100.0%) experiencing poverty. Likewise, among single-mother households, those with 1 or 2 children have the highest poverty rate, with 13 households (86.7%) falling below the poverty line.
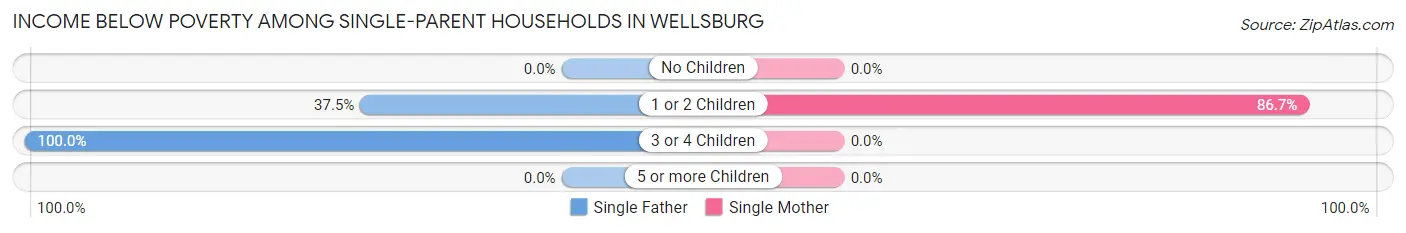
| Children | Single Father | Single Mother |
| No Children | 0 (0.0%) | 0 (0.0%) |
| 1 or 2 Children | 3 (37.5%) | 13 (86.7%) |
| 3 or 4 Children | 9 (100.0%) | 0 (0.0%) |
| 5 or more Children | 0 (0.0%) | 0 (0.0%) |
| Total | 12 (70.6%) | 13 (39.4%) |
Income Below Poverty Among Married-Couple vs Single-Parent Households in Wellsburg
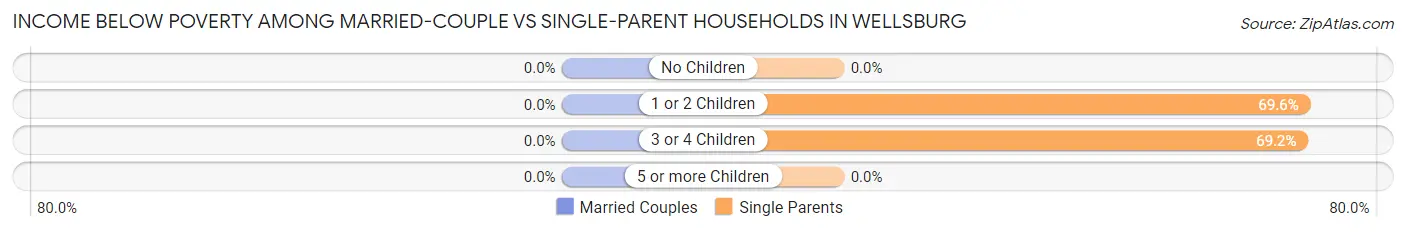
| Children | Married-Couple Families | Single-Parent Households |
| No Children | 0 (0.0%) | 0 (0.0%) |
| 1 or 2 Children | 0 (0.0%) | 16 (69.6%) |
| 3 or 4 Children | 0 (0.0%) | 9 (69.2%) |
| 5 or more Children | 0 (0.0%) | 0 (0.0%) |
| Total | 0 (0.0%) | 25 (50.0%) |
Race in Wellsburg
The most populous races in Wellsburg are White / Caucasian (432 | 98.2%), Two or more Races (8 | 1.8%), and Hispanic or Latino (5 | 1.1%).
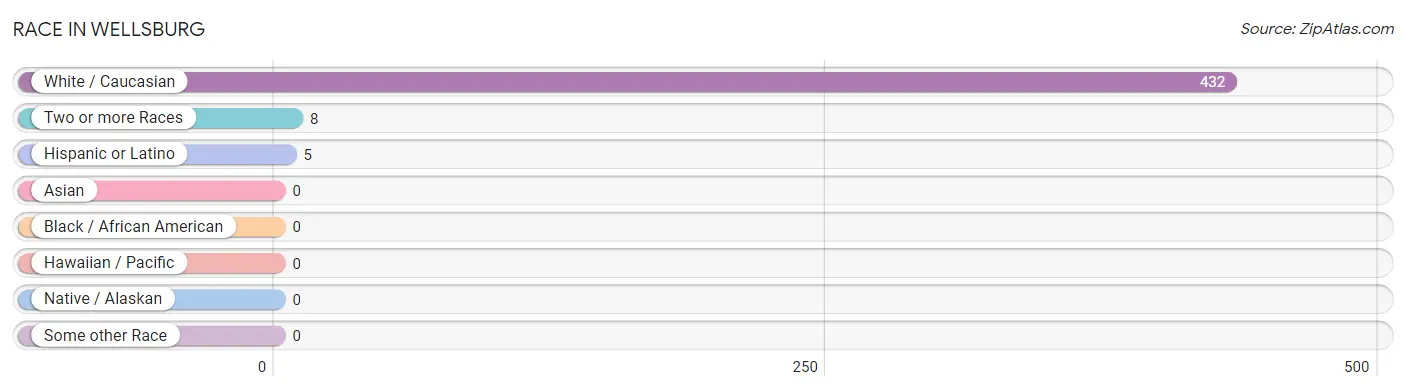
| Race | # Population | % Population |
| Asian | 0 | 0.0% |
| Black / African American | 0 | 0.0% |
| Hawaiian / Pacific | 0 | 0.0% |
| Hispanic or Latino | 5 | 1.1% |
| Native / Alaskan | 0 | 0.0% |
| White / Caucasian | 432 | 98.2% |
| Two or more Races | 8 | 1.8% |
| Some other Race | 0 | 0.0% |
| Total | 440 | 100.0% |
Ancestry in Wellsburg
The most populous ancestries reported in Wellsburg are Irish (63 | 14.3%), German (45 | 10.2%), Swedish (31 | 7.0%), English (26 | 5.9%), and American (23 | 5.2%), together accounting for 42.7% of all Wellsburg residents.
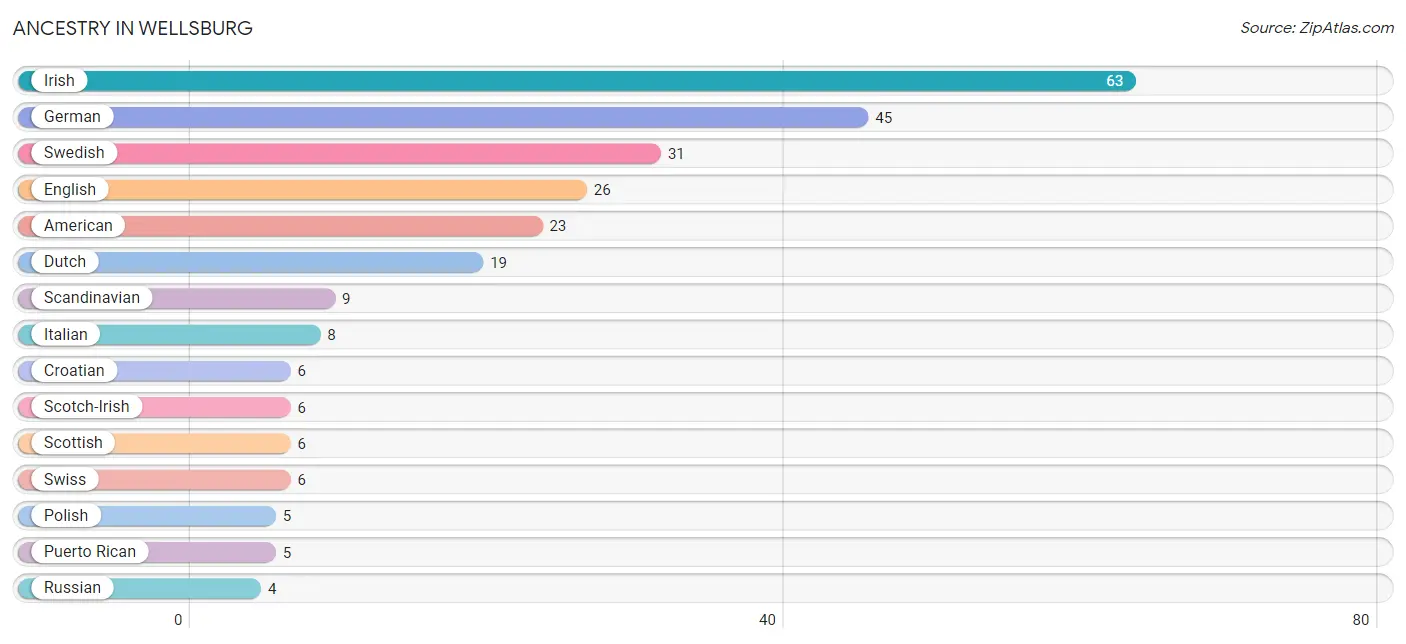
| Ancestry | # Population | % Population |
| American | 23 | 5.2% |
| Croatian | 6 | 1.4% |
| Dutch | 19 | 4.3% |
| English | 26 | 5.9% |
| German | 45 | 10.2% |
| Hungarian | 2 | 0.4% |
| Irish | 63 | 14.3% |
| Italian | 8 | 1.8% |
| Polish | 5 | 1.1% |
| Puerto Rican | 5 | 1.1% |
| Russian | 4 | 0.9% |
| Scandinavian | 9 | 2.1% |
| Scotch-Irish | 6 | 1.4% |
| Scottish | 6 | 1.4% |
| Swedish | 31 | 7.0% |
| Swiss | 6 | 1.4% |
| Welsh | 2 | 0.4% | View All 17 Rows |
Immigrants in Wellsburg

| Immigration Origin | # Population | % Population | View All 0 Rows |
Sex and Age in Wellsburg
Sex and Age in Wellsburg
The most populous age groups in Wellsburg are 25 to 29 Years (45 | 21.5%) for men and 25 to 29 Years (41 | 17.7%) for women.
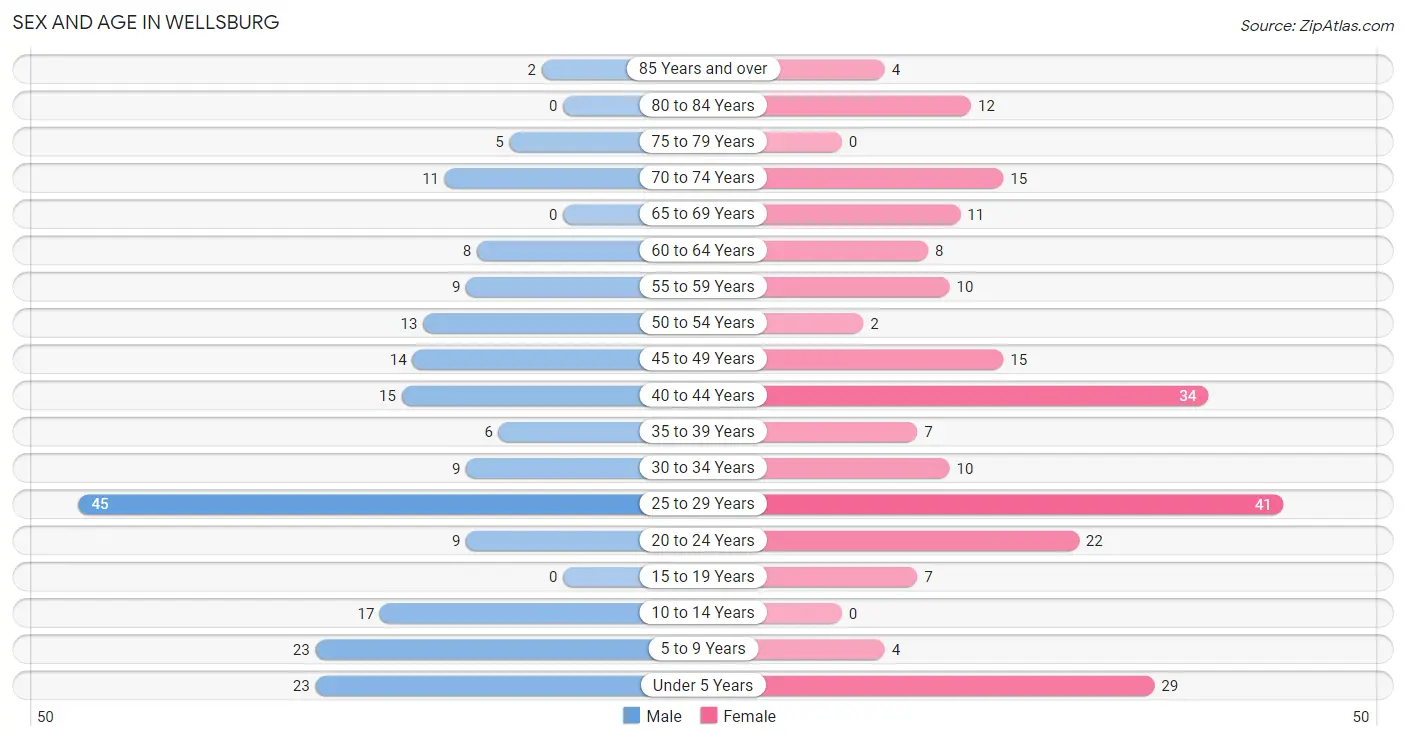
| Age Bracket | Male | Female |
| Under 5 Years | 23 (11.0%) | 29 (12.6%) |
| 5 to 9 Years | 23 (11.0%) | 4 (1.7%) |
| 10 to 14 Years | 17 (8.1%) | 0 (0.0%) |
| 15 to 19 Years | 0 (0.0%) | 7 (3.0%) |
| 20 to 24 Years | 9 (4.3%) | 22 (9.5%) |
| 25 to 29 Years | 45 (21.5%) | 41 (17.7%) |
| 30 to 34 Years | 9 (4.3%) | 10 (4.3%) |
| 35 to 39 Years | 6 (2.9%) | 7 (3.0%) |
| 40 to 44 Years | 15 (7.2%) | 34 (14.7%) |
| 45 to 49 Years | 14 (6.7%) | 15 (6.5%) |
| 50 to 54 Years | 13 (6.2%) | 2 (0.9%) |
| 55 to 59 Years | 9 (4.3%) | 10 (4.3%) |
| 60 to 64 Years | 8 (3.8%) | 8 (3.5%) |
| 65 to 69 Years | 0 (0.0%) | 11 (4.8%) |
| 70 to 74 Years | 11 (5.3%) | 15 (6.5%) |
| 75 to 79 Years | 5 (2.4%) | 0 (0.0%) |
| 80 to 84 Years | 0 (0.0%) | 12 (5.2%) |
| 85 Years and over | 2 (1.0%) | 4 (1.7%) |
| Total | 209 (100.0%) | 231 (100.0%) |
Families and Households in Wellsburg
Median Family Size in Wellsburg
The median family size in Wellsburg is 2.88 persons per family, with single male/father families (17 | 15.6%) accounting for the largest median family size of 3.24 persons per family. On the other hand, single female/mother families (33 | 30.3%) represent the smallest median family size with 2.64 persons per family.
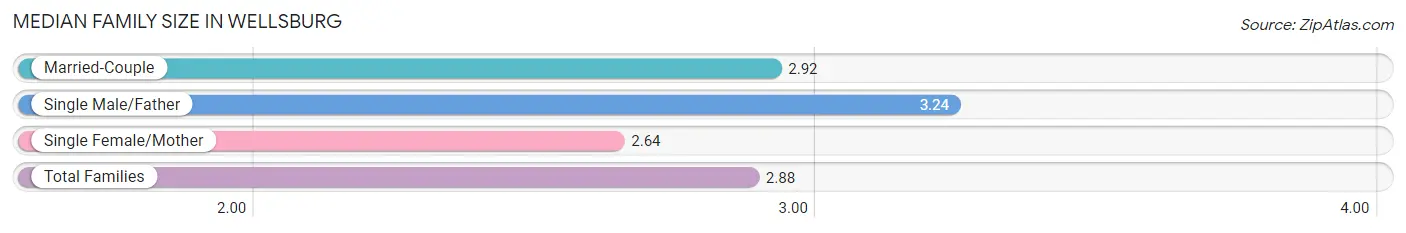
| Family Type | # Families | Family Size |
| Married-Couple | 59 (54.1%) | 2.92 |
| Single Male/Father | 17 (15.6%) | 3.24 |
| Single Female/Mother | 33 (30.3%) | 2.64 |
| Total Families | 109 (100.0%) | 2.88 |
Median Household Size in Wellsburg
The median household size in Wellsburg is 2.64 persons per household, with single male/father households (17 | 10.4%) accounting for the largest median household size of 4.35 persons per household. non-family households (54 | 33.1%) represent the smallest median household size with 1.48 persons per household.
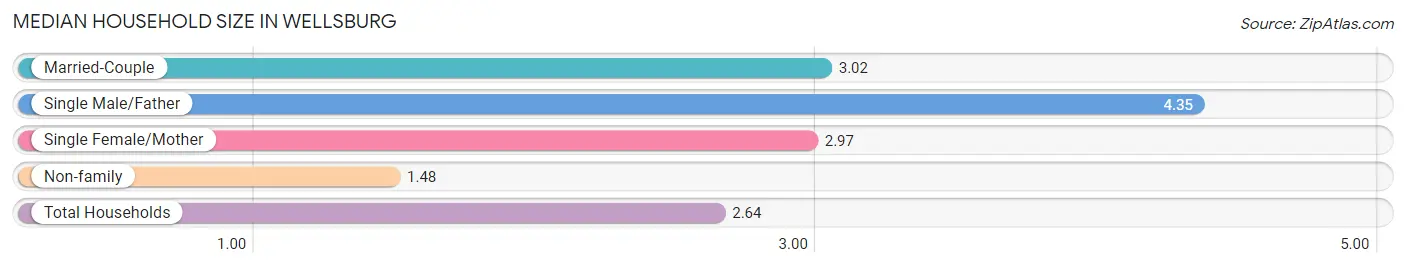
| Household Type | # Households | Household Size |
| Married-Couple | 59 (36.2%) | 3.02 |
| Single Male/Father | 17 (10.4%) | 4.35 |
| Single Female/Mother | 33 (20.3%) | 2.97 |
| Non-family | 54 (33.1%) | 1.48 |
| Total Households | 163 (100.0%) | 2.64 |
Household Size by Marriage Status in Wellsburg
Out of a total of 163 households in Wellsburg, 109 (66.9%) are family households, while 54 (33.1%) are nonfamily households. The most numerous type of family households are 2-person households, comprising 37, and the most common type of nonfamily households are 1-person households, comprising 32.
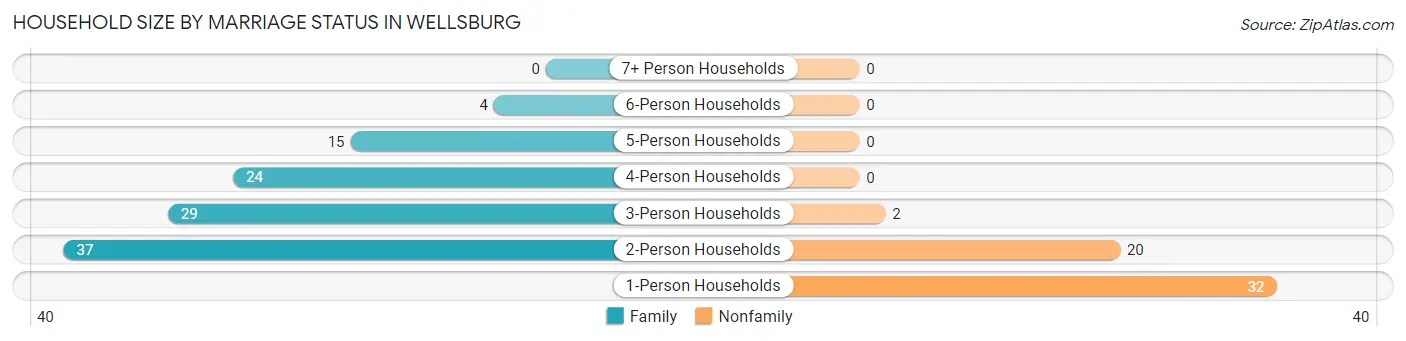
| Household Size | Family Households | Nonfamily Households |
| 1-Person Households | - | 32 (19.6%) |
| 2-Person Households | 37 (22.7%) | 20 (12.3%) |
| 3-Person Households | 29 (17.8%) | 2 (1.2%) |
| 4-Person Households | 24 (14.7%) | 0 (0.0%) |
| 5-Person Households | 15 (9.2%) | 0 (0.0%) |
| 6-Person Households | 4 (2.5%) | 0 (0.0%) |
| 7+ Person Households | 0 (0.0%) | 0 (0.0%) |
| Total | 109 (66.9%) | 54 (33.1%) |
Female Fertility in Wellsburg
Fertility by Age in Wellsburg
Average fertility rate in Wellsburg is 109.0 births per 1,000 women. Women in the age bracket of 20 to 34 years have the highest fertility rate with 205.0 births per 1,000 women. Women in the age bracket of 20 to 34 years acount for 100.0% of all women with births.
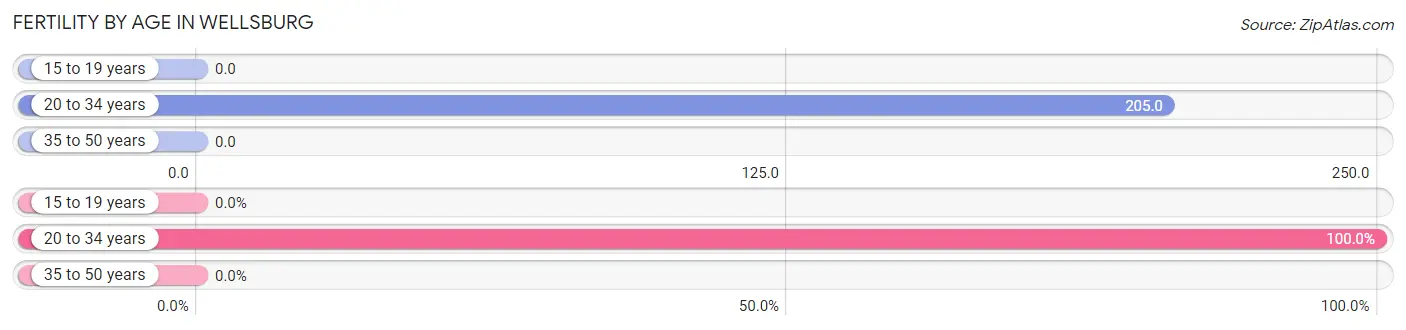
| Age Bracket | Women with Births | Births / 1,000 Women |
| 15 to 19 years | 0 (0.0%) | 0.0 |
| 20 to 34 years | 15 (100.0%) | 205.0 |
| 35 to 50 years | 0 (0.0%) | 0.0 |
| Total | 15 (100.0%) | 109.0 |
Fertility by Age by Marriage Status in Wellsburg
33.3% of women with births (15) in Wellsburg are married. The highest percentage of unmarried women with births falls into 20 to 34 years age bracket with 66.7% of them unmarried at the time of birth, while the lowest percentage of unmarried women with births belong to 20 to 34 years age bracket with 66.7% of them unmarried.
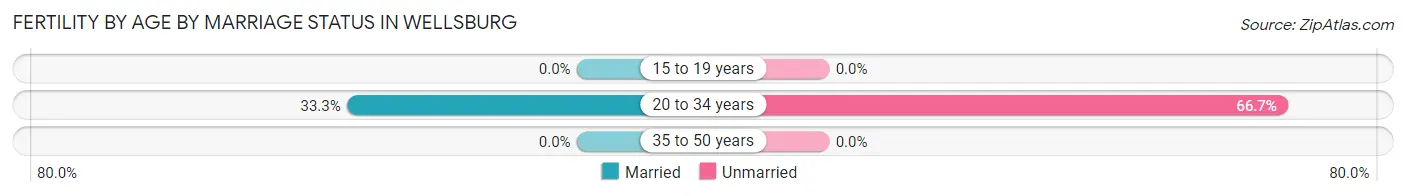
| Age Bracket | Married | Unmarried |
| 15 to 19 years | 0 (0.0%) | 0 (0.0%) |
| 20 to 34 years | 5 (33.3%) | 10 (66.7%) |
| 35 to 50 years | 0 (0.0%) | 0 (0.0%) |
| Total | 5 (33.3%) | 10 (66.7%) |
Fertility by Education in Wellsburg
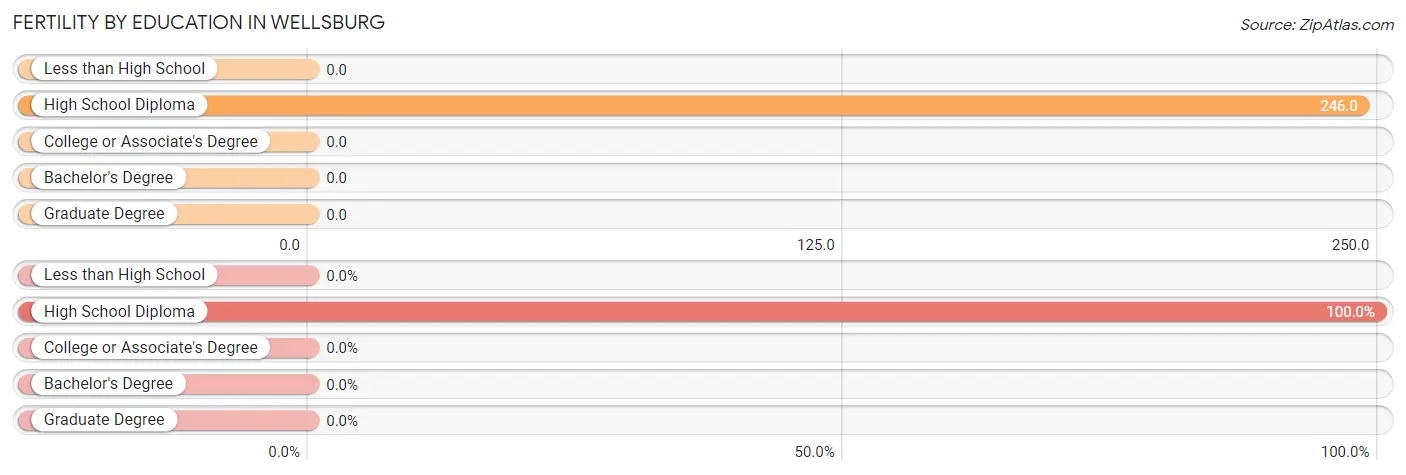
| Educational Attainment | Women with Births | Births / 1,000 Women |
| Less than High School | 0 (0.0%) | 0.0 |
| High School Diploma | 15 (100.0%) | 246.0 |
| College or Associate's Degree | 0 (0.0%) | 0.0 |
| Bachelor's Degree | 0 (0.0%) | 0.0 |
| Graduate Degree | 0 (0.0%) | 0.0 |
| Total | 15 (100.0%) | 109.0 |
Fertility by Education by Marriage Status in Wellsburg
66.7% of women with births in Wellsburg are unmarried. Women with the educational attainment of high school diploma are most likely to be married with 33.3% of them married at childbirth, while women with the educational attainment of high school diploma are least likely to be married with 66.7% of them unmarried at childbirth.
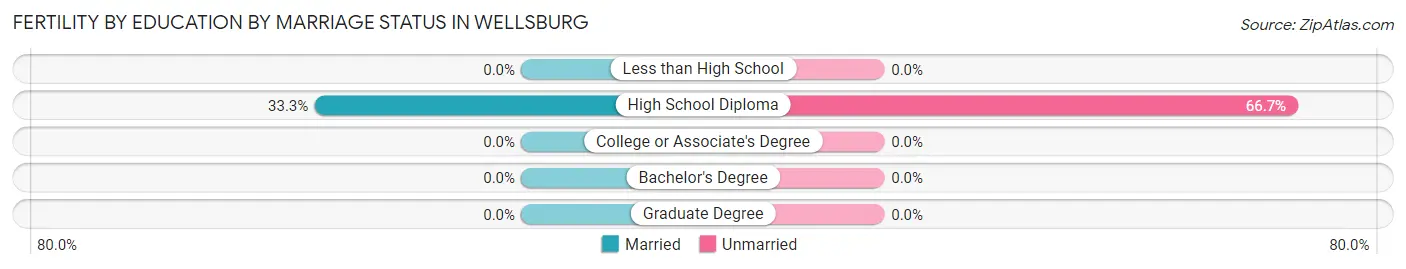
| Educational Attainment | Married | Unmarried |
| Less than High School | 0 (0.0%) | 0 (0.0%) |
| High School Diploma | 5 (33.3%) | 10 (66.7%) |
| College or Associate's Degree | 0 (0.0%) | 0 (0.0%) |
| Bachelor's Degree | 0 (0.0%) | 0 (0.0%) |
| Graduate Degree | 0 (0.0%) | 0 (0.0%) |
| Total | 5 (33.3%) | 10 (66.7%) |
Employment Characteristics in Wellsburg
Employment by Class of Employer in Wellsburg
Among the 216 employed individuals in Wellsburg, private company employees (112 | 51.8%), state government employees (27 | 12.5%), and self-employed (not incorporated) (25 | 11.6%) make up the most common classes of employment.
| Employer Class | # Employees | % Employees |
| Private Company Employees | 112 | 51.8% |
| Self-Employed (Incorporated) | 3 | 1.4% |
| Self-Employed (Not Incorporated) | 25 | 11.6% |
| Not-for-profit Organizations | 20 | 9.3% |
| Local Government Employees | 24 | 11.1% |
| State Government Employees | 27 | 12.5% |
| Federal Government Employees | 5 | 2.3% |
| Unpaid Family Workers | 0 | 0.0% |
| Total | 216 | 100.0% |
Employment Status by Age in Wellsburg
According to the labor force statistics for Wellsburg, out of the total population over 16 years of age (344), 67.7% or 233 individuals are in the labor force, with 7.3% or 17 of them unemployed. The age group with the highest labor force participation rate is 16 to 19 years, with 100.0% or 7 individuals in the labor force. Within the labor force, the 20 to 24 years age range has the highest percentage of unemployed individuals, with 32.0% or 8 of them being unemployed.
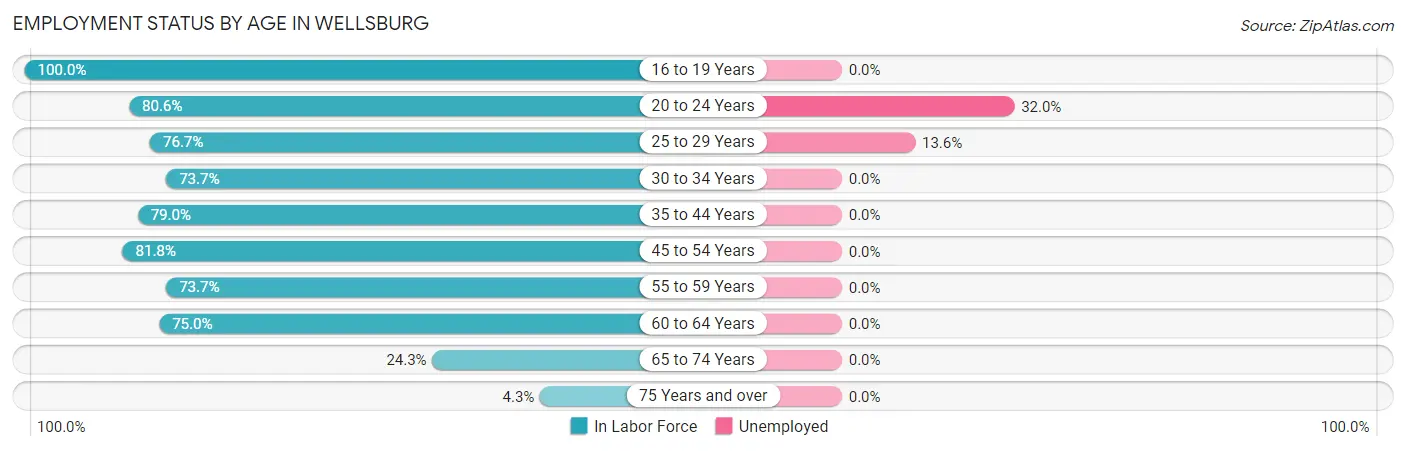
| Age Bracket | In Labor Force | Unemployed |
| 16 to 19 Years | 7 (100.0%) | 0 (0.0%) |
| 20 to 24 Years | 25 (80.6%) | 8 (32.0%) |
| 25 to 29 Years | 66 (76.7%) | 9 (13.6%) |
| 30 to 34 Years | 14 (73.7%) | 0 (0.0%) |
| 35 to 44 Years | 49 (79.0%) | 0 (0.0%) |
| 45 to 54 Years | 36 (81.8%) | 0 (0.0%) |
| 55 to 59 Years | 14 (73.7%) | 0 (0.0%) |
| 60 to 64 Years | 12 (75.0%) | 0 (0.0%) |
| 65 to 74 Years | 9 (24.3%) | 0 (0.0%) |
| 75 Years and over | 1 (4.3%) | 0 (0.0%) |
| Total | 233 (67.7%) | 17 (7.3%) |
Employment Status by Educational Attainment in Wellsburg
According to labor force statistics for Wellsburg, 77.6% of individuals (191) out of the total population between 25 and 64 years of age (246) are in the labor force, with 4.7% or 9 of them being unemployed. The group with the highest labor force participation rate are those with the educational attainment of college / associate degree, with 92.2% or 59 individuals in the labor force. Within the labor force, individuals with high school diploma education have the highest percentage of unemployment, with 10.6% or 9 of them being unemployed.
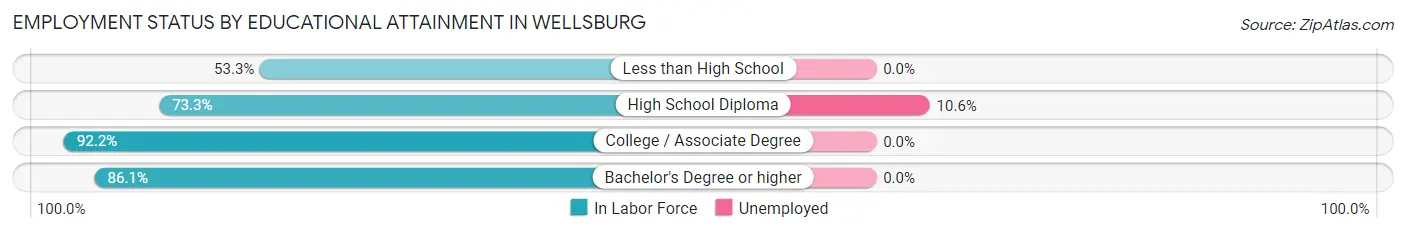
| Educational Attainment | In Labor Force | Unemployed |
| Less than High School | 16 (53.3%) | 0 (0.0%) |
| High School Diploma | 85 (73.3%) | 12 (10.6%) |
| College / Associate Degree | 59 (92.2%) | 0 (0.0%) |
| Bachelor's Degree or higher | 31 (86.1%) | 0 (0.0%) |
| Total | 191 (77.6%) | 12 (4.7%) |
Employment Occupations by Sex in Wellsburg
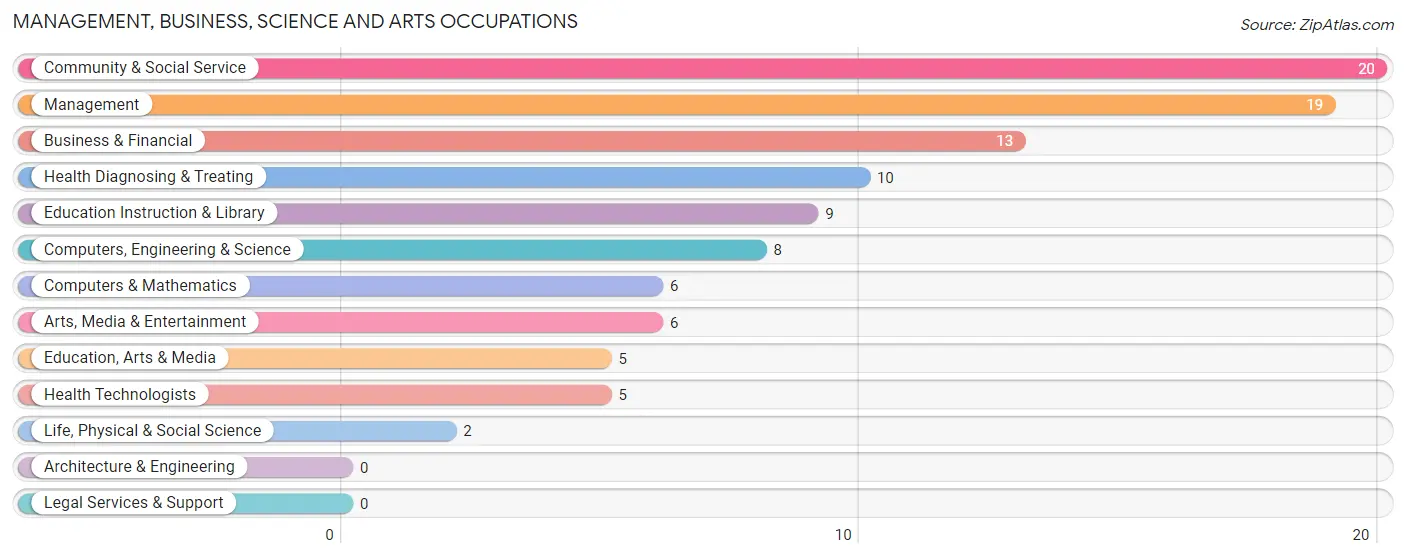
Management, Business, Science and Arts Occupations
The most common Management, Business, Science and Arts occupations in Wellsburg are Community & Social Service (20 | 9.3%), Management (19 | 8.8%), Business & Financial (13 | 6.0%), Health Diagnosing & Treating (10 | 4.6%), and Education Instruction & Library (9 | 4.2%).
Management, Business, Science and Arts Occupations by Sex
Within the Management, Business, Science and Arts occupations in Wellsburg, the most male-oriented occupations are Computers, Engineering & Science (100.0%), Computers & Mathematics (100.0%), and Life, Physical & Social Science (100.0%), while the most female-oriented occupations are Community & Social Service (100.0%), Education, Arts & Media (100.0%), and Education Instruction & Library (100.0%).
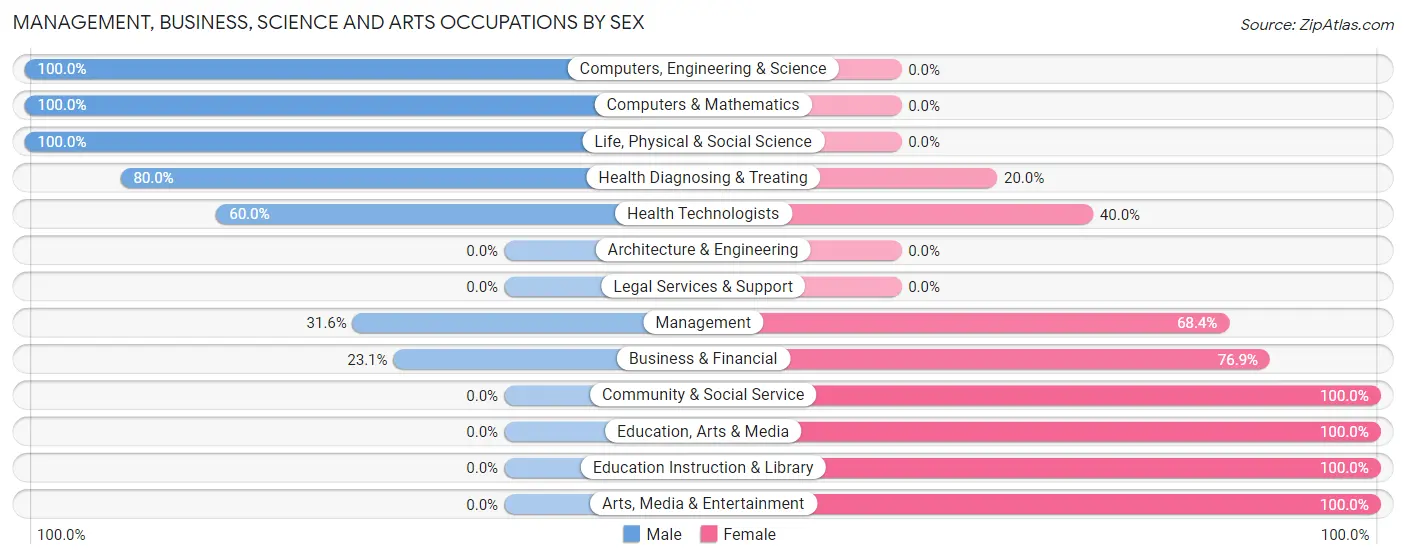
| Occupation | Male | Female |
| Management | 6 (31.6%) | 13 (68.4%) |
| Business & Financial | 3 (23.1%) | 10 (76.9%) |
| Computers, Engineering & Science | 8 (100.0%) | 0 (0.0%) |
| Computers & Mathematics | 6 (100.0%) | 0 (0.0%) |
| Architecture & Engineering | 0 (0.0%) | 0 (0.0%) |
| Life, Physical & Social Science | 2 (100.0%) | 0 (0.0%) |
| Community & Social Service | 0 (0.0%) | 20 (100.0%) |
| Education, Arts & Media | 0 (0.0%) | 5 (100.0%) |
| Legal Services & Support | 0 (0.0%) | 0 (0.0%) |
| Education Instruction & Library | 0 (0.0%) | 9 (100.0%) |
| Arts, Media & Entertainment | 0 (0.0%) | 6 (100.0%) |
| Health Diagnosing & Treating | 8 (80.0%) | 2 (20.0%) |
| Health Technologists | 3 (60.0%) | 2 (40.0%) |
| Total (Category) | 25 (35.7%) | 45 (64.3%) |
| Total (Overall) | 108 (50.0%) | 108 (50.0%) |
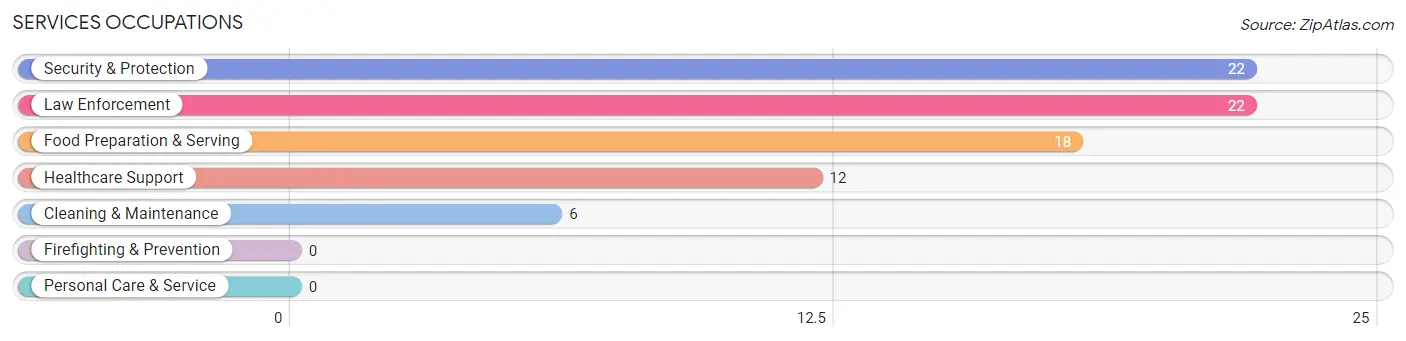
Services Occupations
The most common Services occupations in Wellsburg are Security & Protection (22 | 10.2%), Law Enforcement (22 | 10.2%), Food Preparation & Serving (18 | 8.3%), Healthcare Support (12 | 5.6%), and Cleaning & Maintenance (6 | 2.8%).
Services Occupations by Sex
Within the Services occupations in Wellsburg, the most male-oriented occupations are Security & Protection (100.0%), Law Enforcement (100.0%), and Cleaning & Maintenance (100.0%), while the most female-oriented occupations are Healthcare Support (100.0%), and Food Preparation & Serving (100.0%).
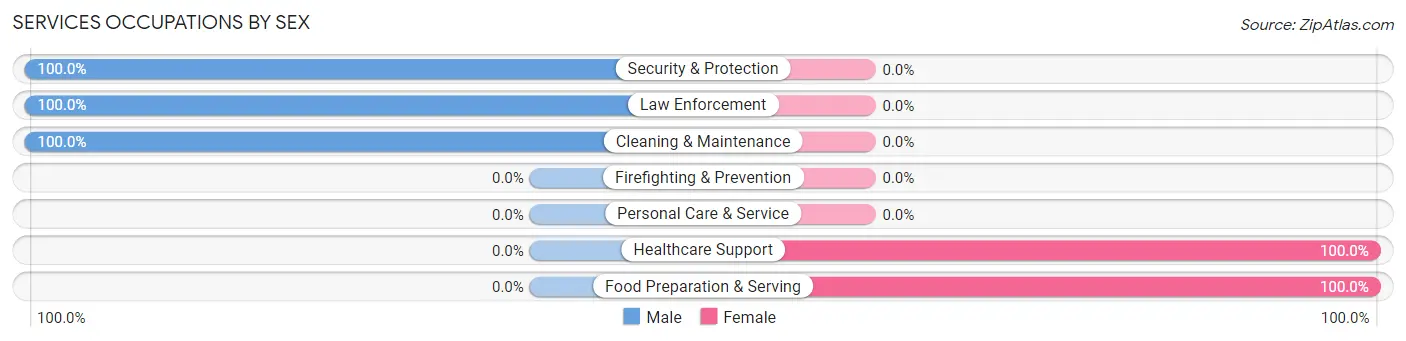
| Occupation | Male | Female |
| Healthcare Support | 0 (0.0%) | 12 (100.0%) |
| Security & Protection | 22 (100.0%) | 0 (0.0%) |
| Firefighting & Prevention | 0 (0.0%) | 0 (0.0%) |
| Law Enforcement | 22 (100.0%) | 0 (0.0%) |
| Food Preparation & Serving | 0 (0.0%) | 18 (100.0%) |
| Cleaning & Maintenance | 6 (100.0%) | 0 (0.0%) |
| Personal Care & Service | 0 (0.0%) | 0 (0.0%) |
| Total (Category) | 28 (48.3%) | 30 (51.7%) |
| Total (Overall) | 108 (50.0%) | 108 (50.0%) |
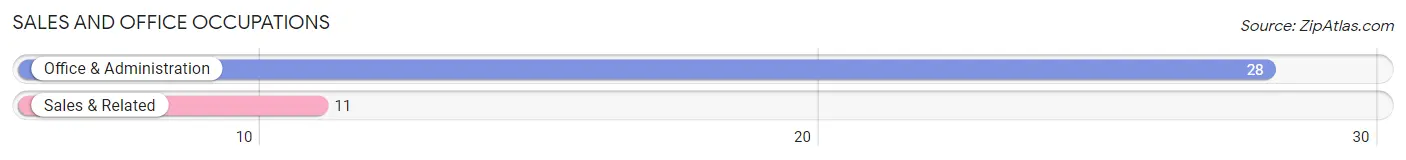
Sales and Office Occupations
The most common Sales and Office occupations in Wellsburg are Office & Administration (28 | 13.0%), and Sales & Related (11 | 5.1%).
Sales and Office Occupations by Sex
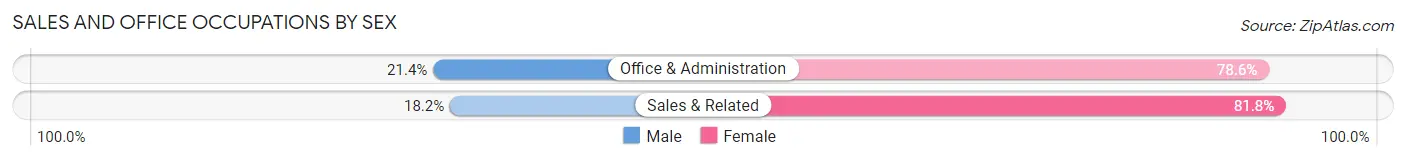
| Occupation | Male | Female |
| Sales & Related | 2 (18.2%) | 9 (81.8%) |
| Office & Administration | 6 (21.4%) | 22 (78.6%) |
| Total (Category) | 8 (20.5%) | 31 (79.5%) |
| Total (Overall) | 108 (50.0%) | 108 (50.0%) |
Natural Resources, Construction and Maintenance Occupations
The most common Natural Resources, Construction and Maintenance occupations in Wellsburg are Construction & Extraction (10 | 4.6%), and Installation, Maintenance & Repair (7 | 3.2%).
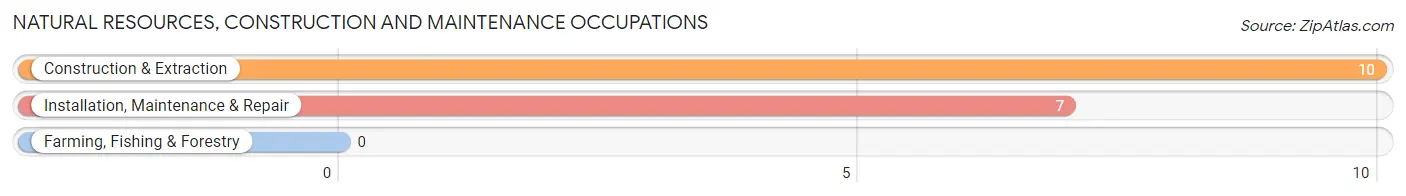
Natural Resources, Construction and Maintenance Occupations by Sex
| Occupation | Male | Female |
| Farming, Fishing & Forestry | 0 (0.0%) | 0 (0.0%) |
| Construction & Extraction | 10 (100.0%) | 0 (0.0%) |
| Installation, Maintenance & Repair | 5 (71.4%) | 2 (28.6%) |
| Total (Category) | 15 (88.2%) | 2 (11.8%) |
| Total (Overall) | 108 (50.0%) | 108 (50.0%) |
Production, Transportation and Moving Occupations
The most common Production, Transportation and Moving occupations in Wellsburg are Production (14 | 6.5%), Material Moving (11 | 5.1%), and Transportation (7 | 3.2%).
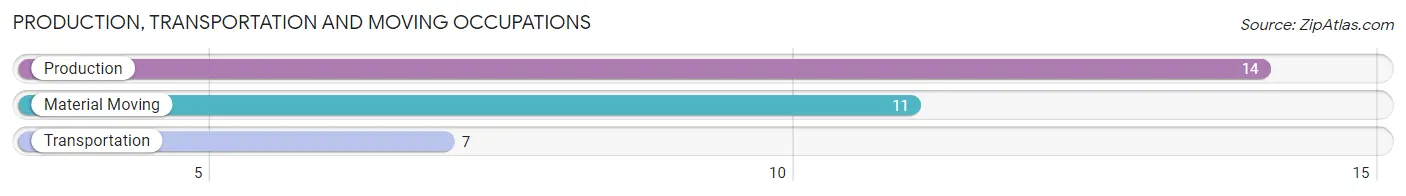
Production, Transportation and Moving Occupations by Sex
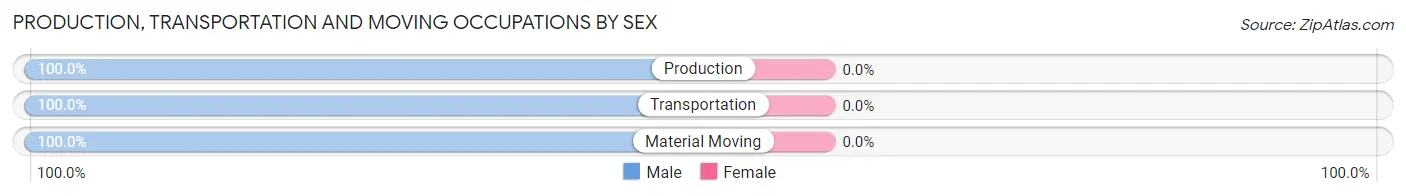
| Occupation | Male | Female |
| Production | 14 (100.0%) | 0 (0.0%) |
| Transportation | 7 (100.0%) | 0 (0.0%) |
| Material Moving | 11 (100.0%) | 0 (0.0%) |
| Total (Category) | 32 (100.0%) | 0 (0.0%) |
| Total (Overall) | 108 (50.0%) | 108 (50.0%) |
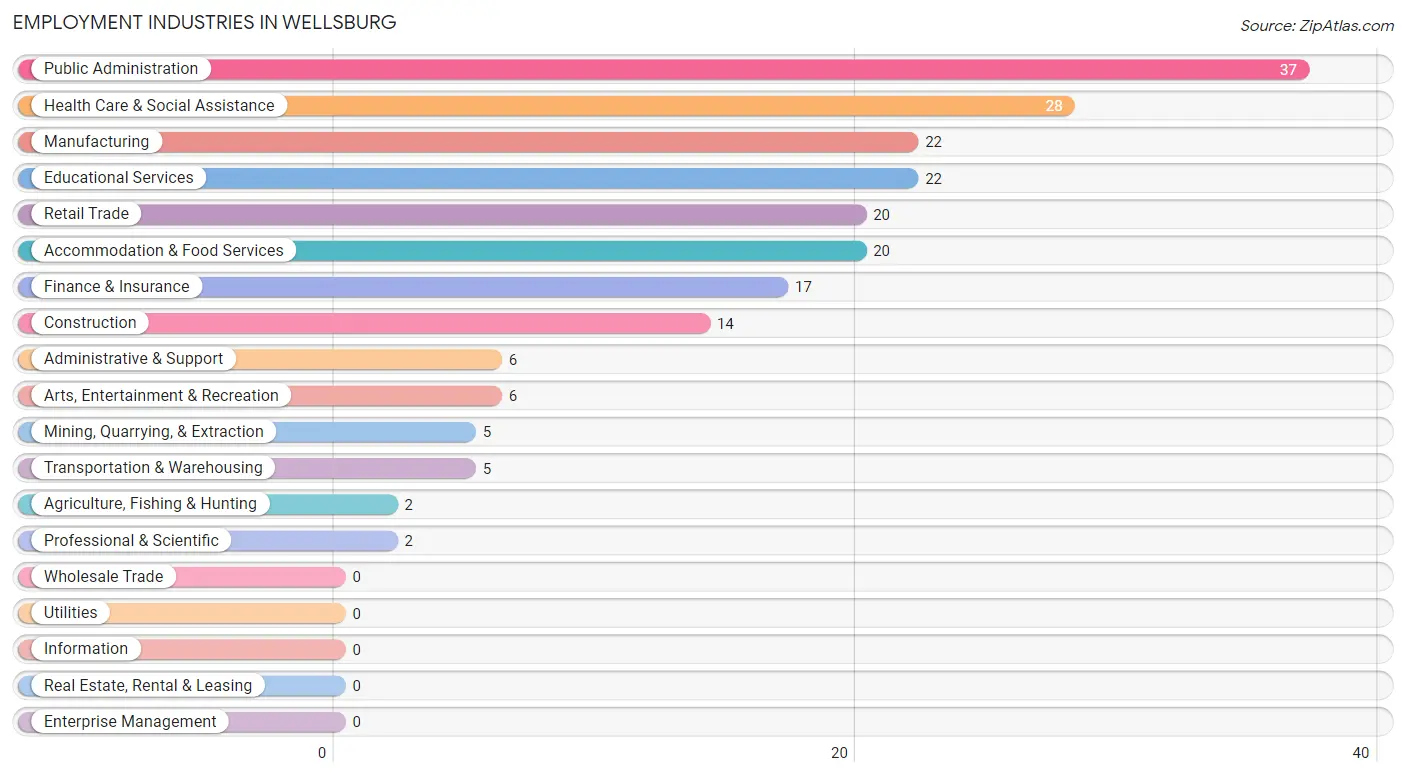
Employment Industries by Sex in Wellsburg
Employment Industries in Wellsburg
The major employment industries in Wellsburg include Public Administration (37 | 17.1%), Health Care & Social Assistance (28 | 13.0%), Manufacturing (22 | 10.2%), Educational Services (22 | 10.2%), and Retail Trade (20 | 9.3%).
Employment Industries by Sex in Wellsburg
The Wellsburg industries that see more men than women are Agriculture, Fishing & Hunting (100.0%), Mining, Quarrying, & Extraction (100.0%), and Construction (100.0%), whereas the industries that tend to have a higher number of women are Transportation & Warehousing (100.0%), Arts, Entertainment & Recreation (100.0%), and Accommodation & Food Services (100.0%).
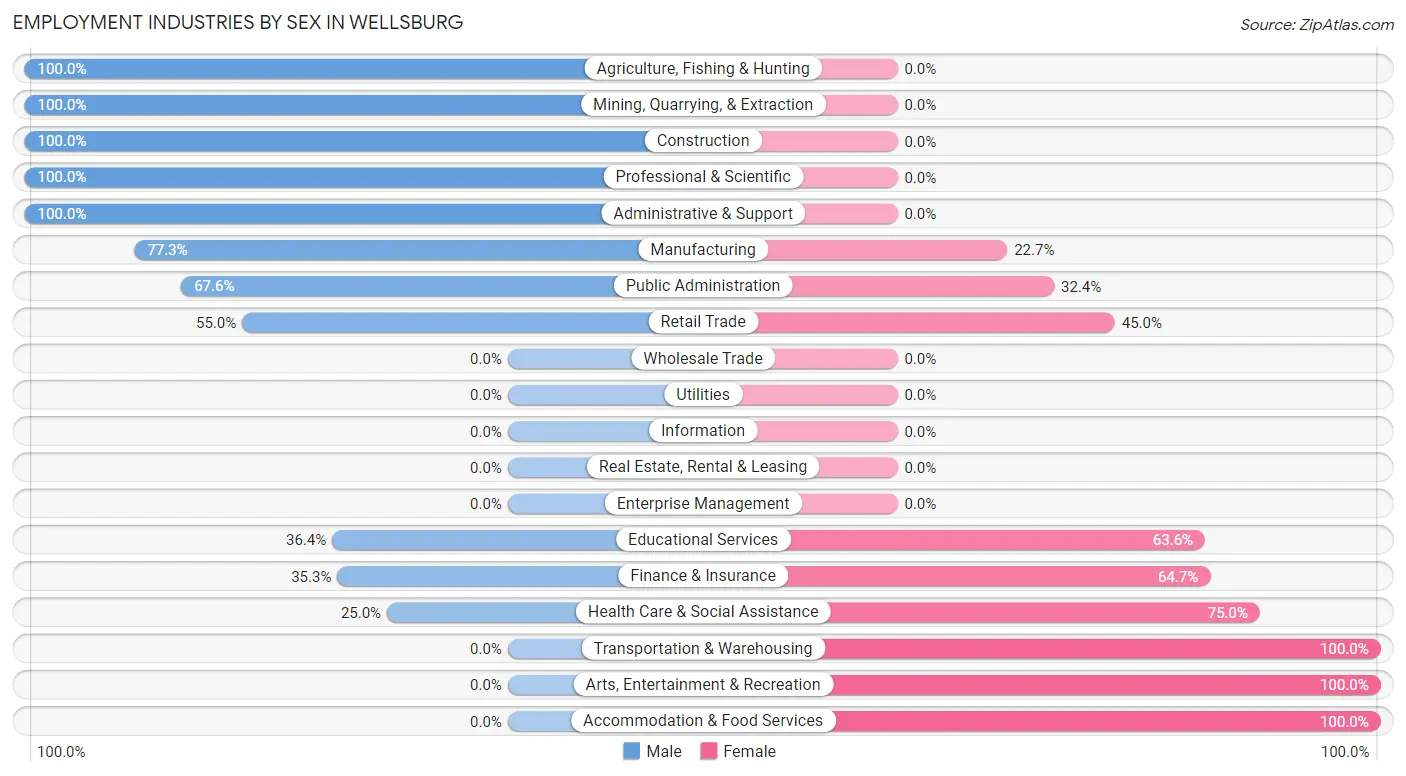
| Industry | Male | Female |
| Agriculture, Fishing & Hunting | 2 (100.0%) | 0 (0.0%) |
| Mining, Quarrying, & Extraction | 5 (100.0%) | 0 (0.0%) |
| Construction | 14 (100.0%) | 0 (0.0%) |
| Manufacturing | 17 (77.3%) | 5 (22.7%) |
| Wholesale Trade | 0 (0.0%) | 0 (0.0%) |
| Retail Trade | 11 (55.0%) | 9 (45.0%) |
| Transportation & Warehousing | 0 (0.0%) | 5 (100.0%) |
| Utilities | 0 (0.0%) | 0 (0.0%) |
| Information | 0 (0.0%) | 0 (0.0%) |
| Finance & Insurance | 6 (35.3%) | 11 (64.7%) |
| Real Estate, Rental & Leasing | 0 (0.0%) | 0 (0.0%) |
| Professional & Scientific | 2 (100.0%) | 0 (0.0%) |
| Enterprise Management | 0 (0.0%) | 0 (0.0%) |
| Administrative & Support | 6 (100.0%) | 0 (0.0%) |
| Educational Services | 8 (36.4%) | 14 (63.6%) |
| Health Care & Social Assistance | 7 (25.0%) | 21 (75.0%) |
| Arts, Entertainment & Recreation | 0 (0.0%) | 6 (100.0%) |
| Accommodation & Food Services | 0 (0.0%) | 20 (100.0%) |
| Public Administration | 25 (67.6%) | 12 (32.4%) |
| Total | 108 (50.0%) | 108 (50.0%) |
Education in Wellsburg
School Enrollment in Wellsburg
The most common levels of schooling among the 63 students in Wellsburg are nursery / preschool (18 | 28.6%), elementary school (17 | 27.0%), and college / undergraduate (13 | 20.6%).
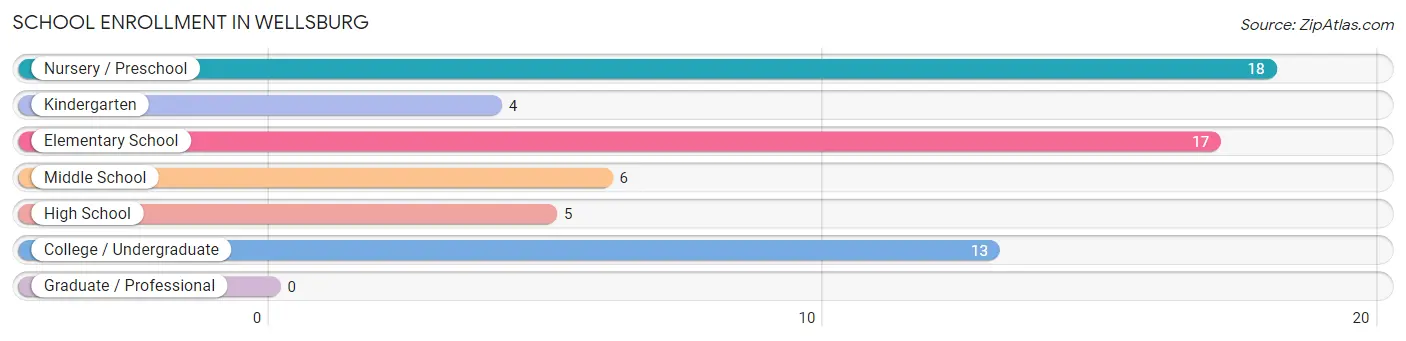
| School Level | # Students | % Students |
| Nursery / Preschool | 18 | 28.6% |
| Kindergarten | 4 | 6.4% |
| Elementary School | 17 | 27.0% |
| Middle School | 6 | 9.5% |
| High School | 5 | 7.9% |
| College / Undergraduate | 13 | 20.6% |
| Graduate / Professional | 0 | 0.0% |
| Total | 63 | 100.0% |
School Enrollment by Age by Funding Source in Wellsburg
Out of a total of 63 students who are enrolled in schools in Wellsburg, 11 (17.5%) attend a private institution, while the remaining 52 (82.5%) are enrolled in public schools. The age group of 20 to 24 year olds has the highest likelihood of being enrolled in private schools, with 6 (100.0% in the age bracket) enrolled. Conversely, the age group of 3 to 4 year olds has the lowest likelihood of being enrolled in a private school, with 18 (100.0% in the age bracket) attending a public institution.
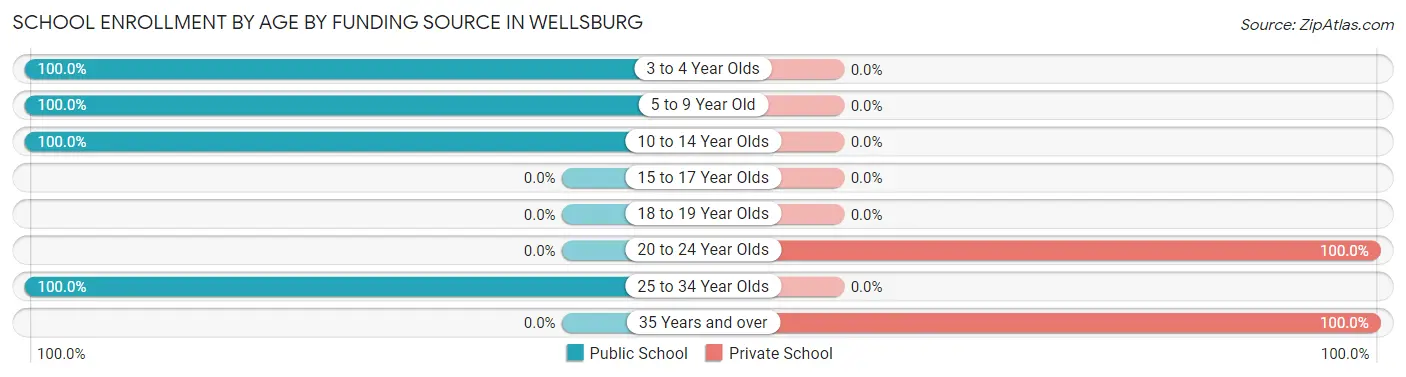
| Age Bracket | Public School | Private School |
| 3 to 4 Year Olds | 18 (100.0%) | 0 (0.0%) |
| 5 to 9 Year Old | 21 (100.0%) | 0 (0.0%) |
| 10 to 14 Year Olds | 11 (100.0%) | 0 (0.0%) |
| 15 to 17 Year Olds | 0 (0.0%) | 0 (0.0%) |
| 18 to 19 Year Olds | 0 (0.0%) | 0 (0.0%) |
| 20 to 24 Year Olds | 0 (0.0%) | 6 (100.0%) |
| 25 to 34 Year Olds | 2 (100.0%) | 0 (0.0%) |
| 35 Years and over | 0 (0.0%) | 5 (100.0%) |
| Total | 52 (82.5%) | 11 (17.5%) |
Educational Attainment by Field of Study in Wellsburg
Science & technology (16 | 39.0%), arts & humanities (9 | 22.0%), psychology (6 | 14.6%), education (5 | 12.2%), and visual & performing arts (5 | 12.2%) are the most common fields of study among 41 individuals in Wellsburg who have obtained a bachelor's degree or higher.
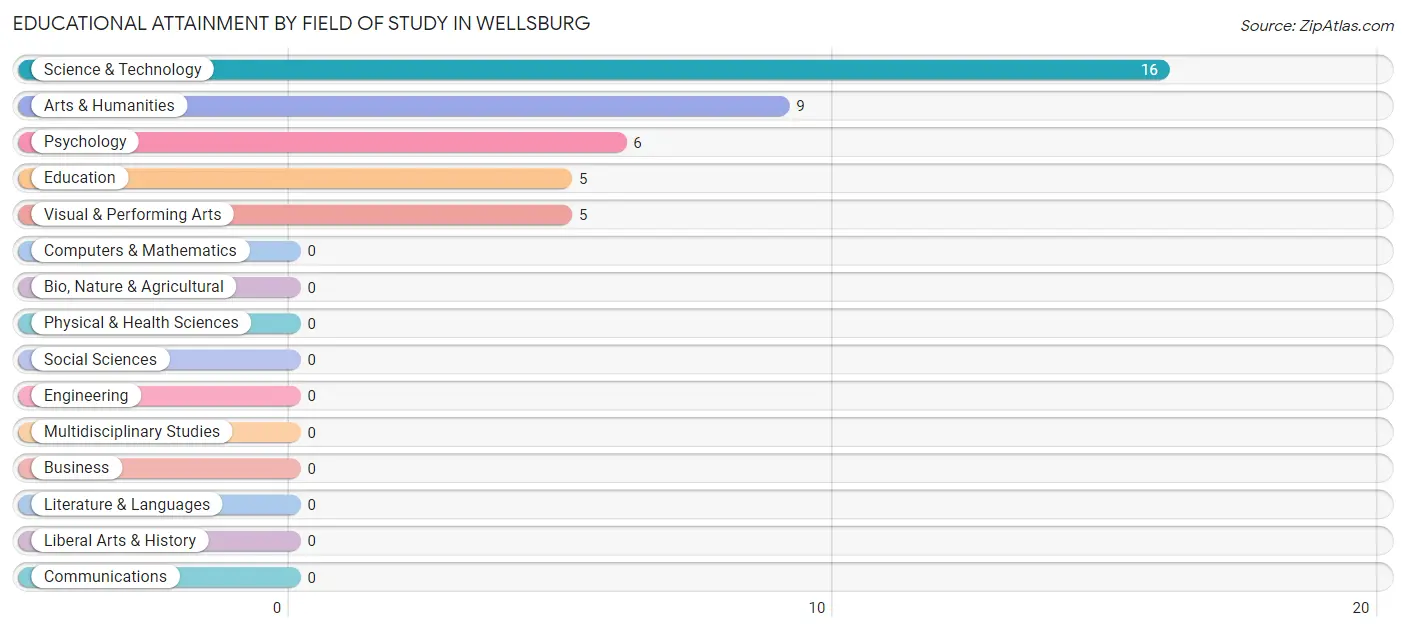
| Field of Study | # Graduates | % Graduates |
| Computers & Mathematics | 0 | 0.0% |
| Bio, Nature & Agricultural | 0 | 0.0% |
| Physical & Health Sciences | 0 | 0.0% |
| Psychology | 6 | 14.6% |
| Social Sciences | 0 | 0.0% |
| Engineering | 0 | 0.0% |
| Multidisciplinary Studies | 0 | 0.0% |
| Science & Technology | 16 | 39.0% |
| Business | 0 | 0.0% |
| Education | 5 | 12.2% |
| Literature & Languages | 0 | 0.0% |
| Liberal Arts & History | 0 | 0.0% |
| Visual & Performing Arts | 5 | 12.2% |
| Communications | 0 | 0.0% |
| Arts & Humanities | 9 | 22.0% |
| Total | 41 | 100.0% |
Transportation & Commute in Wellsburg
Vehicle Availability by Sex in Wellsburg
The most prevalent vehicle ownership categories in Wellsburg are males with 2 vehicles (56, accounting for 51.8%) and females with 2 vehicles (44, making up 51.8%).
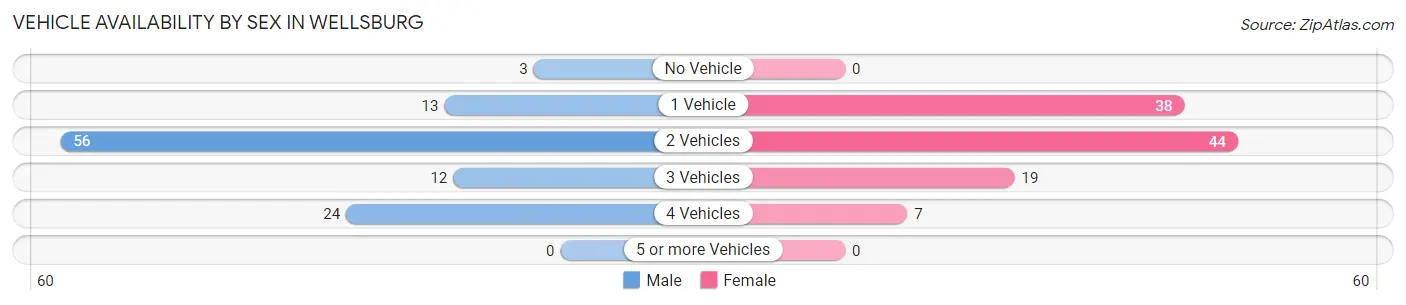
| Vehicles Available | Male | Female |
| No Vehicle | 3 (2.8%) | 0 (0.0%) |
| 1 Vehicle | 13 (12.0%) | 38 (35.2%) |
| 2 Vehicles | 56 (51.8%) | 44 (40.7%) |
| 3 Vehicles | 12 (11.1%) | 19 (17.6%) |
| 4 Vehicles | 24 (22.2%) | 7 (6.5%) |
| 5 or more Vehicles | 0 (0.0%) | 0 (0.0%) |
| Total | 108 (100.0%) | 108 (100.0%) |
Commute Time in Wellsburg
The most frequently occuring commute durations in Wellsburg are 15 to 19 minutes (66 commuters, 32.4%), 20 to 24 minutes (54 commuters, 26.5%), and 10 to 14 minutes (27 commuters, 13.2%).
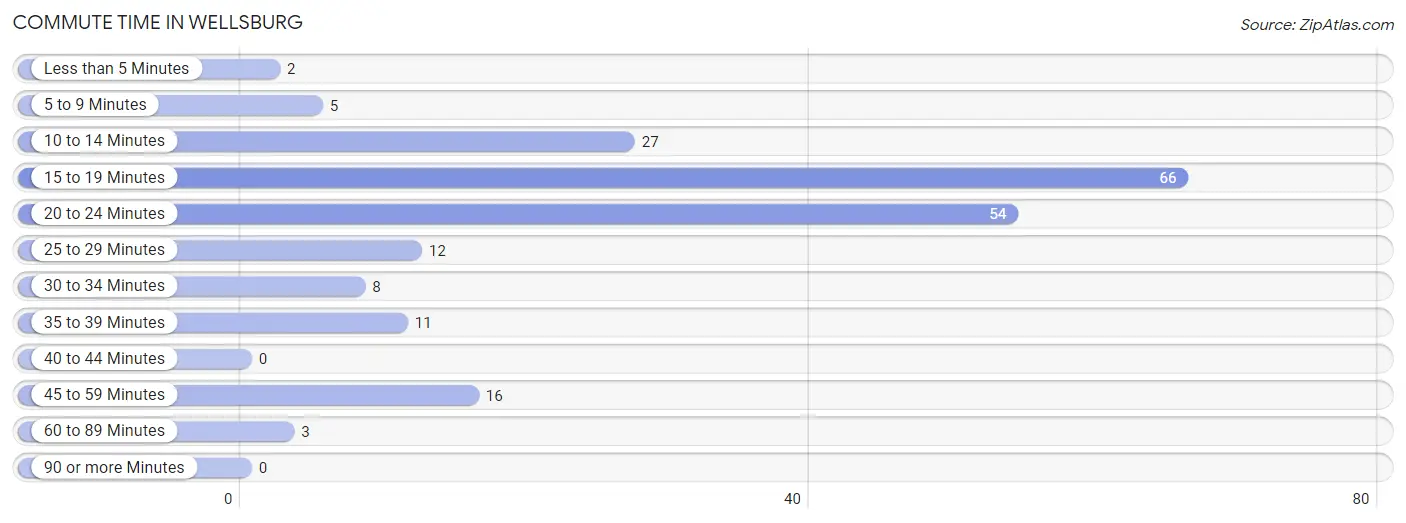
| Commute Time | # Commuters | % Commuters |
| Less than 5 Minutes | 2 | 1.0% |
| 5 to 9 Minutes | 5 | 2.5% |
| 10 to 14 Minutes | 27 | 13.2% |
| 15 to 19 Minutes | 66 | 32.4% |
| 20 to 24 Minutes | 54 | 26.5% |
| 25 to 29 Minutes | 12 | 5.9% |
| 30 to 34 Minutes | 8 | 3.9% |
| 35 to 39 Minutes | 11 | 5.4% |
| 40 to 44 Minutes | 0 | 0.0% |
| 45 to 59 Minutes | 16 | 7.8% |
| 60 to 89 Minutes | 3 | 1.5% |
| 90 or more Minutes | 0 | 0.0% |
Commute Time by Sex in Wellsburg
The most common commute times in Wellsburg are 15 to 19 minutes (41 commuters, 40.2%) for males and 20 to 24 minutes (30 commuters, 29.4%) for females.
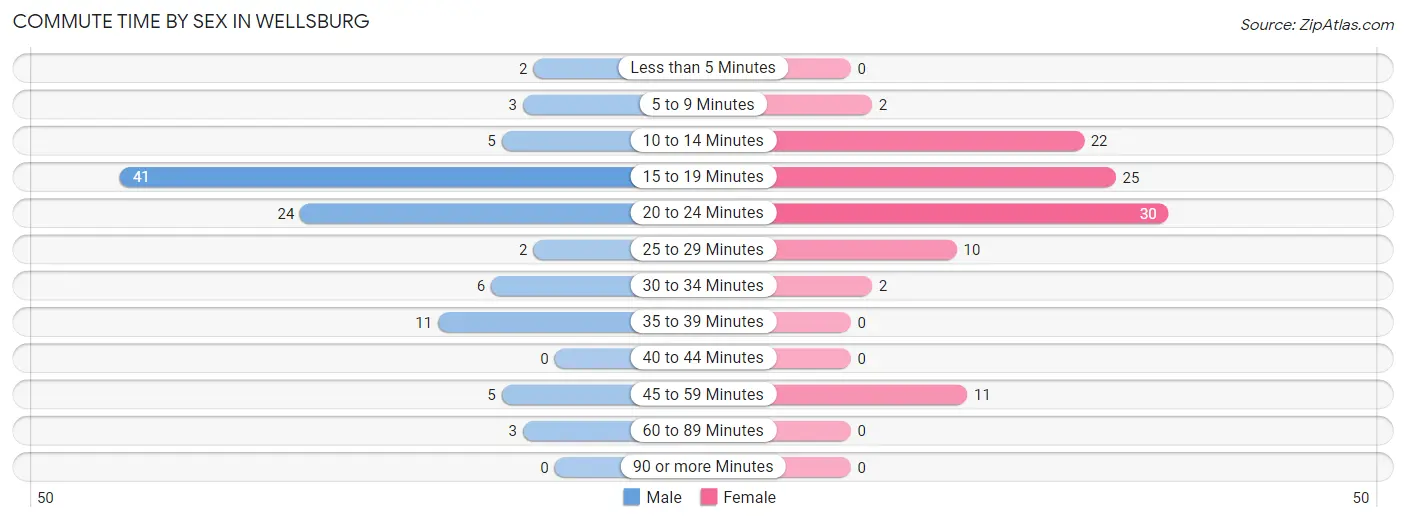
| Commute Time | Male | Female |
| Less than 5 Minutes | 2 (2.0%) | 0 (0.0%) |
| 5 to 9 Minutes | 3 (2.9%) | 2 (2.0%) |
| 10 to 14 Minutes | 5 (4.9%) | 22 (21.6%) |
| 15 to 19 Minutes | 41 (40.2%) | 25 (24.5%) |
| 20 to 24 Minutes | 24 (23.5%) | 30 (29.4%) |
| 25 to 29 Minutes | 2 (2.0%) | 10 (9.8%) |
| 30 to 34 Minutes | 6 (5.9%) | 2 (2.0%) |
| 35 to 39 Minutes | 11 (10.8%) | 0 (0.0%) |
| 40 to 44 Minutes | 0 (0.0%) | 0 (0.0%) |
| 45 to 59 Minutes | 5 (4.9%) | 11 (10.8%) |
| 60 to 89 Minutes | 3 (2.9%) | 0 (0.0%) |
| 90 or more Minutes | 0 (0.0%) | 0 (0.0%) |
Time of Departure to Work by Sex in Wellsburg
The most frequent times of departure to work in Wellsburg are 12:00 PM to 3:59 PM (15, 14.7%) for males and 7:30 AM to 7:59 AM (30, 29.4%) for females.
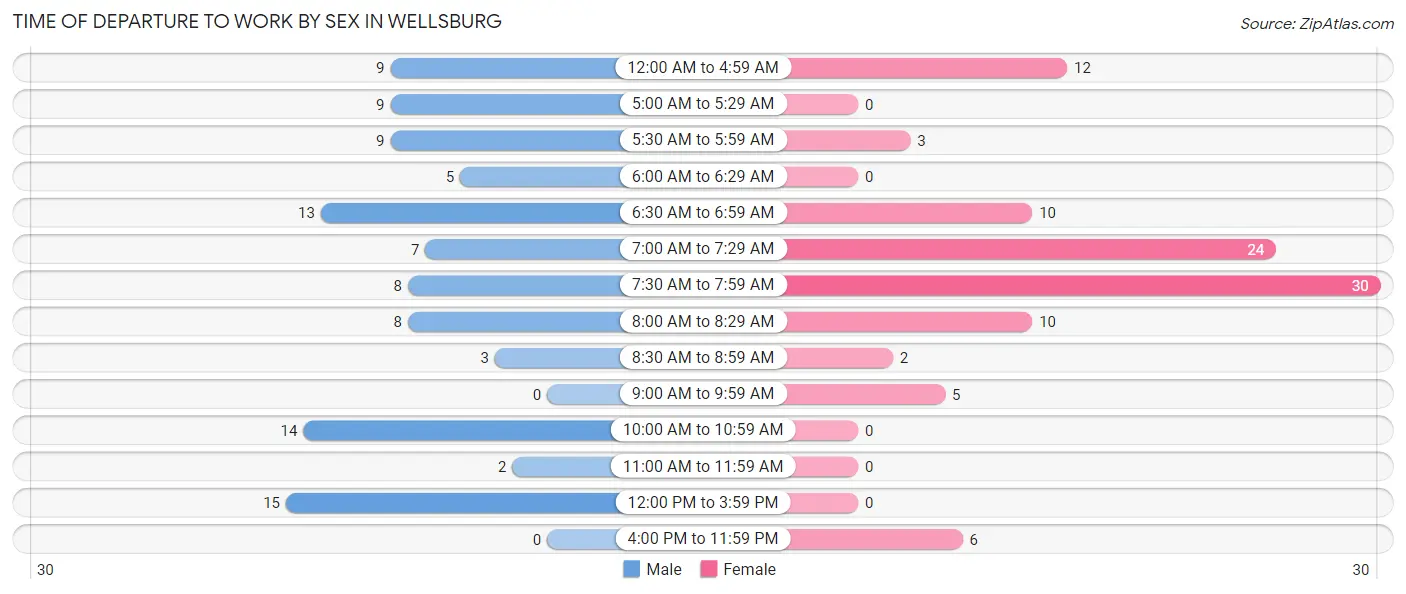
| Time of Departure | Male | Female |
| 12:00 AM to 4:59 AM | 9 (8.8%) | 12 (11.8%) |
| 5:00 AM to 5:29 AM | 9 (8.8%) | 0 (0.0%) |
| 5:30 AM to 5:59 AM | 9 (8.8%) | 3 (2.9%) |
| 6:00 AM to 6:29 AM | 5 (4.9%) | 0 (0.0%) |
| 6:30 AM to 6:59 AM | 13 (12.8%) | 10 (9.8%) |
| 7:00 AM to 7:29 AM | 7 (6.9%) | 24 (23.5%) |
| 7:30 AM to 7:59 AM | 8 (7.8%) | 30 (29.4%) |
| 8:00 AM to 8:29 AM | 8 (7.8%) | 10 (9.8%) |
| 8:30 AM to 8:59 AM | 3 (2.9%) | 2 (2.0%) |
| 9:00 AM to 9:59 AM | 0 (0.0%) | 5 (4.9%) |
| 10:00 AM to 10:59 AM | 14 (13.7%) | 0 (0.0%) |
| 11:00 AM to 11:59 AM | 2 (2.0%) | 0 (0.0%) |
| 12:00 PM to 3:59 PM | 15 (14.7%) | 0 (0.0%) |
| 4:00 PM to 11:59 PM | 0 (0.0%) | 6 (5.9%) |
| Total | 102 (100.0%) | 102 (100.0%) |
Housing Occupancy in Wellsburg
Occupancy by Ownership in Wellsburg
Of the total 163 dwellings in Wellsburg, owner-occupied units account for 142 (87.1%), while renter-occupied units make up 21 (12.9%).
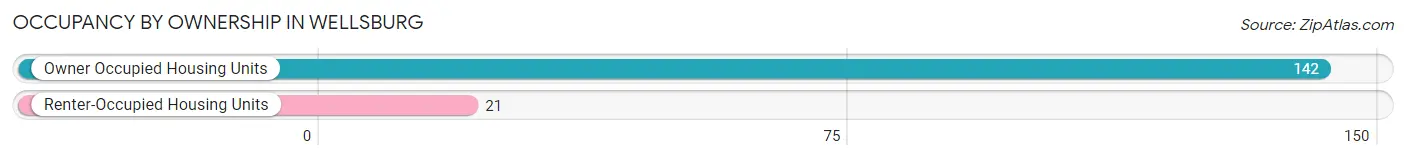
| Occupancy | # Housing Units | % Housing Units |
| Owner Occupied Housing Units | 142 | 87.1% |
| Renter-Occupied Housing Units | 21 | 12.9% |
| Total Occupied Housing Units | 163 | 100.0% |
Occupancy by Household Size in Wellsburg
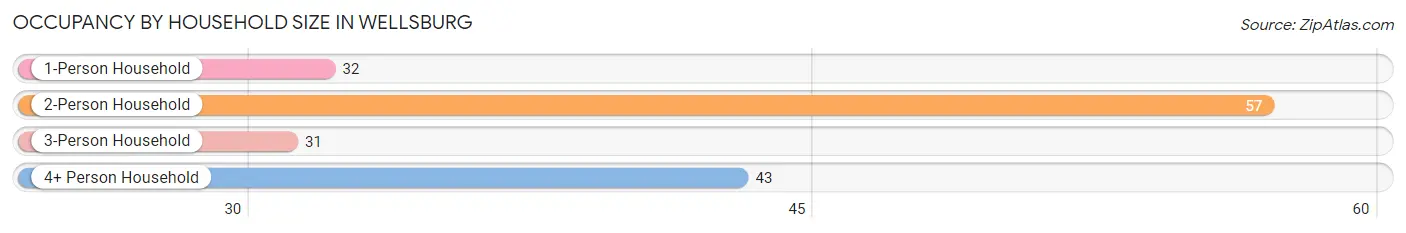
| Household Size | # Housing Units | % Housing Units |
| 1-Person Household | 32 | 19.6% |
| 2-Person Household | 57 | 35.0% |
| 3-Person Household | 31 | 19.0% |
| 4+ Person Household | 43 | 26.4% |
| Total Housing Units | 163 | 100.0% |
Occupancy by Ownership by Household Size in Wellsburg
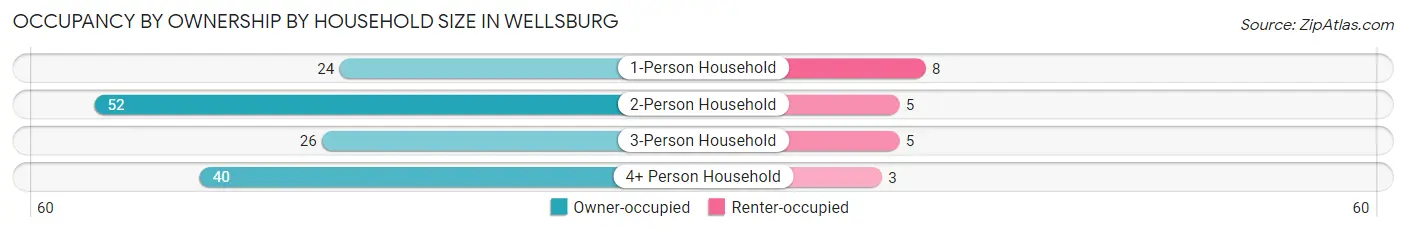
| Household Size | Owner-occupied | Renter-occupied |
| 1-Person Household | 24 (75.0%) | 8 (25.0%) |
| 2-Person Household | 52 (91.2%) | 5 (8.8%) |
| 3-Person Household | 26 (83.9%) | 5 (16.1%) |
| 4+ Person Household | 40 (93.0%) | 3 (7.0%) |
| Total Housing Units | 142 (87.1%) | 21 (12.9%) |
Occupancy by Educational Attainment in Wellsburg
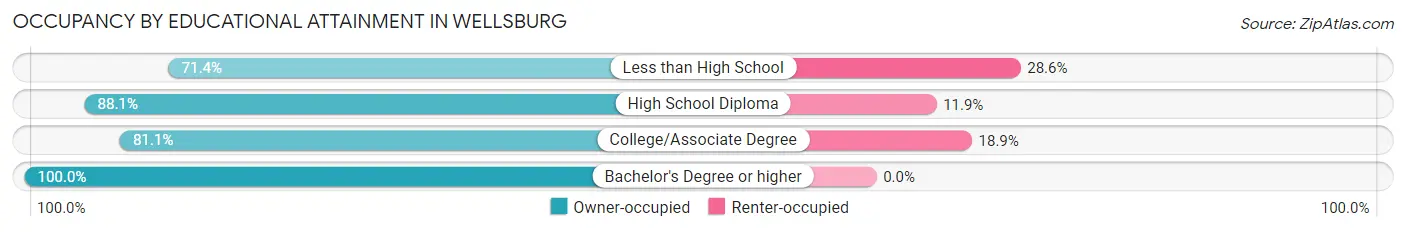
| Household Size | Owner-occupied | Renter-occupied |
| Less than High School | 10 (71.4%) | 4 (28.6%) |
| High School Diploma | 74 (88.1%) | 10 (11.9%) |
| College/Associate Degree | 30 (81.1%) | 7 (18.9%) |
| Bachelor's Degree or higher | 28 (100.0%) | 0 (0.0%) |
Occupancy by Age of Householder in Wellsburg
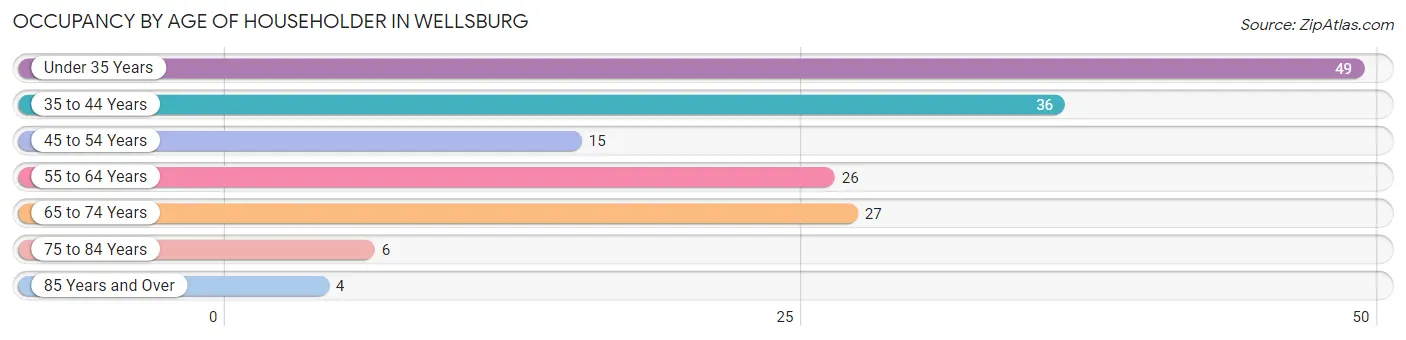
| Age Bracket | # Households | % Households |
| Under 35 Years | 49 | 30.1% |
| 35 to 44 Years | 36 | 22.1% |
| 45 to 54 Years | 15 | 9.2% |
| 55 to 64 Years | 26 | 16.0% |
| 65 to 74 Years | 27 | 16.6% |
| 75 to 84 Years | 6 | 3.7% |
| 85 Years and Over | 4 | 2.5% |
| Total | 163 | 100.0% |
Housing Finances in Wellsburg
Median Income by Occupancy in Wellsburg
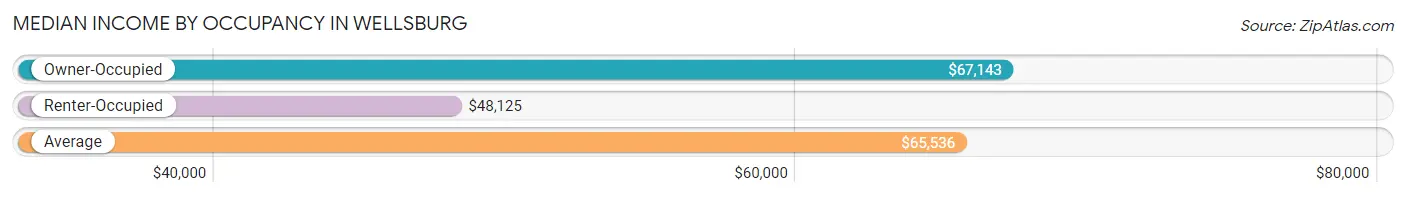
| Occupancy Type | # Households | Median Income |
| Owner-Occupied | 142 (87.1%) | $67,143 |
| Renter-Occupied | 21 (12.9%) | $48,125 |
| Average | 163 (100.0%) | $65,536 |
Occupancy by Householder Income Bracket in Wellsburg
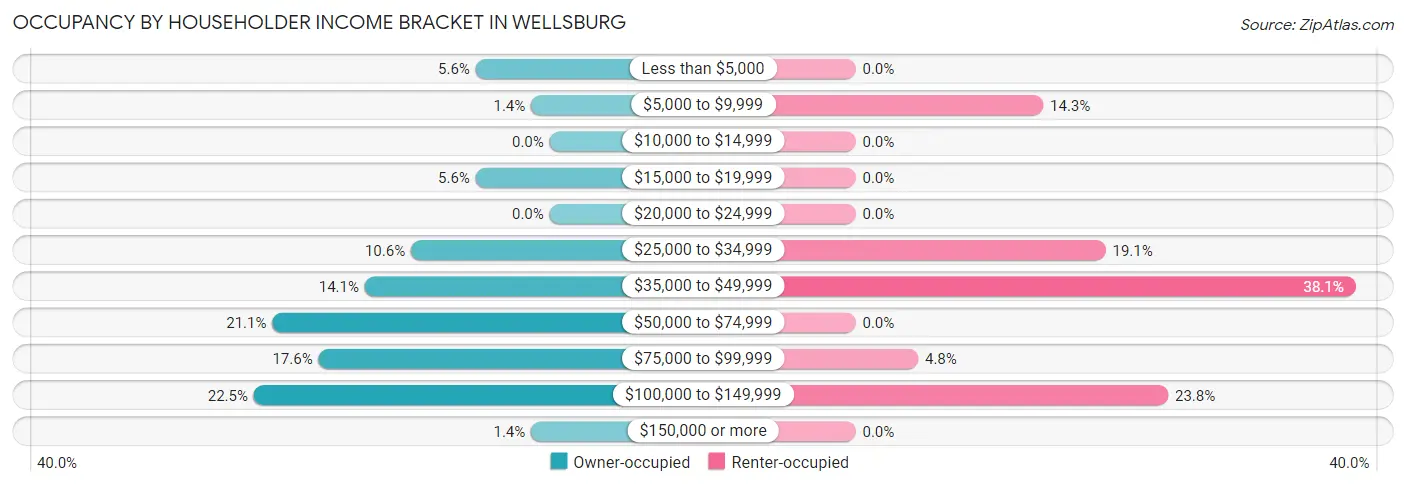
| Income Bracket | Owner-occupied | Renter-occupied |
| Less than $5,000 | 8 (5.6%) | 0 (0.0%) |
| $5,000 to $9,999 | 2 (1.4%) | 3 (14.3%) |
| $10,000 to $14,999 | 0 (0.0%) | 0 (0.0%) |
| $15,000 to $19,999 | 8 (5.6%) | 0 (0.0%) |
| $20,000 to $24,999 | 0 (0.0%) | 0 (0.0%) |
| $25,000 to $34,999 | 15 (10.6%) | 4 (19.1%) |
| $35,000 to $49,999 | 20 (14.1%) | 8 (38.1%) |
| $50,000 to $74,999 | 30 (21.1%) | 0 (0.0%) |
| $75,000 to $99,999 | 25 (17.6%) | 1 (4.8%) |
| $100,000 to $149,999 | 32 (22.5%) | 5 (23.8%) |
| $150,000 or more | 2 (1.4%) | 0 (0.0%) |
| Total | 142 (100.0%) | 21 (100.0%) |
Monthly Housing Cost Tiers in Wellsburg
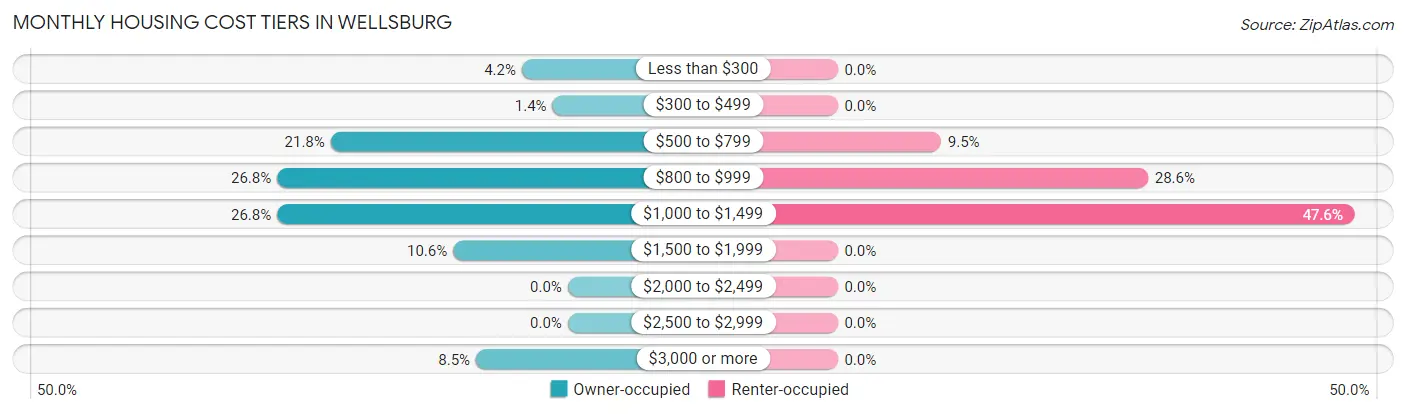
| Monthly Cost | Owner-occupied | Renter-occupied |
| Less than $300 | 6 (4.2%) | 0 (0.0%) |
| $300 to $499 | 2 (1.4%) | 0 (0.0%) |
| $500 to $799 | 31 (21.8%) | 2 (9.5%) |
| $800 to $999 | 38 (26.8%) | 6 (28.6%) |
| $1,000 to $1,499 | 38 (26.8%) | 10 (47.6%) |
| $1,500 to $1,999 | 15 (10.6%) | 0 (0.0%) |
| $2,000 to $2,499 | 0 (0.0%) | 0 (0.0%) |
| $2,500 to $2,999 | 0 (0.0%) | 0 (0.0%) |
| $3,000 or more | 12 (8.5%) | 0 (0.0%) |
| Total | 142 (100.0%) | 21 (100.0%) |
Physical Housing Characteristics in Wellsburg
Housing Structures in Wellsburg
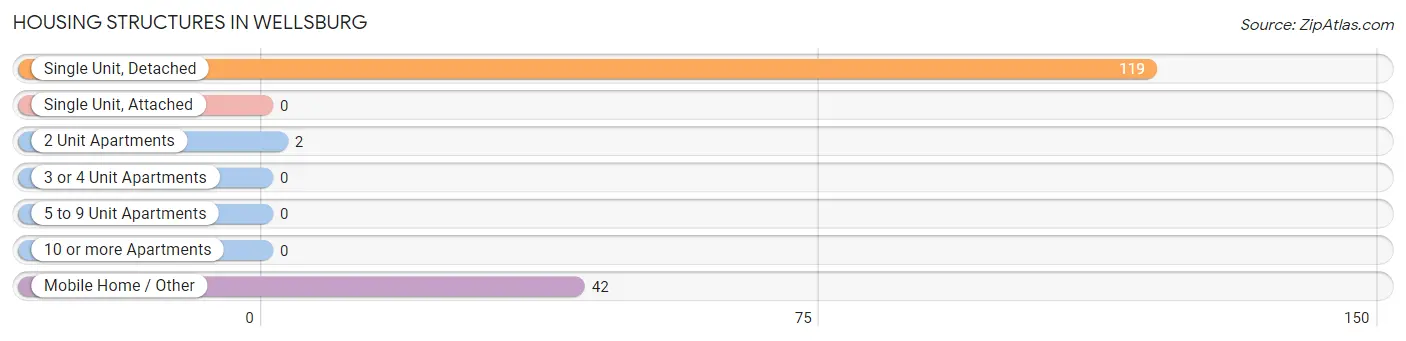
| Structure Type | # Housing Units | % Housing Units |
| Single Unit, Detached | 119 | 73.0% |
| Single Unit, Attached | 0 | 0.0% |
| 2 Unit Apartments | 2 | 1.2% |
| 3 or 4 Unit Apartments | 0 | 0.0% |
| 5 to 9 Unit Apartments | 0 | 0.0% |
| 10 or more Apartments | 0 | 0.0% |
| Mobile Home / Other | 42 | 25.8% |
| Total | 163 | 100.0% |
Housing Structures by Occupancy in Wellsburg
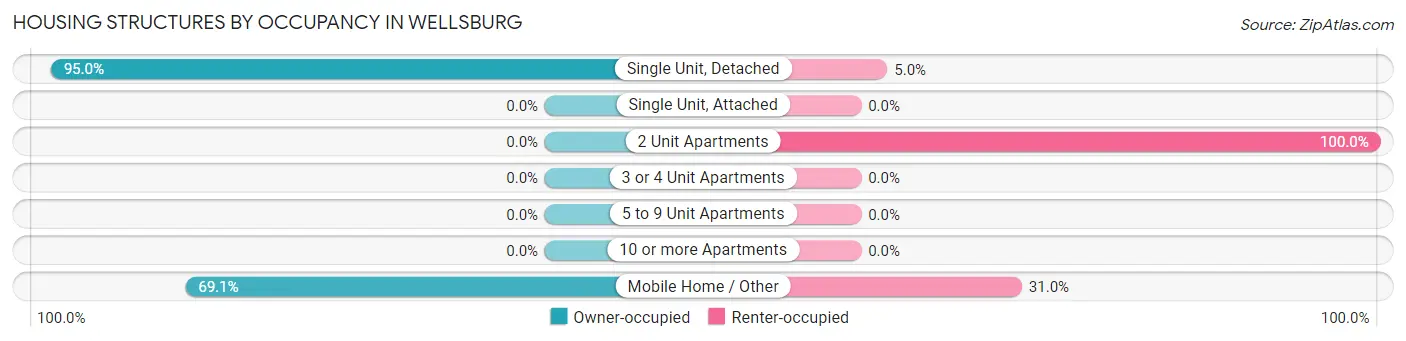
| Structure Type | Owner-occupied | Renter-occupied |
| Single Unit, Detached | 113 (95.0%) | 6 (5.0%) |
| Single Unit, Attached | 0 (0.0%) | 0 (0.0%) |
| 2 Unit Apartments | 0 (0.0%) | 2 (100.0%) |
| 3 or 4 Unit Apartments | 0 (0.0%) | 0 (0.0%) |
| 5 to 9 Unit Apartments | 0 (0.0%) | 0 (0.0%) |
| 10 or more Apartments | 0 (0.0%) | 0 (0.0%) |
| Mobile Home / Other | 29 (69.1%) | 13 (30.9%) |
| Total | 142 (87.1%) | 21 (12.9%) |
Housing Structures by Number of Rooms in Wellsburg
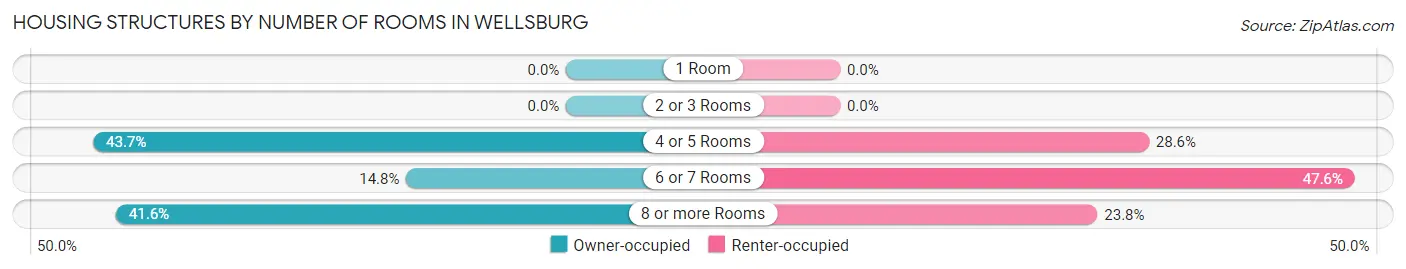
| Number of Rooms | Owner-occupied | Renter-occupied |
| 1 Room | 0 (0.0%) | 0 (0.0%) |
| 2 or 3 Rooms | 0 (0.0%) | 0 (0.0%) |
| 4 or 5 Rooms | 62 (43.7%) | 6 (28.6%) |
| 6 or 7 Rooms | 21 (14.8%) | 10 (47.6%) |
| 8 or more Rooms | 59 (41.5%) | 5 (23.8%) |
| Total | 142 (100.0%) | 21 (100.0%) |
Housing Structure by Heating Type in Wellsburg
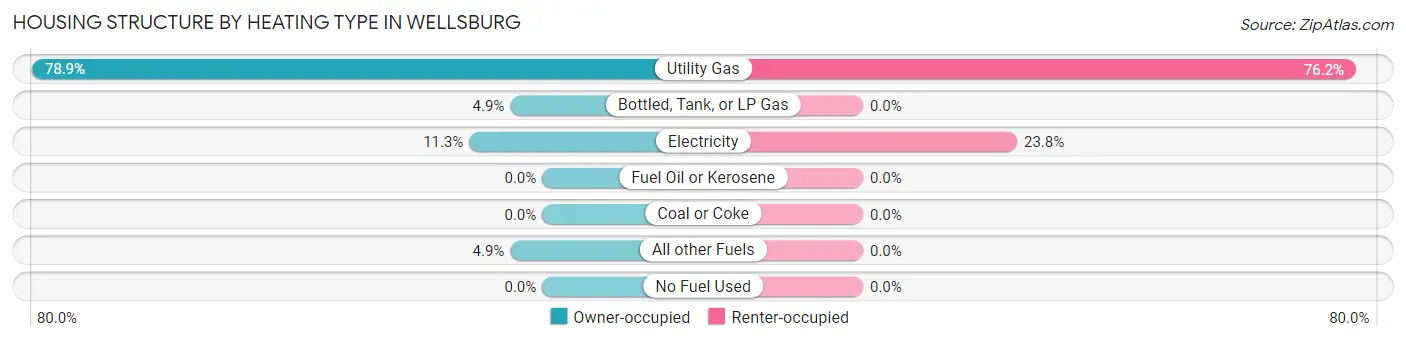
| Heating Type | Owner-occupied | Renter-occupied |
| Utility Gas | 112 (78.9%) | 16 (76.2%) |
| Bottled, Tank, or LP Gas | 7 (4.9%) | 0 (0.0%) |
| Electricity | 16 (11.3%) | 5 (23.8%) |
| Fuel Oil or Kerosene | 0 (0.0%) | 0 (0.0%) |
| Coal or Coke | 0 (0.0%) | 0 (0.0%) |
| All other Fuels | 7 (4.9%) | 0 (0.0%) |
| No Fuel Used | 0 (0.0%) | 0 (0.0%) |
| Total | 142 (100.0%) | 21 (100.0%) |
Household Vehicle Usage in Wellsburg
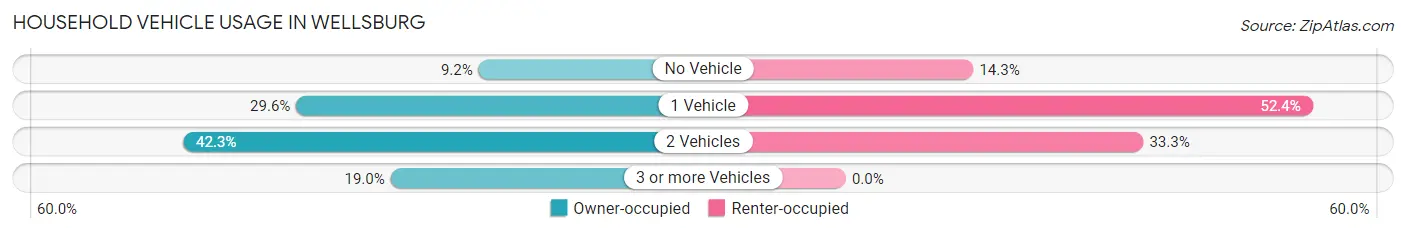
| Vehicles per Household | Owner-occupied | Renter-occupied |
| No Vehicle | 13 (9.1%) | 3 (14.3%) |
| 1 Vehicle | 42 (29.6%) | 11 (52.4%) |
| 2 Vehicles | 60 (42.2%) | 7 (33.3%) |
| 3 or more Vehicles | 27 (19.0%) | 0 (0.0%) |
| Total | 142 (100.0%) | 21 (100.0%) |
Real Estate & Mortgages in Wellsburg
Real Estate and Mortgage Overview in Wellsburg
| Characteristic | Without Mortgage | With Mortgage |
| Housing Units | 61 | 81 |
| Median Property Value | $81,500 | $126,300 |
| Median Household Income | $39,464 | $0 |
| Monthly Housing Costs | $688 | $12 |
| Real Estate Taxes | $3,767 | $23 |
Property Value by Mortgage Status in Wellsburg
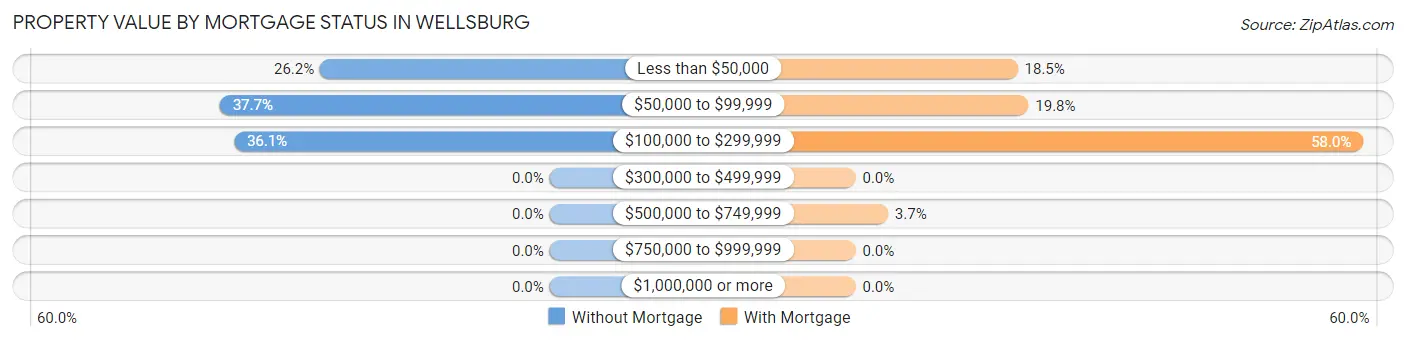
| Property Value | Without Mortgage | With Mortgage |
| Less than $50,000 | 16 (26.2%) | 15 (18.5%) |
| $50,000 to $99,999 | 23 (37.7%) | 16 (19.8%) |
| $100,000 to $299,999 | 22 (36.1%) | 47 (58.0%) |
| $300,000 to $499,999 | 0 (0.0%) | 0 (0.0%) |
| $500,000 to $749,999 | 0 (0.0%) | 3 (3.7%) |
| $750,000 to $999,999 | 0 (0.0%) | 0 (0.0%) |
| $1,000,000 or more | 0 (0.0%) | 0 (0.0%) |
| Total | 61 (100.0%) | 81 (100.0%) |
Household Income by Mortgage Status in Wellsburg
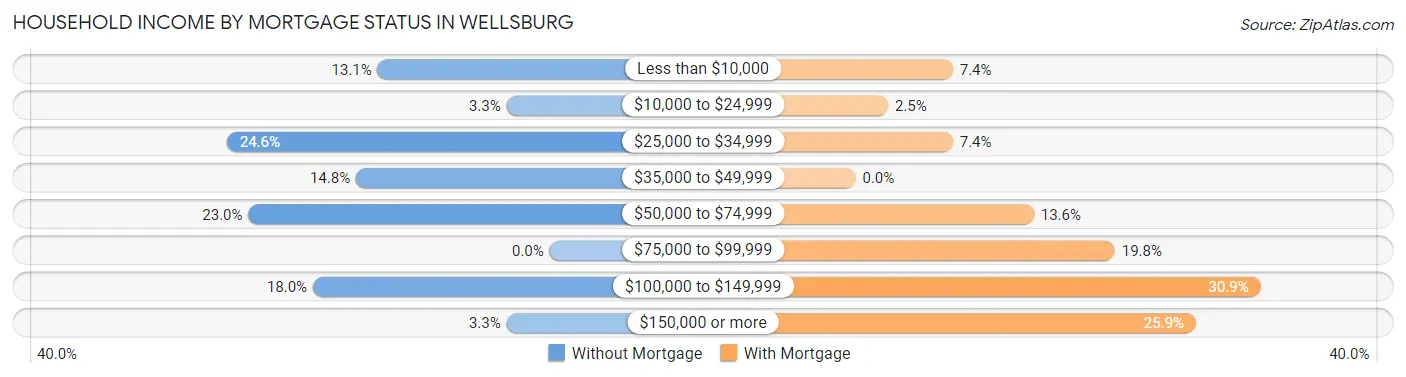
| Household Income | Without Mortgage | With Mortgage |
| Less than $10,000 | 8 (13.1%) | 6 (7.4%) |
| $10,000 to $24,999 | 2 (3.3%) | 2 (2.5%) |
| $25,000 to $34,999 | 15 (24.6%) | 6 (7.4%) |
| $35,000 to $49,999 | 9 (14.7%) | 0 (0.0%) |
| $50,000 to $74,999 | 14 (23.0%) | 11 (13.6%) |
| $75,000 to $99,999 | 0 (0.0%) | 16 (19.8%) |
| $100,000 to $149,999 | 11 (18.0%) | 25 (30.9%) |
| $150,000 or more | 2 (3.3%) | 21 (25.9%) |
| Total | 61 (100.0%) | 81 (100.0%) |
Property Value to Household Income Ratio in Wellsburg
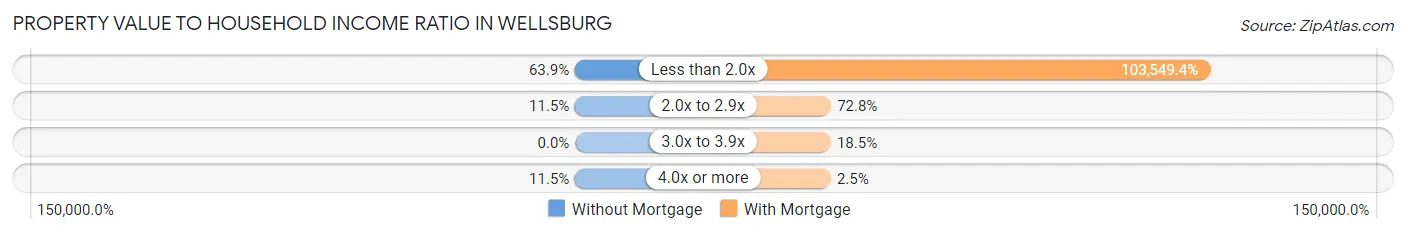
| Value-to-Income Ratio | Without Mortgage | With Mortgage |
| Less than 2.0x | 39 (63.9%) | 83,875 (103,549.4%) |
| 2.0x to 2.9x | 7 (11.5%) | 59 (72.8%) |
| 3.0x to 3.9x | 0 (0.0%) | 15 (18.5%) |
| 4.0x or more | 7 (11.5%) | 2 (2.5%) |
| Total | 61 (100.0%) | 81 (100.0%) |
Real Estate Taxes by Mortgage Status in Wellsburg
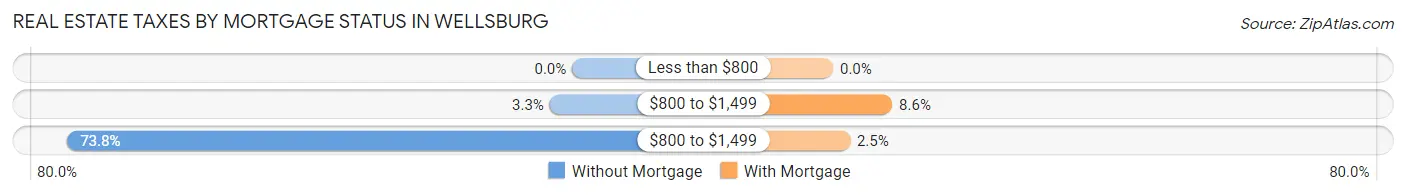
| Property Taxes | Without Mortgage | With Mortgage |
| Less than $800 | 0 (0.0%) | 0 (0.0%) |
| $800 to $1,499 | 2 (3.3%) | 7 (8.6%) |
| $800 to $1,499 | 45 (73.8%) | 2 (2.5%) |
| Total | 61 (100.0%) | 81 (100.0%) |
Health & Disability in Wellsburg
Health Insurance Coverage by Age in Wellsburg
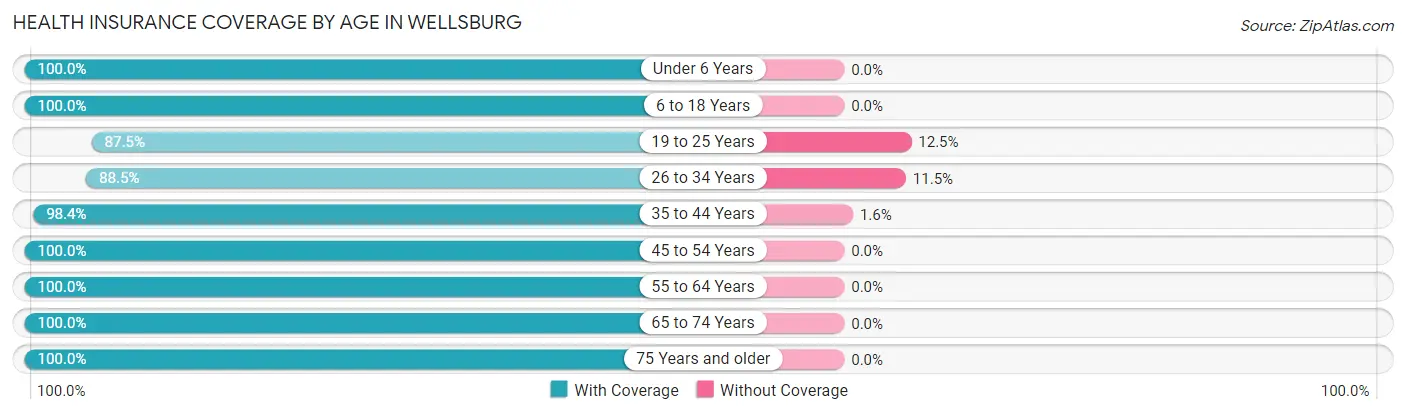
| Age Bracket | With Coverage | Without Coverage |
| Under 6 Years | 58 (100.0%) | 0 (0.0%) |
| 6 to 18 Years | 38 (100.0%) | 0 (0.0%) |
| 19 to 25 Years | 49 (87.5%) | 7 (12.5%) |
| 26 to 34 Years | 77 (88.5%) | 10 (11.5%) |
| 35 to 44 Years | 61 (98.4%) | 1 (1.6%) |
| 45 to 54 Years | 44 (100.0%) | 0 (0.0%) |
| 55 to 64 Years | 35 (100.0%) | 0 (0.0%) |
| 65 to 74 Years | 37 (100.0%) | 0 (0.0%) |
| 75 Years and older | 23 (100.0%) | 0 (0.0%) |
| Total | 422 (95.9%) | 18 (4.1%) |
Health Insurance Coverage by Citizenship Status in Wellsburg
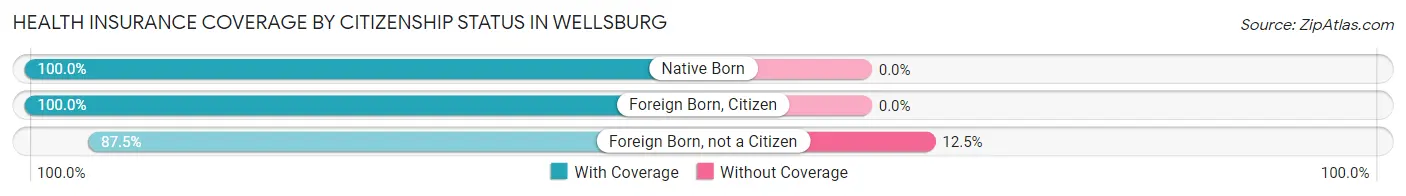
| Citizenship Status | With Coverage | Without Coverage |
| Native Born | 58 (100.0%) | 0 (0.0%) |
| Foreign Born, Citizen | 38 (100.0%) | 0 (0.0%) |
| Foreign Born, not a Citizen | 49 (87.5%) | 7 (12.5%) |
Health Insurance Coverage by Household Income in Wellsburg
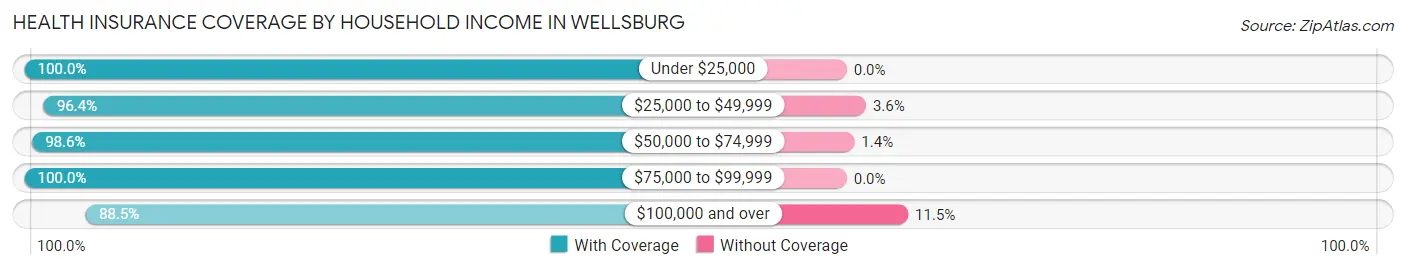
| Household Income | With Coverage | Without Coverage |
| Under $25,000 | 35 (100.0%) | 0 (0.0%) |
| $25,000 to $49,999 | 107 (96.4%) | 4 (3.6%) |
| $50,000 to $74,999 | 69 (98.6%) | 1 (1.4%) |
| $75,000 to $99,999 | 101 (100.0%) | 0 (0.0%) |
| $100,000 and over | 100 (88.5%) | 13 (11.5%) |
Public vs Private Health Insurance Coverage by Age in Wellsburg
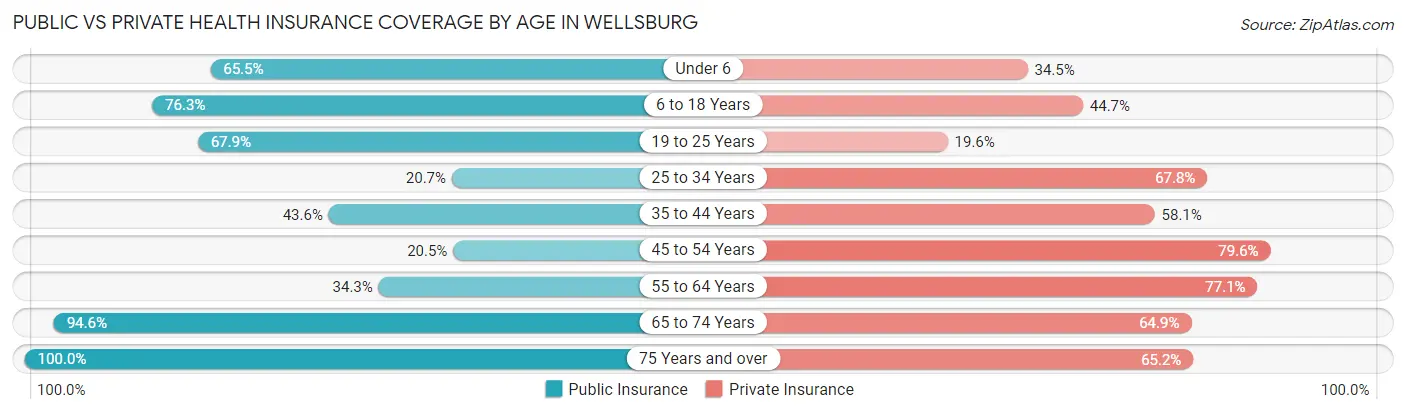
| Age Bracket | Public Insurance | Private Insurance |
| Under 6 | 38 (65.5%) | 20 (34.5%) |
| 6 to 18 Years | 29 (76.3%) | 17 (44.7%) |
| 19 to 25 Years | 38 (67.9%) | 11 (19.6%) |
| 25 to 34 Years | 18 (20.7%) | 59 (67.8%) |
| 35 to 44 Years | 27 (43.5%) | 36 (58.1%) |
| 45 to 54 Years | 9 (20.4%) | 35 (79.5%) |
| 55 to 64 Years | 12 (34.3%) | 27 (77.1%) |
| 65 to 74 Years | 35 (94.6%) | 24 (64.9%) |
| 75 Years and over | 23 (100.0%) | 15 (65.2%) |
| Total | 229 (52.0%) | 244 (55.4%) |
Disability Status by Sex by Age in Wellsburg
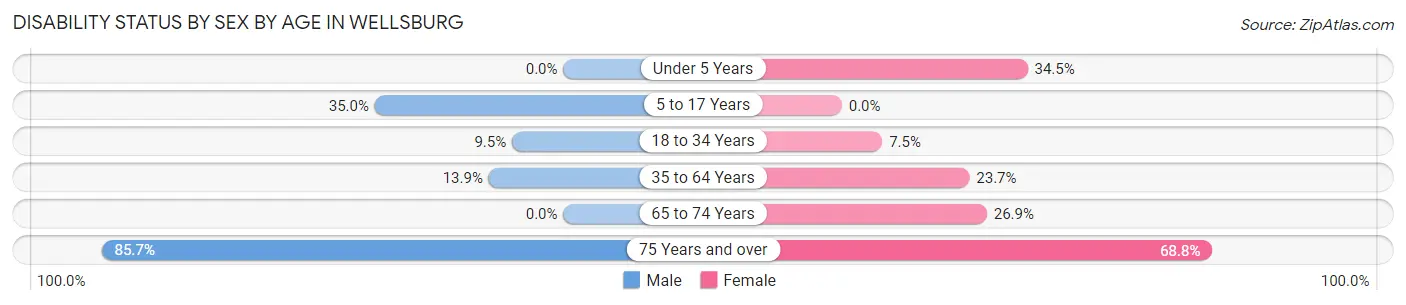
| Age Bracket | Male | Female |
| Under 5 Years | 0 (0.0%) | 10 (34.5%) |
| 5 to 17 Years | 14 (35.0%) | 0 (0.0%) |
| 18 to 34 Years | 6 (9.5%) | 6 (7.5%) |
| 35 to 64 Years | 9 (13.9%) | 18 (23.7%) |
| 65 to 74 Years | 0 (0.0%) | 7 (26.9%) |
| 75 Years and over | 6 (85.7%) | 11 (68.8%) |
Disability Class by Sex by Age in Wellsburg
Disability Class: Hearing Difficulty
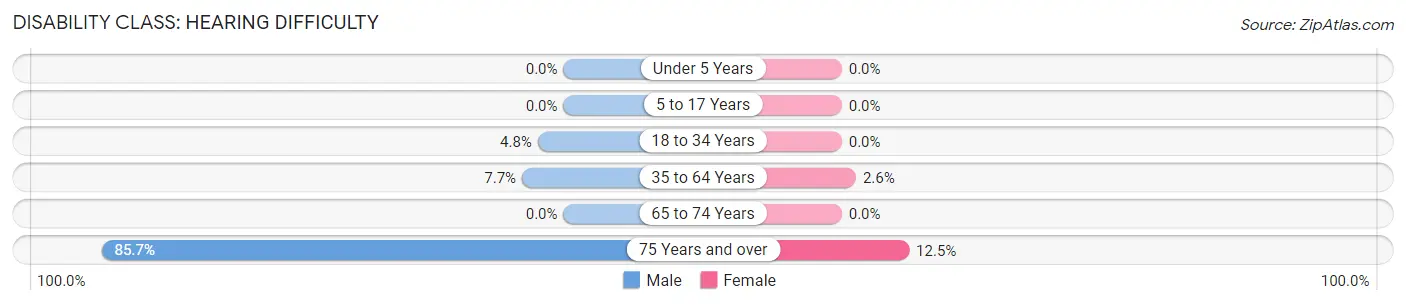
| Age Bracket | Male | Female |
| Under 5 Years | 0 (0.0%) | 0 (0.0%) |
| 5 to 17 Years | 0 (0.0%) | 0 (0.0%) |
| 18 to 34 Years | 3 (4.8%) | 0 (0.0%) |
| 35 to 64 Years | 5 (7.7%) | 2 (2.6%) |
| 65 to 74 Years | 0 (0.0%) | 0 (0.0%) |
| 75 Years and over | 6 (85.7%) | 2 (12.5%) |
Disability Class: Vision Difficulty
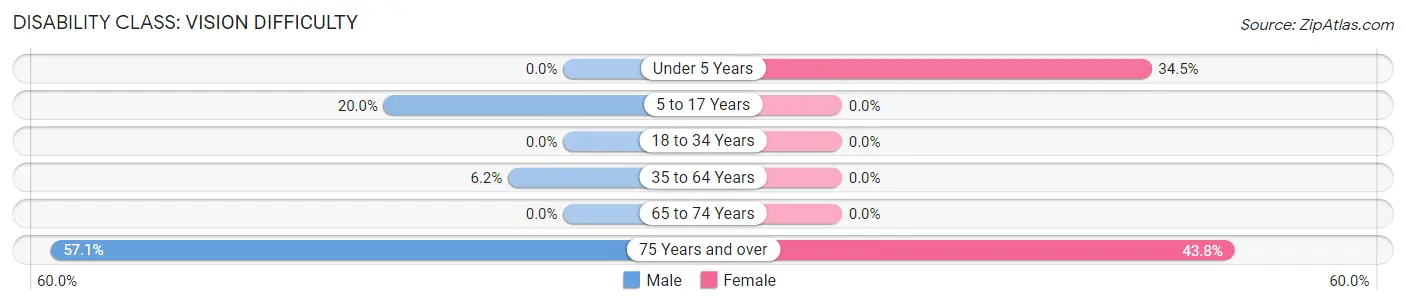
| Age Bracket | Male | Female |
| Under 5 Years | 0 (0.0%) | 10 (34.5%) |
| 5 to 17 Years | 8 (20.0%) | 0 (0.0%) |
| 18 to 34 Years | 0 (0.0%) | 0 (0.0%) |
| 35 to 64 Years | 4 (6.1%) | 0 (0.0%) |
| 65 to 74 Years | 0 (0.0%) | 0 (0.0%) |
| 75 Years and over | 4 (57.1%) | 7 (43.8%) |
Disability Class: Cognitive Difficulty
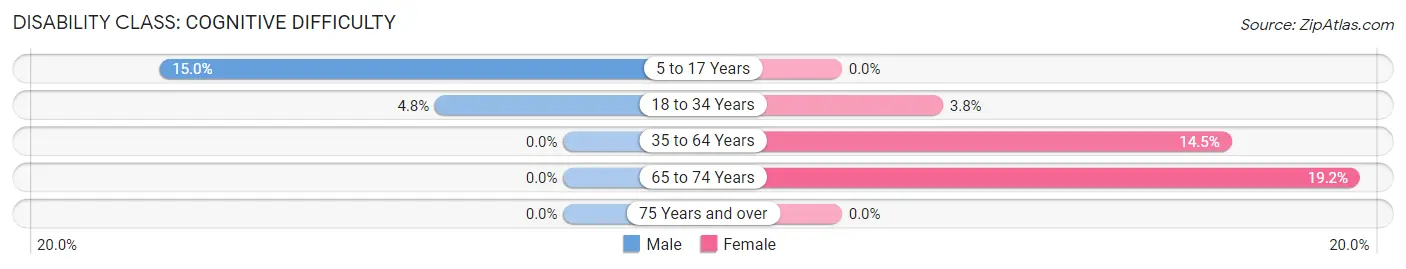
| Age Bracket | Male | Female |
| 5 to 17 Years | 6 (15.0%) | 0 (0.0%) |
| 18 to 34 Years | 3 (4.8%) | 3 (3.7%) |
| 35 to 64 Years | 0 (0.0%) | 11 (14.5%) |
| 65 to 74 Years | 0 (0.0%) | 5 (19.2%) |
| 75 Years and over | 0 (0.0%) | 0 (0.0%) |
Disability Class: Ambulatory Difficulty
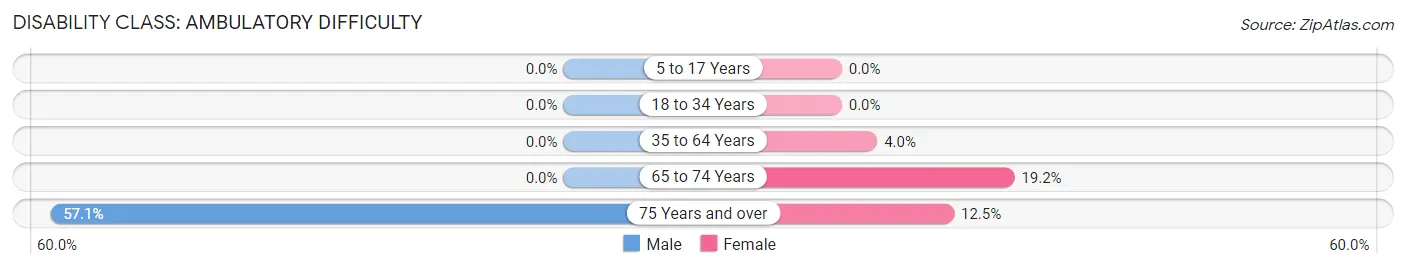
| Age Bracket | Male | Female |
| 5 to 17 Years | 0 (0.0%) | 0 (0.0%) |
| 18 to 34 Years | 0 (0.0%) | 0 (0.0%) |
| 35 to 64 Years | 0 (0.0%) | 3 (4.0%) |
| 65 to 74 Years | 0 (0.0%) | 5 (19.2%) |
| 75 Years and over | 4 (57.1%) | 2 (12.5%) |
Disability Class: Self-Care Difficulty
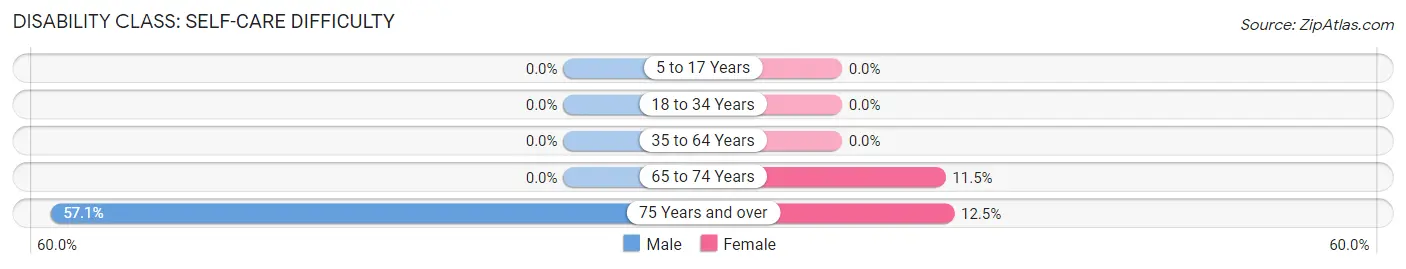
| Age Bracket | Male | Female |
| 5 to 17 Years | 0 (0.0%) | 0 (0.0%) |
| 18 to 34 Years | 0 (0.0%) | 0 (0.0%) |
| 35 to 64 Years | 0 (0.0%) | 0 (0.0%) |
| 65 to 74 Years | 0 (0.0%) | 3 (11.5%) |
| 75 Years and over | 4 (57.1%) | 2 (12.5%) |
Technology Access in Wellsburg
Computing Device Access in Wellsburg
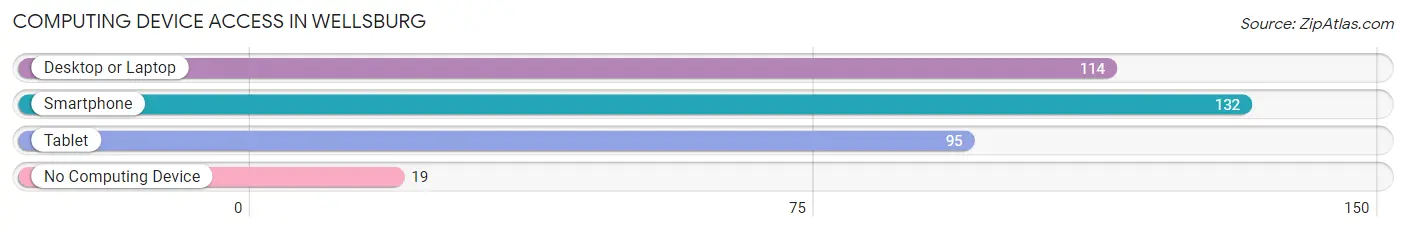
| Device Type | # Households | % Households |
| Desktop or Laptop | 114 | 69.9% |
| Smartphone | 132 | 81.0% |
| Tablet | 95 | 58.3% |
| No Computing Device | 19 | 11.7% |
| Total | 163 | 100.0% |
Internet Access in Wellsburg
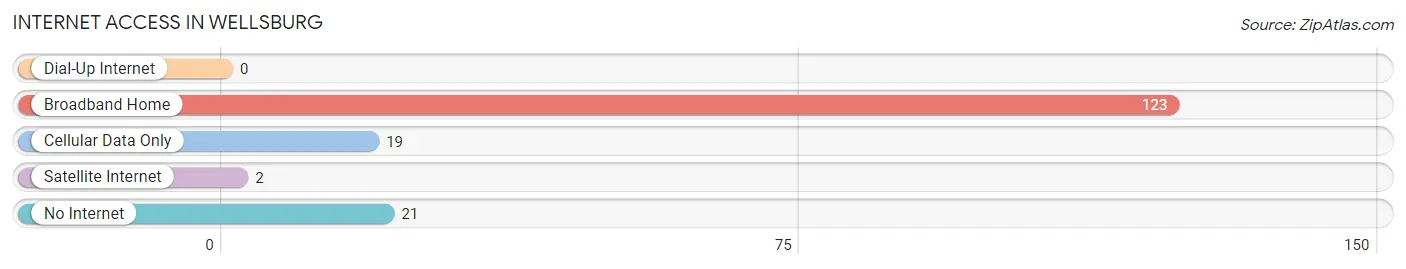
| Internet Type | # Households | % Households |
| Dial-Up Internet | 0 | 0.0% |
| Broadband Home | 123 | 75.5% |
| Cellular Data Only | 19 | 11.7% |
| Satellite Internet | 2 | 1.2% |
| No Internet | 21 | 12.9% |
| Total | 163 | 100.0% |
Wellsburg Summary
Wellsburg, NY is a small town located in the southern part of New York State, in the Finger Lakes region. It is situated in the town of Wellsburg, in Chemung County, and is part of the Elmira-Corning Metropolitan Statistical Area. The town has a population of approximately 1,000 people, and is home to a variety of businesses, including a winery, a brewery, and a cheese factory.
History
Wellsburg was first settled in 1790 by a group of settlers from Connecticut. The town was originally known as “Wellsborough”, and was named after the Wells family, who were among the first settlers. The town was officially incorporated in 1824, and the name was changed to “Wellsburg”.
In the early 19th century, Wellsburg was a thriving agricultural community, with a variety of crops being grown, including wheat, corn, and potatoes. The town also had a number of mills, including a grist mill, a saw mill, and a woolen mill.
In the late 19th century, Wellsburg began to experience a decline in its agricultural industry, as the area’s soil became depleted. This led to a shift in the town’s economy, as many of the residents began to look for other sources of income. This included the establishment of a number of small businesses, such as a cheese factory, a winery, and a brewery.
Geography
Wellsburg is located in the Finger Lakes region of New York State, in the town of Wellsburg, in Chemung County. The town is situated on the banks of the Chemung River, and is surrounded by rolling hills and forests. The town is located approximately 25 miles south of Elmira, and is part of the Elmira-Corning Metropolitan Statistical Area.
The town has a total area of 1.2 square miles, all of which is land. The town has a humid continental climate, with cold winters and warm summers. The average annual temperature is around 50 degrees Fahrenheit, and the average annual precipitation is around 40 inches.
Economy
The economy of Wellsburg is largely based on agriculture and tourism. The town is home to a number of small businesses, including a winery, a brewery, and a cheese factory. The town also has a number of small shops and restaurants, as well as a few bed and breakfasts.
The town is also home to a number of small manufacturing companies, including a furniture factory and a metal fabrication plant. The town is also home to a number of small farms, which produce a variety of crops, including wheat, corn, and potatoes.
Demographics
As of the 2010 census, the population of Wellsburg was 1,000 people. The racial makeup of the town was 97.2% White, 0.7% African American, 0.2% Native American, 0.2% Asian, 0.2% from other races, and 1.7% from two or more races. Hispanic or Latino of any race were 1.2% of the population.
The median income for a household in the town was $37,500, and the median income for a family was $45,000. The per capita income for the town was $19,000. About 10.2% of families and 12.2% of the population were below the poverty line, including 16.7% of those under age 18 and 8.3% of those age 65 or over.
Common Questions
What is Per Capita Income in Wellsburg?
Per Capita income in Wellsburg is $26,584.
What is the Median Family Income in Wellsburg?
Median Family Income in Wellsburg is $58,750.
What is the Median Household income in Wellsburg?
Median Household Income in Wellsburg is $65,536.
What is Income or Wage Gap in Wellsburg?
Income or Wage Gap in Wellsburg is 43.1%.
Women in Wellsburg earn 56.9 cents for every dollar earned by a man.
What is Inequality or Gini Index in Wellsburg?
Inequality or Gini Index in Wellsburg is 0.36.
What is the Total Population of Wellsburg?
Total Population of Wellsburg is 440.
What is the Total Male Population of Wellsburg?
Total Male Population of Wellsburg is 209.
What is the Total Female Population of Wellsburg?
Total Female Population of Wellsburg is 231.
What is the Ratio of Males per 100 Females in Wellsburg?
There are 90.48 Males per 100 Females in Wellsburg.
What is the Ratio of Females per 100 Males in Wellsburg?
There are 110.53 Females per 100 Males in Wellsburg.
What is the Median Population Age in Wellsburg?
Median Population Age in Wellsburg is 30.0 Years.
What is the Average Family Size in Wellsburg
Average Family Size in Wellsburg is 2.9 People.
What is the Average Household Size in Wellsburg
Average Household Size in Wellsburg is 2.6 People.
How Large is the Labor Force in Wellsburg?
There are 233 People in the Labor Forcein in Wellsburg.
What is the Percentage of People in the Labor Force in Wellsburg?
67.7% of People are in the Labor Force in Wellsburg.
What is the Unemployment Rate in Wellsburg?
Unemployment Rate in Wellsburg is 7.3%.