Warsaw, NY Map & Demographics
Warsaw Map
Warsaw Overview
$30,132
PER CAPITA INCOME
$74,545
AVG FAMILY INCOME
$50,000
AVG HOUSEHOLD INCOME
12.7%
WAGE / INCOME GAP [ % ]
87.3¢/ $1
WAGE / INCOME GAP [ $ ]
0.41
INEQUALITY / GINI INDEX
2,937
TOTAL POPULATION
1,229
MALE POPULATION
1,708
FEMALE POPULATION
71.96
MALES / 100 FEMALES
138.97
FEMALES / 100 MALES
52.6
MEDIAN AGE
2.5
AVG FAMILY SIZE
1.9
AVG HOUSEHOLD SIZE
1,331
LABOR FORCE [ PEOPLE ]
51.6%
PERCENT IN LABOR FORCE
8.8%
UNEMPLOYMENT RATE
Warsaw Zip Codes
Warsaw Area Codes
Income in Warsaw
Income Overview in Warsaw
Per Capita Income in Warsaw is $30,132, while median incomes of families and households are $74,545 and $50,000 respectively.
| Characteristic | Number | Measure |
| Per Capita Income | 2,937 | $30,132 |
| Median Family Income | 764 | $74,545 |
| Mean Family Income | 764 | $73,105 |
| Median Household Income | 1,426 | $50,000 |
| Mean Household Income | 1,426 | $62,352 |
| Income Deficit | 764 | $0 |
| Wage / Income Gap (%) | 2,937 | 12.75% |
| Wage / Income Gap ($) | 2,937 | 87.25¢ per $1 |
| Gini / Inequality Index | 2,937 | 0.41 |
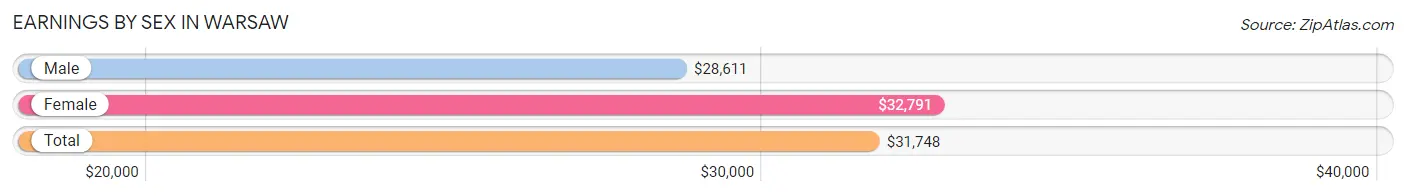
Earnings by Sex in Warsaw
Average Earnings in Warsaw are $31,748, $28,611 for men and $32,791 for women, a difference of 12.8%.
| Sex | Number | Average Earnings |
| Male | 592 (42.2%) | $28,611 |
| Female | 812 (57.8%) | $32,791 |
| Total | 1,404 (100.0%) | $31,748 |
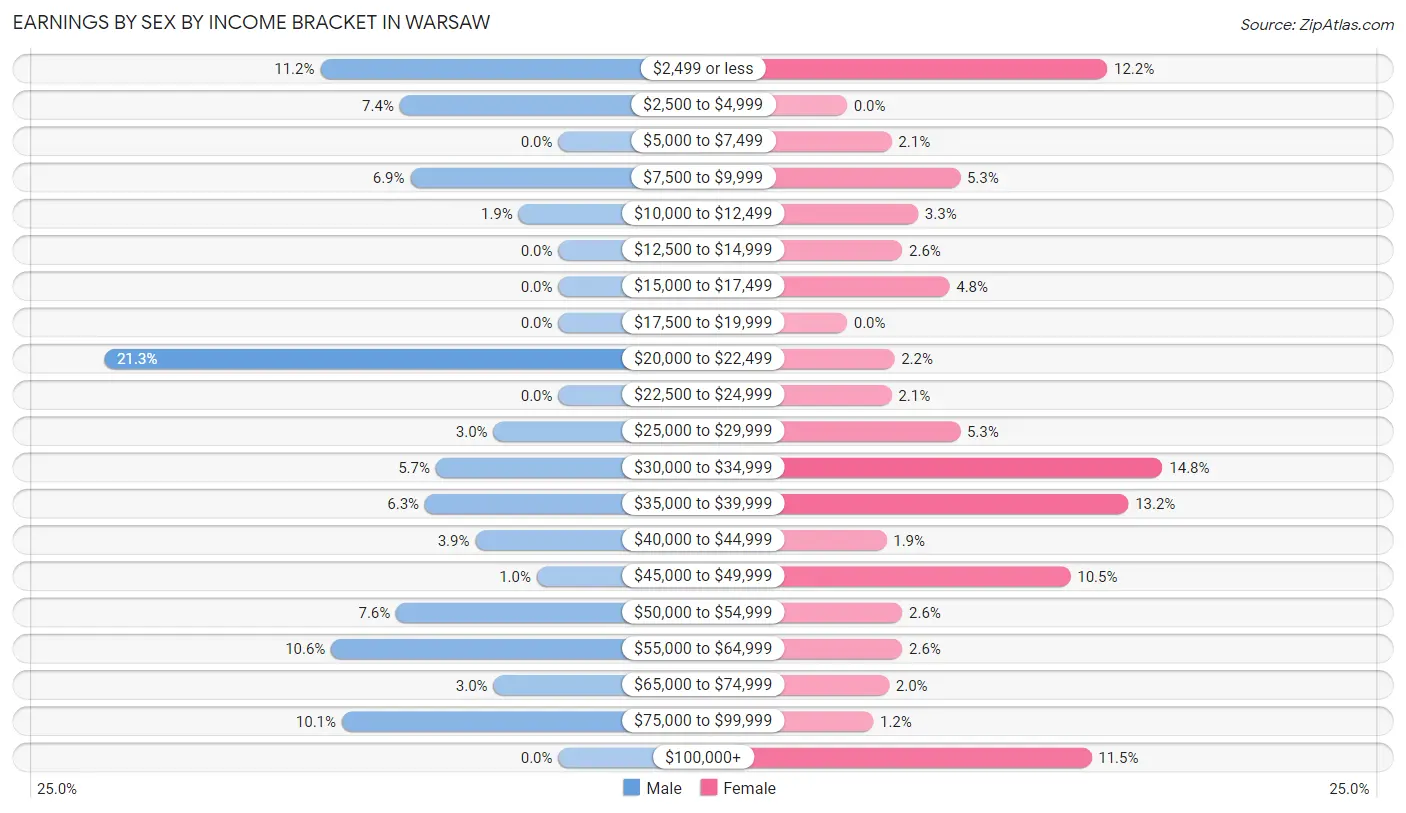
Earnings by Sex by Income Bracket in Warsaw
The most common earnings brackets in Warsaw are $20,000 to $22,499 for men (126 | 21.3%) and $30,000 to $34,999 for women (120 | 14.8%).
| Income | Male | Female |
| $2,499 or less | 66 (11.2%) | 99 (12.2%) |
| $2,500 to $4,999 | 44 (7.4%) | 0 (0.0%) |
| $5,000 to $7,499 | 0 (0.0%) | 17 (2.1%) |
| $7,500 to $9,999 | 41 (6.9%) | 43 (5.3%) |
| $10,000 to $12,499 | 11 (1.9%) | 27 (3.3%) |
| $12,500 to $14,999 | 0 (0.0%) | 21 (2.6%) |
| $15,000 to $17,499 | 0 (0.0%) | 39 (4.8%) |
| $17,500 to $19,999 | 0 (0.0%) | 0 (0.0%) |
| $20,000 to $22,499 | 126 (21.3%) | 18 (2.2%) |
| $22,500 to $24,999 | 0 (0.0%) | 17 (2.1%) |
| $25,000 to $29,999 | 18 (3.0%) | 43 (5.3%) |
| $30,000 to $34,999 | 34 (5.7%) | 120 (14.8%) |
| $35,000 to $39,999 | 37 (6.2%) | 107 (13.2%) |
| $40,000 to $44,999 | 23 (3.9%) | 15 (1.8%) |
| $45,000 to $49,999 | 6 (1.0%) | 85 (10.5%) |
| $50,000 to $54,999 | 45 (7.6%) | 21 (2.6%) |
| $55,000 to $64,999 | 63 (10.6%) | 21 (2.6%) |
| $65,000 to $74,999 | 18 (3.0%) | 16 (2.0%) |
| $75,000 to $99,999 | 60 (10.1%) | 10 (1.2%) |
| $100,000+ | 0 (0.0%) | 93 (11.5%) |
| Total | 592 (100.0%) | 812 (100.0%) |
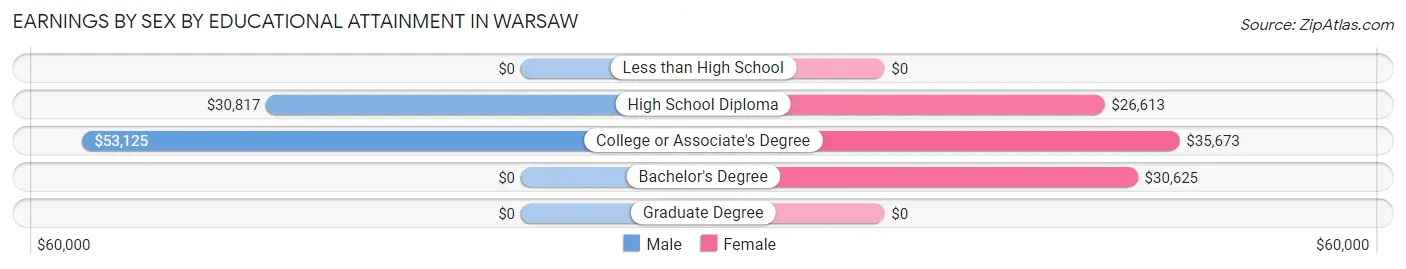
Earnings by Sex by Educational Attainment in Warsaw
Average earnings in Warsaw are $39,393 for men and $35,016 for women, a difference of 11.1%. Men with an educational attainment of college or associate's degree enjoy the highest average annual earnings of $53,125, while those with high school diploma education earn the least with $30,817. Women with an educational attainment of college or associate's degree earn the most with the average annual earnings of $35,673, while those with high school diploma education have the smallest earnings of $26,613.
| Educational Attainment | Male Income | Female Income |
| Less than High School | - | - |
| High School Diploma | $30,817 | $26,613 |
| College or Associate's Degree | $53,125 | $35,673 |
| Bachelor's Degree | - | - |
| Graduate Degree | - | - |
| Total | $39,393 | $35,016 |
Family Income in Warsaw
Family Income Brackets in Warsaw
According to the Warsaw family income data, there are 202 families falling into the $75,000 to $99,999 income range, which is the most common income bracket and makes up 26.4% of all families.
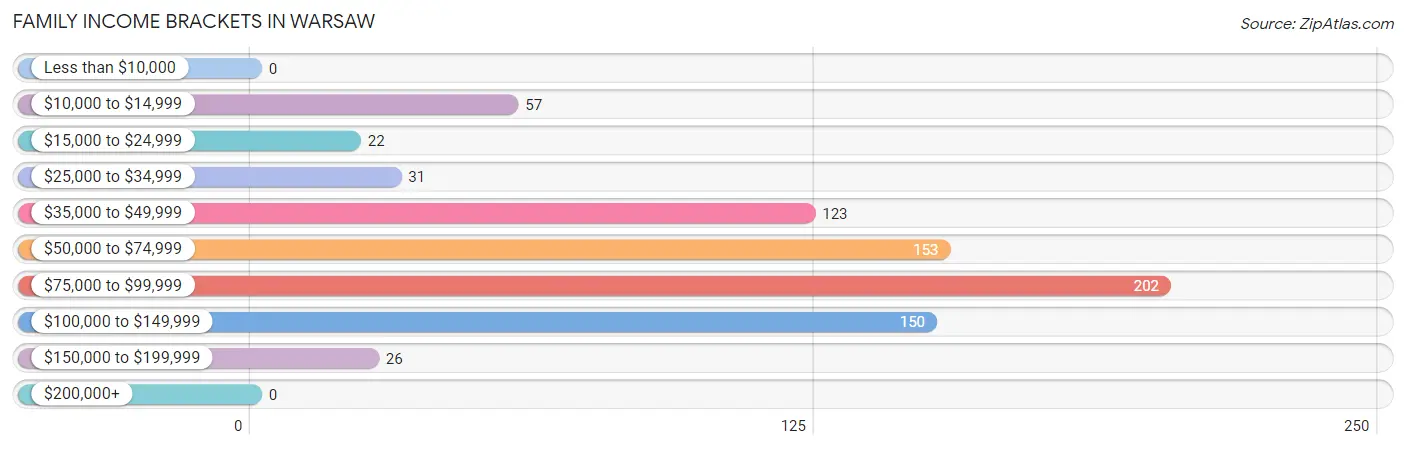
| Income Bracket | # Families | % Families |
| Less than $10,000 | 0 | 0.0% |
| $10,000 to $14,999 | 57 | 7.5% |
| $15,000 to $24,999 | 22 | 2.9% |
| $25,000 to $34,999 | 31 | 4.1% |
| $35,000 to $49,999 | 123 | 16.1% |
| $50,000 to $74,999 | 153 | 20.0% |
| $75,000 to $99,999 | 202 | 26.4% |
| $100,000 to $149,999 | 150 | 19.6% |
| $150,000 to $199,999 | 26 | 3.4% |
| $200,000+ | 0 | 0.0% |
Family Income by Famaliy Size in Warsaw
2-person families (544 | 71.2%) account for the highest median family income in Warsaw with $75,427 per family, while 2-person families (544 | 71.2%) have the highest median income of $37,714 per family member.
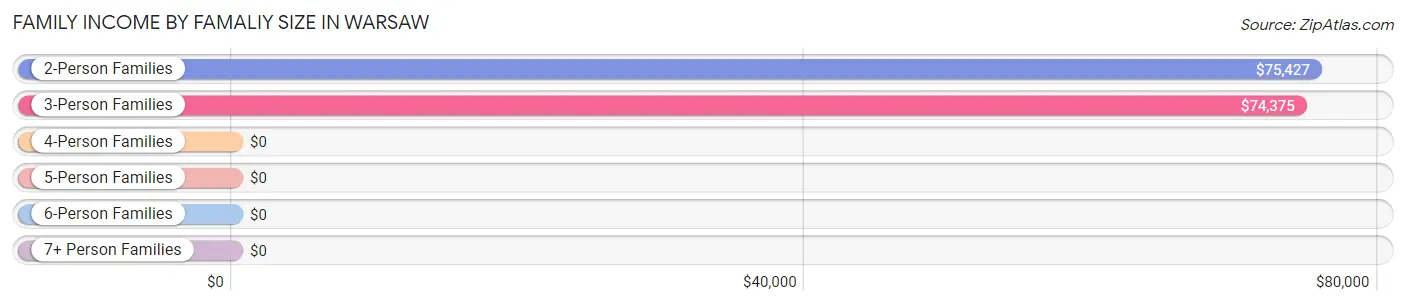
| Income Bracket | # Families | Median Income |
| 2-Person Families | 544 (71.2%) | $75,427 |
| 3-Person Families | 59 (7.7%) | $74,375 |
| 4-Person Families | 143 (18.7%) | $0 |
| 5-Person Families | 18 (2.4%) | $0 |
| 6-Person Families | 0 (0.0%) | $0 |
| 7+ Person Families | 0 (0.0%) | $0 |
| Total | 764 (100.0%) | $74,545 |
Family Income by Number of Earners in Warsaw
The median family income in Warsaw is $74,545, with families comprising 3+ earners (35) having the highest median family income of $157,125, while families with 1 earner (194) have the lowest median family income of $50,000, accounting for 4.6% and 25.4% of families, respectively.
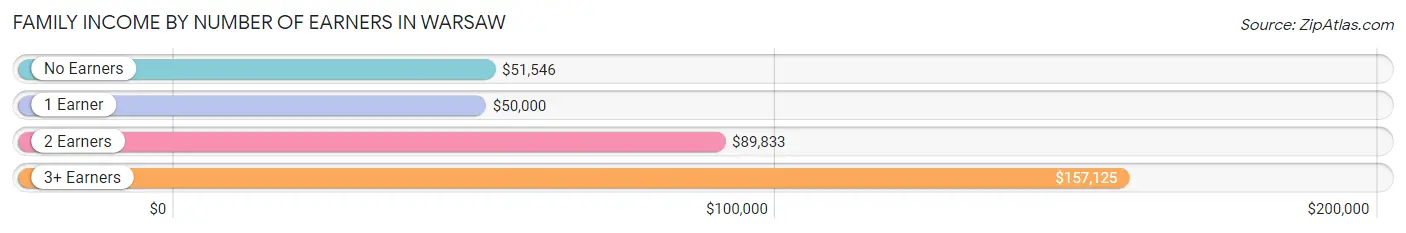
| Number of Earners | # Families | Median Income |
| No Earners | 253 (33.1%) | $51,546 |
| 1 Earner | 194 (25.4%) | $50,000 |
| 2 Earners | 282 (36.9%) | $89,833 |
| 3+ Earners | 35 (4.6%) | $157,125 |
| Total | 764 (100.0%) | $74,545 |
Household Income in Warsaw
Household Income Brackets in Warsaw
With 251 households falling in the category, the $100,000 to $149,999 income range is the most frequent in Warsaw, accounting for 17.6% of all households.
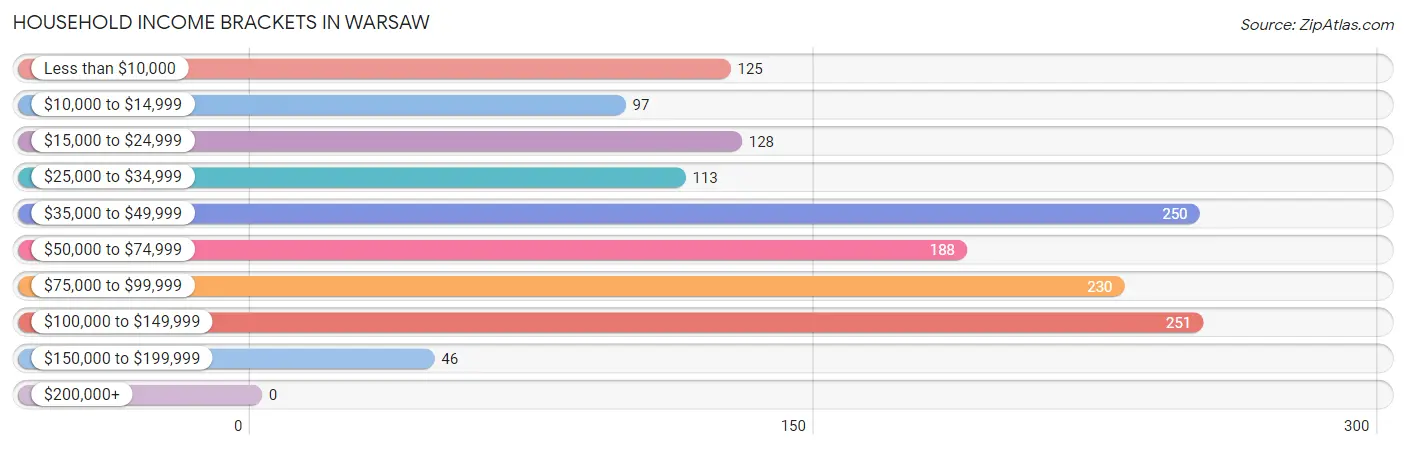
| Income Bracket | # Households | % Households |
| Less than $10,000 | 125 | 8.8% |
| $10,000 to $14,999 | 97 | 6.8% |
| $15,000 to $24,999 | 128 | 9.0% |
| $25,000 to $34,999 | 113 | 7.9% |
| $35,000 to $49,999 | 250 | 17.5% |
| $50,000 to $74,999 | 188 | 13.2% |
| $75,000 to $99,999 | 230 | 16.1% |
| $100,000 to $149,999 | 251 | 17.6% |
| $150,000 to $199,999 | 46 | 3.2% |
| $200,000+ | 0 | 0.0% |
Household Income by Householder Age in Warsaw
The median household income in Warsaw is $50,000, with the highest median household income of $82,157 found in the 45 to 64 years age bracket for the primary householder. A total of 477 households (33.5%) fall into this category. Meanwhile, the 15 to 24 years age bracket for the primary householder has the lowest median household income of $0, with 89 households (6.2%) in this group.
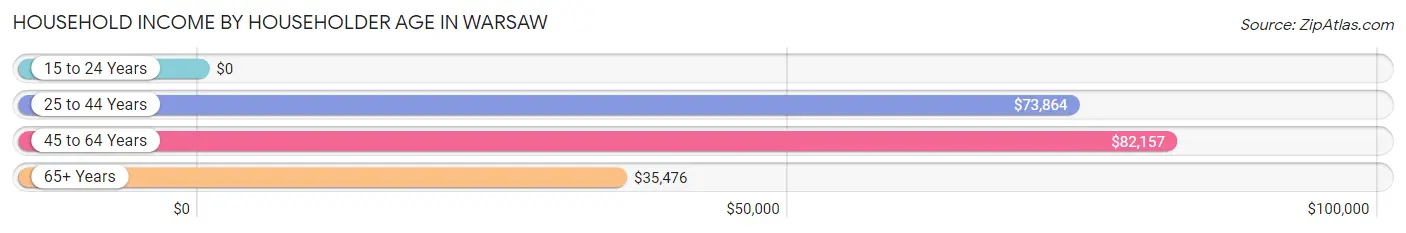
| Income Bracket | # Households | Median Income |
| 15 to 24 Years | 89 (6.2%) | $0 |
| 25 to 44 Years | 328 (23.0%) | $73,864 |
| 45 to 64 Years | 477 (33.5%) | $82,157 |
| 65+ Years | 532 (37.3%) | $35,476 |
| Total | 1,426 (100.0%) | $50,000 |
Poverty in Warsaw
Income Below Poverty by Sex and Age in Warsaw
With 13.8% poverty level for males and 20.1% for females among the residents of Warsaw, 6 to 11 year old males and 15 year old females are the most vulnerable to poverty, with 57 males (54.3%) and 34 females (100.0%) in their respective age groups living below the poverty level.
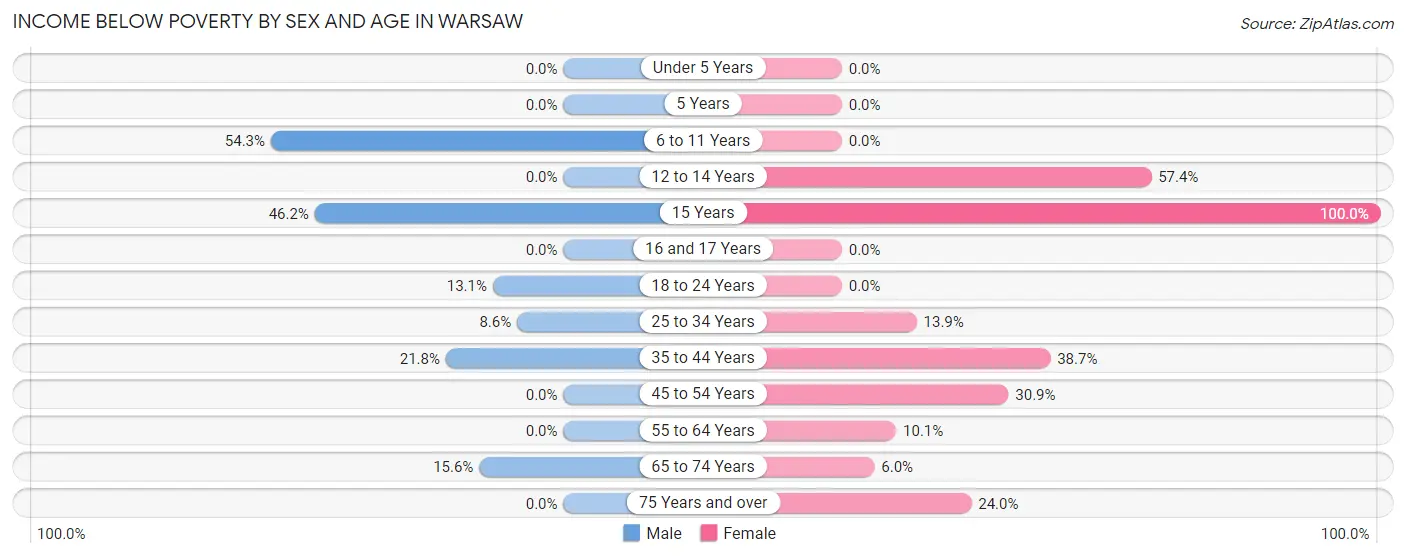
| Age Bracket | Male | Female |
| Under 5 Years | 0 (0.0%) | 0 (0.0%) |
| 5 Years | 0 (0.0%) | 0 (0.0%) |
| 6 to 11 Years | 57 (54.3%) | 0 (0.0%) |
| 12 to 14 Years | 0 (0.0%) | 58 (57.4%) |
| 15 Years | 24 (46.2%) | 34 (100.0%) |
| 16 and 17 Years | 0 (0.0%) | 0 (0.0%) |
| 18 to 24 Years | 19 (13.1%) | 0 (0.0%) |
| 25 to 34 Years | 11 (8.6%) | 25 (13.9%) |
| 35 to 44 Years | 24 (21.8%) | 77 (38.7%) |
| 45 to 54 Years | 0 (0.0%) | 47 (30.9%) |
| 55 to 64 Years | 0 (0.0%) | 38 (10.1%) |
| 65 to 74 Years | 25 (15.6%) | 22 (6.0%) |
| 75 Years and over | 0 (0.0%) | 31 (24.0%) |
| Total | 160 (13.8%) | 332 (20.1%) |
Income Above Poverty by Sex and Age in Warsaw
According to the poverty statistics in Warsaw, males aged under 5 years and females aged 6 to 11 years are the age groups that are most secure financially, with 100.0% of males and 100.0% of females in these age groups living above the poverty line.
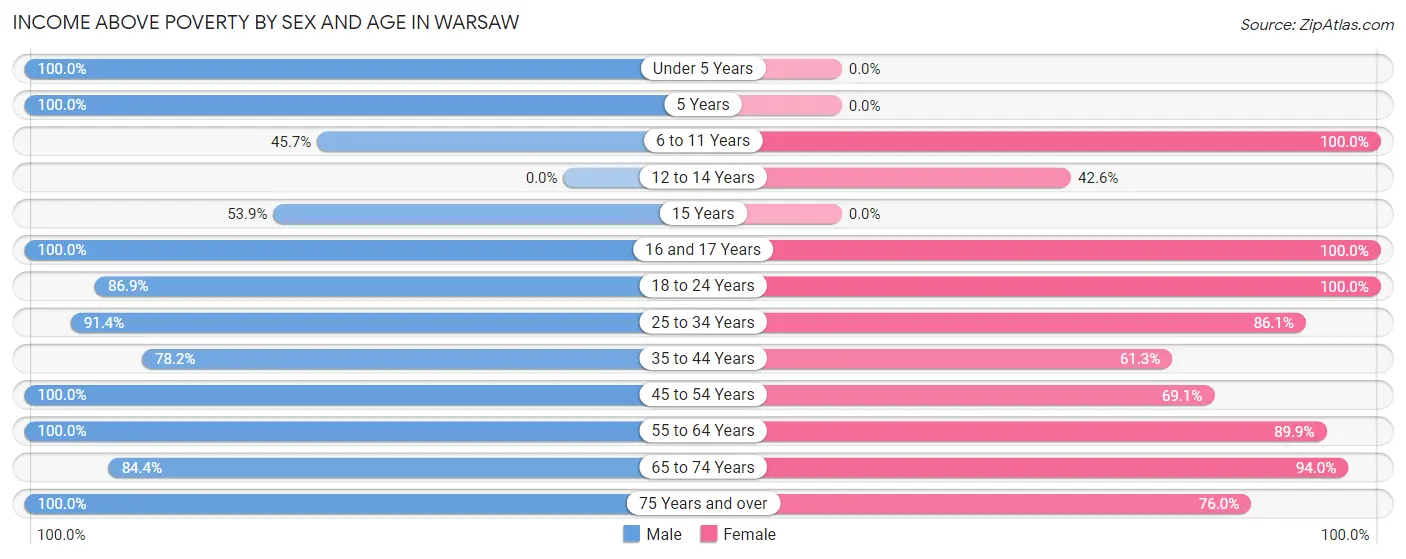
| Age Bracket | Male | Female |
| Under 5 Years | 44 (100.0%) | 0 (0.0%) |
| 5 Years | 13 (100.0%) | 0 (0.0%) |
| 6 to 11 Years | 48 (45.7%) | 9 (100.0%) |
| 12 to 14 Years | 0 (0.0%) | 43 (42.6%) |
| 15 Years | 28 (53.8%) | 0 (0.0%) |
| 16 and 17 Years | 19 (100.0%) | 30 (100.0%) |
| 18 to 24 Years | 126 (86.9%) | 77 (100.0%) |
| 25 to 34 Years | 117 (91.4%) | 155 (86.1%) |
| 35 to 44 Years | 86 (78.2%) | 122 (61.3%) |
| 45 to 54 Years | 89 (100.0%) | 105 (69.1%) |
| 55 to 64 Years | 252 (100.0%) | 339 (89.9%) |
| 65 to 74 Years | 135 (84.4%) | 342 (94.0%) |
| 75 Years and over | 41 (100.0%) | 98 (76.0%) |
| Total | 998 (86.2%) | 1,320 (79.9%) |
Income Below Poverty Among Married-Couple Families in Warsaw
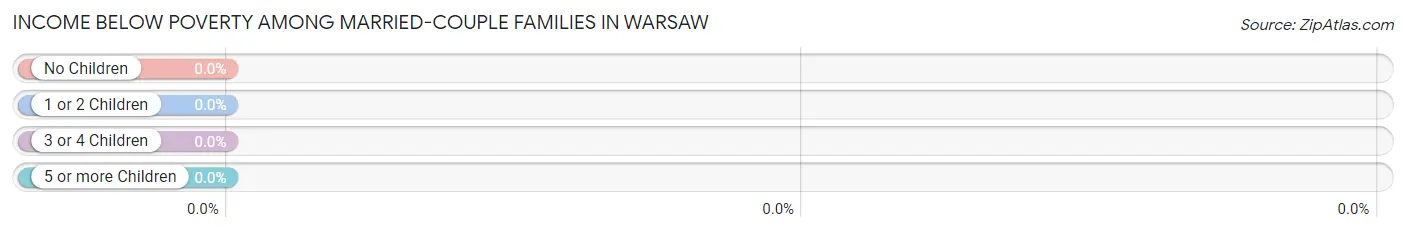
| Children | Above Poverty | Below Poverty |
| No Children | 483 (100.0%) | 0 (0.0%) |
| 1 or 2 Children | 93 (100.0%) | 0 (0.0%) |
| 3 or 4 Children | 0 (0.0%) | 0 (0.0%) |
| 5 or more Children | 0 (0.0%) | 0 (0.0%) |
| Total | 576 (100.0%) | 0 (0.0%) |
Income Below Poverty Among Single-Parent Households in Warsaw
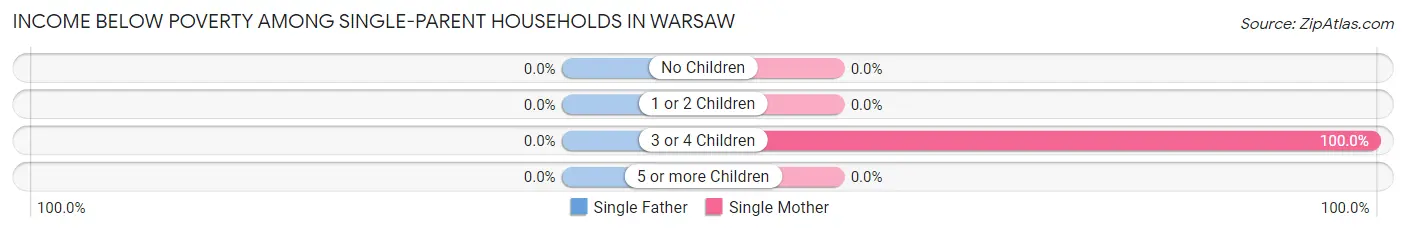
| Children | Single Father | Single Mother |
| No Children | 0 (0.0%) | 0 (0.0%) |
| 1 or 2 Children | 0 (0.0%) | 0 (0.0%) |
| 3 or 4 Children | 0 (0.0%) | 57 (100.0%) |
| 5 or more Children | 0 (0.0%) | 0 (0.0%) |
| Total | 0 (0.0%) | 57 (37.0%) |
Income Below Poverty Among Married-Couple vs Single-Parent Households in Warsaw
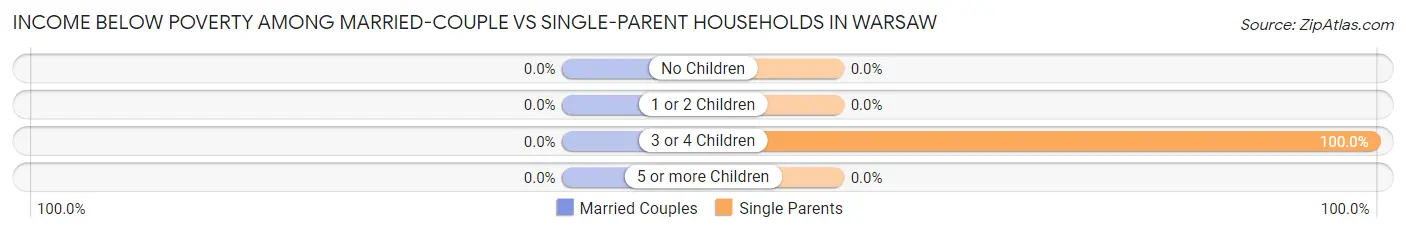
| Children | Married-Couple Families | Single-Parent Households |
| No Children | 0 (0.0%) | 0 (0.0%) |
| 1 or 2 Children | 0 (0.0%) | 0 (0.0%) |
| 3 or 4 Children | 0 (0.0%) | 57 (100.0%) |
| 5 or more Children | 0 (0.0%) | 0 (0.0%) |
| Total | 0 (0.0%) | 57 (30.3%) |
Race in Warsaw
The most populous races in Warsaw are White / Caucasian (2,830 | 96.4%), Two or more Races (59 | 2.0%), and Hispanic or Latino (44 | 1.5%).
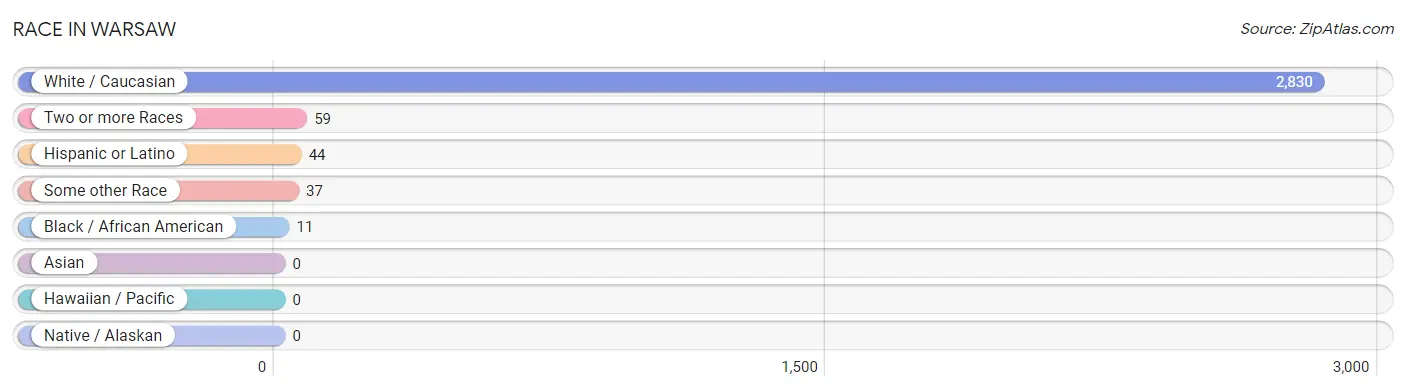
| Race | # Population | % Population |
| Asian | 0 | 0.0% |
| Black / African American | 11 | 0.4% |
| Hawaiian / Pacific | 0 | 0.0% |
| Hispanic or Latino | 44 | 1.5% |
| Native / Alaskan | 0 | 0.0% |
| White / Caucasian | 2,830 | 96.4% |
| Two or more Races | 59 | 2.0% |
| Some other Race | 37 | 1.3% |
| Total | 2,937 | 100.0% |
Ancestry in Warsaw
The most populous ancestries reported in Warsaw are German (832 | 28.3%), Irish (537 | 18.3%), English (458 | 15.6%), Polish (179 | 6.1%), and Italian (119 | 4.1%), together accounting for 72.3% of all Warsaw residents.
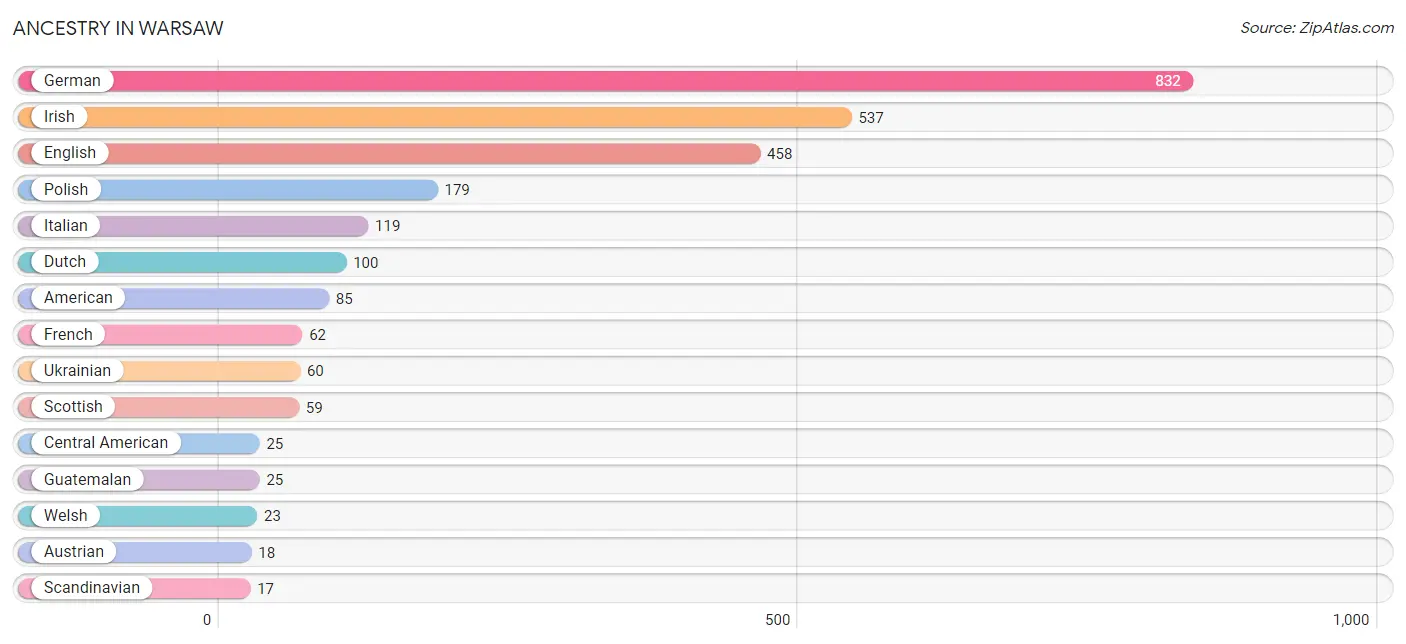
| Ancestry | # Population | % Population |
| American | 85 | 2.9% |
| Austrian | 18 | 0.6% |
| Central American | 25 | 0.9% |
| Dutch | 100 | 3.4% |
| English | 458 | 15.6% |
| French | 62 | 2.1% |
| German | 832 | 28.3% |
| Guatemalan | 25 | 0.9% |
| Irish | 537 | 18.3% |
| Italian | 119 | 4.1% |
| Liberian | 3 | 0.1% |
| Mexican | 10 | 0.3% |
| Polish | 179 | 6.1% |
| Portuguese | 13 | 0.4% |
| Puerto Rican | 9 | 0.3% |
| Russian | 3 | 0.1% |
| Scandinavian | 17 | 0.6% |
| Scotch-Irish | 11 | 0.4% |
| Scottish | 59 | 2.0% |
| Subsaharan African | 7 | 0.2% |
| Swedish | 2 | 0.1% |
| Swiss | 16 | 0.5% |
| Ukrainian | 60 | 2.0% |
| Welsh | 23 | 0.8% | View All 24 Rows |
Immigrants in Warsaw
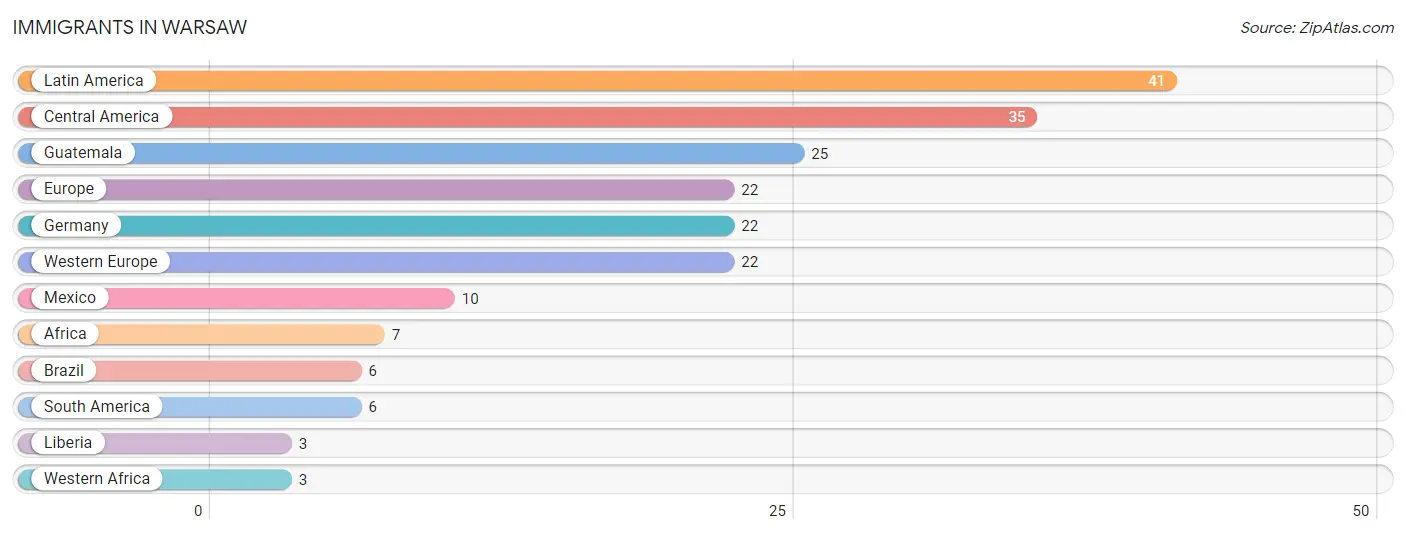
The most numerous immigrant groups reported in Warsaw came from Latin America (41 | 1.4%), Central America (35 | 1.2%), Guatemala (25 | 0.9%), Europe (22 | 0.7%), and Germany (22 | 0.7%), together accounting for 4.9% of all Warsaw residents.
| Immigration Origin | # Population | % Population |
| Africa | 7 | 0.2% |
| Brazil | 6 | 0.2% |
| Central America | 35 | 1.2% |
| Europe | 22 | 0.7% |
| Germany | 22 | 0.7% |
| Guatemala | 25 | 0.9% |
| Latin America | 41 | 1.4% |
| Liberia | 3 | 0.1% |
| Mexico | 10 | 0.3% |
| South America | 6 | 0.2% |
| Western Africa | 3 | 0.1% |
| Western Europe | 22 | 0.7% | View All 12 Rows |
Sex and Age in Warsaw
Sex and Age in Warsaw
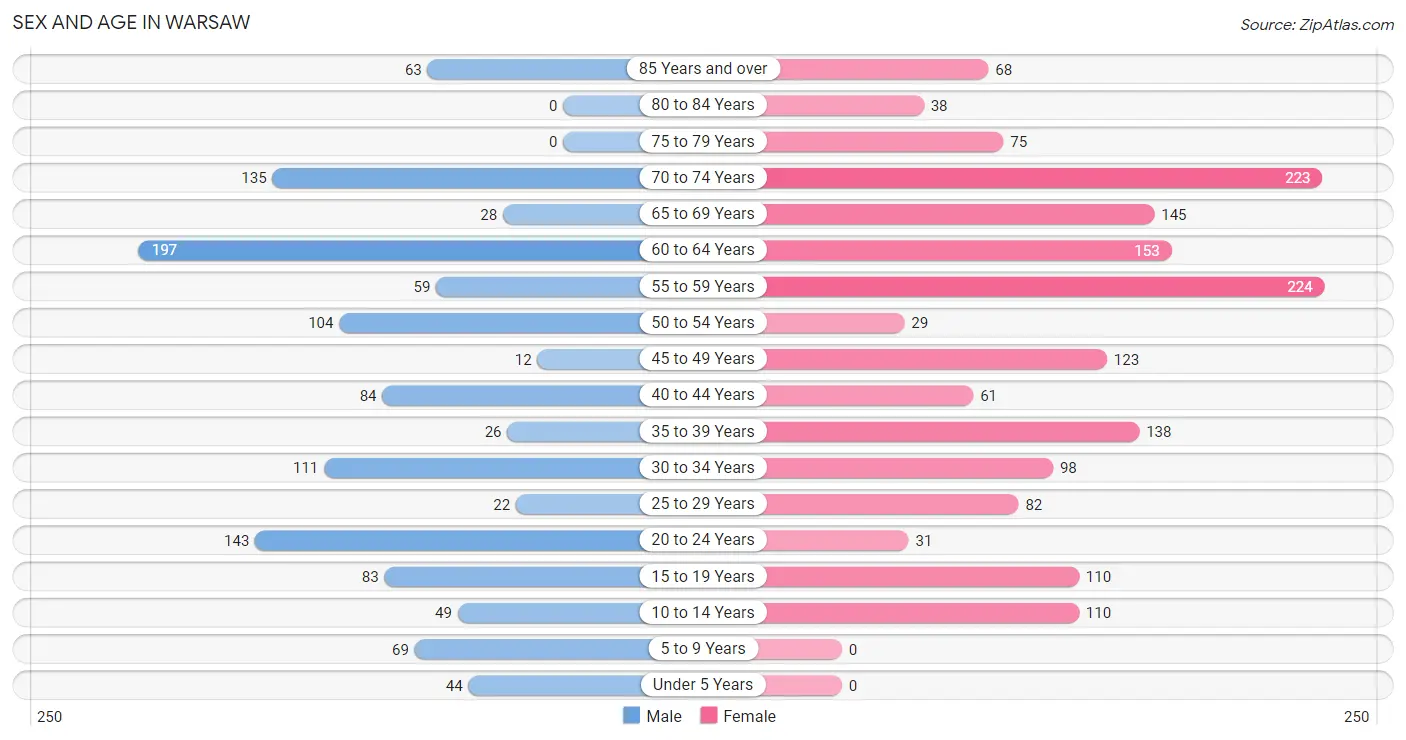
The most populous age groups in Warsaw are 60 to 64 Years (197 | 16.0%) for men and 55 to 59 Years (224 | 13.1%) for women.
| Age Bracket | Male | Female |
| Under 5 Years | 44 (3.6%) | 0 (0.0%) |
| 5 to 9 Years | 69 (5.6%) | 0 (0.0%) |
| 10 to 14 Years | 49 (4.0%) | 110 (6.4%) |
| 15 to 19 Years | 83 (6.8%) | 110 (6.4%) |
| 20 to 24 Years | 143 (11.6%) | 31 (1.8%) |
| 25 to 29 Years | 22 (1.8%) | 82 (4.8%) |
| 30 to 34 Years | 111 (9.0%) | 98 (5.7%) |
| 35 to 39 Years | 26 (2.1%) | 138 (8.1%) |
| 40 to 44 Years | 84 (6.8%) | 61 (3.6%) |
| 45 to 49 Years | 12 (1.0%) | 123 (7.2%) |
| 50 to 54 Years | 104 (8.5%) | 29 (1.7%) |
| 55 to 59 Years | 59 (4.8%) | 224 (13.1%) |
| 60 to 64 Years | 197 (16.0%) | 153 (9.0%) |
| 65 to 69 Years | 28 (2.3%) | 145 (8.5%) |
| 70 to 74 Years | 135 (11.0%) | 223 (13.1%) |
| 75 to 79 Years | 0 (0.0%) | 75 (4.4%) |
| 80 to 84 Years | 0 (0.0%) | 38 (2.2%) |
| 85 Years and over | 63 (5.1%) | 68 (4.0%) |
| Total | 1,229 (100.0%) | 1,708 (100.0%) |
Families and Households in Warsaw
Median Family Size in Warsaw
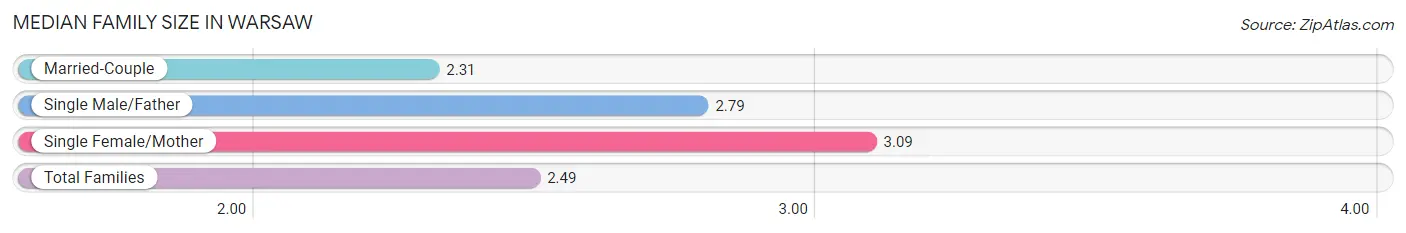
The median family size in Warsaw is 2.49 persons per family, with single female/mother families (154 | 20.2%) accounting for the largest median family size of 3.09 persons per family. On the other hand, married-couple families (576 | 75.4%) represent the smallest median family size with 2.31 persons per family.
| Family Type | # Families | Family Size |
| Married-Couple | 576 (75.4%) | 2.31 |
| Single Male/Father | 34 (4.4%) | 2.79 |
| Single Female/Mother | 154 (20.2%) | 3.09 |
| Total Families | 764 (100.0%) | 2.49 |
Median Household Size in Warsaw
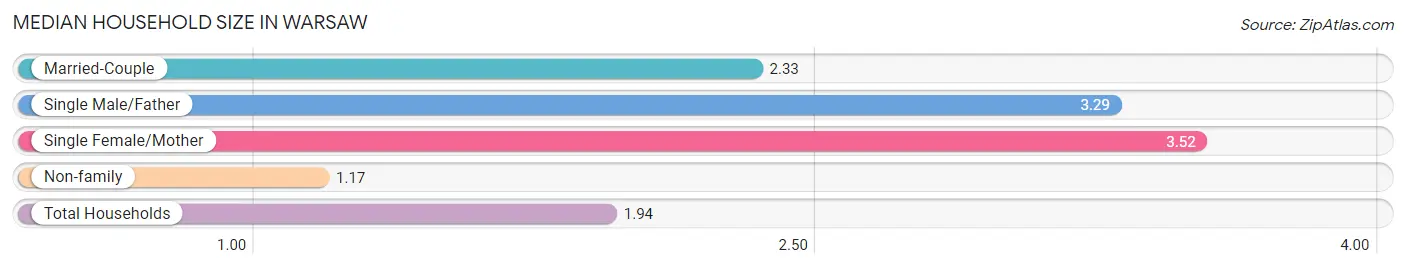
The median household size in Warsaw is 1.94 persons per household, with single female/mother households (154 | 10.8%) accounting for the largest median household size of 3.52 persons per household. non-family households (662 | 46.4%) represent the smallest median household size with 1.17 persons per household.
| Household Type | # Households | Household Size |
| Married-Couple | 576 (40.4%) | 2.33 |
| Single Male/Father | 34 (2.4%) | 3.29 |
| Single Female/Mother | 154 (10.8%) | 3.52 |
| Non-family | 662 (46.4%) | 1.17 |
| Total Households | 1,426 (100.0%) | 1.94 |
Household Size by Marriage Status in Warsaw
Out of a total of 1,426 households in Warsaw, 764 (53.6%) are family households, while 662 (46.4%) are nonfamily households. The most numerous type of family households are 2-person households, comprising 532, and the most common type of nonfamily households are 1-person households, comprising 496.
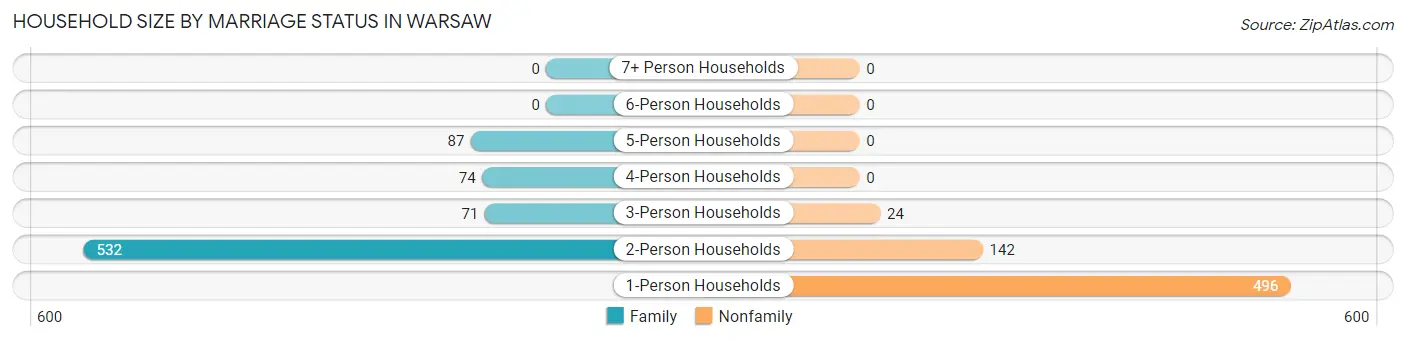
| Household Size | Family Households | Nonfamily Households |
| 1-Person Households | - | 496 (34.8%) |
| 2-Person Households | 532 (37.3%) | 142 (10.0%) |
| 3-Person Households | 71 (5.0%) | 24 (1.7%) |
| 4-Person Households | 74 (5.2%) | 0 (0.0%) |
| 5-Person Households | 87 (6.1%) | 0 (0.0%) |
| 6-Person Households | 0 (0.0%) | 0 (0.0%) |
| 7+ Person Households | 0 (0.0%) | 0 (0.0%) |
| Total | 764 (53.6%) | 662 (46.4%) |
Female Fertility in Warsaw
Fertility by Age in Warsaw
Average fertility rate in Warsaw is 33.0 births per 1,000 women. Women in the age bracket of 35 to 50 years have the highest fertility rate with 63.0 births per 1,000 women. Women in the age bracket of 35 to 50 years acount for 100.0% of all women with births.

| Age Bracket | Women with Births | Births / 1,000 Women |
| 15 to 19 years | 0 (0.0%) | 0.0 |
| 20 to 34 years | 0 (0.0%) | 0.0 |
| 35 to 50 years | 22 (100.0%) | 63.0 |
| Total | 22 (100.0%) | 33.0 |
Fertility by Age by Marriage Status in Warsaw
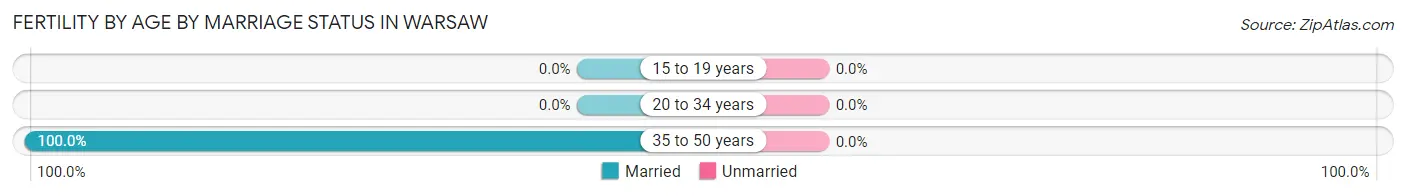
| Age Bracket | Married | Unmarried |
| 15 to 19 years | 0 (0.0%) | 0 (0.0%) |
| 20 to 34 years | 0 (0.0%) | 0 (0.0%) |
| 35 to 50 years | 22 (100.0%) | 0 (0.0%) |
| Total | 22 (100.0%) | 0 (0.0%) |
Fertility by Education in Warsaw
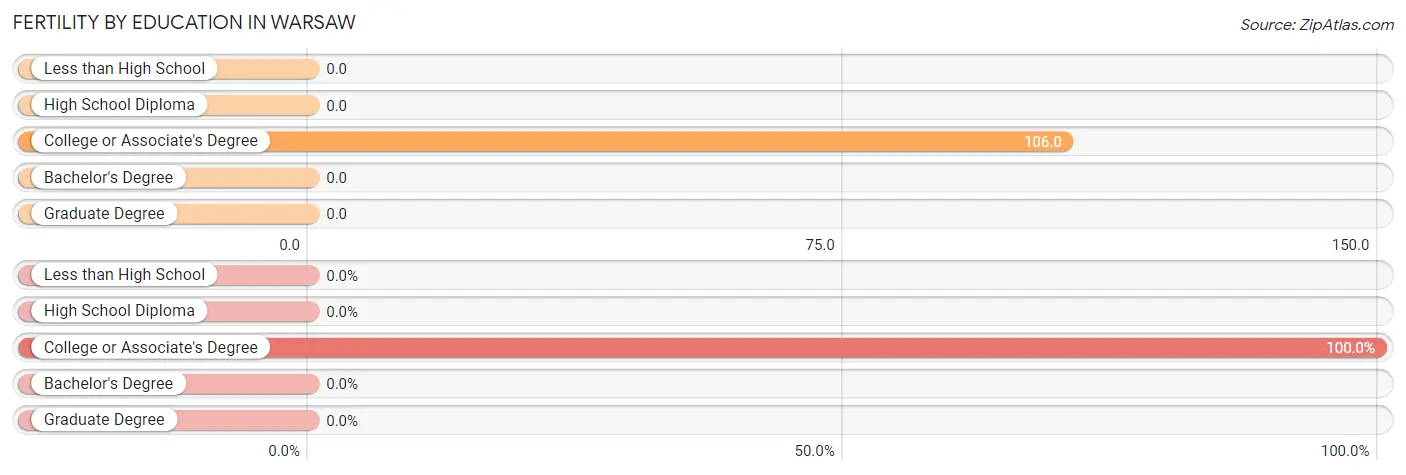
| Educational Attainment | Women with Births | Births / 1,000 Women |
| Less than High School | 0 (0.0%) | 0.0 |
| High School Diploma | 0 (0.0%) | 0.0 |
| College or Associate's Degree | 22 (100.0%) | 106.0 |
| Bachelor's Degree | 0 (0.0%) | 0.0 |
| Graduate Degree | 0 (0.0%) | 0.0 |
| Total | 22 (100.0%) | 33.0 |
Fertility by Education by Marriage Status in Warsaw
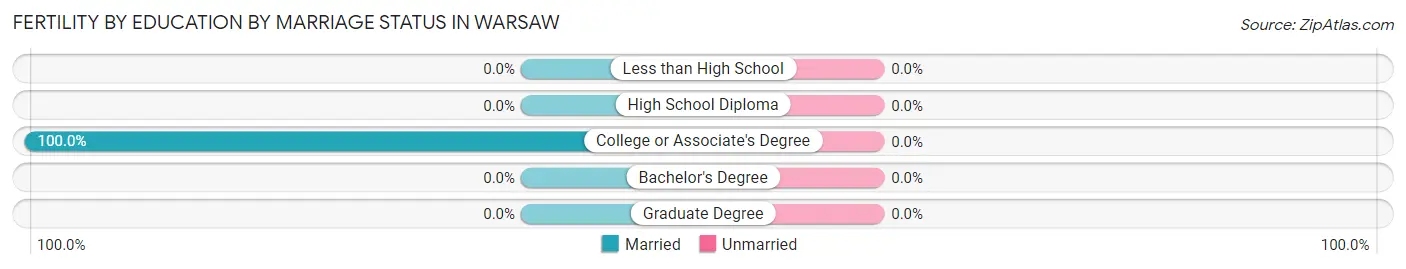
| Educational Attainment | Married | Unmarried |
| Less than High School | 0 (0.0%) | 0 (0.0%) |
| High School Diploma | 0 (0.0%) | 0 (0.0%) |
| College or Associate's Degree | 22 (100.0%) | 0 (0.0%) |
| Bachelor's Degree | 0 (0.0%) | 0 (0.0%) |
| Graduate Degree | 0 (0.0%) | 0 (0.0%) |
| Total | 22 (100.0%) | 0 (0.0%) |
Employment Characteristics in Warsaw
Employment by Class of Employer in Warsaw
Among the 1,202 employed individuals in Warsaw, private company employees (513 | 42.7%), local government employees (294 | 24.5%), and not-for-profit organizations (161 | 13.4%) make up the most common classes of employment.
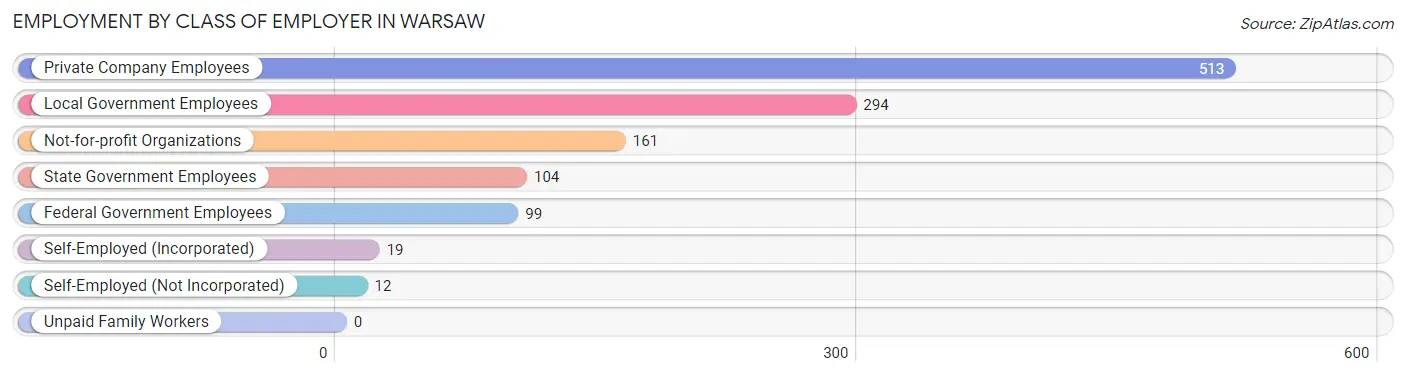
| Employer Class | # Employees | % Employees |
| Private Company Employees | 513 | 42.7% |
| Self-Employed (Incorporated) | 19 | 1.6% |
| Self-Employed (Not Incorporated) | 12 | 1.0% |
| Not-for-profit Organizations | 161 | 13.4% |
| Local Government Employees | 294 | 24.5% |
| State Government Employees | 104 | 8.6% |
| Federal Government Employees | 99 | 8.2% |
| Unpaid Family Workers | 0 | 0.0% |
| Total | 1,202 | 100.0% |
Employment Status by Age in Warsaw
According to the labor force statistics for Warsaw, out of the total population over 16 years of age (2,579), 51.6% or 1,331 individuals are in the labor force, with 8.8% or 117 of them unemployed. The age group with the highest labor force participation rate is 20 to 24 years, with 90.2% or 157 individuals in the labor force. Within the labor force, the 35 to 44 years age range has the highest percentage of unemployed individuals, with 42.2% or 92 of them being unemployed.
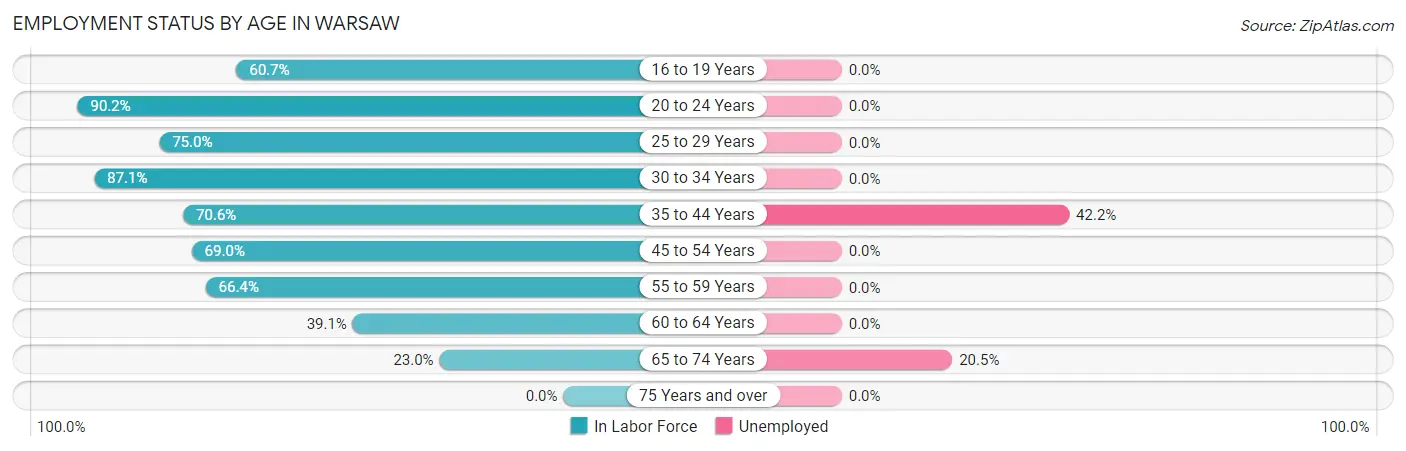
| Age Bracket | In Labor Force | Unemployed |
| 16 to 19 Years | 65 (60.7%) | 0 (0.0%) |
| 20 to 24 Years | 157 (90.2%) | 0 (0.0%) |
| 25 to 29 Years | 78 (75.0%) | 0 (0.0%) |
| 30 to 34 Years | 182 (87.1%) | 0 (0.0%) |
| 35 to 44 Years | 218 (70.6%) | 92 (42.2%) |
| 45 to 54 Years | 185 (69.0%) | 0 (0.0%) |
| 55 to 59 Years | 188 (66.4%) | 0 (0.0%) |
| 60 to 64 Years | 137 (39.1%) | 0 (0.0%) |
| 65 to 74 Years | 122 (23.0%) | 25 (20.5%) |
| 75 Years and over | 0 (0.0%) | 0 (0.0%) |
| Total | 1,331 (51.6%) | 117 (8.8%) |
Employment Status by Educational Attainment in Warsaw
According to labor force statistics for Warsaw, 64.9% of individuals (988) out of the total population between 25 and 64 years of age (1,523) are in the labor force, with 9.3% or 92 of them being unemployed. The group with the highest labor force participation rate are those with the educational attainment of bachelor's degree or higher, with 100.0% or 303 individuals in the labor force. Within the labor force, individuals with less than high school education have the highest percentage of unemployment, with 38.7% or 24 of them being unemployed.
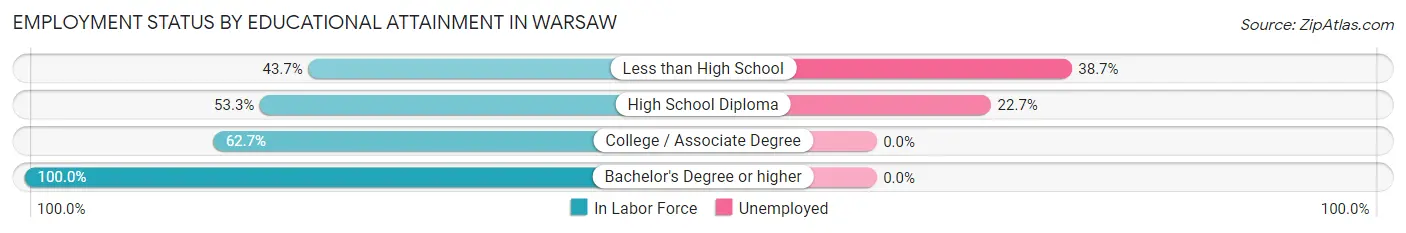
| Educational Attainment | In Labor Force | Unemployed |
| Less than High School | 62 (43.7%) | 55 (38.7%) |
| High School Diploma | 299 (53.3%) | 127 (22.7%) |
| College / Associate Degree | 324 (62.7%) | 0 (0.0%) |
| Bachelor's Degree or higher | 303 (100.0%) | 0 (0.0%) |
| Total | 988 (64.9%) | 142 (9.3%) |
Employment Occupations by Sex in Warsaw
Management, Business, Science and Arts Occupations
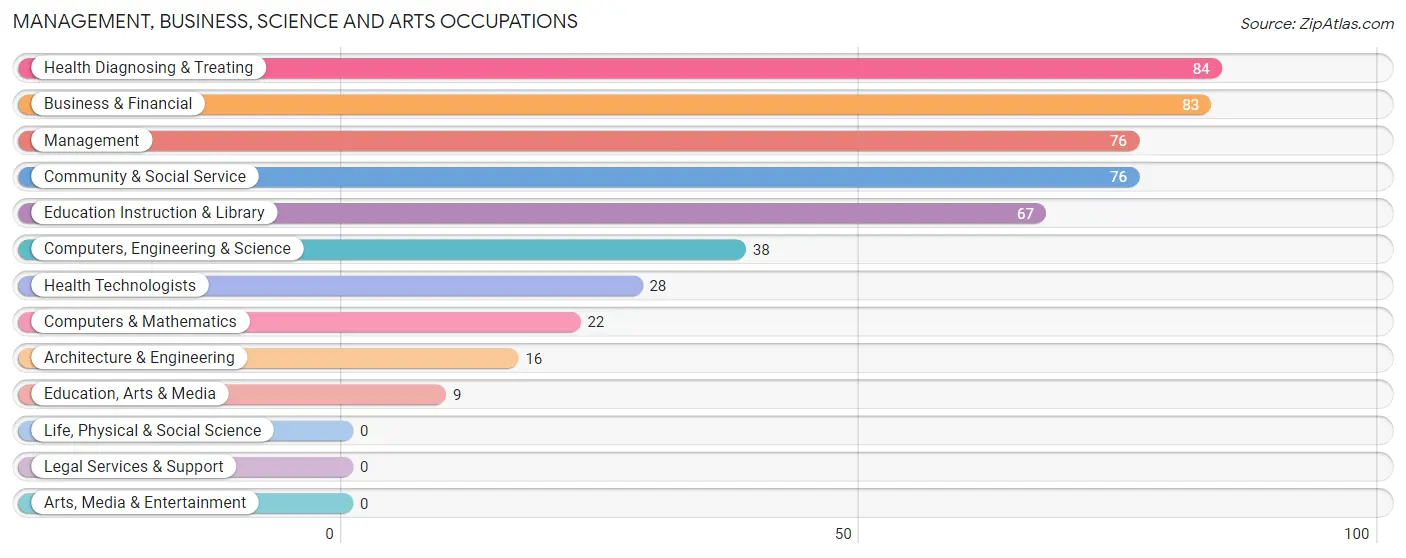
The most common Management, Business, Science and Arts occupations in Warsaw are Health Diagnosing & Treating (84 | 6.9%), Business & Financial (83 | 6.8%), Management (76 | 6.3%), Community & Social Service (76 | 6.3%), and Education Instruction & Library (67 | 5.5%).
Management, Business, Science and Arts Occupations by Sex
Within the Management, Business, Science and Arts occupations in Warsaw, the most male-oriented occupations are Computers, Engineering & Science (100.0%), Computers & Mathematics (100.0%), and Architecture & Engineering (100.0%), while the most female-oriented occupations are Education, Arts & Media (100.0%), Health Diagnosing & Treating (100.0%), and Health Technologists (100.0%).
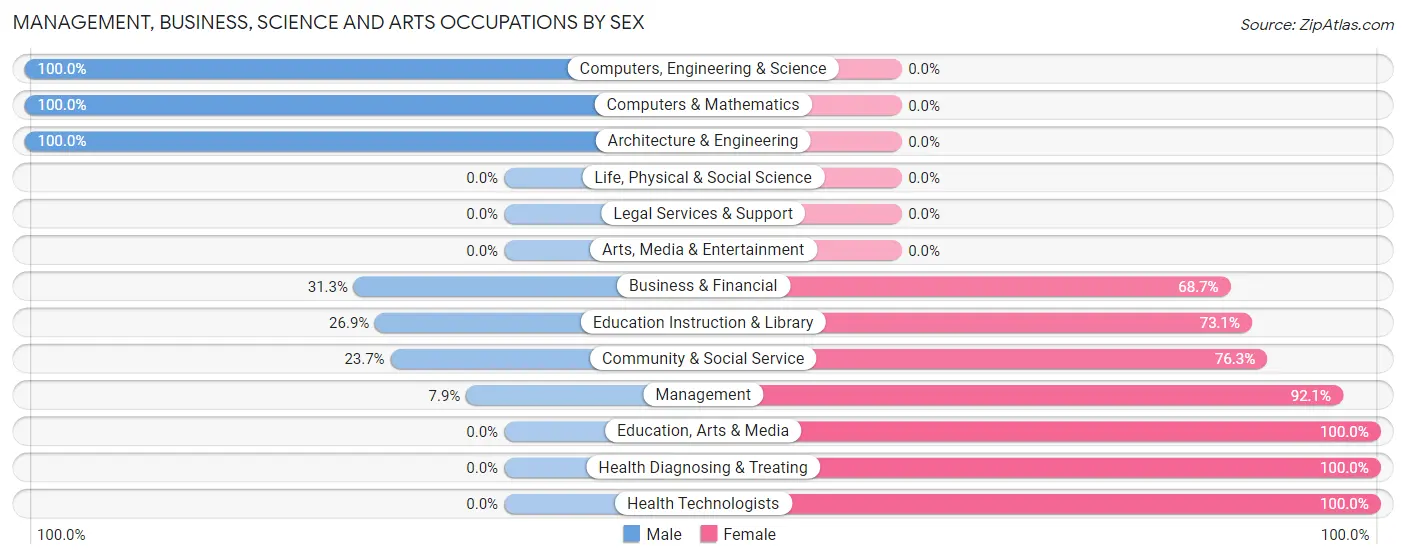
| Occupation | Male | Female |
| Management | 6 (7.9%) | 70 (92.1%) |
| Business & Financial | 26 (31.3%) | 57 (68.7%) |
| Computers, Engineering & Science | 38 (100.0%) | 0 (0.0%) |
| Computers & Mathematics | 22 (100.0%) | 0 (0.0%) |
| Architecture & Engineering | 16 (100.0%) | 0 (0.0%) |
| Life, Physical & Social Science | 0 (0.0%) | 0 (0.0%) |
| Community & Social Service | 18 (23.7%) | 58 (76.3%) |
| Education, Arts & Media | 0 (0.0%) | 9 (100.0%) |
| Legal Services & Support | 0 (0.0%) | 0 (0.0%) |
| Education Instruction & Library | 18 (26.9%) | 49 (73.1%) |
| Arts, Media & Entertainment | 0 (0.0%) | 0 (0.0%) |
| Health Diagnosing & Treating | 0 (0.0%) | 84 (100.0%) |
| Health Technologists | 0 (0.0%) | 28 (100.0%) |
| Total (Category) | 88 (24.6%) | 269 (75.3%) |
| Total (Overall) | 457 (37.6%) | 758 (62.4%) |
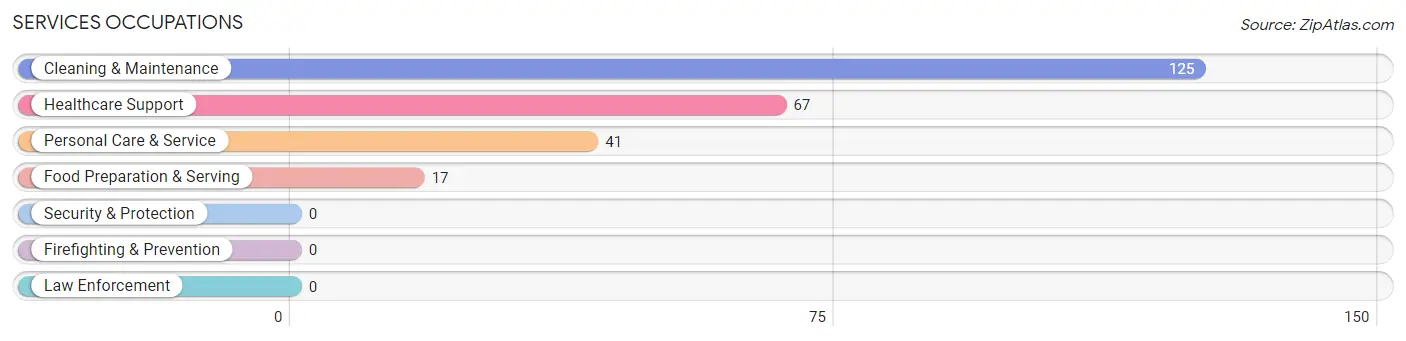
Services Occupations
The most common Services occupations in Warsaw are Cleaning & Maintenance (125 | 10.3%), Healthcare Support (67 | 5.5%), Personal Care & Service (41 | 3.4%), and Food Preparation & Serving (17 | 1.4%).
Services Occupations by Sex
Within the Services occupations in Warsaw, the most male-oriented occupations are Cleaning & Maintenance (67.2%), and Personal Care & Service (46.3%), while the most female-oriented occupations are Healthcare Support (100.0%), Food Preparation & Serving (100.0%), and Personal Care & Service (53.7%).
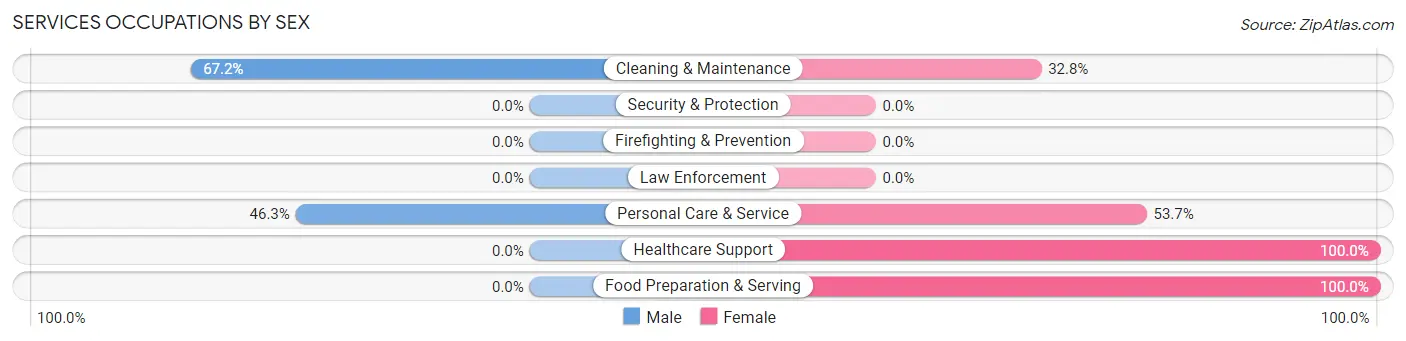
| Occupation | Male | Female |
| Healthcare Support | 0 (0.0%) | 67 (100.0%) |
| Security & Protection | 0 (0.0%) | 0 (0.0%) |
| Firefighting & Prevention | 0 (0.0%) | 0 (0.0%) |
| Law Enforcement | 0 (0.0%) | 0 (0.0%) |
| Food Preparation & Serving | 0 (0.0%) | 17 (100.0%) |
| Cleaning & Maintenance | 84 (67.2%) | 41 (32.8%) |
| Personal Care & Service | 19 (46.3%) | 22 (53.7%) |
| Total (Category) | 103 (41.2%) | 147 (58.8%) |
| Total (Overall) | 457 (37.6%) | 758 (62.4%) |
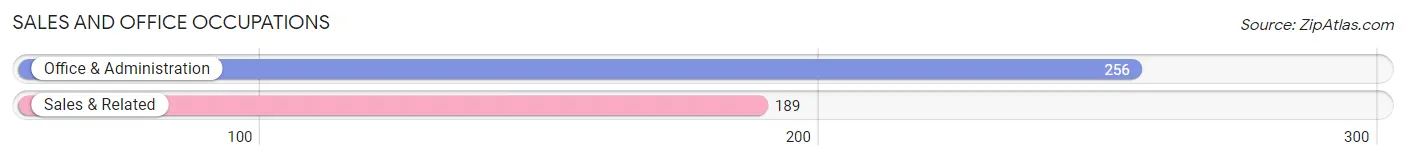
Sales and Office Occupations
The most common Sales and Office occupations in Warsaw are Office & Administration (256 | 21.1%), and Sales & Related (189 | 15.6%).
Sales and Office Occupations by Sex

| Occupation | Male | Female |
| Sales & Related | 139 (73.5%) | 50 (26.5%) |
| Office & Administration | 11 (4.3%) | 245 (95.7%) |
| Total (Category) | 150 (33.7%) | 295 (66.3%) |
| Total (Overall) | 457 (37.6%) | 758 (62.4%) |
Natural Resources, Construction and Maintenance Occupations
The most common Natural Resources, Construction and Maintenance occupations in Warsaw are Construction & Extraction (58 | 4.8%), and Installation, Maintenance & Repair (14 | 1.1%).
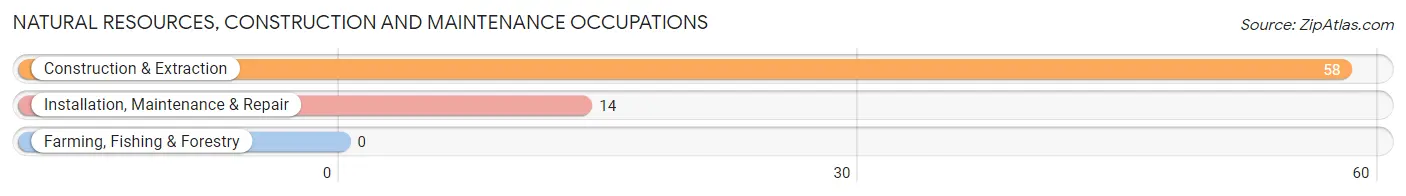
Natural Resources, Construction and Maintenance Occupations by Sex
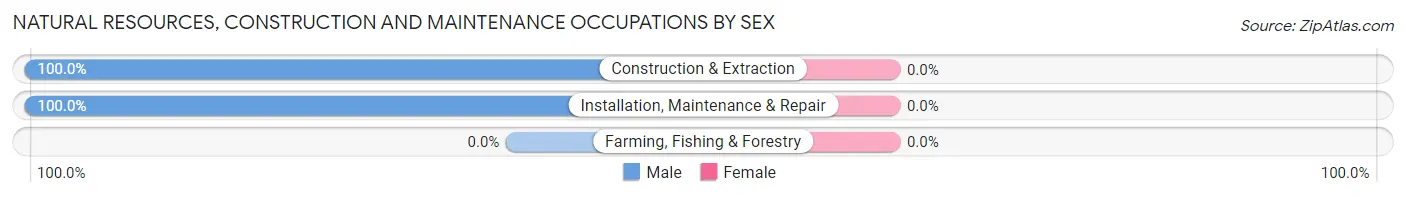
| Occupation | Male | Female |
| Farming, Fishing & Forestry | 0 (0.0%) | 0 (0.0%) |
| Construction & Extraction | 58 (100.0%) | 0 (0.0%) |
| Installation, Maintenance & Repair | 14 (100.0%) | 0 (0.0%) |
| Total (Category) | 72 (100.0%) | 0 (0.0%) |
| Total (Overall) | 457 (37.6%) | 758 (62.4%) |
Production, Transportation and Moving Occupations
The most common Production, Transportation and Moving occupations in Warsaw are , and Production (91 | 7.5%).
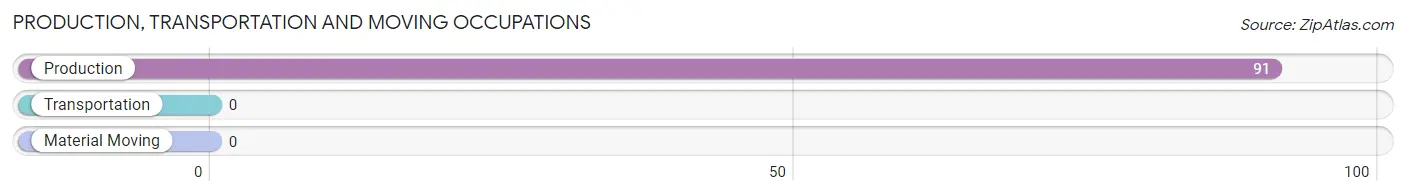
Production, Transportation and Moving Occupations by Sex
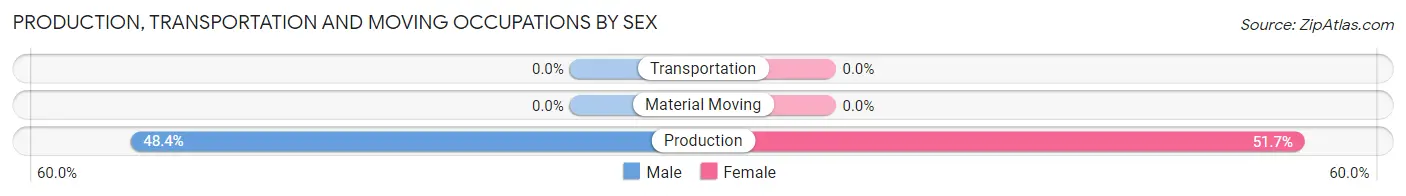
| Occupation | Male | Female |
| Production | 44 (48.3%) | 47 (51.6%) |
| Transportation | 0 (0.0%) | 0 (0.0%) |
| Material Moving | 0 (0.0%) | 0 (0.0%) |
| Total (Category) | 44 (48.3%) | 47 (51.6%) |
| Total (Overall) | 457 (37.6%) | 758 (62.4%) |
Employment Industries by Sex in Warsaw
Employment Industries in Warsaw
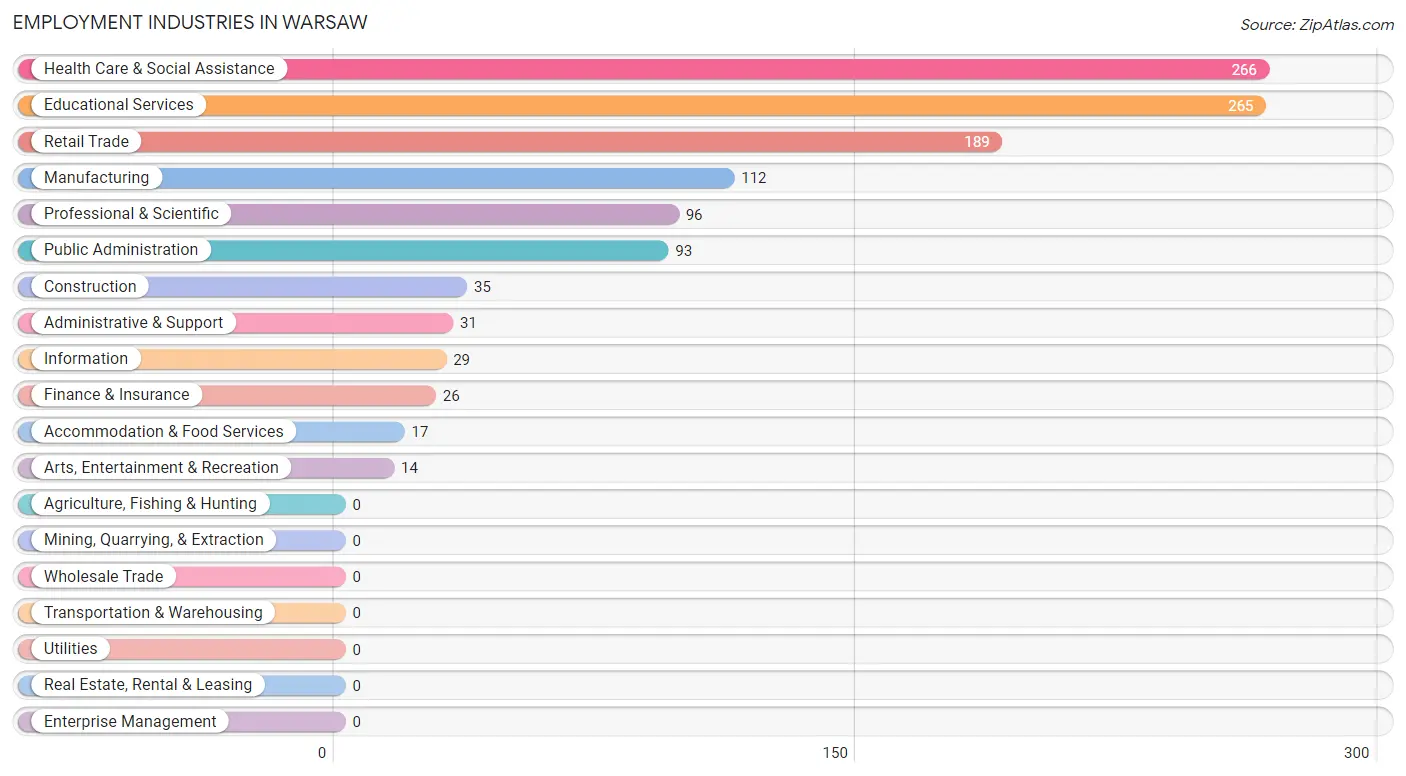
The major employment industries in Warsaw include Health Care & Social Assistance (266 | 21.9%), Educational Services (265 | 21.8%), Retail Trade (189 | 15.6%), Manufacturing (112 | 9.2%), and Professional & Scientific (96 | 7.9%).
Employment Industries by Sex in Warsaw
The Warsaw industries that see more men than women are Construction (100.0%), Retail Trade (73.5%), and Professional & Scientific (60.4%), whereas the industries that tend to have a higher number of women are Finance & Insurance (100.0%), Arts, Entertainment & Recreation (100.0%), and Accommodation & Food Services (100.0%).
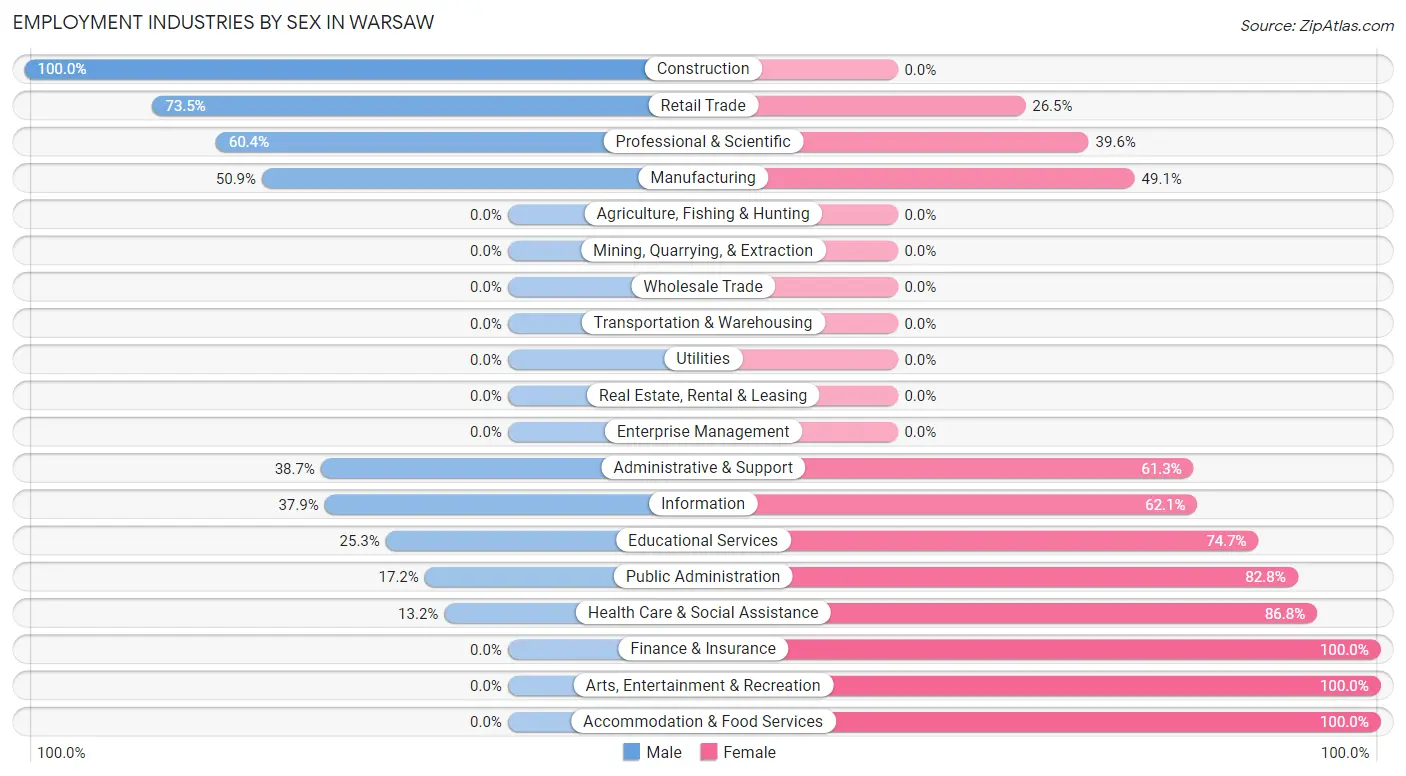
| Industry | Male | Female |
| Agriculture, Fishing & Hunting | 0 (0.0%) | 0 (0.0%) |
| Mining, Quarrying, & Extraction | 0 (0.0%) | 0 (0.0%) |
| Construction | 35 (100.0%) | 0 (0.0%) |
| Manufacturing | 57 (50.9%) | 55 (49.1%) |
| Wholesale Trade | 0 (0.0%) | 0 (0.0%) |
| Retail Trade | 139 (73.5%) | 50 (26.5%) |
| Transportation & Warehousing | 0 (0.0%) | 0 (0.0%) |
| Utilities | 0 (0.0%) | 0 (0.0%) |
| Information | 11 (37.9%) | 18 (62.1%) |
| Finance & Insurance | 0 (0.0%) | 26 (100.0%) |
| Real Estate, Rental & Leasing | 0 (0.0%) | 0 (0.0%) |
| Professional & Scientific | 58 (60.4%) | 38 (39.6%) |
| Enterprise Management | 0 (0.0%) | 0 (0.0%) |
| Administrative & Support | 12 (38.7%) | 19 (61.3%) |
| Educational Services | 67 (25.3%) | 198 (74.7%) |
| Health Care & Social Assistance | 35 (13.2%) | 231 (86.8%) |
| Arts, Entertainment & Recreation | 0 (0.0%) | 14 (100.0%) |
| Accommodation & Food Services | 0 (0.0%) | 17 (100.0%) |
| Public Administration | 16 (17.2%) | 77 (82.8%) |
| Total | 457 (37.6%) | 758 (62.4%) |
Education in Warsaw
School Enrollment in Warsaw
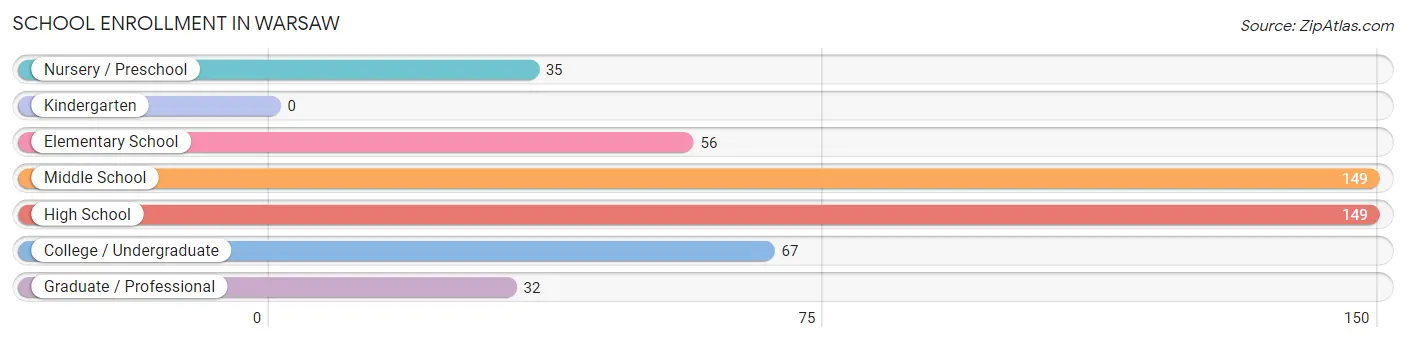
The most common levels of schooling among the 488 students in Warsaw are middle school (149 | 30.5%), high school (149 | 30.5%), and college / undergraduate (67 | 13.7%).
| School Level | # Students | % Students |
| Nursery / Preschool | 35 | 7.2% |
| Kindergarten | 0 | 0.0% |
| Elementary School | 56 | 11.5% |
| Middle School | 149 | 30.5% |
| High School | 149 | 30.5% |
| College / Undergraduate | 67 | 13.7% |
| Graduate / Professional | 32 | 6.6% |
| Total | 488 | 100.0% |
School Enrollment by Age by Funding Source in Warsaw
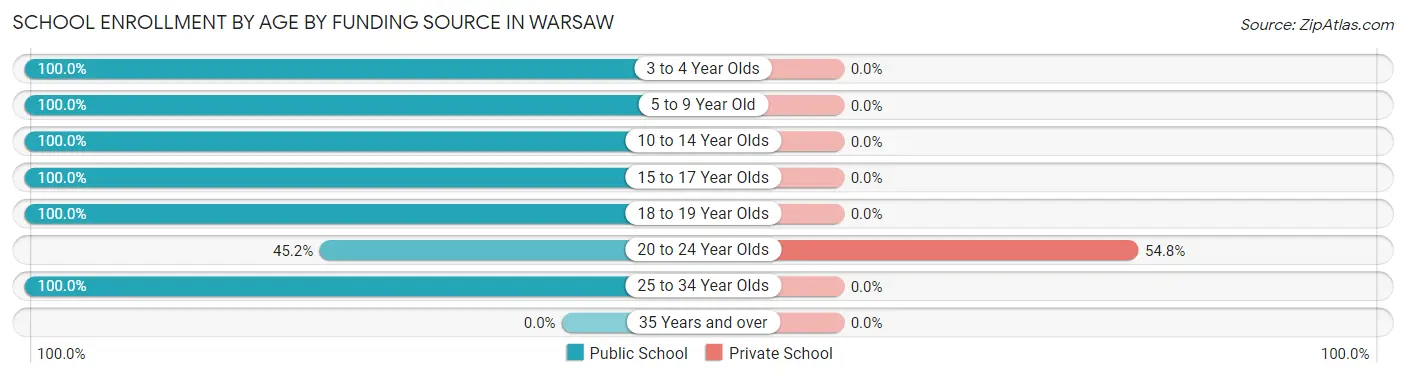
Out of a total of 488 students who are enrolled in schools in Warsaw, 17 (3.5%) attend a private institution, while the remaining 471 (96.5%) are enrolled in public schools. The age group of 20 to 24 year olds has the highest likelihood of being enrolled in private schools, with 17 (54.8% in the age bracket) enrolled. Conversely, the age group of 3 to 4 year olds has the lowest likelihood of being enrolled in a private school, with 22 (100.0% in the age bracket) attending a public institution.
| Age Bracket | Public School | Private School |
| 3 to 4 Year Olds | 22 (100.0%) | 0 (0.0%) |
| 5 to 9 Year Old | 69 (100.0%) | 0 (0.0%) |
| 10 to 14 Year Olds | 159 (100.0%) | 0 (0.0%) |
| 15 to 17 Year Olds | 117 (100.0%) | 0 (0.0%) |
| 18 to 19 Year Olds | 58 (100.0%) | 0 (0.0%) |
| 20 to 24 Year Olds | 14 (45.2%) | 17 (54.8%) |
| 25 to 34 Year Olds | 32 (100.0%) | 0 (0.0%) |
| 35 Years and over | 0 (0.0%) | 0 (0.0%) |
| Total | 471 (96.5%) | 17 (3.5%) |
Educational Attainment by Field of Study in Warsaw
Education (146 | 27.9%), physical & health sciences (102 | 19.5%), engineering (47 | 9.0%), business (46 | 8.8%), and computers & mathematics (39 | 7.5%) are the most common fields of study among 523 individuals in Warsaw who have obtained a bachelor's degree or higher.
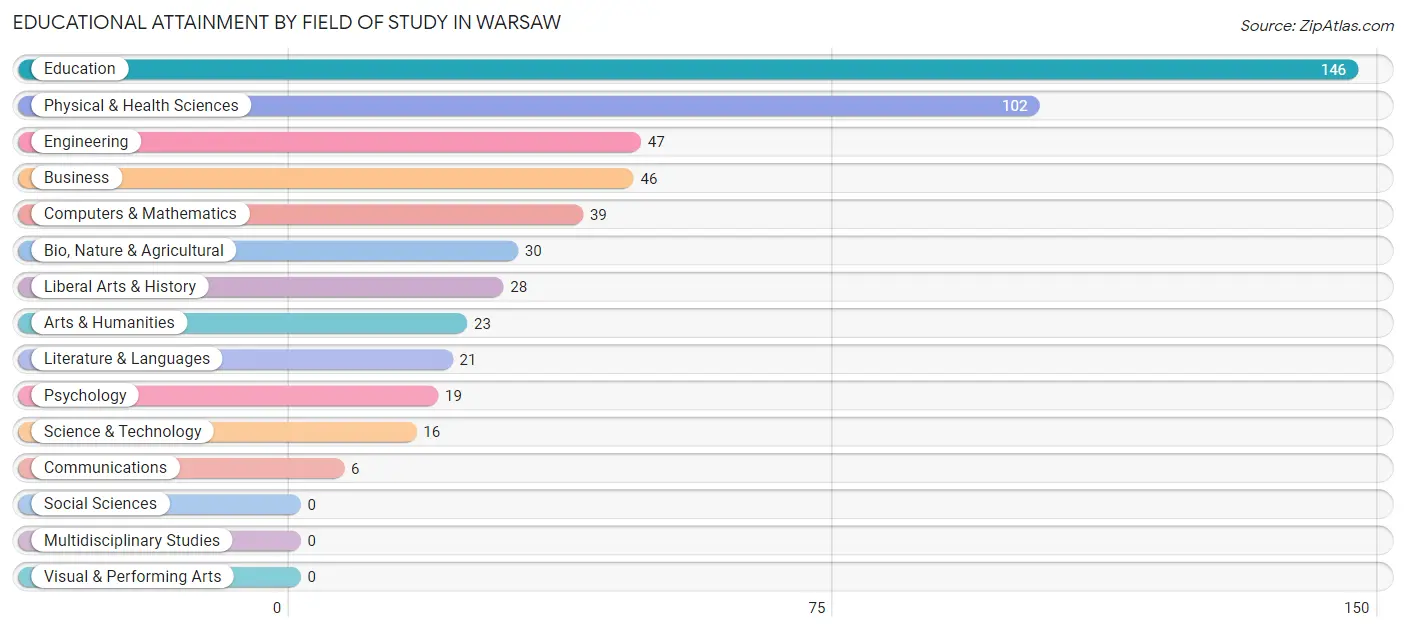
| Field of Study | # Graduates | % Graduates |
| Computers & Mathematics | 39 | 7.5% |
| Bio, Nature & Agricultural | 30 | 5.7% |
| Physical & Health Sciences | 102 | 19.5% |
| Psychology | 19 | 3.6% |
| Social Sciences | 0 | 0.0% |
| Engineering | 47 | 9.0% |
| Multidisciplinary Studies | 0 | 0.0% |
| Science & Technology | 16 | 3.1% |
| Business | 46 | 8.8% |
| Education | 146 | 27.9% |
| Literature & Languages | 21 | 4.0% |
| Liberal Arts & History | 28 | 5.3% |
| Visual & Performing Arts | 0 | 0.0% |
| Communications | 6 | 1.1% |
| Arts & Humanities | 23 | 4.4% |
| Total | 523 | 100.0% |
Transportation & Commute in Warsaw
Vehicle Availability by Sex in Warsaw
The most prevalent vehicle ownership categories in Warsaw are males with 2 vehicles (340, accounting for 78.3%) and females with 2 vehicles (367, making up 45.6%).
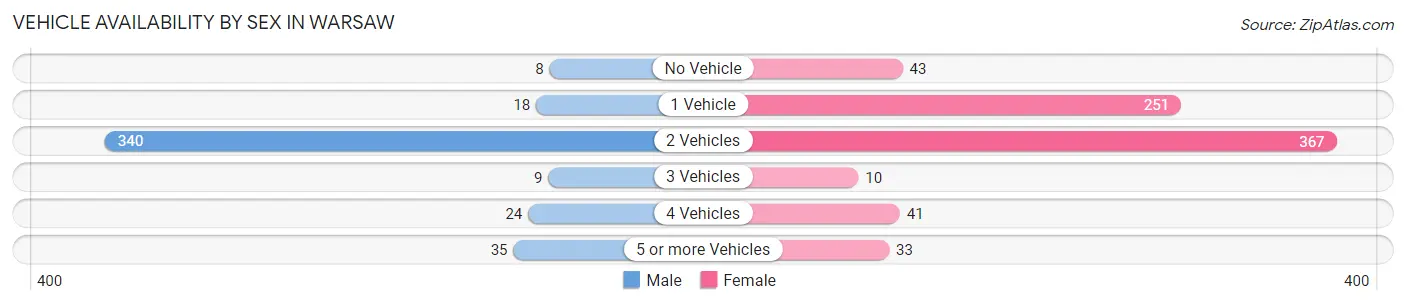
| Vehicles Available | Male | Female |
| No Vehicle | 8 (1.8%) | 43 (5.8%) |
| 1 Vehicle | 18 (4.2%) | 251 (33.7%) |
| 2 Vehicles | 340 (78.3%) | 367 (49.3%) |
| 3 Vehicles | 9 (2.1%) | 10 (1.3%) |
| 4 Vehicles | 24 (5.5%) | 41 (5.5%) |
| 5 or more Vehicles | 35 (8.1%) | 33 (4.4%) |
| Total | 434 (100.0%) | 745 (100.0%) |
Commute Time in Warsaw
The most frequently occuring commute durations in Warsaw are 5 to 9 minutes (271 commuters, 24.3%), 20 to 24 minutes (251 commuters, 22.6%), and 15 to 19 minutes (160 commuters, 14.4%).
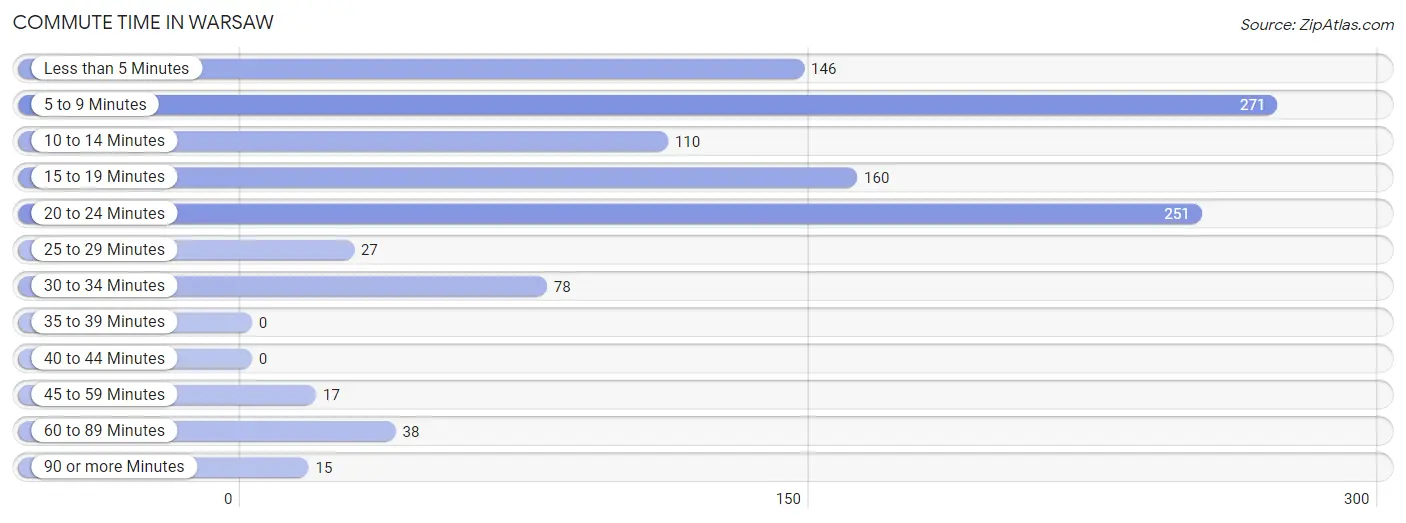
| Commute Time | # Commuters | % Commuters |
| Less than 5 Minutes | 146 | 13.1% |
| 5 to 9 Minutes | 271 | 24.3% |
| 10 to 14 Minutes | 110 | 9.9% |
| 15 to 19 Minutes | 160 | 14.4% |
| 20 to 24 Minutes | 251 | 22.6% |
| 25 to 29 Minutes | 27 | 2.4% |
| 30 to 34 Minutes | 78 | 7.0% |
| 35 to 39 Minutes | 0 | 0.0% |
| 40 to 44 Minutes | 0 | 0.0% |
| 45 to 59 Minutes | 17 | 1.5% |
| 60 to 89 Minutes | 38 | 3.4% |
| 90 or more Minutes | 15 | 1.3% |
Commute Time by Sex in Warsaw
The most common commute times in Warsaw are 5 to 9 minutes (96 commuters, 21.0%) for males and 5 to 9 minutes (175 commuters, 26.7%) for females.
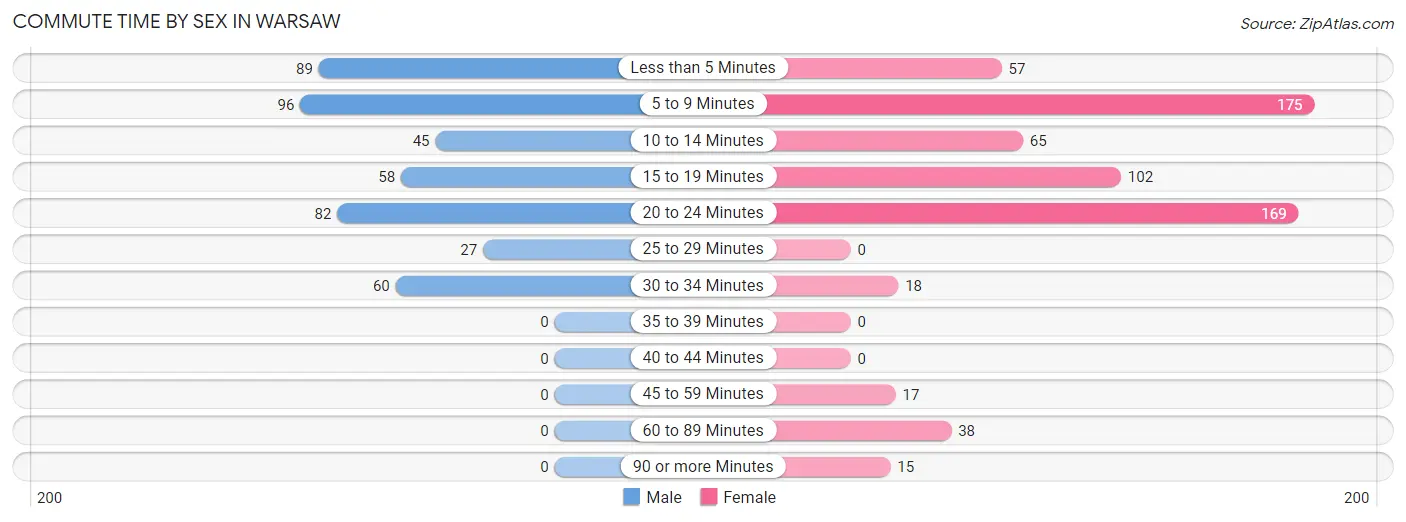
| Commute Time | Male | Female |
| Less than 5 Minutes | 89 (19.5%) | 57 (8.7%) |
| 5 to 9 Minutes | 96 (21.0%) | 175 (26.7%) |
| 10 to 14 Minutes | 45 (9.9%) | 65 (9.9%) |
| 15 to 19 Minutes | 58 (12.7%) | 102 (15.5%) |
| 20 to 24 Minutes | 82 (17.9%) | 169 (25.8%) |
| 25 to 29 Minutes | 27 (5.9%) | 0 (0.0%) |
| 30 to 34 Minutes | 60 (13.1%) | 18 (2.7%) |
| 35 to 39 Minutes | 0 (0.0%) | 0 (0.0%) |
| 40 to 44 Minutes | 0 (0.0%) | 0 (0.0%) |
| 45 to 59 Minutes | 0 (0.0%) | 17 (2.6%) |
| 60 to 89 Minutes | 0 (0.0%) | 38 (5.8%) |
| 90 or more Minutes | 0 (0.0%) | 15 (2.3%) |
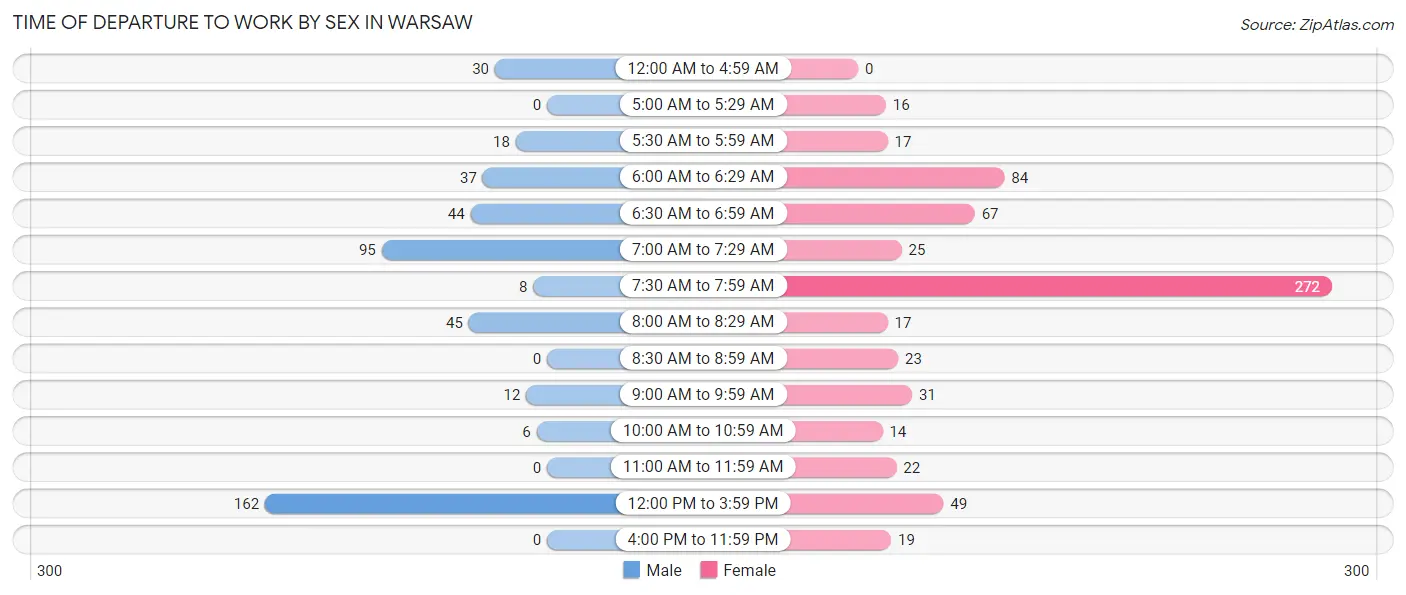
Time of Departure to Work by Sex in Warsaw
The most frequent times of departure to work in Warsaw are 12:00 PM to 3:59 PM (162, 35.4%) for males and 7:30 AM to 7:59 AM (272, 41.5%) for females.
| Time of Departure | Male | Female |
| 12:00 AM to 4:59 AM | 30 (6.6%) | 0 (0.0%) |
| 5:00 AM to 5:29 AM | 0 (0.0%) | 16 (2.4%) |
| 5:30 AM to 5:59 AM | 18 (3.9%) | 17 (2.6%) |
| 6:00 AM to 6:29 AM | 37 (8.1%) | 84 (12.8%) |
| 6:30 AM to 6:59 AM | 44 (9.6%) | 67 (10.2%) |
| 7:00 AM to 7:29 AM | 95 (20.8%) | 25 (3.8%) |
| 7:30 AM to 7:59 AM | 8 (1.8%) | 272 (41.5%) |
| 8:00 AM to 8:29 AM | 45 (9.9%) | 17 (2.6%) |
| 8:30 AM to 8:59 AM | 0 (0.0%) | 23 (3.5%) |
| 9:00 AM to 9:59 AM | 12 (2.6%) | 31 (4.7%) |
| 10:00 AM to 10:59 AM | 6 (1.3%) | 14 (2.1%) |
| 11:00 AM to 11:59 AM | 0 (0.0%) | 22 (3.4%) |
| 12:00 PM to 3:59 PM | 162 (35.4%) | 49 (7.5%) |
| 4:00 PM to 11:59 PM | 0 (0.0%) | 19 (2.9%) |
| Total | 457 (100.0%) | 656 (100.0%) |
Housing Occupancy in Warsaw
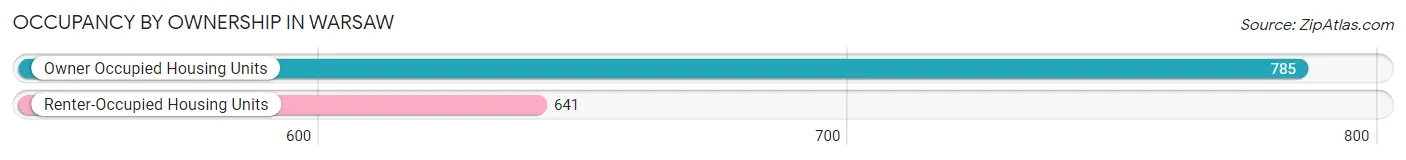
Occupancy by Ownership in Warsaw
Of the total 1,426 dwellings in Warsaw, owner-occupied units account for 785 (55.0%), while renter-occupied units make up 641 (45.0%).
| Occupancy | # Housing Units | % Housing Units |
| Owner Occupied Housing Units | 785 | 55.0% |
| Renter-Occupied Housing Units | 641 | 45.0% |
| Total Occupied Housing Units | 1,426 | 100.0% |
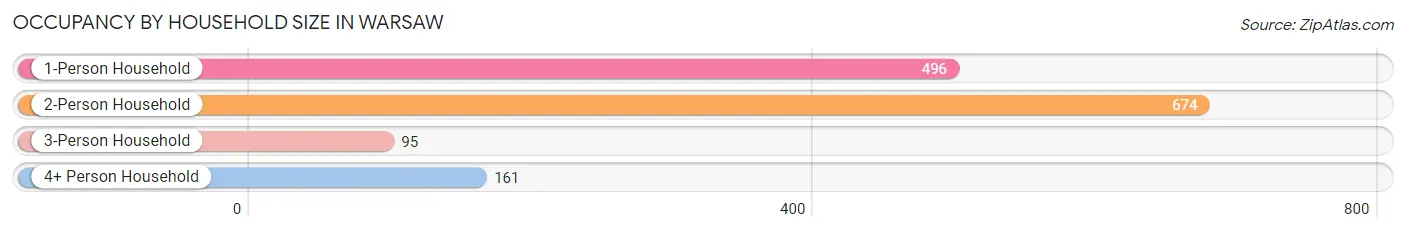
Occupancy by Household Size in Warsaw
| Household Size | # Housing Units | % Housing Units |
| 1-Person Household | 496 | 34.8% |
| 2-Person Household | 674 | 47.3% |
| 3-Person Household | 95 | 6.7% |
| 4+ Person Household | 161 | 11.3% |
| Total Housing Units | 1,426 | 100.0% |
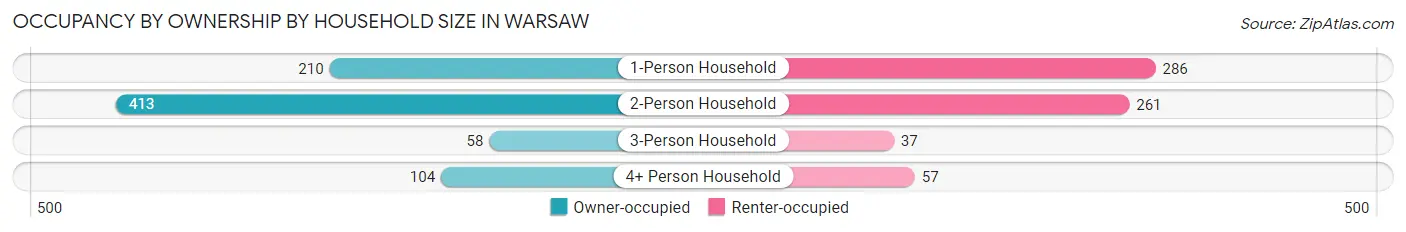
Occupancy by Ownership by Household Size in Warsaw
| Household Size | Owner-occupied | Renter-occupied |
| 1-Person Household | 210 (42.3%) | 286 (57.7%) |
| 2-Person Household | 413 (61.3%) | 261 (38.7%) |
| 3-Person Household | 58 (61.1%) | 37 (39.0%) |
| 4+ Person Household | 104 (64.6%) | 57 (35.4%) |
| Total Housing Units | 785 (55.0%) | 641 (45.0%) |
Occupancy by Educational Attainment in Warsaw
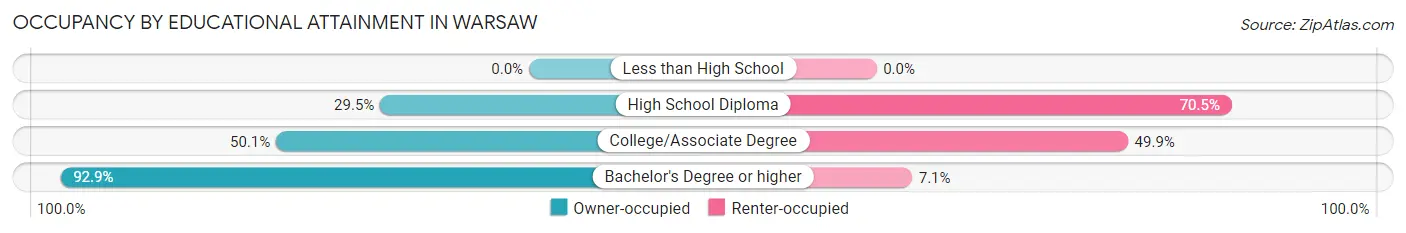
| Household Size | Owner-occupied | Renter-occupied |
| Less than High School | 0 (0.0%) | 0 (0.0%) |
| High School Diploma | 108 (29.5%) | 258 (70.5%) |
| College/Associate Degree | 361 (50.1%) | 359 (49.9%) |
| Bachelor's Degree or higher | 316 (92.9%) | 24 (7.1%) |
Occupancy by Age of Householder in Warsaw
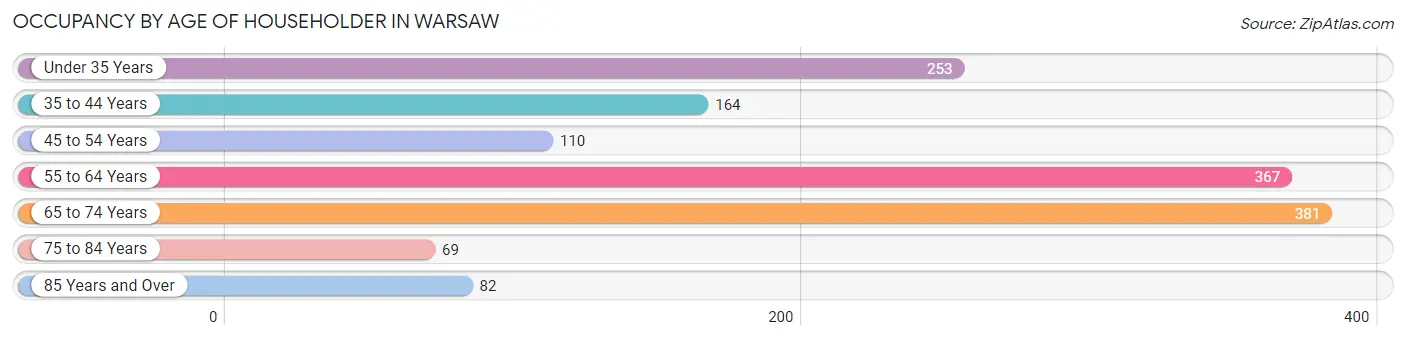
| Age Bracket | # Households | % Households |
| Under 35 Years | 253 | 17.7% |
| 35 to 44 Years | 164 | 11.5% |
| 45 to 54 Years | 110 | 7.7% |
| 55 to 64 Years | 367 | 25.7% |
| 65 to 74 Years | 381 | 26.7% |
| 75 to 84 Years | 69 | 4.8% |
| 85 Years and Over | 82 | 5.8% |
| Total | 1,426 | 100.0% |
Housing Finances in Warsaw
Median Income by Occupancy in Warsaw
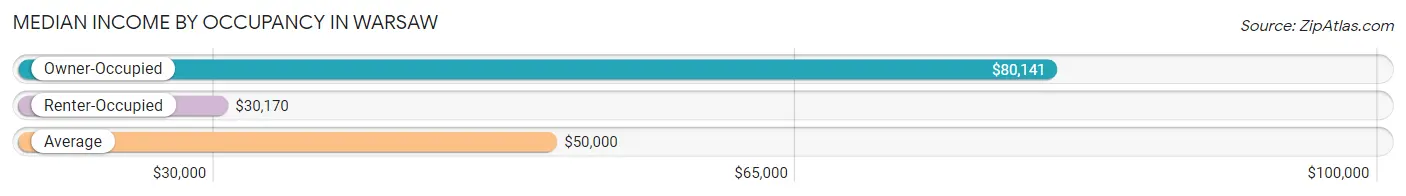
| Occupancy Type | # Households | Median Income |
| Owner-Occupied | 785 (55.0%) | $80,141 |
| Renter-Occupied | 641 (45.0%) | $30,170 |
| Average | 1,426 (100.0%) | $50,000 |
Occupancy by Householder Income Bracket in Warsaw
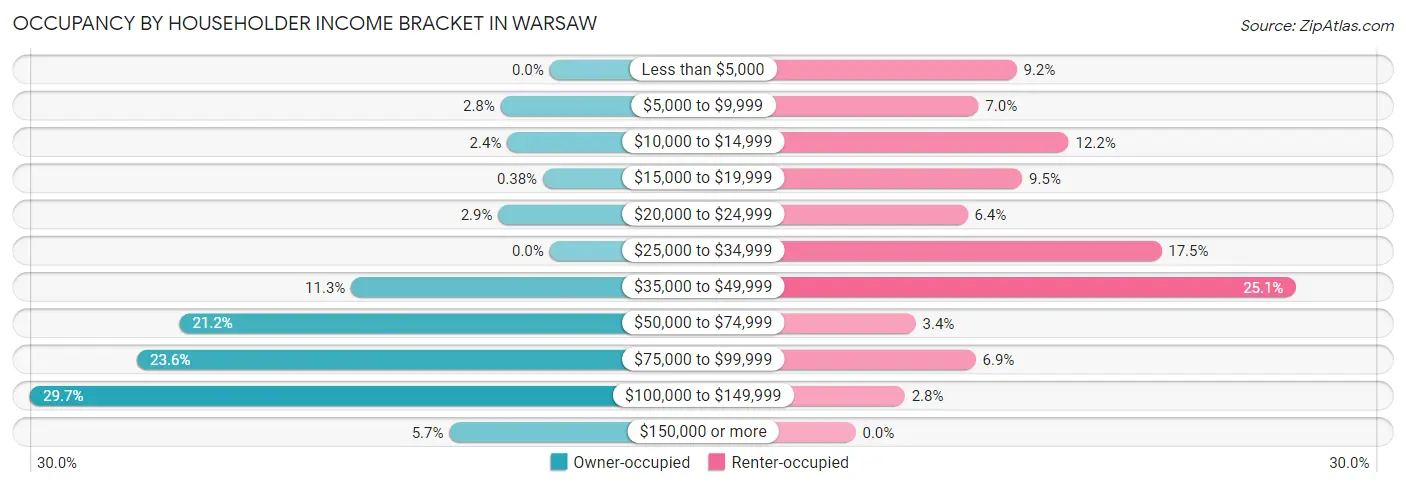
| Income Bracket | Owner-occupied | Renter-occupied |
| Less than $5,000 | 0 (0.0%) | 59 (9.2%) |
| $5,000 to $9,999 | 22 (2.8%) | 45 (7.0%) |
| $10,000 to $14,999 | 19 (2.4%) | 78 (12.2%) |
| $15,000 to $19,999 | 3 (0.4%) | 61 (9.5%) |
| $20,000 to $24,999 | 23 (2.9%) | 41 (6.4%) |
| $25,000 to $34,999 | 0 (0.0%) | 112 (17.5%) |
| $35,000 to $49,999 | 89 (11.3%) | 161 (25.1%) |
| $50,000 to $74,999 | 166 (21.1%) | 22 (3.4%) |
| $75,000 to $99,999 | 185 (23.6%) | 44 (6.9%) |
| $100,000 to $149,999 | 233 (29.7%) | 18 (2.8%) |
| $150,000 or more | 45 (5.7%) | 0 (0.0%) |
| Total | 785 (100.0%) | 641 (100.0%) |
Monthly Housing Cost Tiers in Warsaw
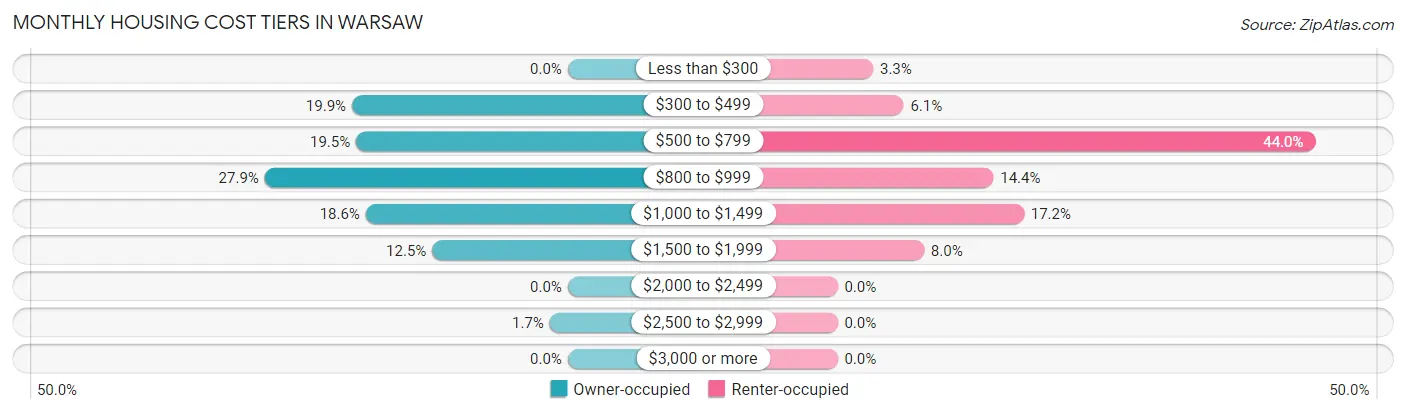
| Monthly Cost | Owner-occupied | Renter-occupied |
| Less than $300 | 0 (0.0%) | 21 (3.3%) |
| $300 to $499 | 156 (19.9%) | 39 (6.1%) |
| $500 to $799 | 153 (19.5%) | 282 (44.0%) |
| $800 to $999 | 219 (27.9%) | 92 (14.3%) |
| $1,000 to $1,499 | 146 (18.6%) | 110 (17.2%) |
| $1,500 to $1,999 | 98 (12.5%) | 51 (8.0%) |
| $2,000 to $2,499 | 0 (0.0%) | 0 (0.0%) |
| $2,500 to $2,999 | 13 (1.7%) | 0 (0.0%) |
| $3,000 or more | 0 (0.0%) | 0 (0.0%) |
| Total | 785 (100.0%) | 641 (100.0%) |
Physical Housing Characteristics in Warsaw
Housing Structures in Warsaw
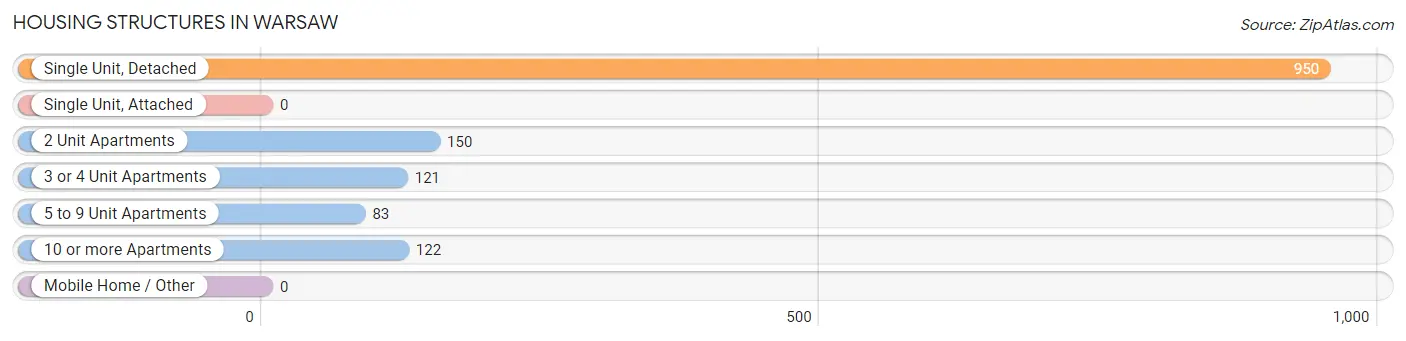
| Structure Type | # Housing Units | % Housing Units |
| Single Unit, Detached | 950 | 66.6% |
| Single Unit, Attached | 0 | 0.0% |
| 2 Unit Apartments | 150 | 10.5% |
| 3 or 4 Unit Apartments | 121 | 8.5% |
| 5 to 9 Unit Apartments | 83 | 5.8% |
| 10 or more Apartments | 122 | 8.6% |
| Mobile Home / Other | 0 | 0.0% |
| Total | 1,426 | 100.0% |
Housing Structures by Occupancy in Warsaw
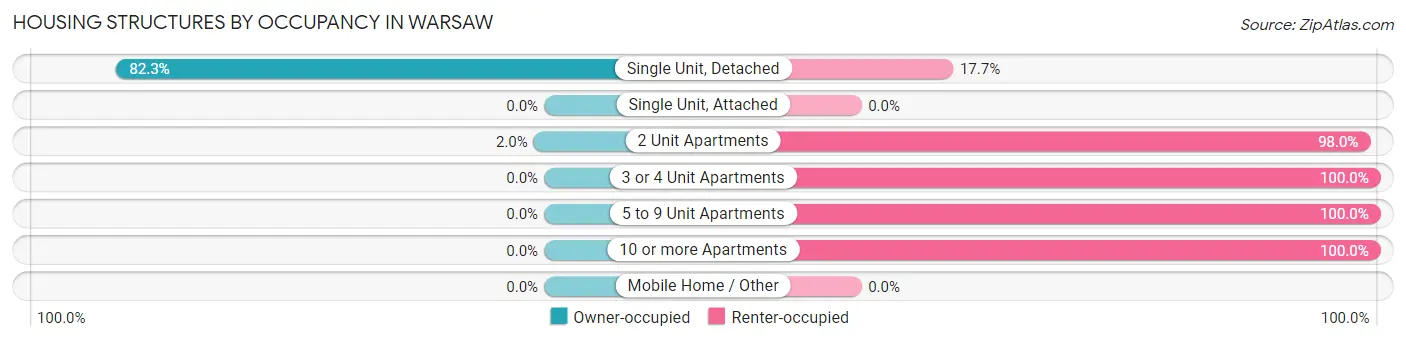
| Structure Type | Owner-occupied | Renter-occupied |
| Single Unit, Detached | 782 (82.3%) | 168 (17.7%) |
| Single Unit, Attached | 0 (0.0%) | 0 (0.0%) |
| 2 Unit Apartments | 3 (2.0%) | 147 (98.0%) |
| 3 or 4 Unit Apartments | 0 (0.0%) | 121 (100.0%) |
| 5 to 9 Unit Apartments | 0 (0.0%) | 83 (100.0%) |
| 10 or more Apartments | 0 (0.0%) | 122 (100.0%) |
| Mobile Home / Other | 0 (0.0%) | 0 (0.0%) |
| Total | 785 (55.0%) | 641 (45.0%) |
Housing Structures by Number of Rooms in Warsaw
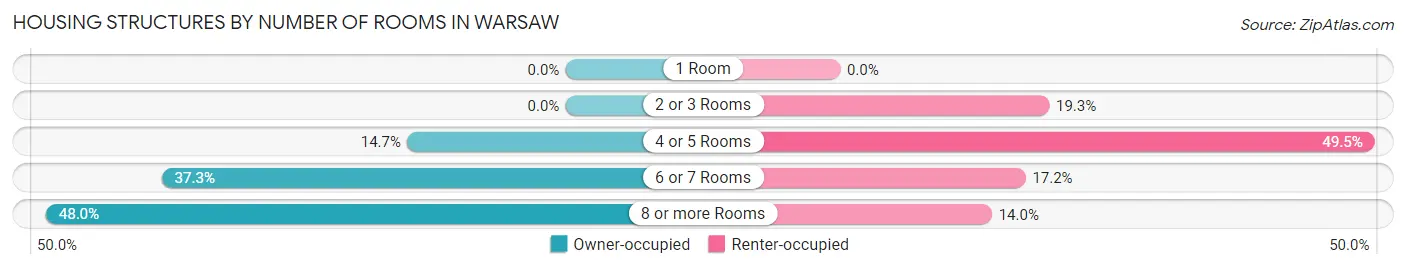
| Number of Rooms | Owner-occupied | Renter-occupied |
| 1 Room | 0 (0.0%) | 0 (0.0%) |
| 2 or 3 Rooms | 0 (0.0%) | 124 (19.3%) |
| 4 or 5 Rooms | 115 (14.6%) | 317 (49.4%) |
| 6 or 7 Rooms | 293 (37.3%) | 110 (17.2%) |
| 8 or more Rooms | 377 (48.0%) | 90 (14.0%) |
| Total | 785 (100.0%) | 641 (100.0%) |
Housing Structure by Heating Type in Warsaw
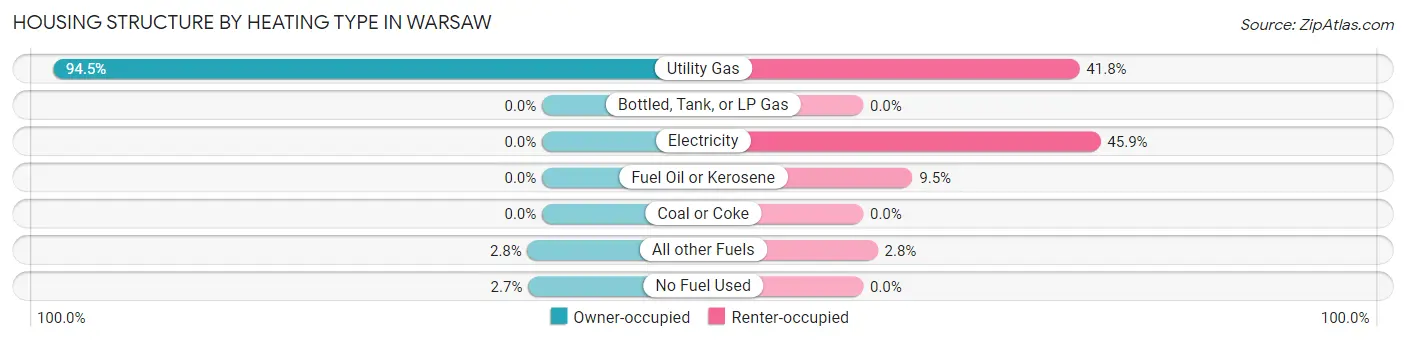
| Heating Type | Owner-occupied | Renter-occupied |
| Utility Gas | 742 (94.5%) | 268 (41.8%) |
| Bottled, Tank, or LP Gas | 0 (0.0%) | 0 (0.0%) |
| Electricity | 0 (0.0%) | 294 (45.9%) |
| Fuel Oil or Kerosene | 0 (0.0%) | 61 (9.5%) |
| Coal or Coke | 0 (0.0%) | 0 (0.0%) |
| All other Fuels | 22 (2.8%) | 18 (2.8%) |
| No Fuel Used | 21 (2.7%) | 0 (0.0%) |
| Total | 785 (100.0%) | 641 (100.0%) |
Household Vehicle Usage in Warsaw
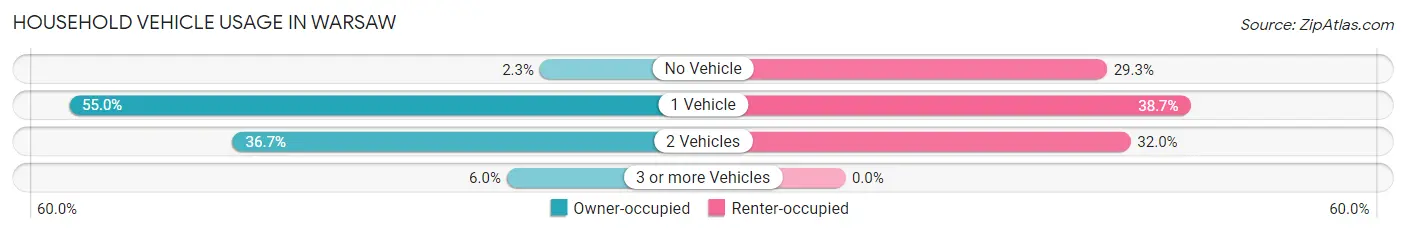
| Vehicles per Household | Owner-occupied | Renter-occupied |
| No Vehicle | 18 (2.3%) | 188 (29.3%) |
| 1 Vehicle | 432 (55.0%) | 248 (38.7%) |
| 2 Vehicles | 288 (36.7%) | 205 (32.0%) |
| 3 or more Vehicles | 47 (6.0%) | 0 (0.0%) |
| Total | 785 (100.0%) | 641 (100.0%) |
Real Estate & Mortgages in Warsaw
Real Estate and Mortgage Overview in Warsaw
| Characteristic | Without Mortgage | With Mortgage |
| Housing Units | 470 | 315 |
| Median Property Value | $116,500 | $136,800 |
| Median Household Income | $82,016 | $16 |
| Monthly Housing Costs | $723 | $0 |
| Real Estate Taxes | $4,099 | $0 |
Property Value by Mortgage Status in Warsaw
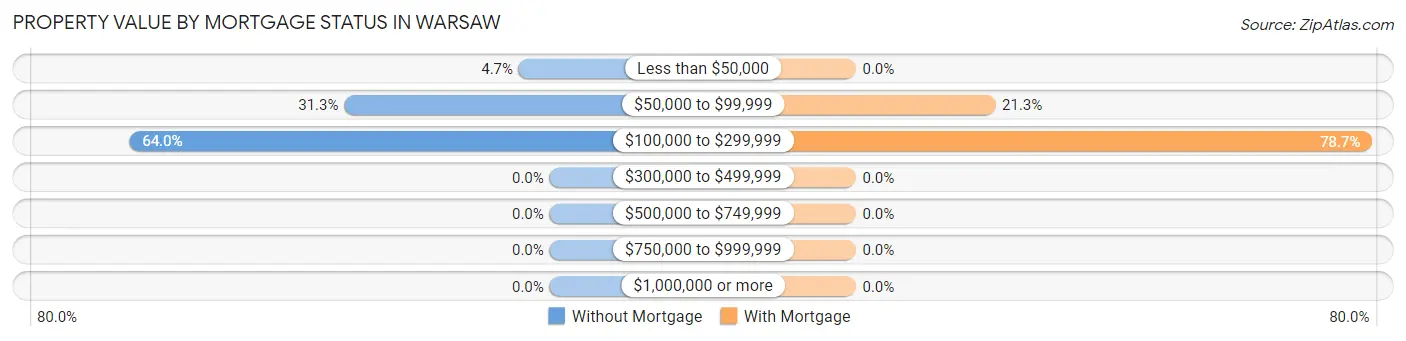
| Property Value | Without Mortgage | With Mortgage |
| Less than $50,000 | 22 (4.7%) | 0 (0.0%) |
| $50,000 to $99,999 | 147 (31.3%) | 67 (21.3%) |
| $100,000 to $299,999 | 301 (64.0%) | 248 (78.7%) |
| $300,000 to $499,999 | 0 (0.0%) | 0 (0.0%) |
| $500,000 to $749,999 | 0 (0.0%) | 0 (0.0%) |
| $750,000 to $999,999 | 0 (0.0%) | 0 (0.0%) |
| $1,000,000 or more | 0 (0.0%) | 0 (0.0%) |
| Total | 470 (100.0%) | 315 (100.0%) |
Household Income by Mortgage Status in Warsaw
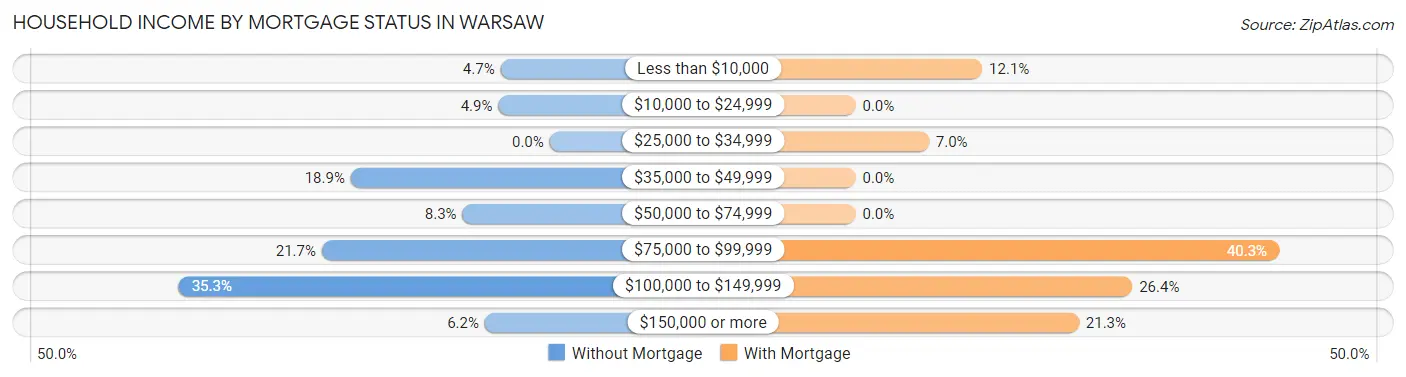
| Household Income | Without Mortgage | With Mortgage |
| Less than $10,000 | 22 (4.7%) | 38 (12.1%) |
| $10,000 to $24,999 | 23 (4.9%) | 0 (0.0%) |
| $25,000 to $34,999 | 0 (0.0%) | 22 (7.0%) |
| $35,000 to $49,999 | 89 (18.9%) | 0 (0.0%) |
| $50,000 to $74,999 | 39 (8.3%) | 0 (0.0%) |
| $75,000 to $99,999 | 102 (21.7%) | 127 (40.3%) |
| $100,000 to $149,999 | 166 (35.3%) | 83 (26.4%) |
| $150,000 or more | 29 (6.2%) | 67 (21.3%) |
| Total | 470 (100.0%) | 315 (100.0%) |
Property Value to Household Income Ratio in Warsaw
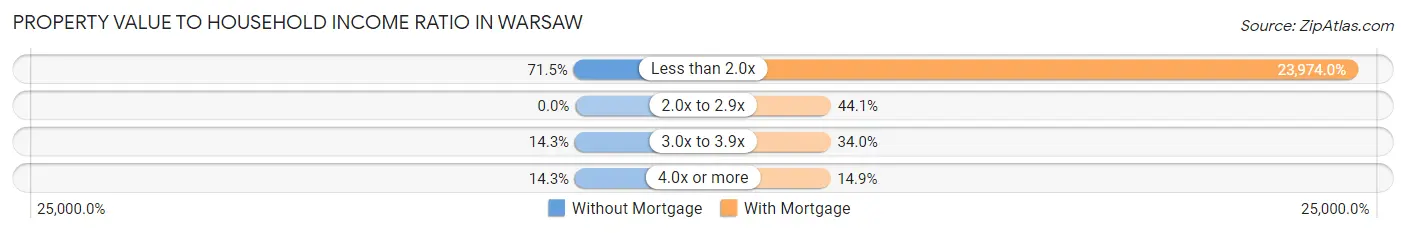
| Value-to-Income Ratio | Without Mortgage | With Mortgage |
| Less than 2.0x | 336 (71.5%) | 75,518 (23,974.0%) |
| 2.0x to 2.9x | 0 (0.0%) | 139 (44.1%) |
| 3.0x to 3.9x | 67 (14.3%) | 107 (34.0%) |
| 4.0x or more | 67 (14.3%) | 47 (14.9%) |
| Total | 470 (100.0%) | 315 (100.0%) |
Real Estate Taxes by Mortgage Status in Warsaw
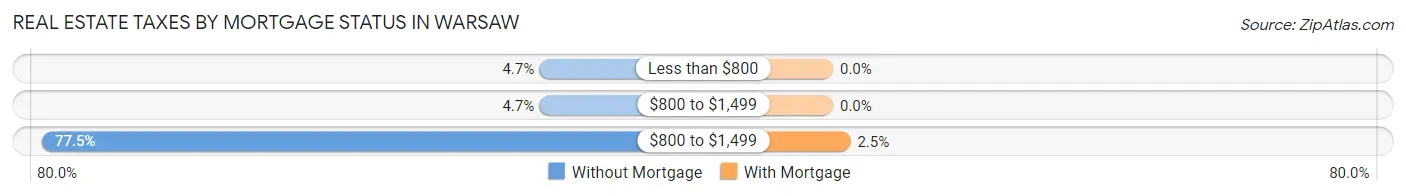
| Property Taxes | Without Mortgage | With Mortgage |
| Less than $800 | 22 (4.7%) | 0 (0.0%) |
| $800 to $1,499 | 22 (4.7%) | 0 (0.0%) |
| $800 to $1,499 | 364 (77.4%) | 8 (2.5%) |
| Total | 470 (100.0%) | 315 (100.0%) |
Health & Disability in Warsaw
Health Insurance Coverage by Age in Warsaw
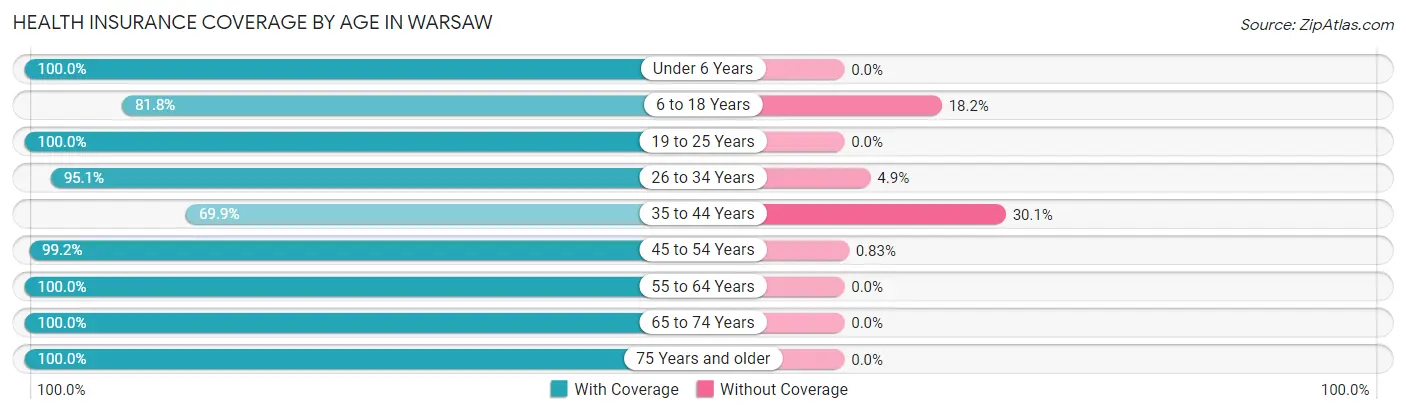
| Age Bracket | With Coverage | Without Coverage |
| Under 6 Years | 57 (100.0%) | 0 (0.0%) |
| 6 to 18 Years | 302 (81.8%) | 67 (18.2%) |
| 19 to 25 Years | 203 (100.0%) | 0 (0.0%) |
| 26 to 34 Years | 293 (95.1%) | 15 (4.9%) |
| 35 to 44 Years | 216 (69.9%) | 93 (30.1%) |
| 45 to 54 Years | 239 (99.2%) | 2 (0.8%) |
| 55 to 64 Years | 629 (100.0%) | 0 (0.0%) |
| 65 to 74 Years | 524 (100.0%) | 0 (0.0%) |
| 75 Years and older | 170 (100.0%) | 0 (0.0%) |
| Total | 2,633 (93.7%) | 177 (6.3%) |
Health Insurance Coverage by Citizenship Status in Warsaw
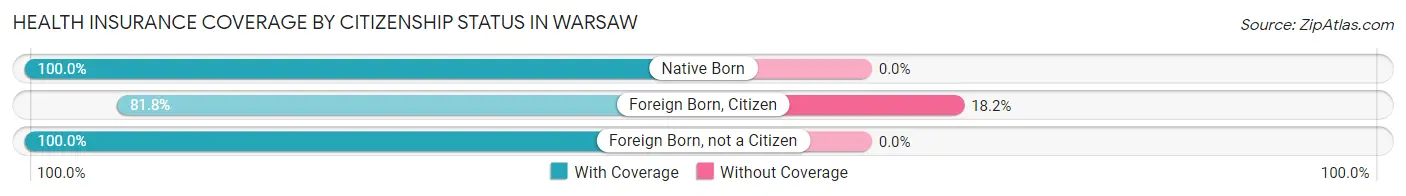
| Citizenship Status | With Coverage | Without Coverage |
| Native Born | 57 (100.0%) | 0 (0.0%) |
| Foreign Born, Citizen | 302 (81.8%) | 67 (18.2%) |
| Foreign Born, not a Citizen | 203 (100.0%) | 0 (0.0%) |
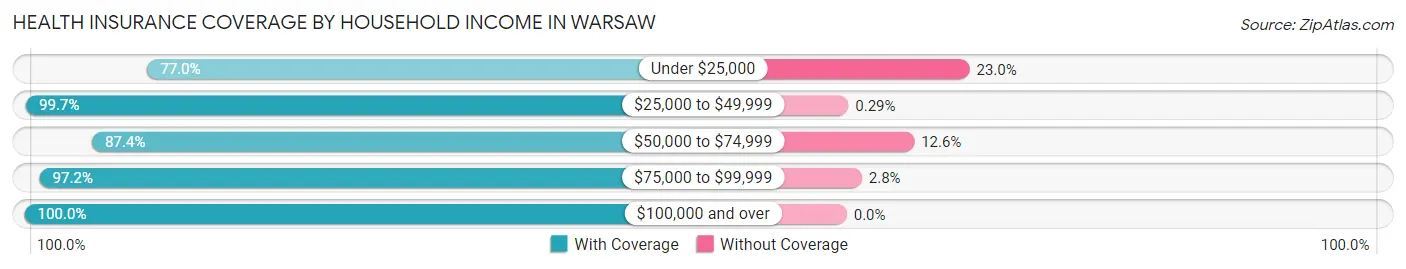
Health Insurance Coverage by Household Income in Warsaw
| Household Income | With Coverage | Without Coverage |
| Under $25,000 | 375 (77.0%) | 112 (23.0%) |
| $25,000 to $49,999 | 698 (99.7%) | 2 (0.3%) |
| $50,000 to $74,999 | 332 (87.4%) | 48 (12.6%) |
| $75,000 to $99,999 | 516 (97.2%) | 15 (2.8%) |
| $100,000 and over | 671 (100.0%) | 0 (0.0%) |
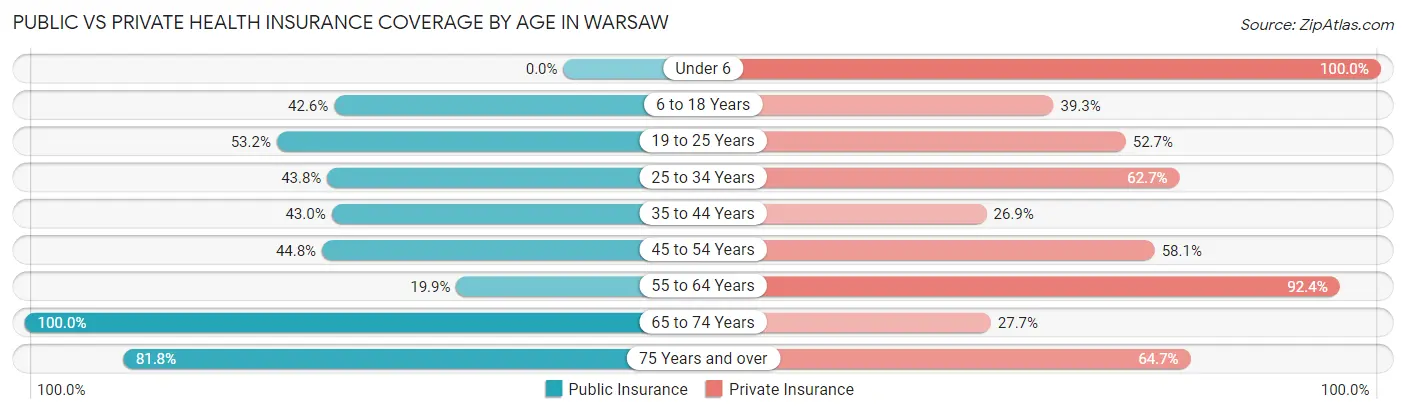
Public vs Private Health Insurance Coverage by Age in Warsaw
| Age Bracket | Public Insurance | Private Insurance |
| Under 6 | 0 (0.0%) | 57 (100.0%) |
| 6 to 18 Years | 157 (42.5%) | 145 (39.3%) |
| 19 to 25 Years | 108 (53.2%) | 107 (52.7%) |
| 25 to 34 Years | 135 (43.8%) | 193 (62.7%) |
| 35 to 44 Years | 133 (43.0%) | 83 (26.9%) |
| 45 to 54 Years | 108 (44.8%) | 140 (58.1%) |
| 55 to 64 Years | 125 (19.9%) | 581 (92.4%) |
| 65 to 74 Years | 524 (100.0%) | 145 (27.7%) |
| 75 Years and over | 139 (81.8%) | 110 (64.7%) |
| Total | 1,429 (50.8%) | 1,561 (55.5%) |
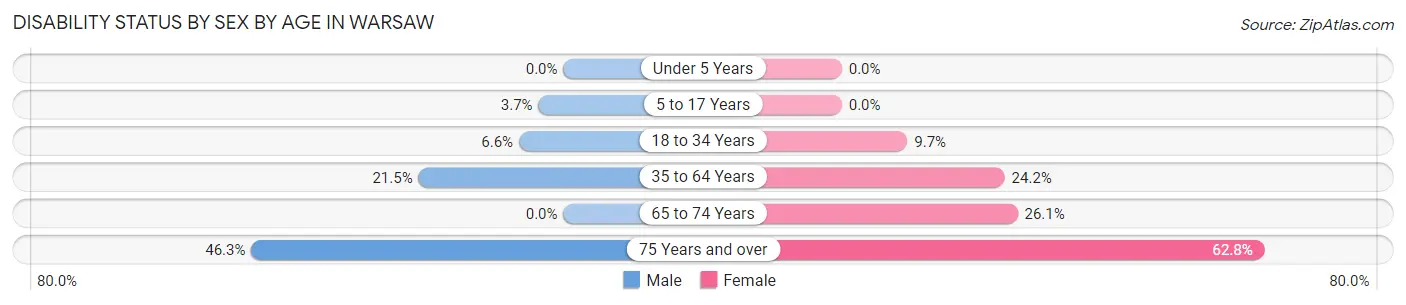
Disability Status by Sex by Age in Warsaw
| Age Bracket | Male | Female |
| Under 5 Years | 0 (0.0%) | 0 (0.0%) |
| 5 to 17 Years | 7 (3.7%) | 0 (0.0%) |
| 18 to 34 Years | 18 (6.6%) | 25 (9.7%) |
| 35 to 64 Years | 97 (21.5%) | 176 (24.2%) |
| 65 to 74 Years | 0 (0.0%) | 95 (26.1%) |
| 75 Years and over | 19 (46.3%) | 81 (62.8%) |
Disability Class by Sex by Age in Warsaw
Disability Class: Hearing Difficulty
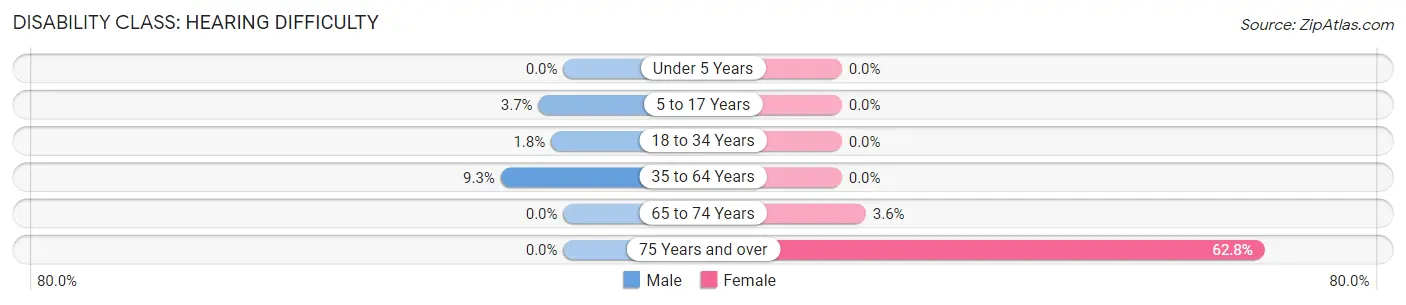
| Age Bracket | Male | Female |
| Under 5 Years | 0 (0.0%) | 0 (0.0%) |
| 5 to 17 Years | 7 (3.7%) | 0 (0.0%) |
| 18 to 34 Years | 5 (1.8%) | 0 (0.0%) |
| 35 to 64 Years | 42 (9.3%) | 0 (0.0%) |
| 65 to 74 Years | 0 (0.0%) | 13 (3.6%) |
| 75 Years and over | 0 (0.0%) | 81 (62.8%) |
Disability Class: Vision Difficulty
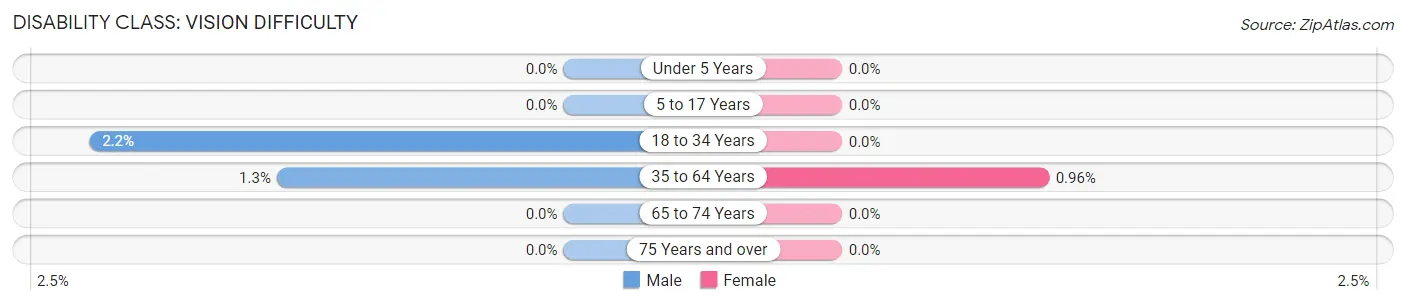
| Age Bracket | Male | Female |
| Under 5 Years | 0 (0.0%) | 0 (0.0%) |
| 5 to 17 Years | 0 (0.0%) | 0 (0.0%) |
| 18 to 34 Years | 6 (2.2%) | 0 (0.0%) |
| 35 to 64 Years | 6 (1.3%) | 7 (1.0%) |
| 65 to 74 Years | 0 (0.0%) | 0 (0.0%) |
| 75 Years and over | 0 (0.0%) | 0 (0.0%) |
Disability Class: Cognitive Difficulty
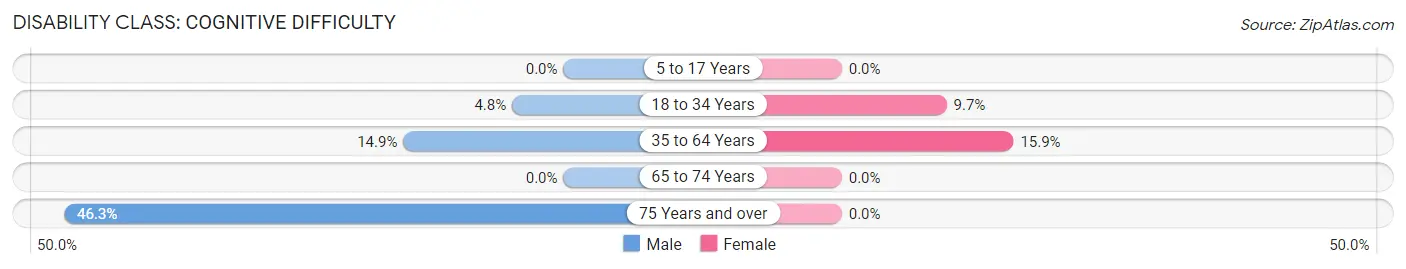
| Age Bracket | Male | Female |
| 5 to 17 Years | 0 (0.0%) | 0 (0.0%) |
| 18 to 34 Years | 13 (4.8%) | 25 (9.7%) |
| 35 to 64 Years | 67 (14.9%) | 116 (15.9%) |
| 65 to 74 Years | 0 (0.0%) | 0 (0.0%) |
| 75 Years and over | 19 (46.3%) | 0 (0.0%) |
Disability Class: Ambulatory Difficulty
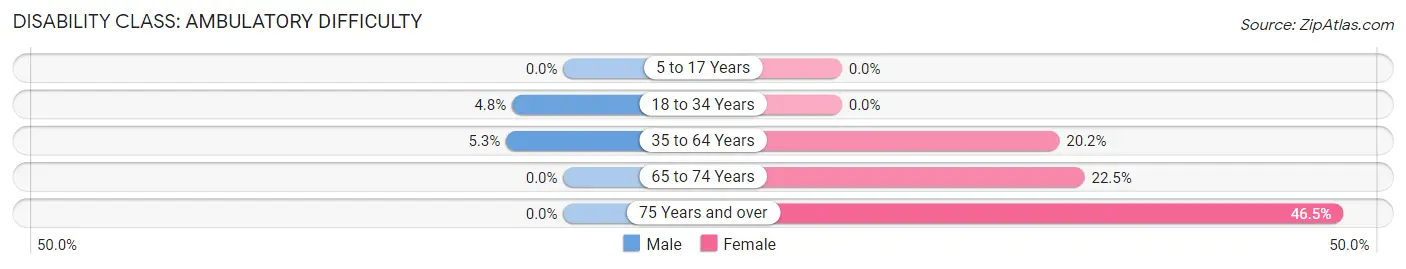
| Age Bracket | Male | Female |
| 5 to 17 Years | 0 (0.0%) | 0 (0.0%) |
| 18 to 34 Years | 13 (4.8%) | 0 (0.0%) |
| 35 to 64 Years | 24 (5.3%) | 147 (20.2%) |
| 65 to 74 Years | 0 (0.0%) | 82 (22.5%) |
| 75 Years and over | 0 (0.0%) | 60 (46.5%) |
Disability Class: Self-Care Difficulty
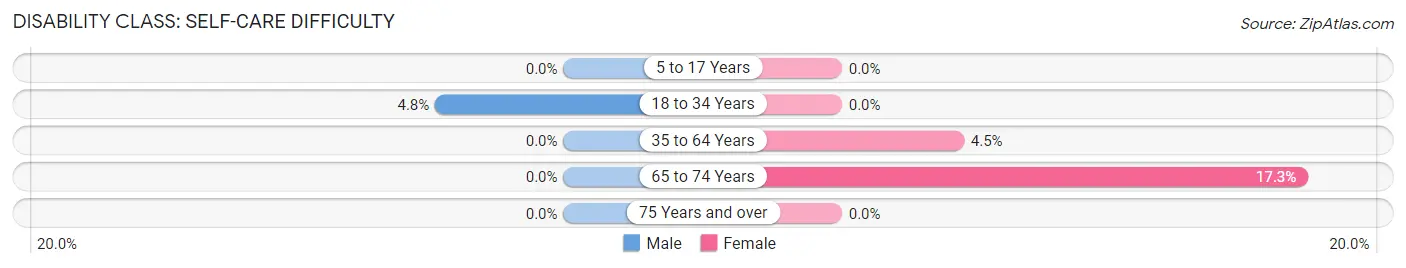
| Age Bracket | Male | Female |
| 5 to 17 Years | 0 (0.0%) | 0 (0.0%) |
| 18 to 34 Years | 13 (4.8%) | 0 (0.0%) |
| 35 to 64 Years | 0 (0.0%) | 33 (4.5%) |
| 65 to 74 Years | 0 (0.0%) | 63 (17.3%) |
| 75 Years and over | 0 (0.0%) | 0 (0.0%) |
Technology Access in Warsaw
Computing Device Access in Warsaw
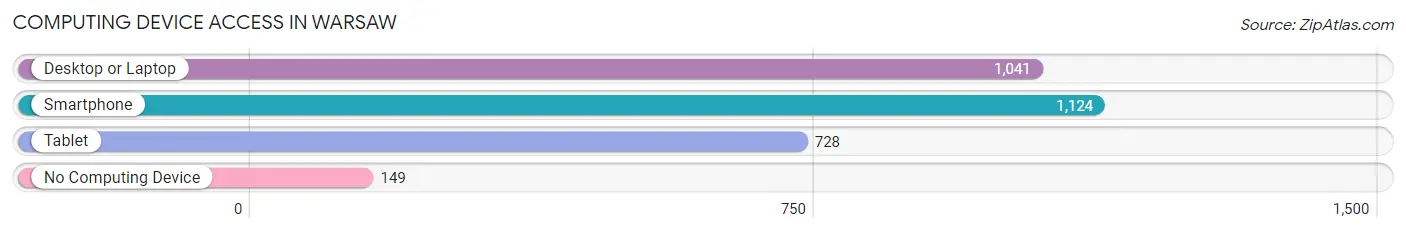
| Device Type | # Households | % Households |
| Desktop or Laptop | 1,041 | 73.0% |
| Smartphone | 1,124 | 78.8% |
| Tablet | 728 | 51.0% |
| No Computing Device | 149 | 10.4% |
| Total | 1,426 | 100.0% |
Internet Access in Warsaw
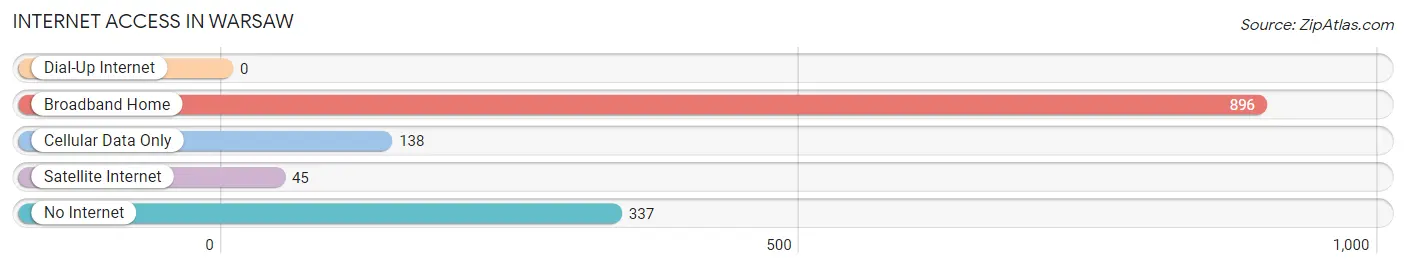
| Internet Type | # Households | % Households |
| Dial-Up Internet | 0 | 0.0% |
| Broadband Home | 896 | 62.8% |
| Cellular Data Only | 138 | 9.7% |
| Satellite Internet | 45 | 3.2% |
| No Internet | 337 | 23.6% |
| Total | 1,426 | 100.0% |
Warsaw Summary
Warsaw, New York is a small town located in Wyoming County, New York. It is situated on the banks of the Genesee River and is the county seat of Wyoming County. The town was founded in 1803 and has a population of approximately 4,500 people.
Geography
Warsaw is located in the western part of Wyoming County, New York. It is situated on the banks of the Genesee River and is bordered by the towns of Attica, Bennington, Gainesville, and Perry. The town has a total area of 4.2 square miles, all of which is land. The terrain is mostly flat with some rolling hills. The highest point in the town is located at an elevation of 1,068 feet.
Climate
The climate in Warsaw is classified as humid continental, with cold winters and warm summers. The average annual temperature is around 48°F, with an average high of around 68°F in the summer and an average low of around 28°F in the winter. The average annual precipitation is around 37 inches, with the majority of it falling in the form of snow.
Demographics
As of the 2010 census, the population of Warsaw was 4,484. The racial makeup of the town was 97.3% White, 0.7% African American, 0.3% Native American, 0.3% Asian, 0.1% Pacific Islander, 0.3% from other races, and 1.0% from two or more races. Hispanic or Latino of any race were 1.3% of the population.
Economy
The economy of Warsaw is largely based on agriculture and manufacturing. The town is home to several large farms, as well as several small businesses. The town is also home to several manufacturing companies, including a plastics manufacturer, a furniture manufacturer, and a metal fabrication company.
History
The area that is now Warsaw was first settled in the late 1700s by settlers from Connecticut. The town was officially founded in 1803 and was named after the city of Warsaw in Poland. The town quickly grew and became an important center for trade and commerce in the region. In 1812, the town was chosen as the county seat of Wyoming County.
In the late 1800s, the town experienced a period of growth and prosperity. Several new businesses were established, including a flour mill, a sawmill, and a tannery. The town also became a popular tourist destination, with several hotels and resorts being built in the area.
In the early 1900s, the town experienced a period of decline. Several businesses closed and the population began to decline. The town experienced a resurgence in the mid-1900s, with several new businesses opening and the population increasing.
Today, Warsaw is a small town with a population of around 4,500 people. The town is still largely agricultural, with several farms and businesses located in the area. The town is also home to several manufacturing companies, as well as several small businesses. The town is a popular tourist destination, with several hotels and resorts located in the area.
Common Questions
What is Per Capita Income in Warsaw?
Per Capita income in Warsaw is $30,132.
What is the Median Family Income in Warsaw?
Median Family Income in Warsaw is $74,545.
What is the Median Household income in Warsaw?
Median Household Income in Warsaw is $50,000.
What is Income or Wage Gap in Warsaw?
Income or Wage Gap in Warsaw is 12.7%.
Women in Warsaw earn 87.3 cents for every dollar earned by a man.
What is Inequality or Gini Index in Warsaw?
Inequality or Gini Index in Warsaw is 0.41.
What is the Total Population of Warsaw?
Total Population of Warsaw is 2,937.
What is the Total Male Population of Warsaw?
Total Male Population of Warsaw is 1,229.
What is the Total Female Population of Warsaw?
Total Female Population of Warsaw is 1,708.
What is the Ratio of Males per 100 Females in Warsaw?
There are 71.96 Males per 100 Females in Warsaw.
What is the Ratio of Females per 100 Males in Warsaw?
There are 138.97 Females per 100 Males in Warsaw.
What is the Median Population Age in Warsaw?
Median Population Age in Warsaw is 52.6 Years.
What is the Average Family Size in Warsaw
Average Family Size in Warsaw is 2.5 People.
What is the Average Household Size in Warsaw
Average Household Size in Warsaw is 1.9 People.
How Large is the Labor Force in Warsaw?
There are 1,331 People in the Labor Forcein in Warsaw.
What is the Percentage of People in the Labor Force in Warsaw?
51.6% of People are in the Labor Force in Warsaw.
What is the Unemployment Rate in Warsaw?
Unemployment Rate in Warsaw is 8.8%.