Village of the Branch, NY Map & Demographics
Village of the Branch Map
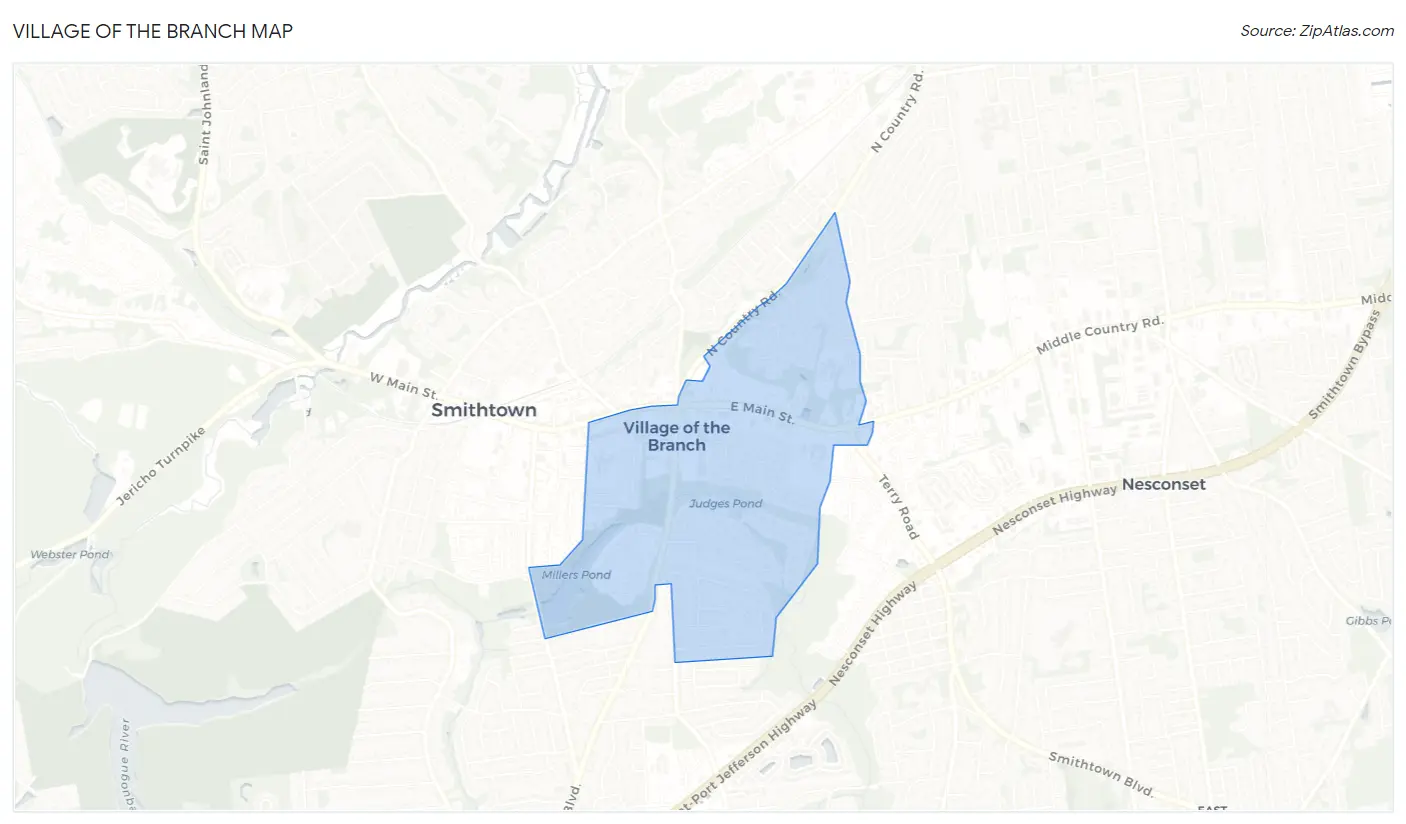
Village of the Branch Overview
$64,330
PER CAPITA INCOME
$205,859
AVG FAMILY INCOME
$173,594
AVG HOUSEHOLD INCOME
43.7%
WAGE / INCOME GAP [ % ]
56.3¢/ $1
WAGE / INCOME GAP [ $ ]
0.38
INEQUALITY / GINI INDEX
1,747
TOTAL POPULATION
816
MALE POPULATION
931
FEMALE POPULATION
87.65
MALES / 100 FEMALES
114.09
FEMALES / 100 MALES
48.0
MEDIAN AGE
3.6
AVG FAMILY SIZE
3.2
AVG HOUSEHOLD SIZE
871
LABOR FORCE [ PEOPLE ]
58.6%
PERCENT IN LABOR FORCE
5.6%
UNEMPLOYMENT RATE
Income in Village of the Branch
Income Overview in Village of the Branch
Per Capita Income in Village of the Branch is $64,330, while median incomes of families and households are $205,859 and $173,594 respectively.
| Characteristic | Number | Measure |
| Per Capita Income | 1,747 | $64,330 |
| Median Family Income | 429 | $205,859 |
| Mean Family Income | 429 | $232,712 |
| Median Household Income | 522 | $173,594 |
| Mean Household Income | 522 | $205,497 |
| Income Deficit | 429 | $0 |
| Wage / Income Gap (%) | 1,747 | 43.73% |
| Wage / Income Gap ($) | 1,747 | 56.27¢ per $1 |
| Gini / Inequality Index | 1,747 | 0.38 |
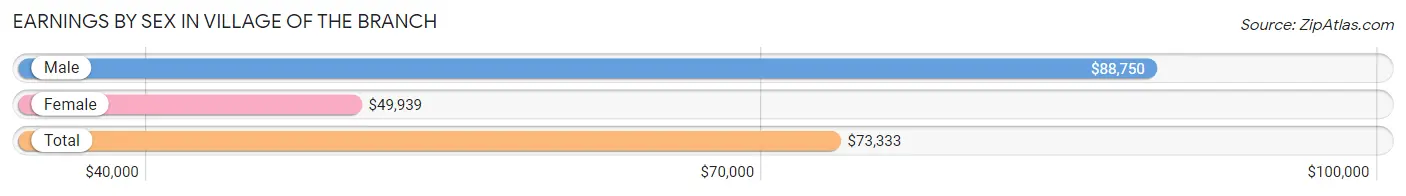
Earnings by Sex in Village of the Branch
Average Earnings in Village of the Branch are $73,333, $88,750 for men and $49,939 for women, a difference of 43.7%.
| Sex | Number | Average Earnings |
| Male | 502 (54.4%) | $88,750 |
| Female | 420 (45.6%) | $49,939 |
| Total | 922 (100.0%) | $73,333 |
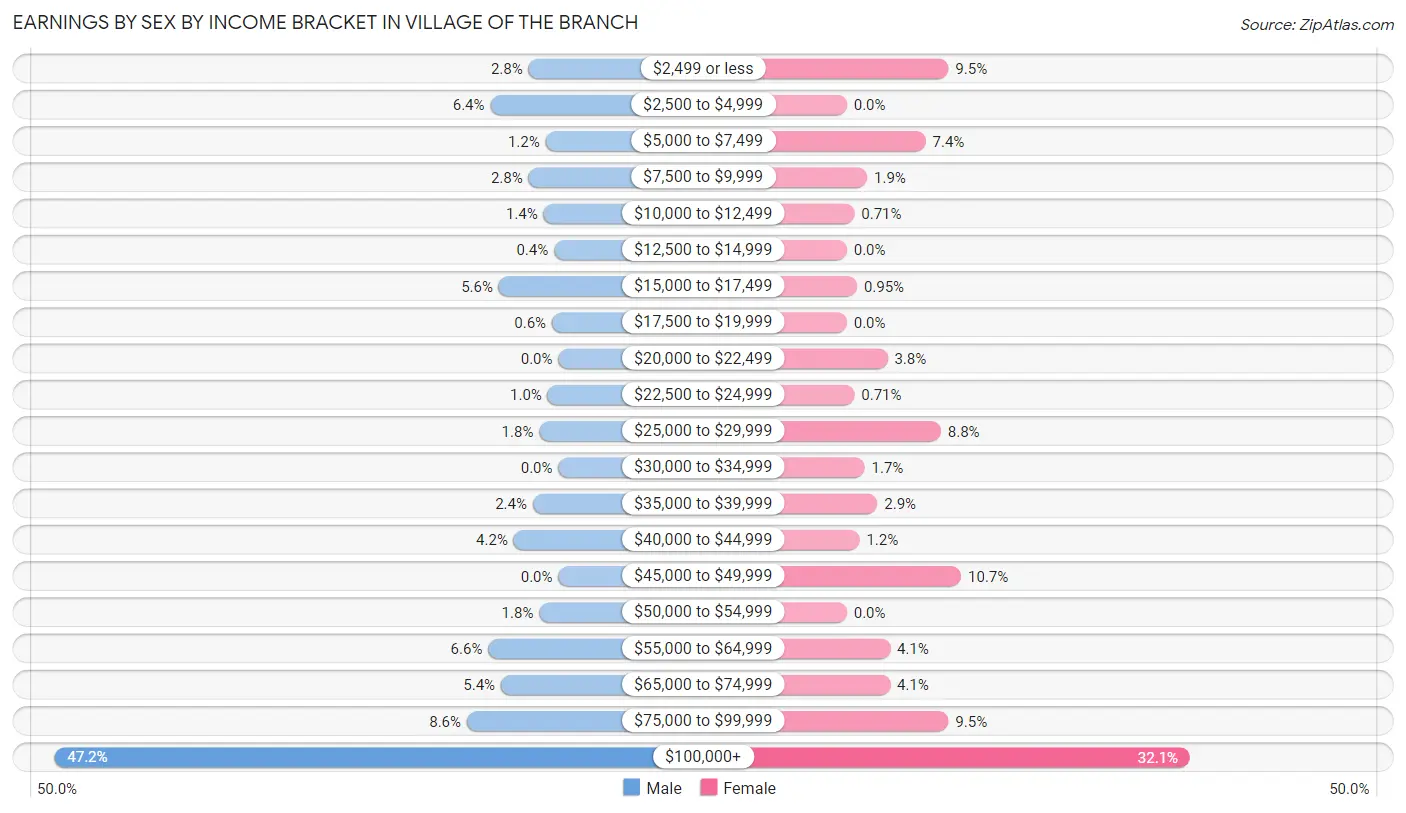
Earnings by Sex by Income Bracket in Village of the Branch
The most common earnings brackets in Village of the Branch are $100,000+ for men (237 | 47.2%) and $100,000+ for women (135 | 32.1%).
| Income | Male | Female |
| $2,499 or less | 14 (2.8%) | 40 (9.5%) |
| $2,500 to $4,999 | 32 (6.4%) | 0 (0.0%) |
| $5,000 to $7,499 | 6 (1.2%) | 31 (7.4%) |
| $7,500 to $9,999 | 14 (2.8%) | 8 (1.9%) |
| $10,000 to $12,499 | 7 (1.4%) | 3 (0.7%) |
| $12,500 to $14,999 | 2 (0.4%) | 0 (0.0%) |
| $15,000 to $17,499 | 28 (5.6%) | 4 (0.9%) |
| $17,500 to $19,999 | 3 (0.6%) | 0 (0.0%) |
| $20,000 to $22,499 | 0 (0.0%) | 16 (3.8%) |
| $22,500 to $24,999 | 5 (1.0%) | 3 (0.7%) |
| $25,000 to $29,999 | 9 (1.8%) | 37 (8.8%) |
| $30,000 to $34,999 | 0 (0.0%) | 7 (1.7%) |
| $35,000 to $39,999 | 12 (2.4%) | 12 (2.9%) |
| $40,000 to $44,999 | 21 (4.2%) | 5 (1.2%) |
| $45,000 to $49,999 | 0 (0.0%) | 45 (10.7%) |
| $50,000 to $54,999 | 9 (1.8%) | 0 (0.0%) |
| $55,000 to $64,999 | 33 (6.6%) | 17 (4.1%) |
| $65,000 to $74,999 | 27 (5.4%) | 17 (4.1%) |
| $75,000 to $99,999 | 43 (8.6%) | 40 (9.5%) |
| $100,000+ | 237 (47.2%) | 135 (32.1%) |
| Total | 502 (100.0%) | 420 (100.0%) |
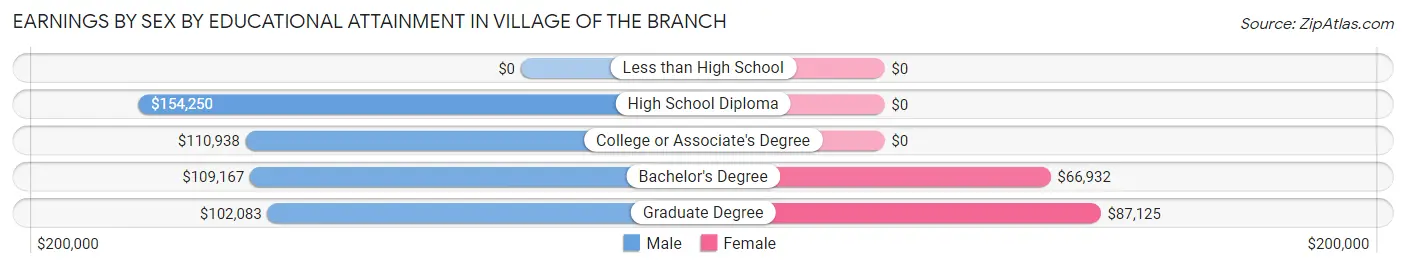
Earnings by Sex by Educational Attainment in Village of the Branch
Average earnings in Village of the Branch are $112,188 for men and $83,594 for women, a difference of 25.5%. Men with an educational attainment of high school diploma enjoy the highest average annual earnings of $154,250, while those with graduate degree education earn the least with $102,083. Women with an educational attainment of graduate degree earn the most with the average annual earnings of $87,125, while those with bachelor's degree education have the smallest earnings of $66,932.
| Educational Attainment | Male Income | Female Income |
| Less than High School | - | - |
| High School Diploma | $154,250 | $0 |
| College or Associate's Degree | $110,938 | $0 |
| Bachelor's Degree | $109,167 | $66,932 |
| Graduate Degree | $102,083 | $87,125 |
| Total | $112,188 | $83,594 |
Family Income in Village of the Branch
Family Income Brackets in Village of the Branch
According to the Village of the Branch family income data, there are 220 families falling into the $200,000+ income range, which is the most common income bracket and makes up 51.3% of all families.
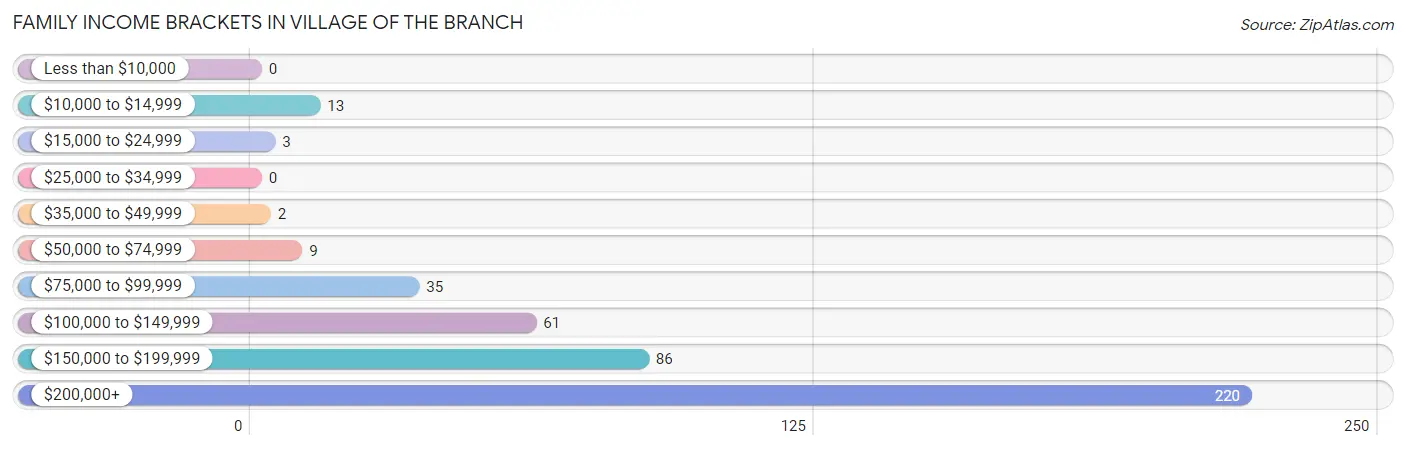
| Income Bracket | # Families | % Families |
| Less than $10,000 | 0 | 0.0% |
| $10,000 to $14,999 | 13 | 3.0% |
| $15,000 to $24,999 | 3 | 0.7% |
| $25,000 to $34,999 | 0 | 0.0% |
| $35,000 to $49,999 | 2 | 0.5% |
| $50,000 to $74,999 | 9 | 2.1% |
| $75,000 to $99,999 | 35 | 8.2% |
| $100,000 to $149,999 | 61 | 14.2% |
| $150,000 to $199,999 | 86 | 20.0% |
| $200,000+ | 220 | 51.3% |
Family Income by Famaliy Size in Village of the Branch
5-person families (47 | 11.0%) account for the highest median family income in Village of the Branch with $250,001 per family, while 2-person families (145 | 33.8%) have the highest median income of $72,890 per family member.
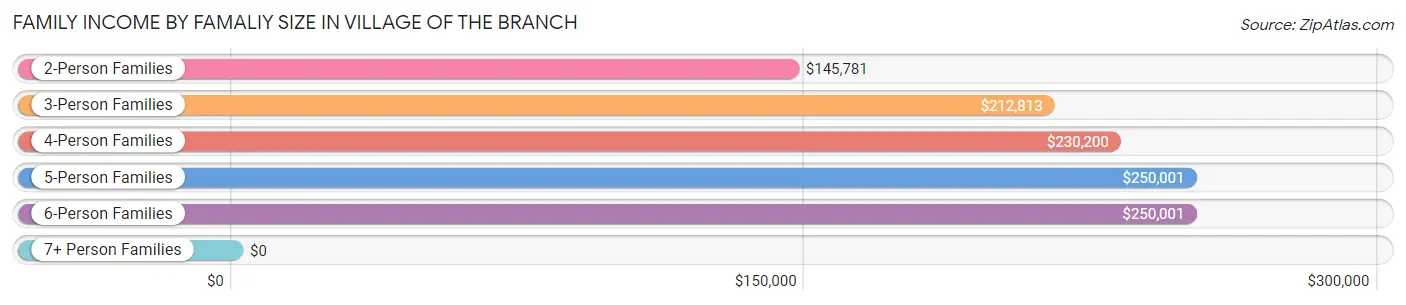
| Income Bracket | # Families | Median Income |
| 2-Person Families | 145 (33.8%) | $145,781 |
| 3-Person Families | 99 (23.1%) | $212,813 |
| 4-Person Families | 122 (28.4%) | $230,200 |
| 5-Person Families | 47 (11.0%) | $250,001 |
| 6-Person Families | 14 (3.3%) | $250,001 |
| 7+ Person Families | 2 (0.5%) | $0 |
| Total | 429 (100.0%) | $205,859 |
Family Income by Number of Earners in Village of the Branch
The median family income in Village of the Branch is $205,859, with families comprising 2 earners (178) having the highest median family income of $235,625, while families with no earners (65) have the lowest median family income of $82,344, accounting for 41.5% and 15.1% of families, respectively.
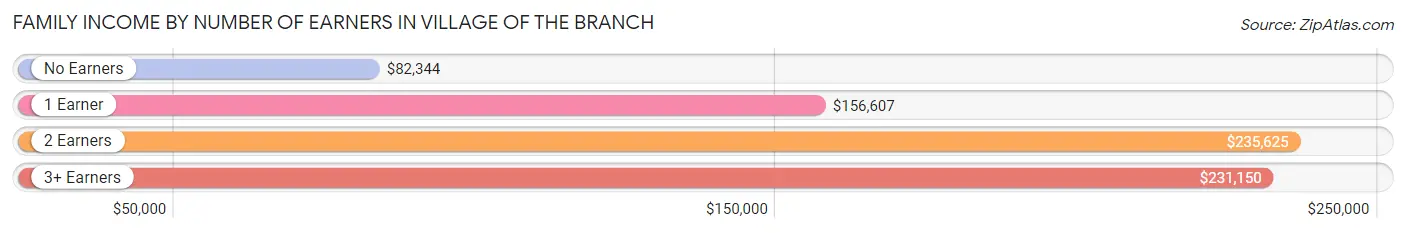
| Number of Earners | # Families | Median Income |
| No Earners | 65 (15.1%) | $82,344 |
| 1 Earner | 75 (17.5%) | $156,607 |
| 2 Earners | 178 (41.5%) | $235,625 |
| 3+ Earners | 111 (25.9%) | $231,150 |
| Total | 429 (100.0%) | $205,859 |
Household Income in Village of the Branch
Household Income Brackets in Village of the Branch
With 224 households falling in the category, the $200,000+ income range is the most frequent in Village of the Branch, accounting for 42.9% of all households.
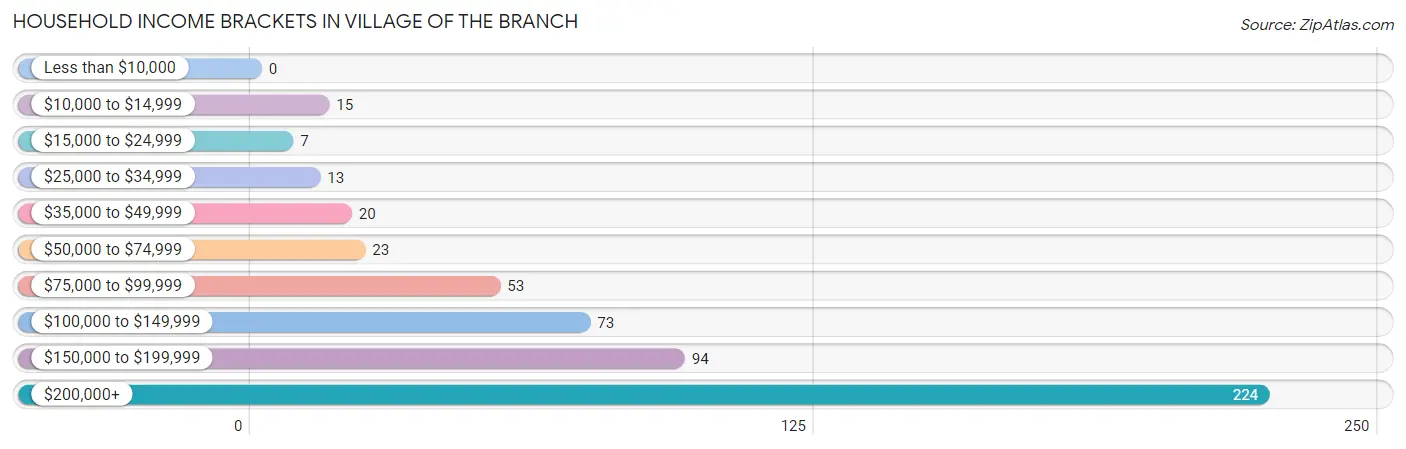
| Income Bracket | # Households | % Households |
| Less than $10,000 | 0 | 0.0% |
| $10,000 to $14,999 | 15 | 2.9% |
| $15,000 to $24,999 | 7 | 1.3% |
| $25,000 to $34,999 | 13 | 2.5% |
| $35,000 to $49,999 | 20 | 3.8% |
| $50,000 to $74,999 | 23 | 4.4% |
| $75,000 to $99,999 | 53 | 10.2% |
| $100,000 to $149,999 | 73 | 14.0% |
| $150,000 to $199,999 | 94 | 18.0% |
| $200,000+ | 224 | 42.9% |
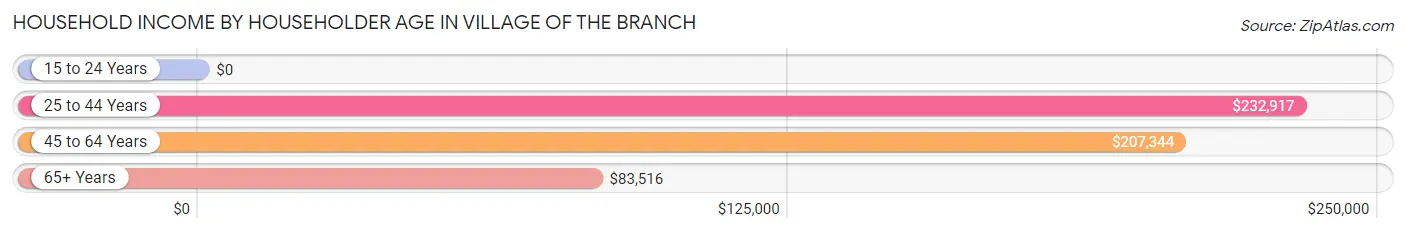
Household Income by Householder Age in Village of the Branch
The median household income in Village of the Branch is $173,594, with the highest median household income of $232,917 found in the 25 to 44 years age bracket for the primary householder. A total of 67 households (12.8%) fall into this category.
| Income Bracket | # Households | Median Income |
| 15 to 24 Years | 0 (0.0%) | $0 |
| 25 to 44 Years | 67 (12.8%) | $232,917 |
| 45 to 64 Years | 288 (55.2%) | $207,344 |
| 65+ Years | 167 (32.0%) | $83,516 |
| Total | 522 (100.0%) | $173,594 |
Poverty in Village of the Branch
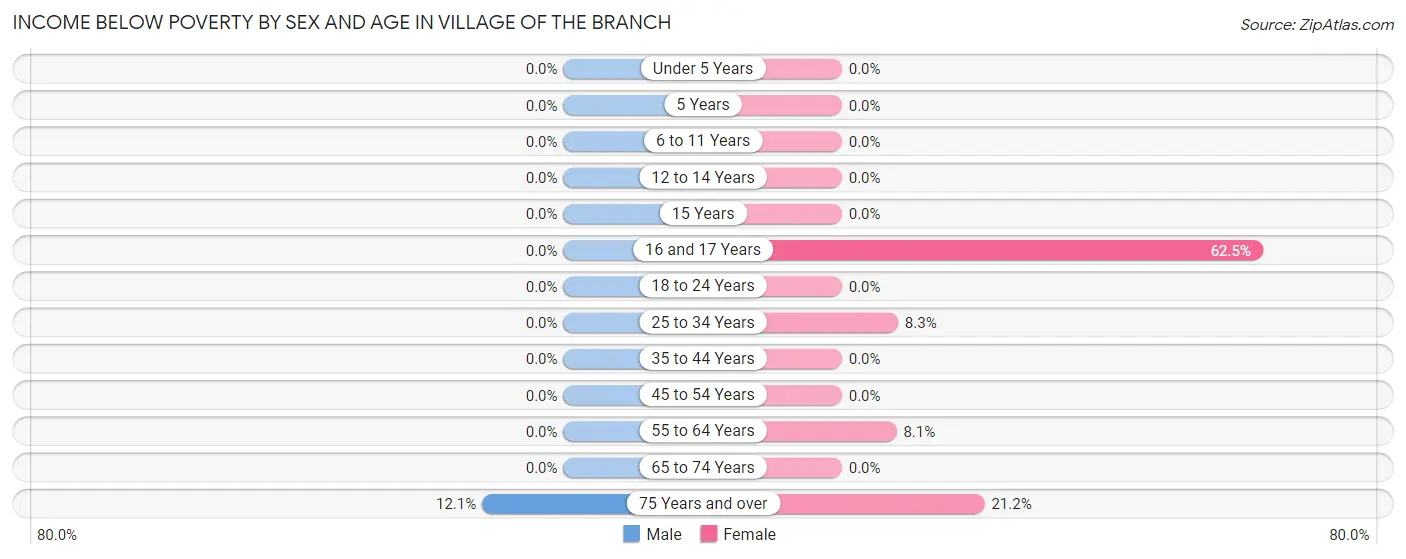
Income Below Poverty by Sex and Age in Village of the Branch
With 0.9% poverty level for males and 6.4% for females among the residents of Village of the Branch, 75 year old and over males and 16 and 17 year old females are the most vulnerable to poverty, with 7 males (12.1%) and 15 females (62.5%) in their respective age groups living below the poverty level.
| Age Bracket | Male | Female |
| Under 5 Years | 0 (0.0%) | 0 (0.0%) |
| 5 Years | 0 (0.0%) | 0 (0.0%) |
| 6 to 11 Years | 0 (0.0%) | 0 (0.0%) |
| 12 to 14 Years | 0 (0.0%) | 0 (0.0%) |
| 15 Years | 0 (0.0%) | 0 (0.0%) |
| 16 and 17 Years | 0 (0.0%) | 15 (62.5%) |
| 18 to 24 Years | 0 (0.0%) | 0 (0.0%) |
| 25 to 34 Years | 0 (0.0%) | 3 (8.3%) |
| 35 to 44 Years | 0 (0.0%) | 0 (0.0%) |
| 45 to 54 Years | 0 (0.0%) | 0 (0.0%) |
| 55 to 64 Years | 0 (0.0%) | 13 (8.1%) |
| 65 to 74 Years | 0 (0.0%) | 0 (0.0%) |
| 75 Years and over | 7 (12.1%) | 25 (21.2%) |
| Total | 7 (0.9%) | 56 (6.4%) |
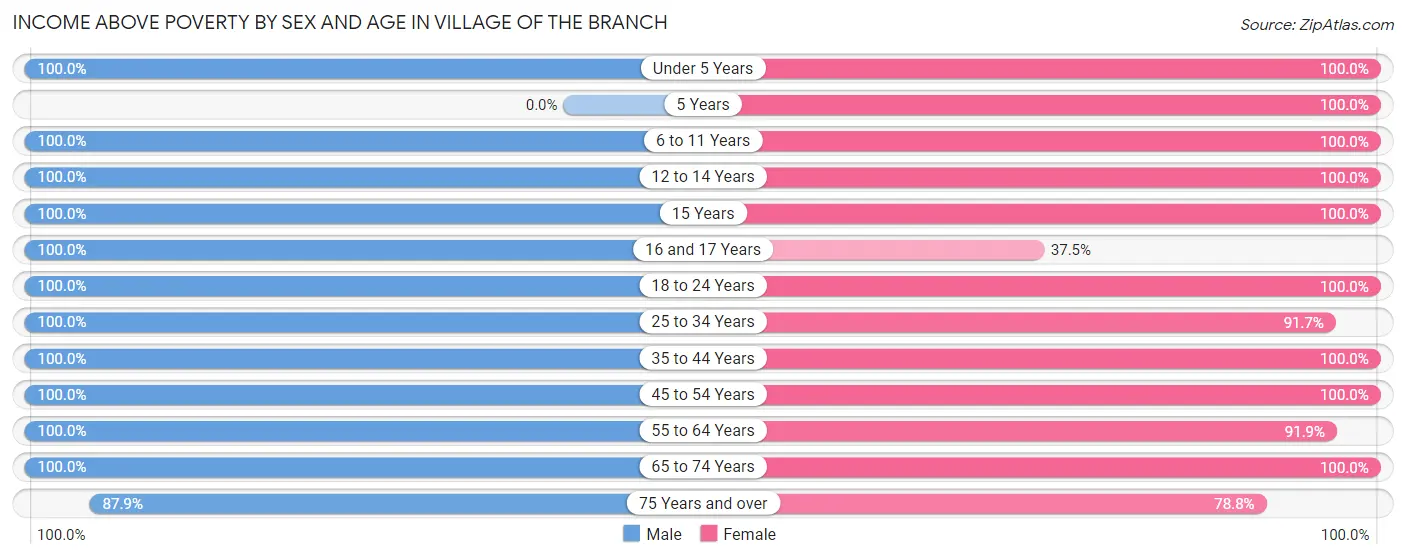
Income Above Poverty by Sex and Age in Village of the Branch
According to the poverty statistics in Village of the Branch, males aged under 5 years and females aged under 5 years are the age groups that are most secure financially, with 100.0% of males and 100.0% of females in these age groups living above the poverty line.
| Age Bracket | Male | Female |
| Under 5 Years | 33 (100.0%) | 41 (100.0%) |
| 5 Years | 0 (0.0%) | 10 (100.0%) |
| 6 to 11 Years | 39 (100.0%) | 37 (100.0%) |
| 12 to 14 Years | 23 (100.0%) | 46 (100.0%) |
| 15 Years | 9 (100.0%) | 22 (100.0%) |
| 16 and 17 Years | 32 (100.0%) | 9 (37.5%) |
| 18 to 24 Years | 73 (100.0%) | 146 (100.0%) |
| 25 to 34 Years | 131 (100.0%) | 33 (91.7%) |
| 35 to 44 Years | 51 (100.0%) | 66 (100.0%) |
| 45 to 54 Years | 106 (100.0%) | 96 (100.0%) |
| 55 to 64 Years | 180 (100.0%) | 147 (91.9%) |
| 65 to 74 Years | 73 (100.0%) | 76 (100.0%) |
| 75 Years and over | 51 (87.9%) | 93 (78.8%) |
| Total | 801 (99.1%) | 822 (93.6%) |
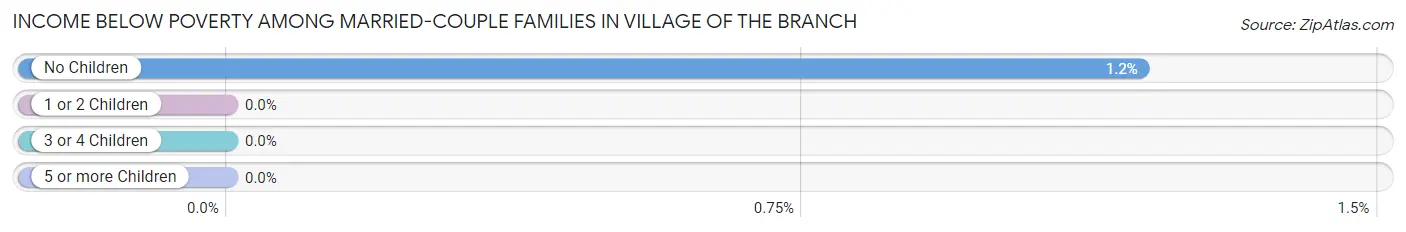
Income Below Poverty Among Married-Couple Families in Village of the Branch
The poverty statistics for married-couple families in Village of the Branch show that 0.7% or 3 of the total 400 families live below the poverty line. Families with no children have the highest poverty rate of 1.2%, comprising of 3 families. On the other hand, families with 1 or 2 children have the lowest poverty rate of 0.0%, which includes 0 families.
| Children | Above Poverty | Below Poverty |
| No Children | 250 (98.8%) | 3 (1.2%) |
| 1 or 2 Children | 124 (100.0%) | 0 (0.0%) |
| 3 or 4 Children | 23 (100.0%) | 0 (0.0%) |
| 5 or more Children | 0 (0.0%) | 0 (0.0%) |
| Total | 397 (99.3%) | 3 (0.7%) |
Income Below Poverty Among Single-Parent Households in Village of the Branch
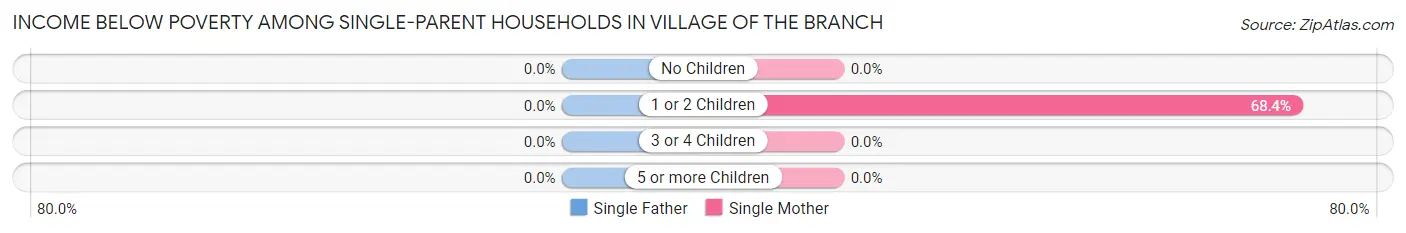
| Children | Single Father | Single Mother |
| No Children | 0 (0.0%) | 0 (0.0%) |
| 1 or 2 Children | 0 (0.0%) | 13 (68.4%) |
| 3 or 4 Children | 0 (0.0%) | 0 (0.0%) |
| 5 or more Children | 0 (0.0%) | 0 (0.0%) |
| Total | 0 (0.0%) | 13 (59.1%) |
Income Below Poverty Among Married-Couple vs Single-Parent Households in Village of the Branch
The poverty data for Village of the Branch shows that 3 of the married-couple family households (0.7%) and 13 of the single-parent households (44.8%) are living below the poverty level. Within the married-couple family households, those with no children have the highest poverty rate, with 3 households (1.2%) falling below the poverty line. Among the single-parent households, those with 1 or 2 children have the highest poverty rate, with 13 household (50.0%) living below poverty.
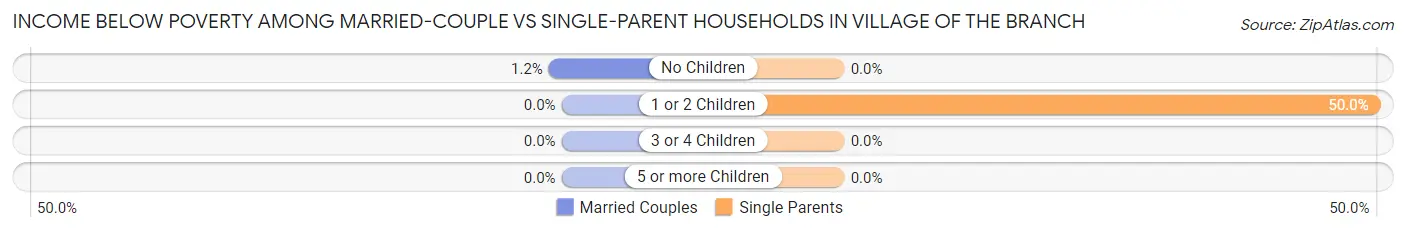
| Children | Married-Couple Families | Single-Parent Households |
| No Children | 3 (1.2%) | 0 (0.0%) |
| 1 or 2 Children | 0 (0.0%) | 13 (50.0%) |
| 3 or 4 Children | 0 (0.0%) | 0 (0.0%) |
| 5 or more Children | 0 (0.0%) | 0 (0.0%) |
| Total | 3 (0.7%) | 13 (44.8%) |
Race in Village of the Branch
The most populous races in Village of the Branch are White / Caucasian (1,580 | 90.4%), Asian (83 | 4.8%), and Hispanic or Latino (56 | 3.2%).
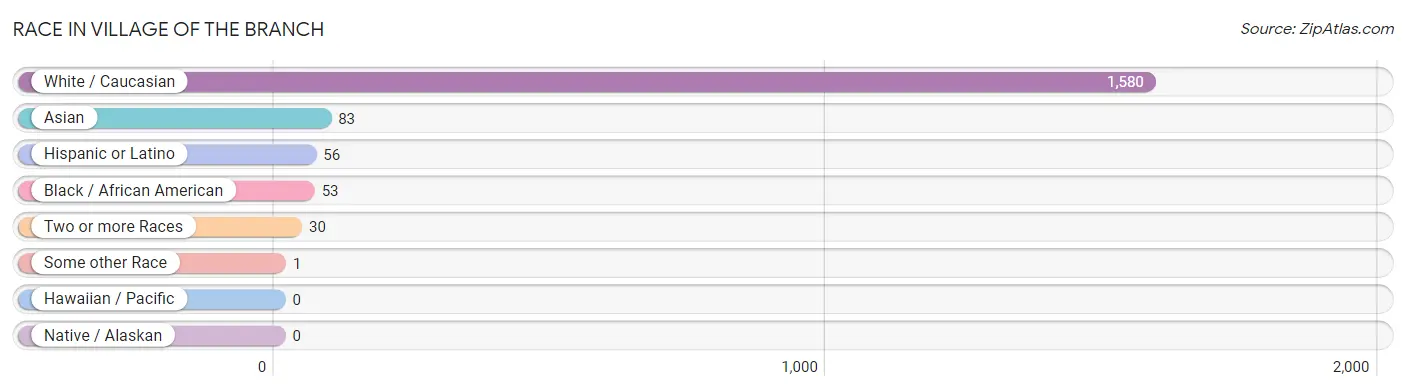
| Race | # Population | % Population |
| Asian | 83 | 4.8% |
| Black / African American | 53 | 3.0% |
| Hawaiian / Pacific | 0 | 0.0% |
| Hispanic or Latino | 56 | 3.2% |
| Native / Alaskan | 0 | 0.0% |
| White / Caucasian | 1,580 | 90.4% |
| Two or more Races | 30 | 1.7% |
| Some other Race | 1 | 0.1% |
| Total | 1,747 | 100.0% |
Ancestry in Village of the Branch
The most populous ancestries reported in Village of the Branch are Italian (562 | 32.2%), Irish (387 | 22.2%), German (301 | 17.2%), American (112 | 6.4%), and Polish (96 | 5.5%), together accounting for 83.5% of all Village of the Branch residents.
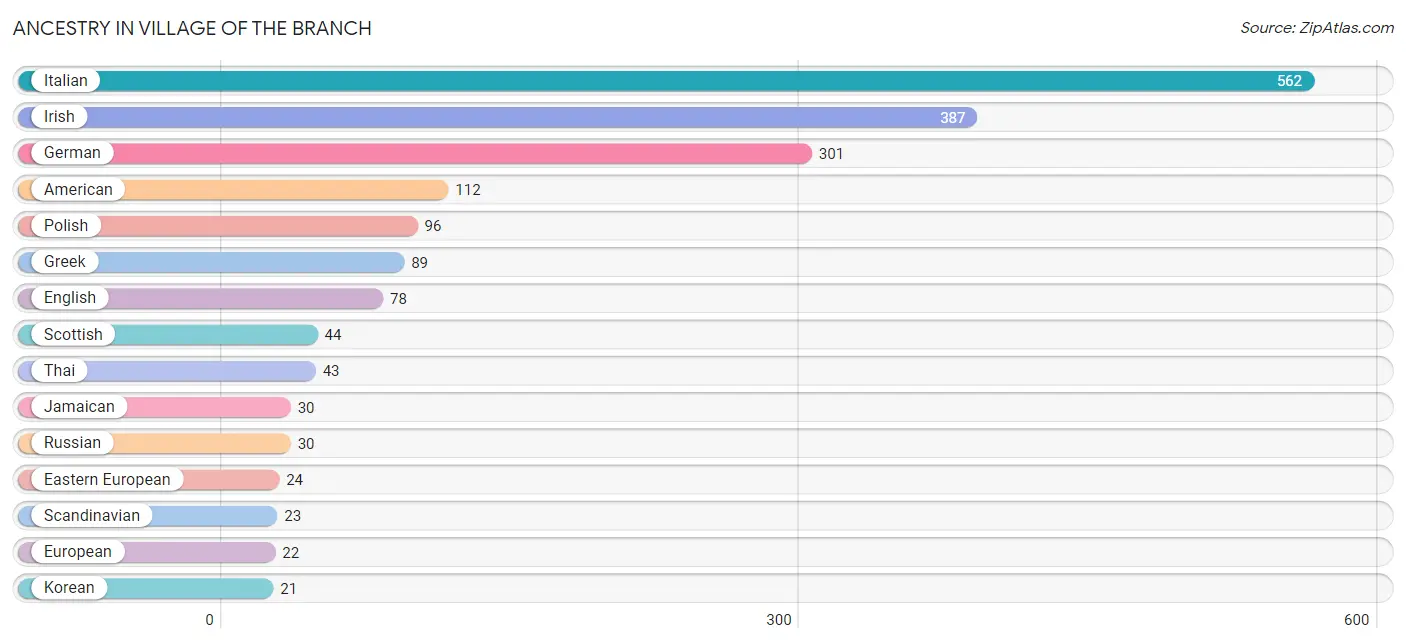
| Ancestry | # Population | % Population |
| American | 112 | 6.4% |
| Argentinean | 5 | 0.3% |
| Chilean | 2 | 0.1% |
| Colombian | 12 | 0.7% |
| Dutch | 3 | 0.2% |
| Eastern European | 24 | 1.4% |
| English | 78 | 4.5% |
| European | 22 | 1.3% |
| Finnish | 4 | 0.2% |
| French | 10 | 0.6% |
| German | 301 | 17.2% |
| Ghanaian | 2 | 0.1% |
| Greek | 89 | 5.1% |
| Haitian | 11 | 0.6% |
| Hungarian | 4 | 0.2% |
| Indian (Asian) | 6 | 0.3% |
| Irish | 387 | 22.2% |
| Italian | 562 | 32.2% |
| Jamaican | 30 | 1.7% |
| Korean | 21 | 1.2% |
| Lithuanian | 12 | 0.7% |
| Maltese | 13 | 0.7% |
| Mexican | 10 | 0.6% |
| Norwegian | 19 | 1.1% |
| Polish | 96 | 5.5% |
| Portuguese | 3 | 0.2% |
| Puerto Rican | 18 | 1.0% |
| Russian | 30 | 1.7% |
| Scandinavian | 23 | 1.3% |
| Scotch-Irish | 18 | 1.0% |
| Scottish | 44 | 2.5% |
| Slovak | 13 | 0.7% |
| South American | 19 | 1.1% |
| Spaniard | 9 | 0.5% |
| Subsaharan African | 4 | 0.2% |
| Swedish | 10 | 0.6% |
| Thai | 43 | 2.5% |
| Ukrainian | 3 | 0.2% |
| Welsh | 18 | 1.0% |
| Yugoslavian | 3 | 0.2% | View All 40 Rows |
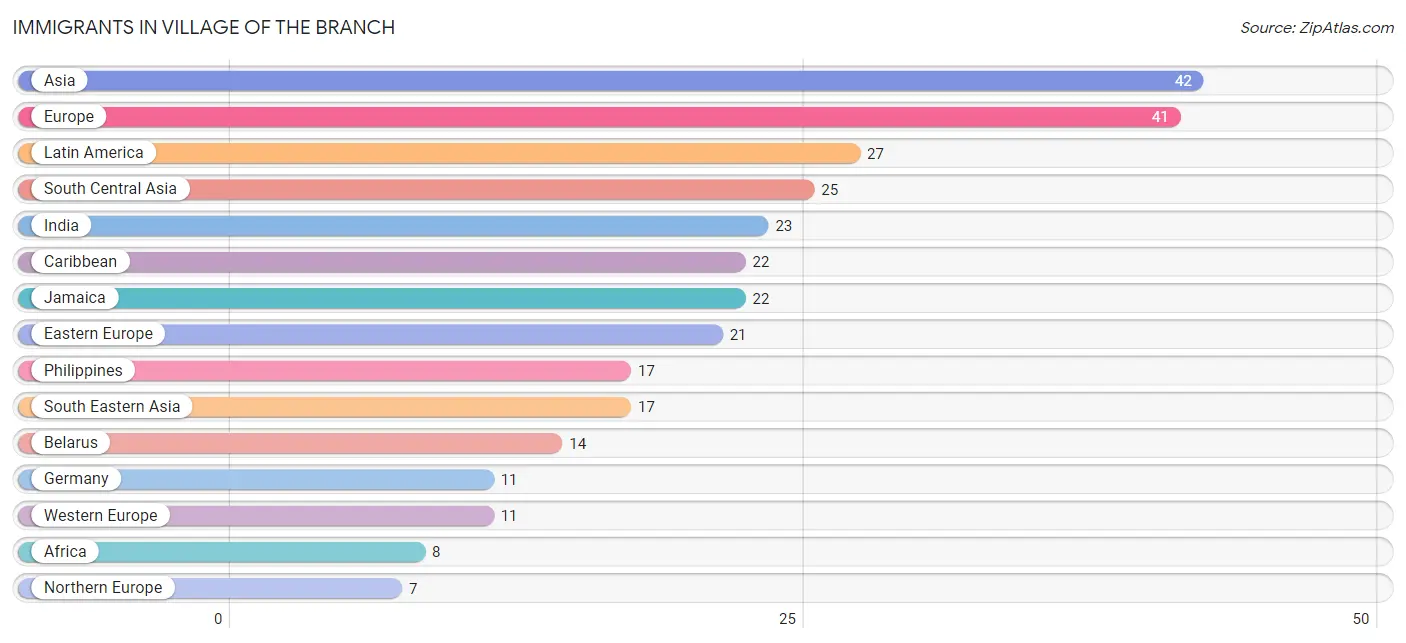
Immigrants in Village of the Branch
The most numerous immigrant groups reported in Village of the Branch came from Asia (42 | 2.4%), Europe (41 | 2.4%), Latin America (27 | 1.5%), South Central Asia (25 | 1.4%), and India (23 | 1.3%), together accounting for 9.1% of all Village of the Branch residents.
| Immigration Origin | # Population | % Population |
| Africa | 8 | 0.5% |
| Asia | 42 | 2.4% |
| Belarus | 14 | 0.8% |
| Brazil | 3 | 0.2% |
| Canada | 4 | 0.2% |
| Caribbean | 22 | 1.3% |
| Chile | 2 | 0.1% |
| Eastern Europe | 21 | 1.2% |
| Europe | 41 | 2.4% |
| Germany | 11 | 0.6% |
| Ghana | 2 | 0.1% |
| India | 23 | 1.3% |
| Ireland | 3 | 0.2% |
| Italy | 2 | 0.1% |
| Jamaica | 22 | 1.3% |
| Latin America | 27 | 1.5% |
| Middle Africa | 2 | 0.1% |
| Nigeria | 4 | 0.2% |
| Northern Europe | 7 | 0.4% |
| Philippines | 17 | 1.0% |
| Poland | 4 | 0.2% |
| Russia | 3 | 0.2% |
| Scotland | 4 | 0.2% |
| South America | 5 | 0.3% |
| South Central Asia | 25 | 1.4% |
| South Eastern Asia | 17 | 1.0% |
| Southern Europe | 2 | 0.1% |
| Western Africa | 6 | 0.3% |
| Western Europe | 11 | 0.6% |
| Zaire | 2 | 0.1% | View All 30 Rows |
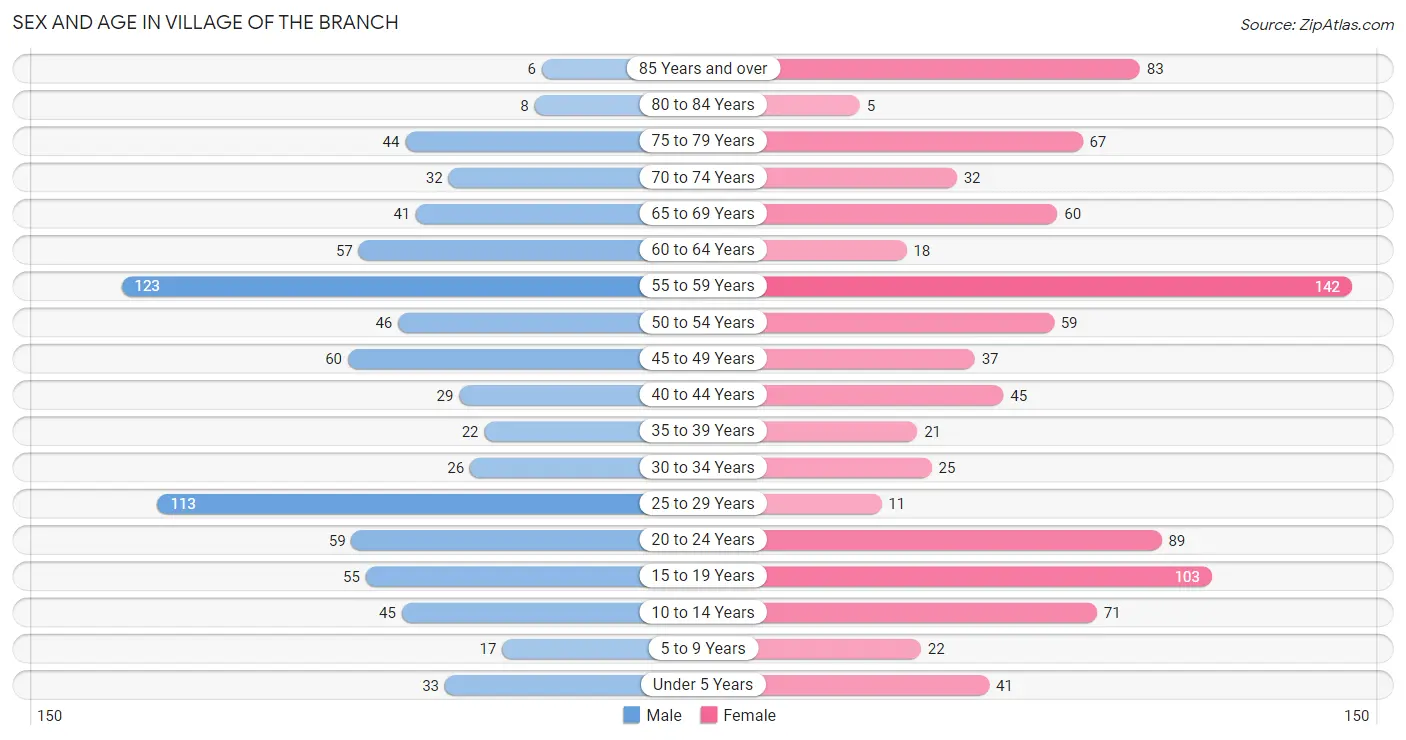
Sex and Age in Village of the Branch
Sex and Age in Village of the Branch
The most populous age groups in Village of the Branch are 55 to 59 Years (123 | 15.1%) for men and 55 to 59 Years (142 | 15.2%) for women.
| Age Bracket | Male | Female |
| Under 5 Years | 33 (4.0%) | 41 (4.4%) |
| 5 to 9 Years | 17 (2.1%) | 22 (2.4%) |
| 10 to 14 Years | 45 (5.5%) | 71 (7.6%) |
| 15 to 19 Years | 55 (6.7%) | 103 (11.1%) |
| 20 to 24 Years | 59 (7.2%) | 89 (9.6%) |
| 25 to 29 Years | 113 (13.9%) | 11 (1.2%) |
| 30 to 34 Years | 26 (3.2%) | 25 (2.7%) |
| 35 to 39 Years | 22 (2.7%) | 21 (2.3%) |
| 40 to 44 Years | 29 (3.5%) | 45 (4.8%) |
| 45 to 49 Years | 60 (7.3%) | 37 (4.0%) |
| 50 to 54 Years | 46 (5.6%) | 59 (6.3%) |
| 55 to 59 Years | 123 (15.1%) | 142 (15.2%) |
| 60 to 64 Years | 57 (7.0%) | 18 (1.9%) |
| 65 to 69 Years | 41 (5.0%) | 60 (6.4%) |
| 70 to 74 Years | 32 (3.9%) | 32 (3.4%) |
| 75 to 79 Years | 44 (5.4%) | 67 (7.2%) |
| 80 to 84 Years | 8 (1.0%) | 5 (0.5%) |
| 85 Years and over | 6 (0.7%) | 83 (8.9%) |
| Total | 816 (100.0%) | 931 (100.0%) |
Families and Households in Village of the Branch
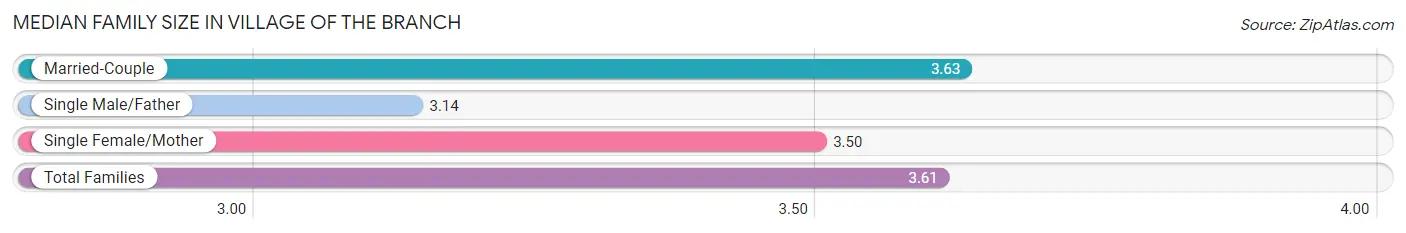
Median Family Size in Village of the Branch
The median family size in Village of the Branch is 3.61 persons per family, with married-couple families (400 | 93.2%) accounting for the largest median family size of 3.63 persons per family. On the other hand, single male/father families (7 | 1.6%) represent the smallest median family size with 3.14 persons per family.
| Family Type | # Families | Family Size |
| Married-Couple | 400 (93.2%) | 3.63 |
| Single Male/Father | 7 (1.6%) | 3.14 |
| Single Female/Mother | 22 (5.1%) | 3.50 |
| Total Families | 429 (100.0%) | 3.61 |
Median Household Size in Village of the Branch
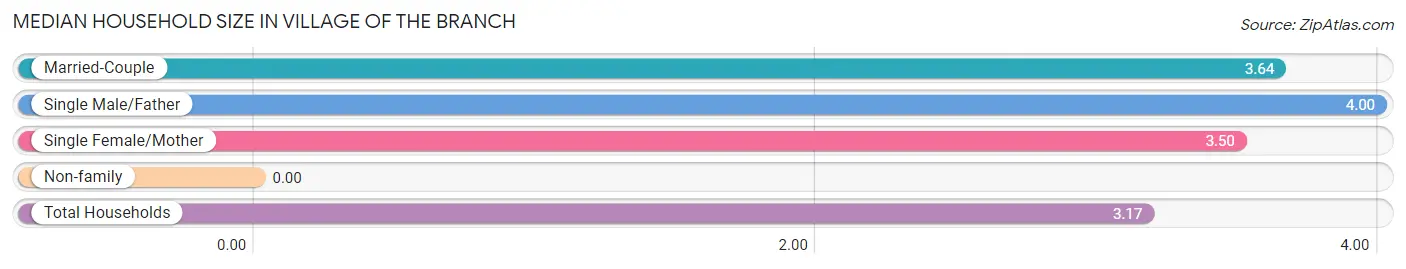
| Household Type | # Households | Household Size |
| Married-Couple | 400 (76.6%) | 3.64 |
| Single Male/Father | 7 (1.3%) | 4.00 |
| Single Female/Mother | 22 (4.2%) | 3.50 |
| Non-family | 93 (17.8%) | - |
| Total Households | 522 (100.0%) | 3.17 |
Household Size by Marriage Status in Village of the Branch
Out of a total of 522 households in Village of the Branch, 429 (82.2%) are family households, while 93 (17.8%) are nonfamily households. The most numerous type of family households are 2-person households, comprising 145, and the most common type of nonfamily households are 1-person households, comprising 93.
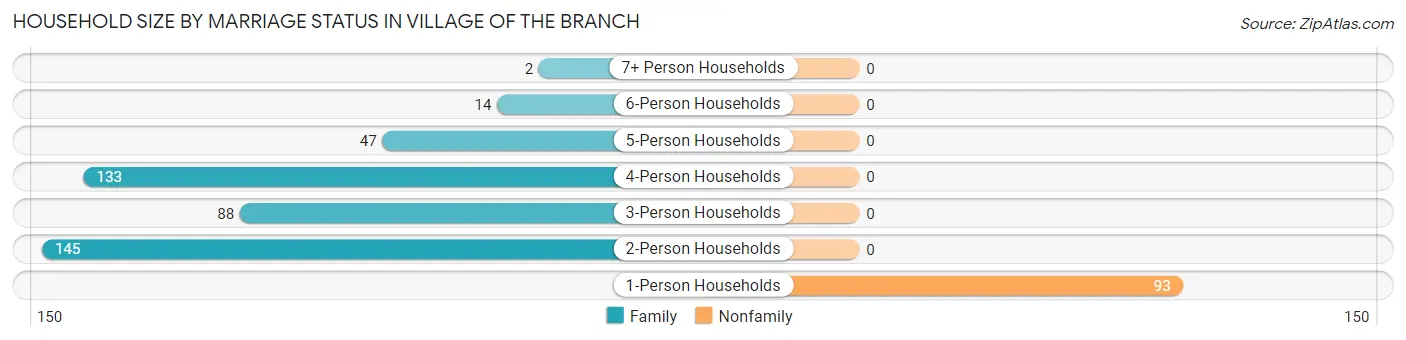
| Household Size | Family Households | Nonfamily Households |
| 1-Person Households | - | 93 (17.8%) |
| 2-Person Households | 145 (27.8%) | 0 (0.0%) |
| 3-Person Households | 88 (16.9%) | 0 (0.0%) |
| 4-Person Households | 133 (25.5%) | 0 (0.0%) |
| 5-Person Households | 47 (9.0%) | 0 (0.0%) |
| 6-Person Households | 14 (2.7%) | 0 (0.0%) |
| 7+ Person Households | 2 (0.4%) | 0 (0.0%) |
| Total | 429 (82.2%) | 93 (17.8%) |
Female Fertility in Village of the Branch
Fertility by Age in Village of the Branch
Average fertility rate in Village of the Branch is 26.0 births per 1,000 women. Women in the age bracket of 35 to 50 years have the highest fertility rate with 73.0 births per 1,000 women. Women in the age bracket of 35 to 50 years acount for 100.0% of all women with births.
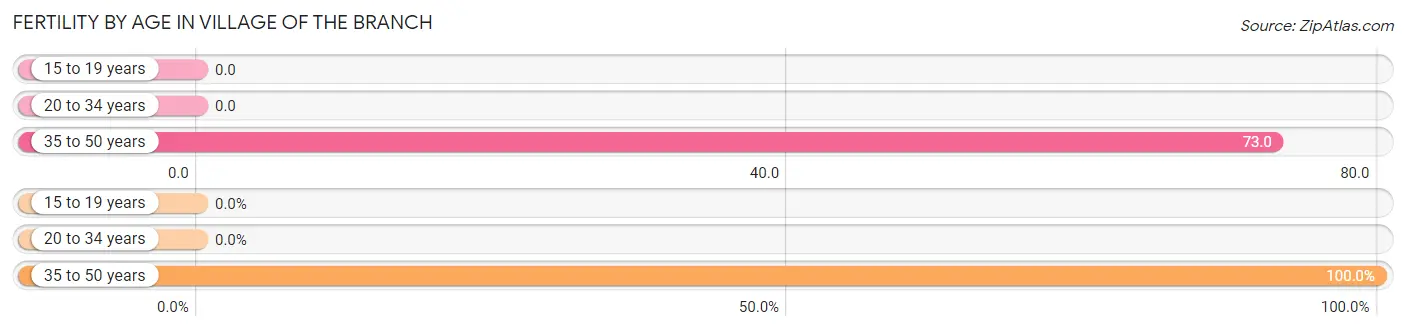
| Age Bracket | Women with Births | Births / 1,000 Women |
| 15 to 19 years | 0 (0.0%) | 0.0 |
| 20 to 34 years | 0 (0.0%) | 0.0 |
| 35 to 50 years | 9 (100.0%) | 73.0 |
| Total | 9 (100.0%) | 26.0 |
Fertility by Age by Marriage Status in Village of the Branch
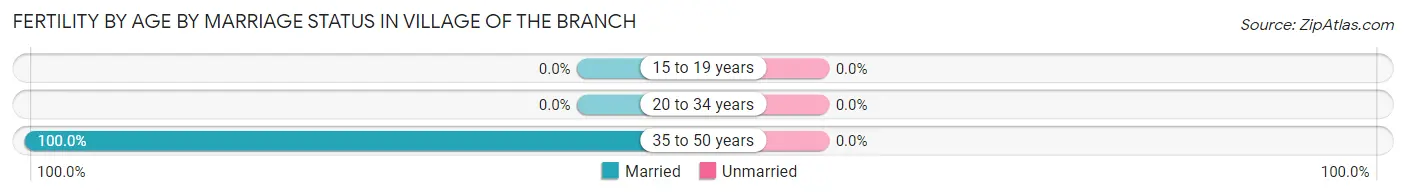
| Age Bracket | Married | Unmarried |
| 15 to 19 years | 0 (0.0%) | 0 (0.0%) |
| 20 to 34 years | 0 (0.0%) | 0 (0.0%) |
| 35 to 50 years | 9 (100.0%) | 0 (0.0%) |
| Total | 9 (100.0%) | 0 (0.0%) |
Fertility by Education in Village of the Branch
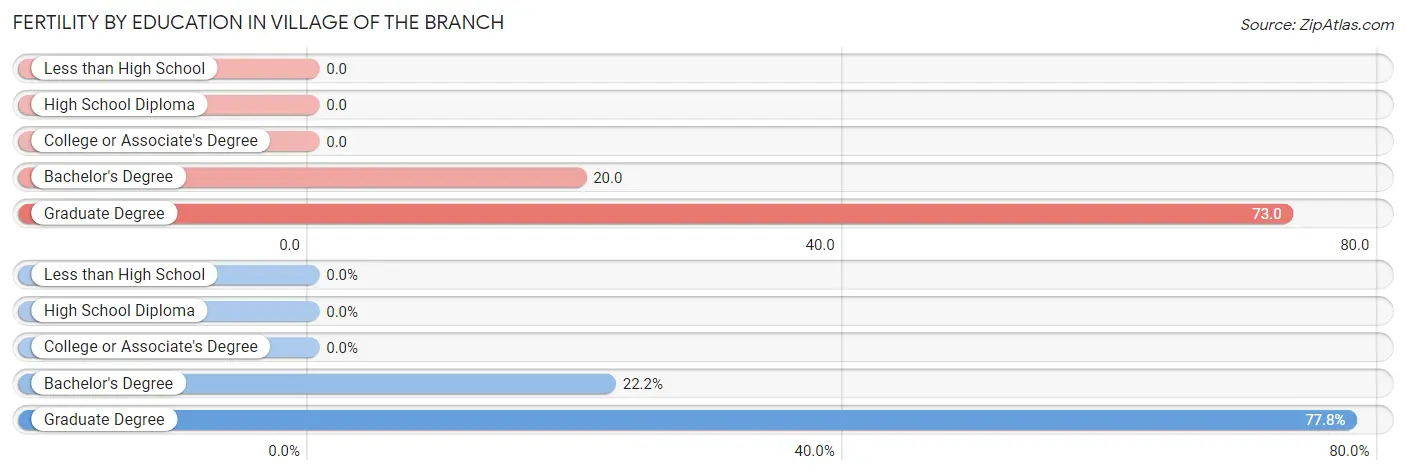
| Educational Attainment | Women with Births | Births / 1,000 Women |
| Less than High School | 0 (0.0%) | 0.0 |
| High School Diploma | 0 (0.0%) | 0.0 |
| College or Associate's Degree | 0 (0.0%) | 0.0 |
| Bachelor's Degree | 2 (22.2%) | 20.0 |
| Graduate Degree | 7 (77.8%) | 73.0 |
| Total | 9 (100.0%) | 26.0 |
Fertility by Education by Marriage Status in Village of the Branch
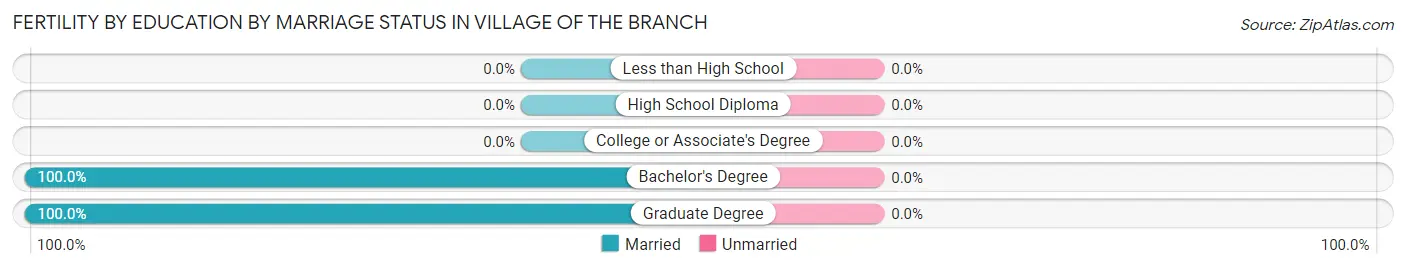
| Educational Attainment | Married | Unmarried |
| Less than High School | 0 (0.0%) | 0 (0.0%) |
| High School Diploma | 0 (0.0%) | 0 (0.0%) |
| College or Associate's Degree | 0 (0.0%) | 0 (0.0%) |
| Bachelor's Degree | 2 (100.0%) | 0 (0.0%) |
| Graduate Degree | 7 (100.0%) | 0 (0.0%) |
| Total | 9 (100.0%) | 0 (0.0%) |
Employment Characteristics in Village of the Branch
Employment by Class of Employer in Village of the Branch
Among the 812 employed individuals in Village of the Branch, private company employees (463 | 57.0%), not-for-profit organizations (123 | 15.1%), and local government employees (93 | 11.5%) make up the most common classes of employment.
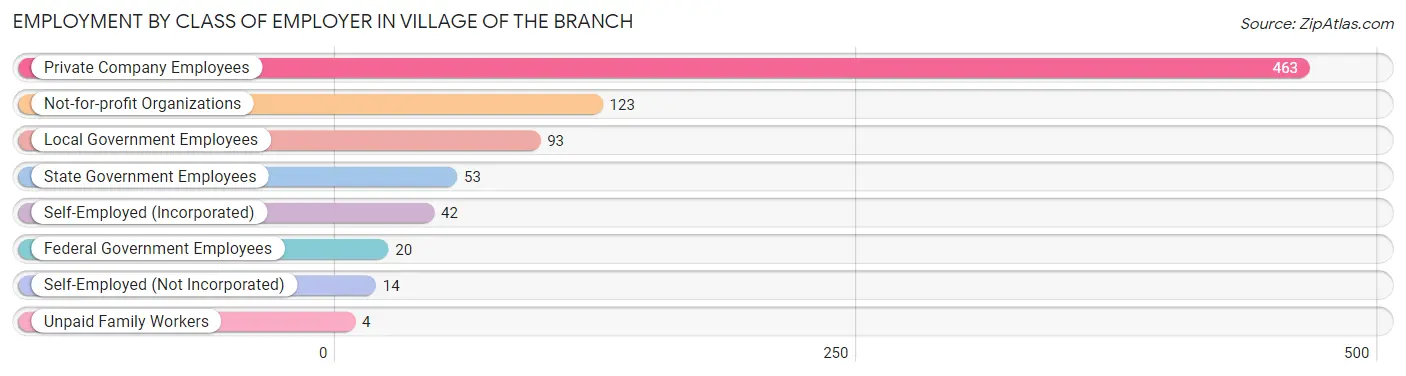
| Employer Class | # Employees | % Employees |
| Private Company Employees | 463 | 57.0% |
| Self-Employed (Incorporated) | 42 | 5.2% |
| Self-Employed (Not Incorporated) | 14 | 1.7% |
| Not-for-profit Organizations | 123 | 15.1% |
| Local Government Employees | 93 | 11.5% |
| State Government Employees | 53 | 6.5% |
| Federal Government Employees | 20 | 2.5% |
| Unpaid Family Workers | 4 | 0.5% |
| Total | 812 | 100.0% |
Employment Status by Age in Village of the Branch
According to the labor force statistics for Village of the Branch, out of the total population over 16 years of age (1,487), 58.6% or 871 individuals are in the labor force, with 5.6% or 49 of them unemployed. The age group with the highest labor force participation rate is 20 to 24 years, with 91.9% or 136 individuals in the labor force. Within the labor force, the 20 to 24 years age range has the highest percentage of unemployed individuals, with 26.5% or 36 of them being unemployed.
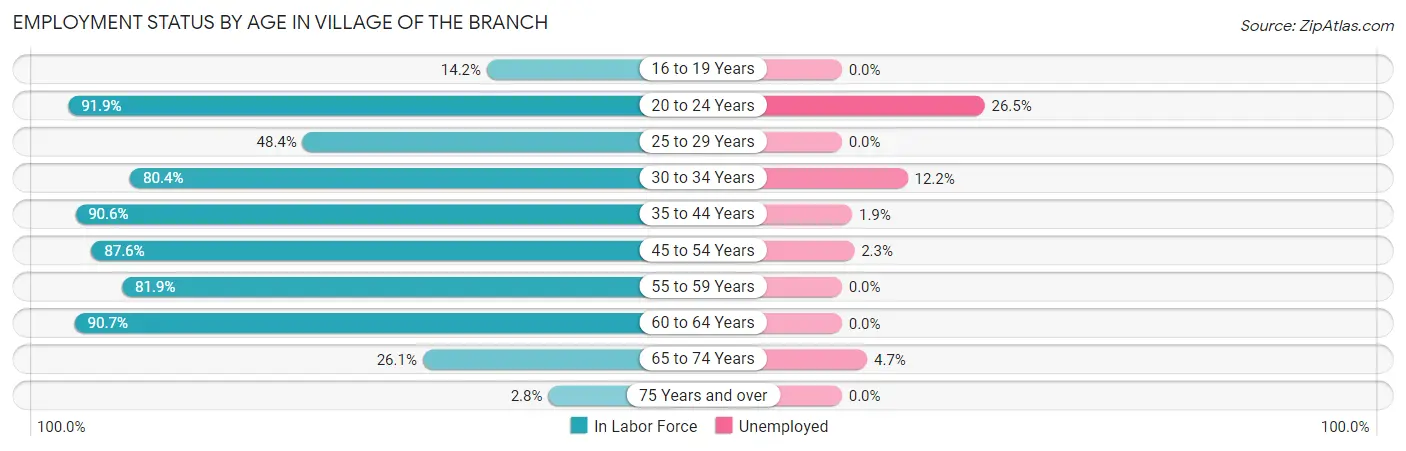
| Age Bracket | In Labor Force | Unemployed |
| 16 to 19 Years | 18 (14.2%) | 0 (0.0%) |
| 20 to 24 Years | 136 (91.9%) | 36 (26.5%) |
| 25 to 29 Years | 60 (48.4%) | 0 (0.0%) |
| 30 to 34 Years | 41 (80.4%) | 5 (12.2%) |
| 35 to 44 Years | 106 (90.6%) | 2 (1.9%) |
| 45 to 54 Years | 177 (87.6%) | 4 (2.3%) |
| 55 to 59 Years | 217 (81.9%) | 0 (0.0%) |
| 60 to 64 Years | 68 (90.7%) | 0 (0.0%) |
| 65 to 74 Years | 43 (26.1%) | 2 (4.7%) |
| 75 Years and over | 6 (2.8%) | 0 (0.0%) |
| Total | 871 (58.6%) | 49 (5.6%) |
Employment Status by Educational Attainment in Village of the Branch
According to labor force statistics for Village of the Branch, 80.2% of individuals (669) out of the total population between 25 and 64 years of age (834) are in the labor force, with 1.6% or 11 of them being unemployed. The group with the highest labor force participation rate are those with the educational attainment of bachelor's degree or higher, with 92.3% or 528 individuals in the labor force. Within the labor force, individuals with bachelor's degree or higher education have the highest percentage of unemployment, with 2.1% or 11 of them being unemployed.
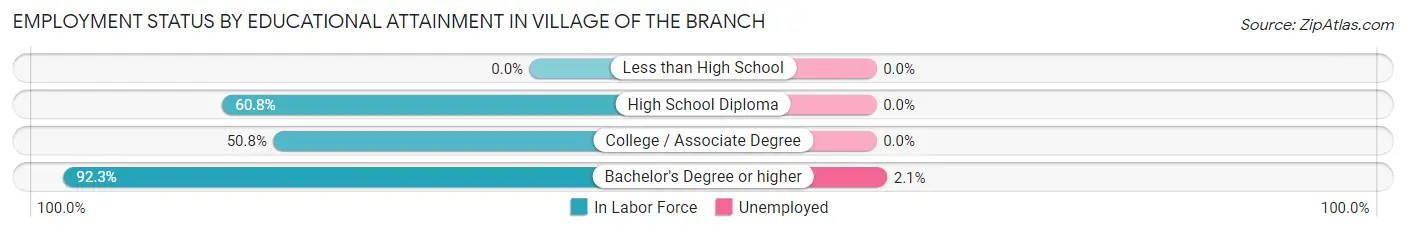
| Educational Attainment | In Labor Force | Unemployed |
| Less than High School | 0 (0.0%) | 0 (0.0%) |
| High School Diploma | 48 (60.8%) | 0 (0.0%) |
| College / Associate Degree | 93 (50.8%) | 0 (0.0%) |
| Bachelor's Degree or higher | 528 (92.3%) | 12 (2.1%) |
| Total | 669 (80.2%) | 13 (1.6%) |
Employment Occupations by Sex in Village of the Branch
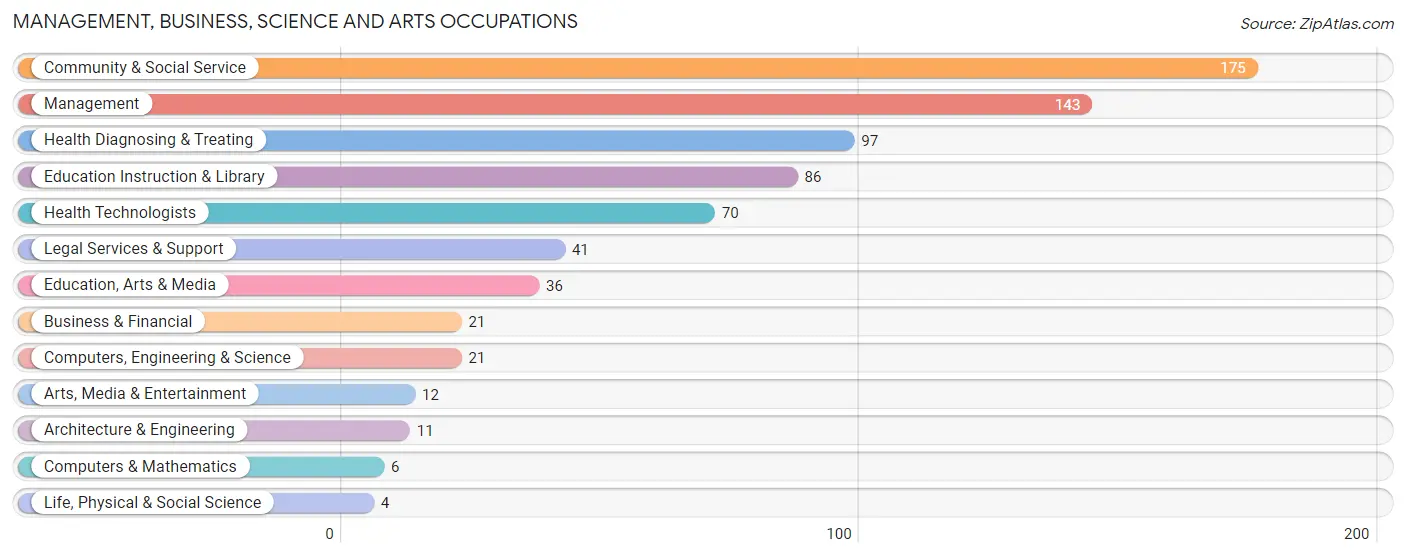
Management, Business, Science and Arts Occupations
The most common Management, Business, Science and Arts occupations in Village of the Branch are Community & Social Service (175 | 21.3%), Management (143 | 17.4%), Health Diagnosing & Treating (97 | 11.8%), Education Instruction & Library (86 | 10.4%), and Health Technologists (70 | 8.5%).
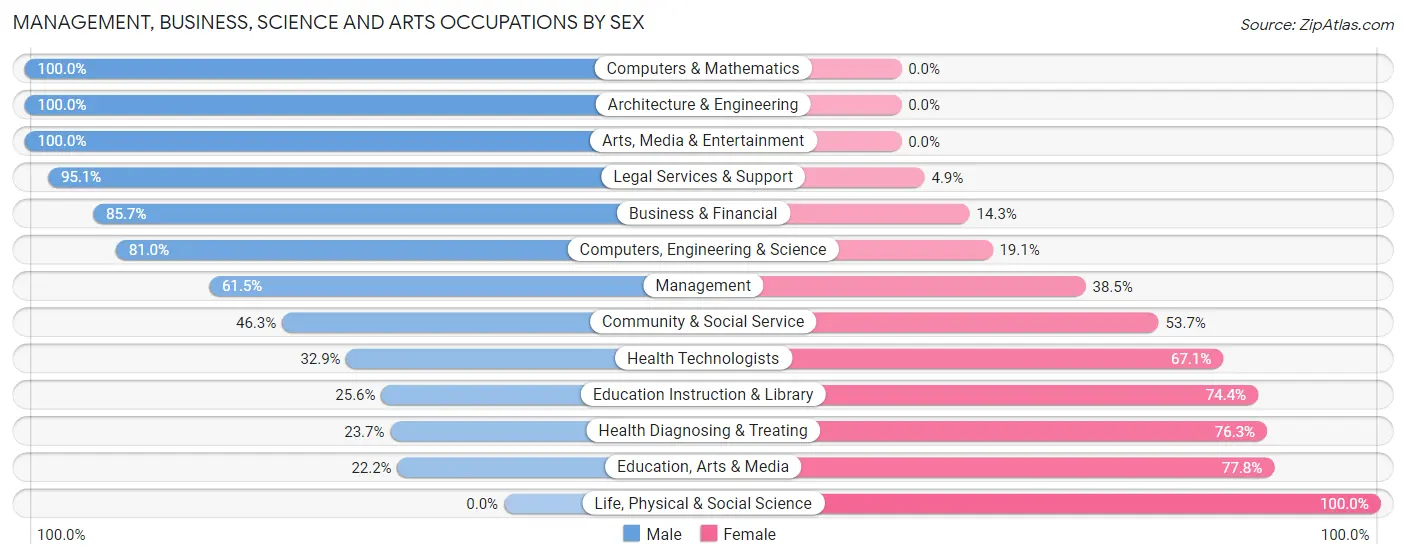
Management, Business, Science and Arts Occupations by Sex
Within the Management, Business, Science and Arts occupations in Village of the Branch, the most male-oriented occupations are Computers & Mathematics (100.0%), Architecture & Engineering (100.0%), and Arts, Media & Entertainment (100.0%), while the most female-oriented occupations are Life, Physical & Social Science (100.0%), Education, Arts & Media (77.8%), and Health Diagnosing & Treating (76.3%).
| Occupation | Male | Female |
| Management | 88 (61.5%) | 55 (38.5%) |
| Business & Financial | 18 (85.7%) | 3 (14.3%) |
| Computers, Engineering & Science | 17 (80.9%) | 4 (19.1%) |
| Computers & Mathematics | 6 (100.0%) | 0 (0.0%) |
| Architecture & Engineering | 11 (100.0%) | 0 (0.0%) |
| Life, Physical & Social Science | 0 (0.0%) | 4 (100.0%) |
| Community & Social Service | 81 (46.3%) | 94 (53.7%) |
| Education, Arts & Media | 8 (22.2%) | 28 (77.8%) |
| Legal Services & Support | 39 (95.1%) | 2 (4.9%) |
| Education Instruction & Library | 22 (25.6%) | 64 (74.4%) |
| Arts, Media & Entertainment | 12 (100.0%) | 0 (0.0%) |
| Health Diagnosing & Treating | 23 (23.7%) | 74 (76.3%) |
| Health Technologists | 23 (32.9%) | 47 (67.1%) |
| Total (Category) | 227 (49.7%) | 230 (50.3%) |
| Total (Overall) | 471 (57.2%) | 352 (42.8%) |
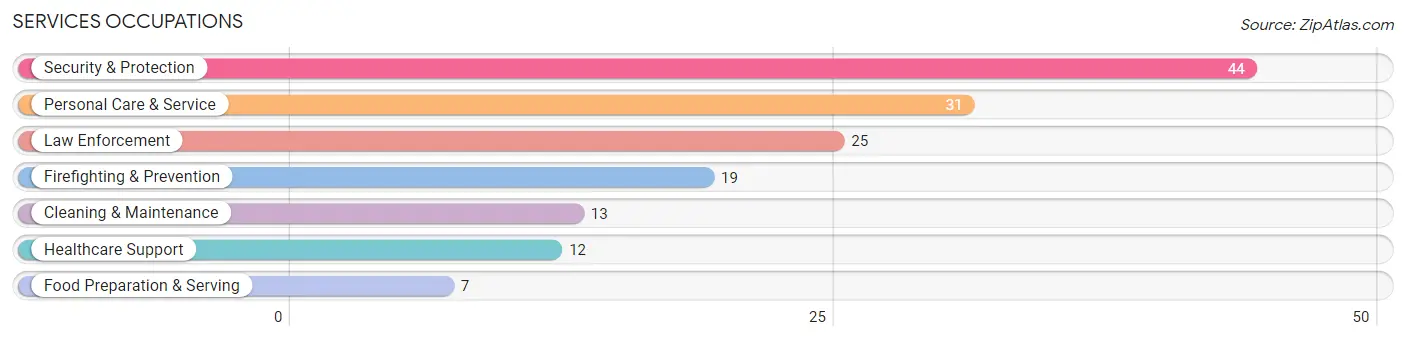
Services Occupations
The most common Services occupations in Village of the Branch are Security & Protection (44 | 5.3%), Personal Care & Service (31 | 3.8%), Law Enforcement (25 | 3.0%), Firefighting & Prevention (19 | 2.3%), and Cleaning & Maintenance (13 | 1.6%).
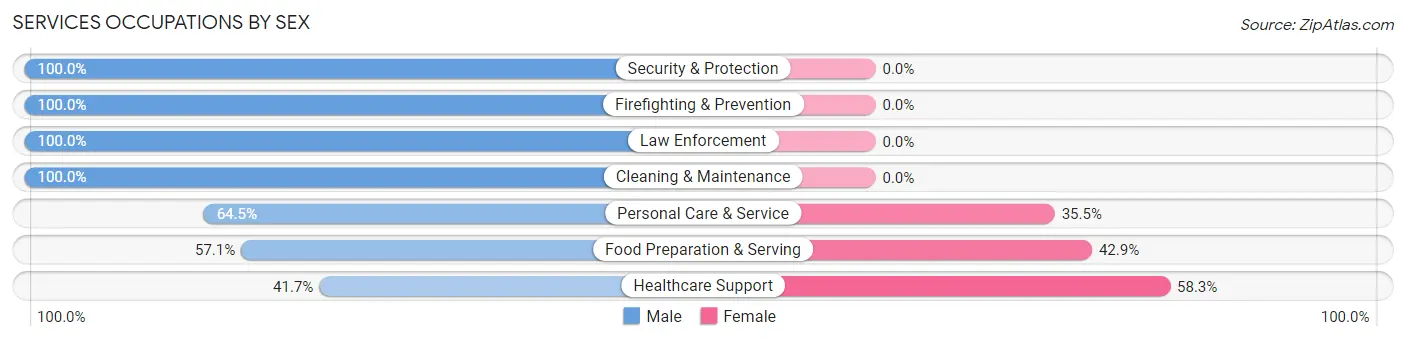
Services Occupations by Sex
Within the Services occupations in Village of the Branch, the most male-oriented occupations are Security & Protection (100.0%), Firefighting & Prevention (100.0%), and Law Enforcement (100.0%), while the most female-oriented occupations are Healthcare Support (58.3%), Food Preparation & Serving (42.9%), and Personal Care & Service (35.5%).
| Occupation | Male | Female |
| Healthcare Support | 5 (41.7%) | 7 (58.3%) |
| Security & Protection | 44 (100.0%) | 0 (0.0%) |
| Firefighting & Prevention | 19 (100.0%) | 0 (0.0%) |
| Law Enforcement | 25 (100.0%) | 0 (0.0%) |
| Food Preparation & Serving | 4 (57.1%) | 3 (42.9%) |
| Cleaning & Maintenance | 13 (100.0%) | 0 (0.0%) |
| Personal Care & Service | 20 (64.5%) | 11 (35.5%) |
| Total (Category) | 86 (80.4%) | 21 (19.6%) |
| Total (Overall) | 471 (57.2%) | 352 (42.8%) |
Sales and Office Occupations
The most common Sales and Office occupations in Village of the Branch are Sales & Related (138 | 16.8%), and Office & Administration (46 | 5.6%).
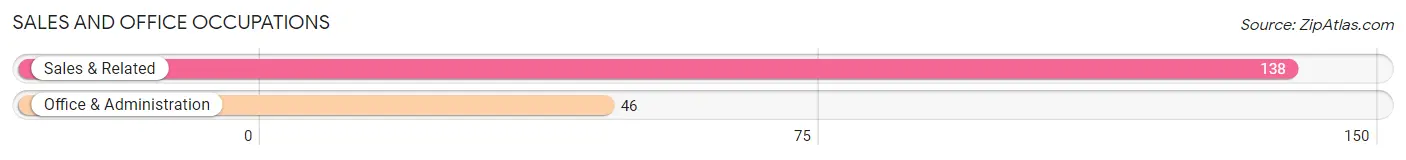
Sales and Office Occupations by Sex
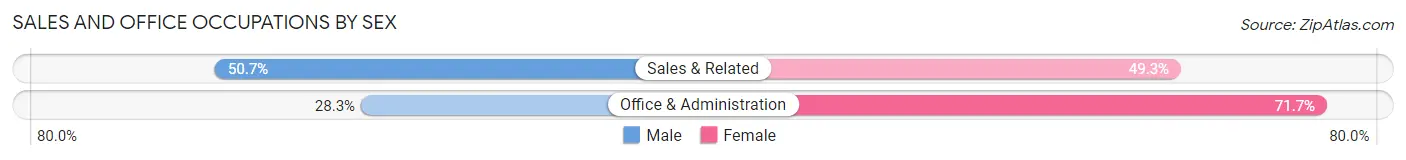
| Occupation | Male | Female |
| Sales & Related | 70 (50.7%) | 68 (49.3%) |
| Office & Administration | 13 (28.3%) | 33 (71.7%) |
| Total (Category) | 83 (45.1%) | 101 (54.9%) |
| Total (Overall) | 471 (57.2%) | 352 (42.8%) |
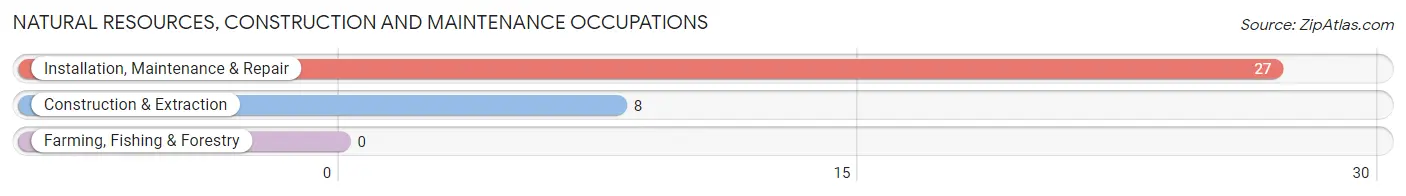
Natural Resources, Construction and Maintenance Occupations
The most common Natural Resources, Construction and Maintenance occupations in Village of the Branch are Installation, Maintenance & Repair (27 | 3.3%), and Construction & Extraction (8 | 1.0%).
Natural Resources, Construction and Maintenance Occupations by Sex
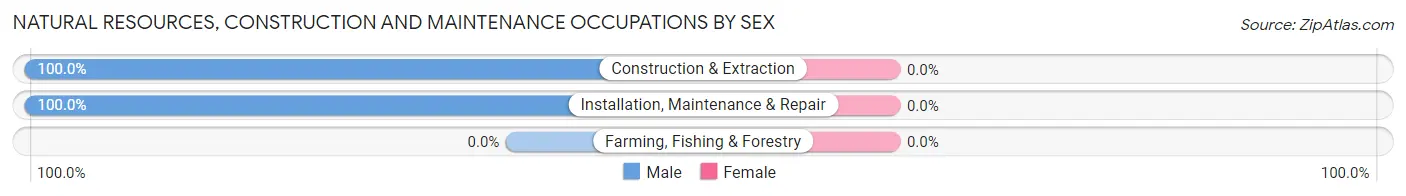
| Occupation | Male | Female |
| Farming, Fishing & Forestry | 0 (0.0%) | 0 (0.0%) |
| Construction & Extraction | 8 (100.0%) | 0 (0.0%) |
| Installation, Maintenance & Repair | 27 (100.0%) | 0 (0.0%) |
| Total (Category) | 35 (100.0%) | 0 (0.0%) |
| Total (Overall) | 471 (57.2%) | 352 (42.8%) |
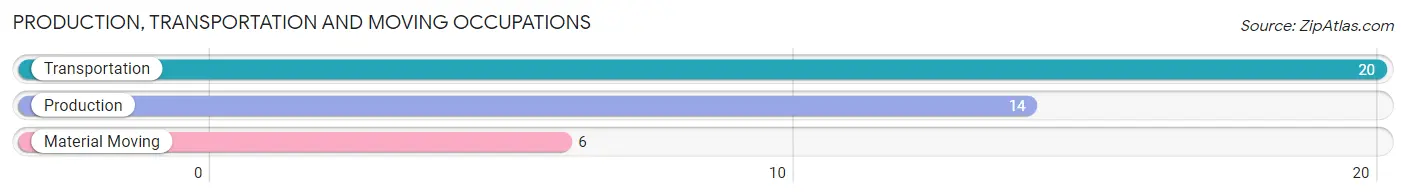
Production, Transportation and Moving Occupations
The most common Production, Transportation and Moving occupations in Village of the Branch are Transportation (20 | 2.4%), Production (14 | 1.7%), and Material Moving (6 | 0.7%).
Production, Transportation and Moving Occupations by Sex
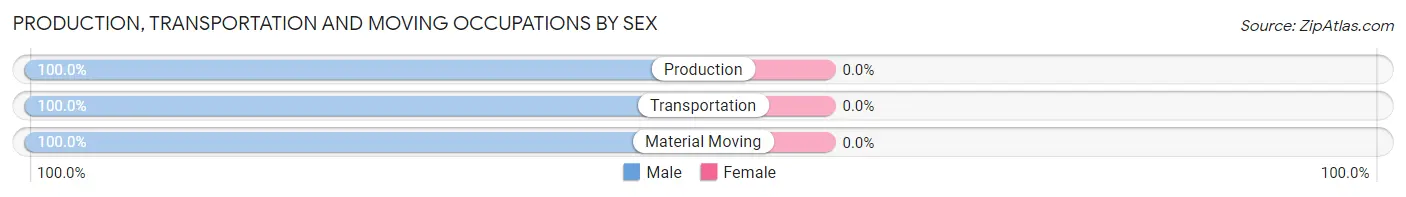
| Occupation | Male | Female |
| Production | 14 (100.0%) | 0 (0.0%) |
| Transportation | 20 (100.0%) | 0 (0.0%) |
| Material Moving | 6 (100.0%) | 0 (0.0%) |
| Total (Category) | 40 (100.0%) | 0 (0.0%) |
| Total (Overall) | 471 (57.2%) | 352 (42.8%) |
Employment Industries by Sex in Village of the Branch
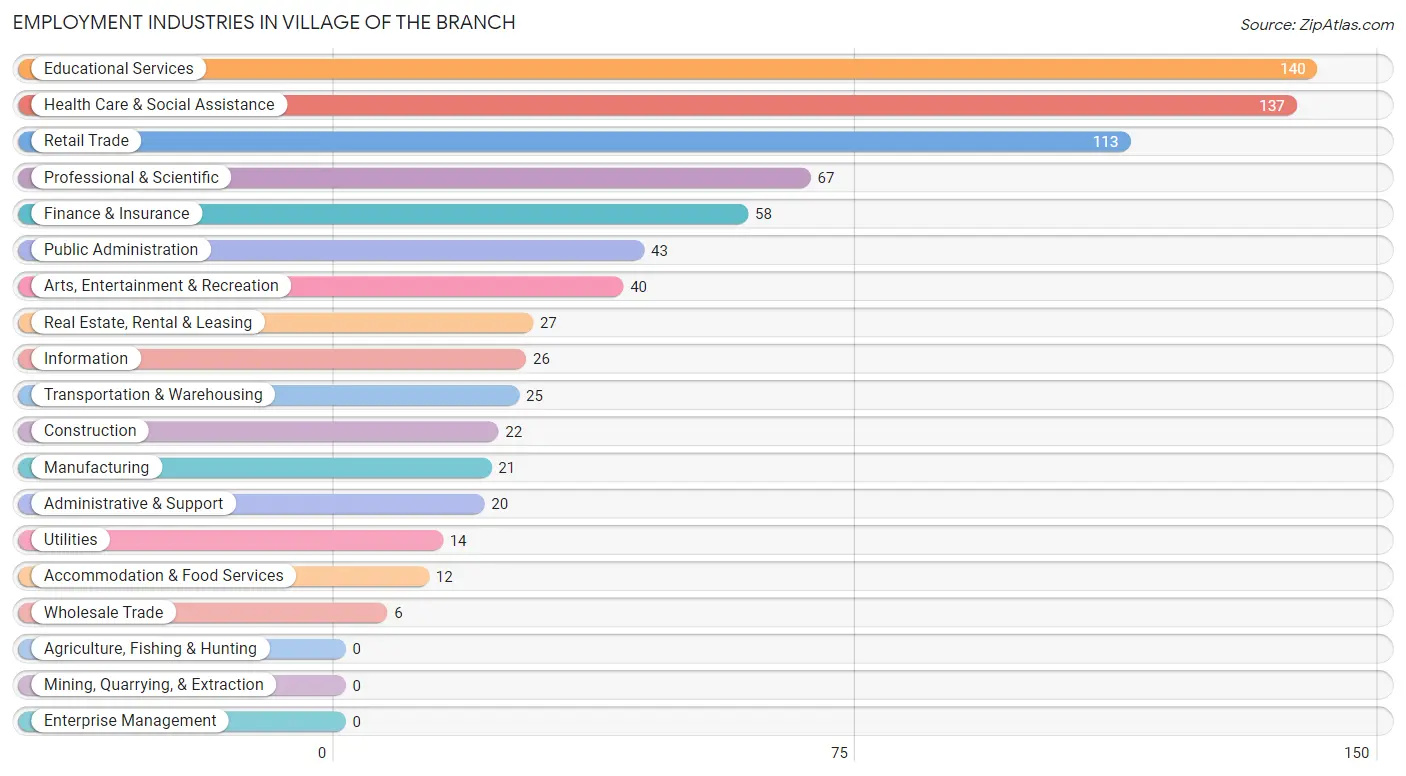
Employment Industries in Village of the Branch
The major employment industries in Village of the Branch include Educational Services (140 | 17.0%), Health Care & Social Assistance (137 | 16.7%), Retail Trade (113 | 13.7%), Professional & Scientific (67 | 8.1%), and Finance & Insurance (58 | 7.0%).
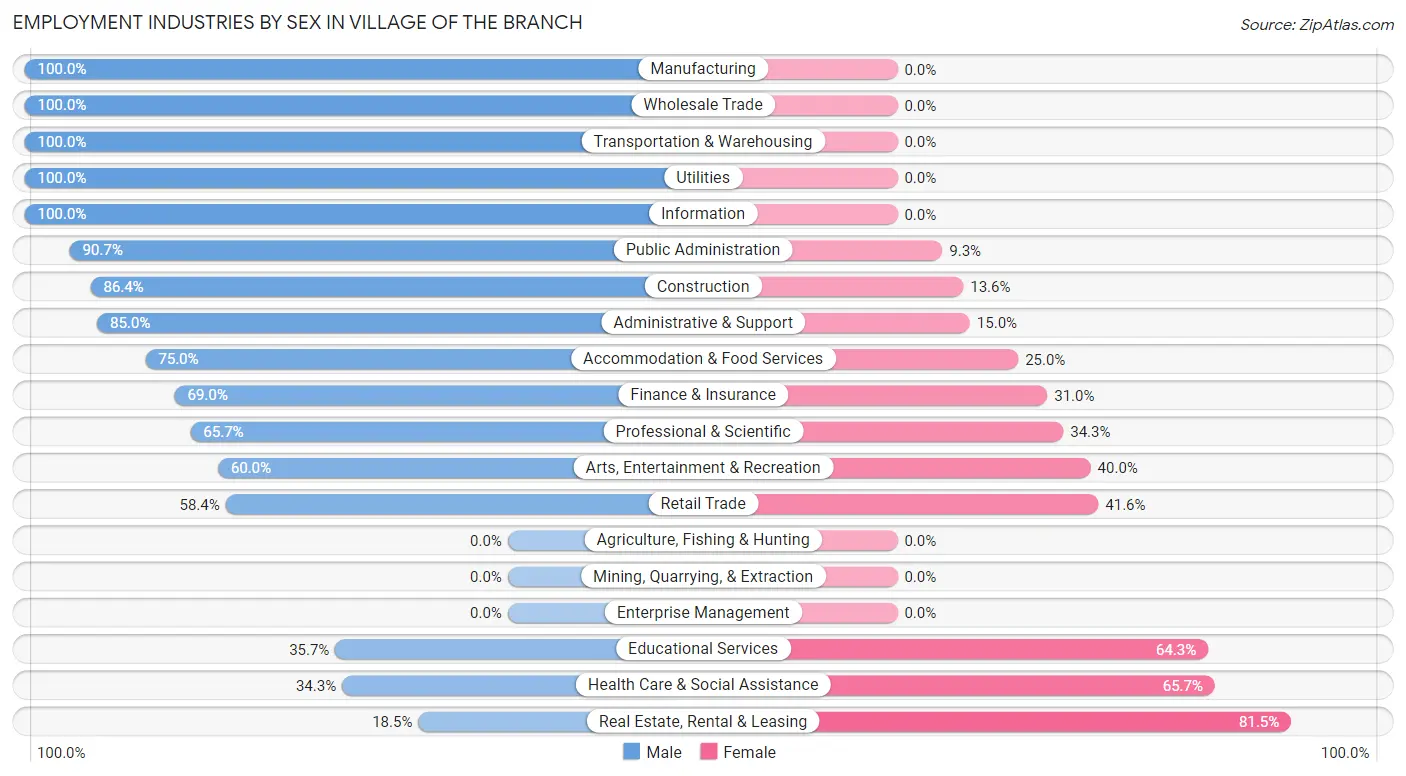
Employment Industries by Sex in Village of the Branch
The Village of the Branch industries that see more men than women are Manufacturing (100.0%), Wholesale Trade (100.0%), and Transportation & Warehousing (100.0%), whereas the industries that tend to have a higher number of women are Real Estate, Rental & Leasing (81.5%), Health Care & Social Assistance (65.7%), and Educational Services (64.3%).
| Industry | Male | Female |
| Agriculture, Fishing & Hunting | 0 (0.0%) | 0 (0.0%) |
| Mining, Quarrying, & Extraction | 0 (0.0%) | 0 (0.0%) |
| Construction | 19 (86.4%) | 3 (13.6%) |
| Manufacturing | 21 (100.0%) | 0 (0.0%) |
| Wholesale Trade | 6 (100.0%) | 0 (0.0%) |
| Retail Trade | 66 (58.4%) | 47 (41.6%) |
| Transportation & Warehousing | 25 (100.0%) | 0 (0.0%) |
| Utilities | 14 (100.0%) | 0 (0.0%) |
| Information | 26 (100.0%) | 0 (0.0%) |
| Finance & Insurance | 40 (69.0%) | 18 (31.0%) |
| Real Estate, Rental & Leasing | 5 (18.5%) | 22 (81.5%) |
| Professional & Scientific | 44 (65.7%) | 23 (34.3%) |
| Enterprise Management | 0 (0.0%) | 0 (0.0%) |
| Administrative & Support | 17 (85.0%) | 3 (15.0%) |
| Educational Services | 50 (35.7%) | 90 (64.3%) |
| Health Care & Social Assistance | 47 (34.3%) | 90 (65.7%) |
| Arts, Entertainment & Recreation | 24 (60.0%) | 16 (40.0%) |
| Accommodation & Food Services | 9 (75.0%) | 3 (25.0%) |
| Public Administration | 39 (90.7%) | 4 (9.3%) |
| Total | 471 (57.2%) | 352 (42.8%) |
Education in Village of the Branch
School Enrollment in Village of the Branch
The most common levels of schooling among the 414 students in Village of the Branch are college / undergraduate (118 | 28.5%), middle school (106 | 25.6%), and high school (93 | 22.5%).
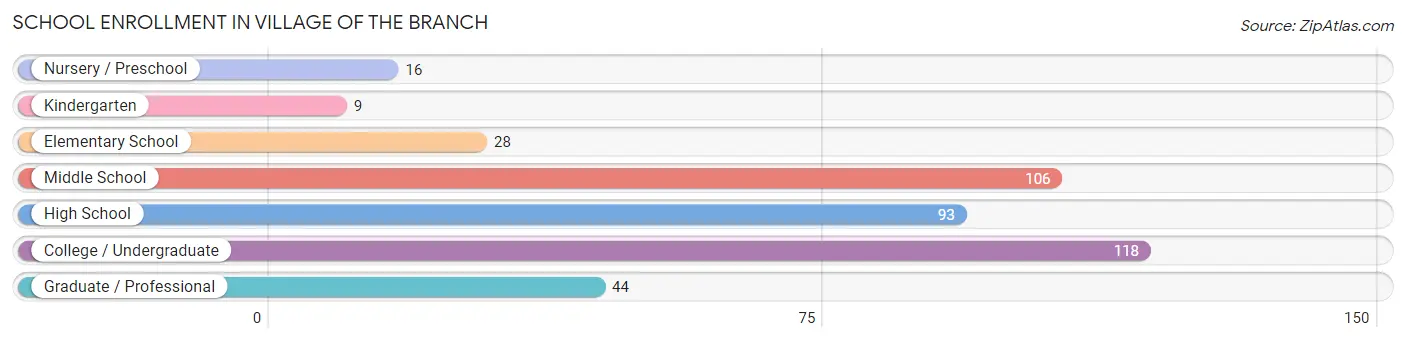
| School Level | # Students | % Students |
| Nursery / Preschool | 16 | 3.9% |
| Kindergarten | 9 | 2.2% |
| Elementary School | 28 | 6.8% |
| Middle School | 106 | 25.6% |
| High School | 93 | 22.5% |
| College / Undergraduate | 118 | 28.5% |
| Graduate / Professional | 44 | 10.6% |
| Total | 414 | 100.0% |
School Enrollment by Age by Funding Source in Village of the Branch
Out of a total of 414 students who are enrolled in schools in Village of the Branch, 102 (24.6%) attend a private institution, while the remaining 312 (75.4%) are enrolled in public schools. The age group of 25 to 34 year olds has the highest likelihood of being enrolled in private schools, with 32 (86.5% in the age bracket) enrolled. Conversely, the age group of 15 to 17 year olds has the lowest likelihood of being enrolled in a private school, with 77 (88.5% in the age bracket) attending a public institution.
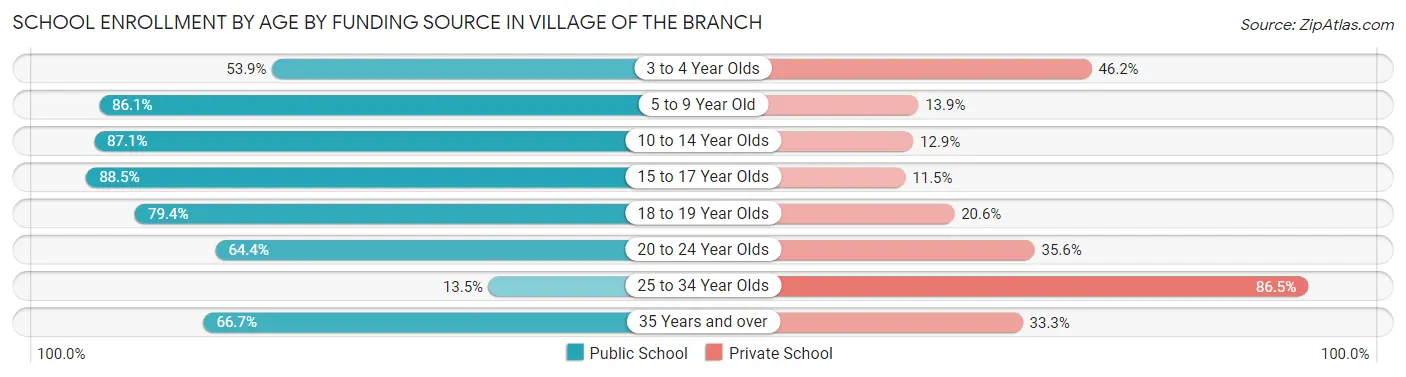
| Age Bracket | Public School | Private School |
| 3 to 4 Year Olds | 7 (53.8%) | 6 (46.2%) |
| 5 to 9 Year Old | 31 (86.1%) | 5 (13.9%) |
| 10 to 14 Year Olds | 101 (87.1%) | 15 (12.9%) |
| 15 to 17 Year Olds | 77 (88.5%) | 10 (11.5%) |
| 18 to 19 Year Olds | 54 (79.4%) | 14 (20.6%) |
| 20 to 24 Year Olds | 29 (64.4%) | 16 (35.6%) |
| 25 to 34 Year Olds | 5 (13.5%) | 32 (86.5%) |
| 35 Years and over | 8 (66.7%) | 4 (33.3%) |
| Total | 312 (75.4%) | 102 (24.6%) |
Educational Attainment by Field of Study in Village of the Branch
Business (160 | 19.7%), education (131 | 16.1%), science & technology (105 | 12.9%), social sciences (58 | 7.1%), and arts & humanities (57 | 7.0%) are the most common fields of study among 814 individuals in Village of the Branch who have obtained a bachelor's degree or higher.
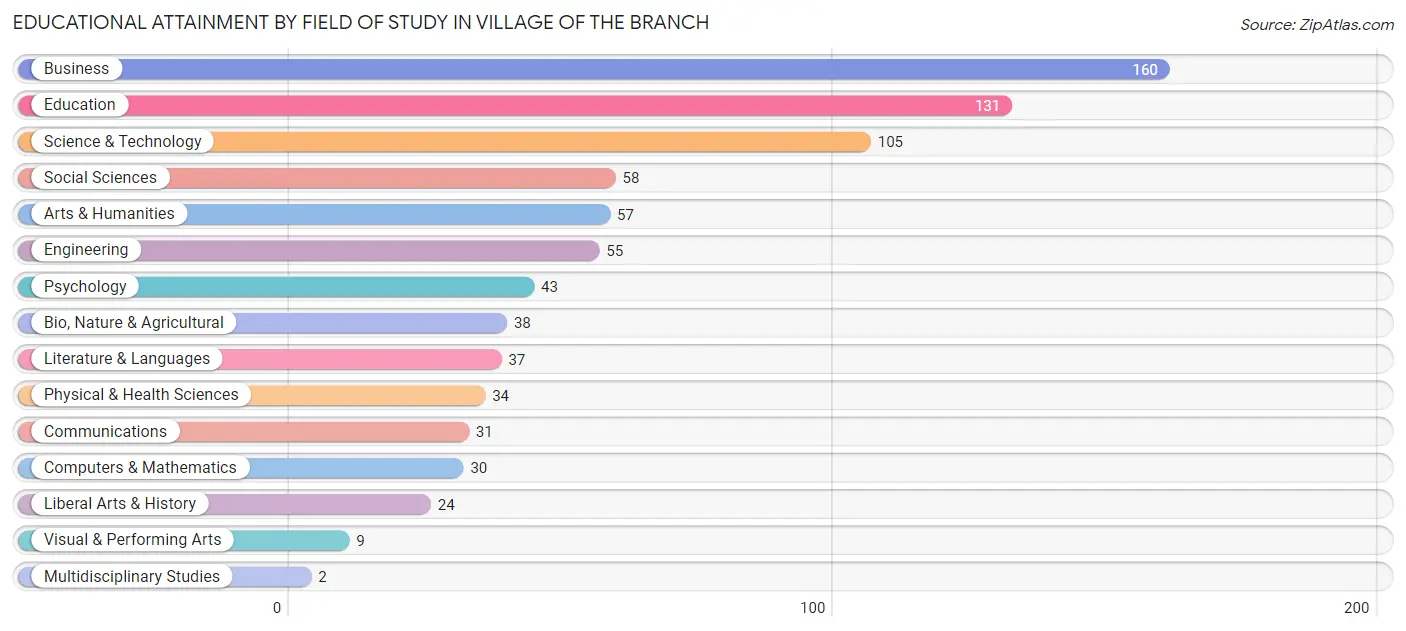
| Field of Study | # Graduates | % Graduates |
| Computers & Mathematics | 30 | 3.7% |
| Bio, Nature & Agricultural | 38 | 4.7% |
| Physical & Health Sciences | 34 | 4.2% |
| Psychology | 43 | 5.3% |
| Social Sciences | 58 | 7.1% |
| Engineering | 55 | 6.8% |
| Multidisciplinary Studies | 2 | 0.3% |
| Science & Technology | 105 | 12.9% |
| Business | 160 | 19.7% |
| Education | 131 | 16.1% |
| Literature & Languages | 37 | 4.5% |
| Liberal Arts & History | 24 | 2.9% |
| Visual & Performing Arts | 9 | 1.1% |
| Communications | 31 | 3.8% |
| Arts & Humanities | 57 | 7.0% |
| Total | 814 | 100.0% |
Transportation & Commute in Village of the Branch
Vehicle Availability by Sex in Village of the Branch
The most prevalent vehicle ownership categories in Village of the Branch are males with 2 vehicles (189, accounting for 41.0%) and females with 2 vehicles (184, making up 55.1%).
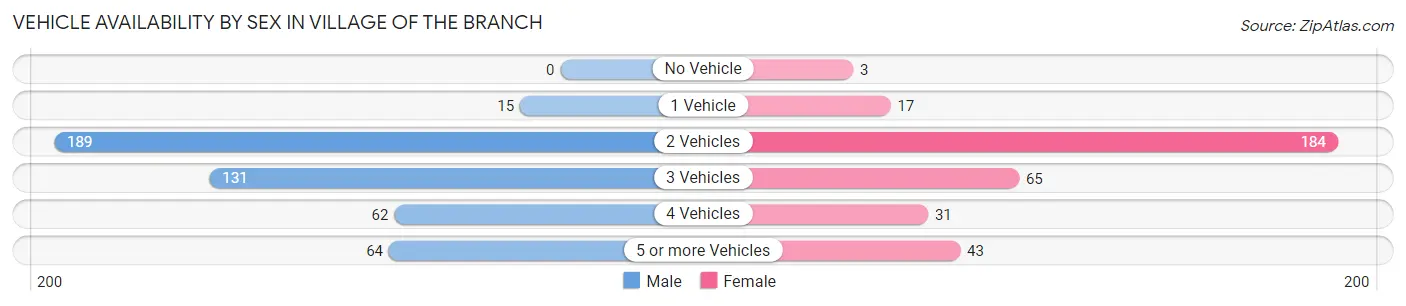
| Vehicles Available | Male | Female |
| No Vehicle | 0 (0.0%) | 3 (0.9%) |
| 1 Vehicle | 15 (3.3%) | 17 (5.0%) |
| 2 Vehicles | 189 (41.0%) | 184 (53.6%) |
| 3 Vehicles | 131 (28.4%) | 65 (19.0%) |
| 4 Vehicles | 62 (13.5%) | 31 (9.0%) |
| 5 or more Vehicles | 64 (13.9%) | 43 (12.5%) |
| Total | 461 (100.0%) | 343 (100.0%) |
Commute Time in Village of the Branch
The most frequently occuring commute durations in Village of the Branch are 15 to 19 minutes (171 commuters, 23.9%), 10 to 14 minutes (83 commuters, 11.6%), and 30 to 34 minutes (80 commuters, 11.2%).
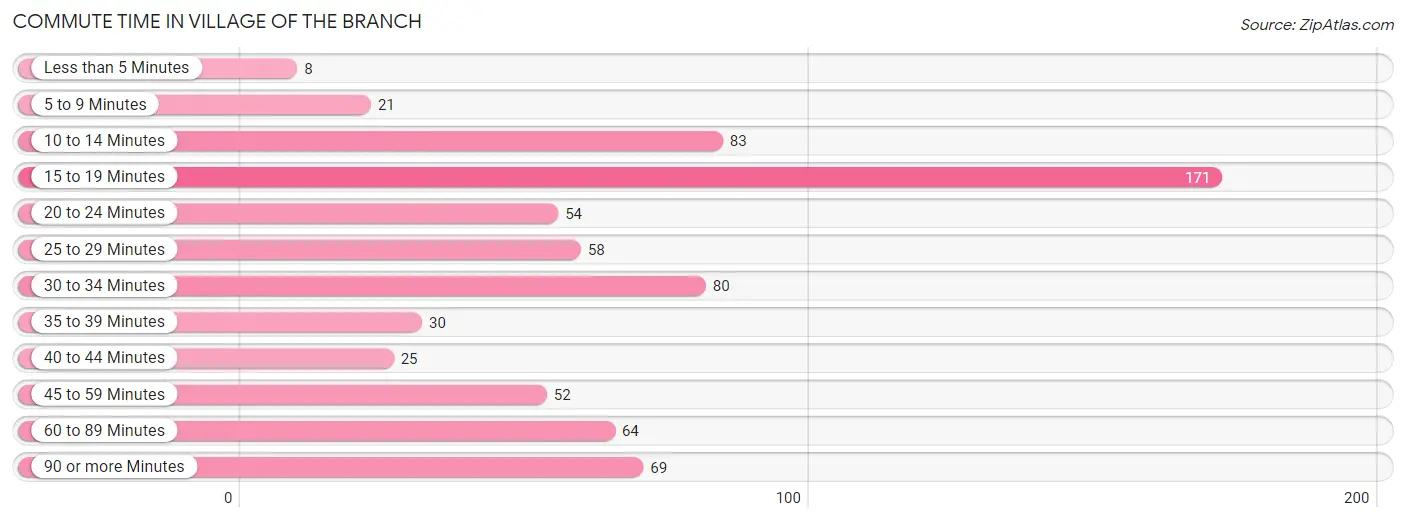
| Commute Time | # Commuters | % Commuters |
| Less than 5 Minutes | 8 | 1.1% |
| 5 to 9 Minutes | 21 | 2.9% |
| 10 to 14 Minutes | 83 | 11.6% |
| 15 to 19 Minutes | 171 | 23.9% |
| 20 to 24 Minutes | 54 | 7.5% |
| 25 to 29 Minutes | 58 | 8.1% |
| 30 to 34 Minutes | 80 | 11.2% |
| 35 to 39 Minutes | 30 | 4.2% |
| 40 to 44 Minutes | 25 | 3.5% |
| 45 to 59 Minutes | 52 | 7.3% |
| 60 to 89 Minutes | 64 | 8.9% |
| 90 or more Minutes | 69 | 9.7% |
Commute Time by Sex in Village of the Branch
The most common commute times in Village of the Branch are 15 to 19 minutes (68 commuters, 16.5%) for males and 15 to 19 minutes (103 commuters, 34.0%) for females.
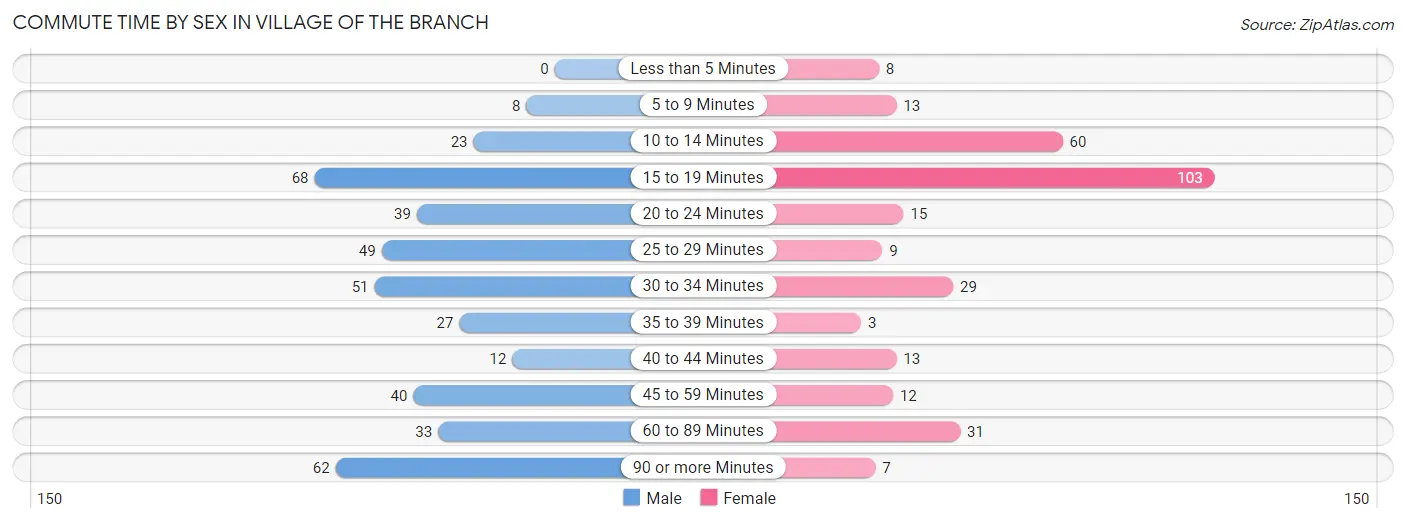
| Commute Time | Male | Female |
| Less than 5 Minutes | 0 (0.0%) | 8 (2.6%) |
| 5 to 9 Minutes | 8 (1.9%) | 13 (4.3%) |
| 10 to 14 Minutes | 23 (5.6%) | 60 (19.8%) |
| 15 to 19 Minutes | 68 (16.5%) | 103 (34.0%) |
| 20 to 24 Minutes | 39 (9.5%) | 15 (5.0%) |
| 25 to 29 Minutes | 49 (11.9%) | 9 (3.0%) |
| 30 to 34 Minutes | 51 (12.4%) | 29 (9.6%) |
| 35 to 39 Minutes | 27 (6.6%) | 3 (1.0%) |
| 40 to 44 Minutes | 12 (2.9%) | 13 (4.3%) |
| 45 to 59 Minutes | 40 (9.7%) | 12 (4.0%) |
| 60 to 89 Minutes | 33 (8.0%) | 31 (10.2%) |
| 90 or more Minutes | 62 (15.0%) | 7 (2.3%) |
Time of Departure to Work by Sex in Village of the Branch
The most frequent times of departure to work in Village of the Branch are 8:00 AM to 8:29 AM (90, 21.8%) for males and 8:00 AM to 8:29 AM (85, 28.1%) for females.
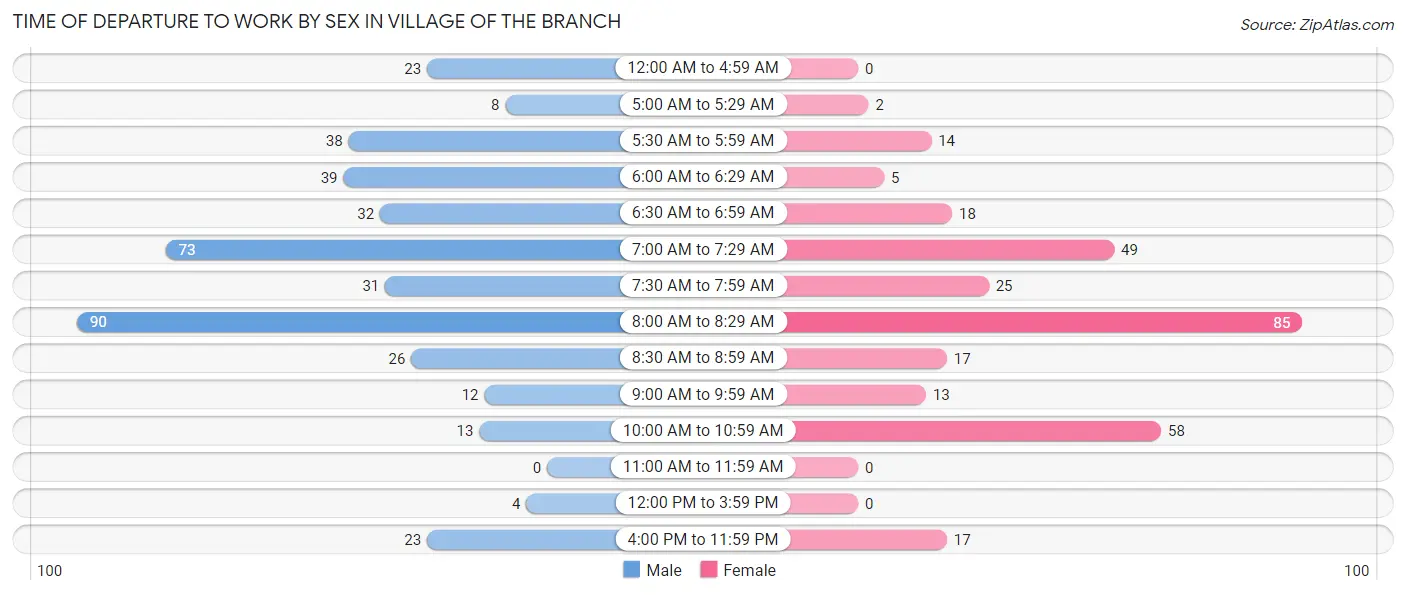
| Time of Departure | Male | Female |
| 12:00 AM to 4:59 AM | 23 (5.6%) | 0 (0.0%) |
| 5:00 AM to 5:29 AM | 8 (1.9%) | 2 (0.7%) |
| 5:30 AM to 5:59 AM | 38 (9.2%) | 14 (4.6%) |
| 6:00 AM to 6:29 AM | 39 (9.5%) | 5 (1.7%) |
| 6:30 AM to 6:59 AM | 32 (7.8%) | 18 (5.9%) |
| 7:00 AM to 7:29 AM | 73 (17.7%) | 49 (16.2%) |
| 7:30 AM to 7:59 AM | 31 (7.5%) | 25 (8.3%) |
| 8:00 AM to 8:29 AM | 90 (21.8%) | 85 (28.1%) |
| 8:30 AM to 8:59 AM | 26 (6.3%) | 17 (5.6%) |
| 9:00 AM to 9:59 AM | 12 (2.9%) | 13 (4.3%) |
| 10:00 AM to 10:59 AM | 13 (3.2%) | 58 (19.1%) |
| 11:00 AM to 11:59 AM | 0 (0.0%) | 0 (0.0%) |
| 12:00 PM to 3:59 PM | 4 (1.0%) | 0 (0.0%) |
| 4:00 PM to 11:59 PM | 23 (5.6%) | 17 (5.6%) |
| Total | 412 (100.0%) | 303 (100.0%) |
Housing Occupancy in Village of the Branch
Occupancy by Ownership in Village of the Branch
Of the total 522 dwellings in Village of the Branch, owner-occupied units account for 499 (95.6%), while renter-occupied units make up 23 (4.4%).
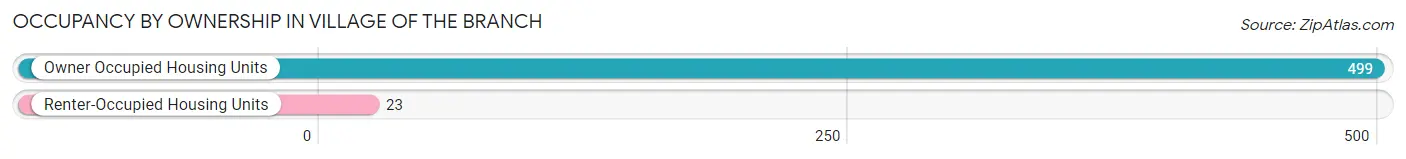
| Occupancy | # Housing Units | % Housing Units |
| Owner Occupied Housing Units | 499 | 95.6% |
| Renter-Occupied Housing Units | 23 | 4.4% |
| Total Occupied Housing Units | 522 | 100.0% |
Occupancy by Household Size in Village of the Branch
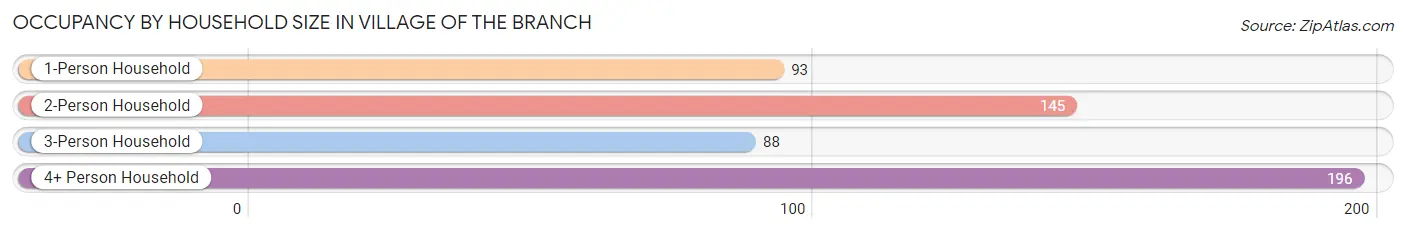
| Household Size | # Housing Units | % Housing Units |
| 1-Person Household | 93 | 17.8% |
| 2-Person Household | 145 | 27.8% |
| 3-Person Household | 88 | 16.9% |
| 4+ Person Household | 196 | 37.6% |
| Total Housing Units | 522 | 100.0% |
Occupancy by Ownership by Household Size in Village of the Branch
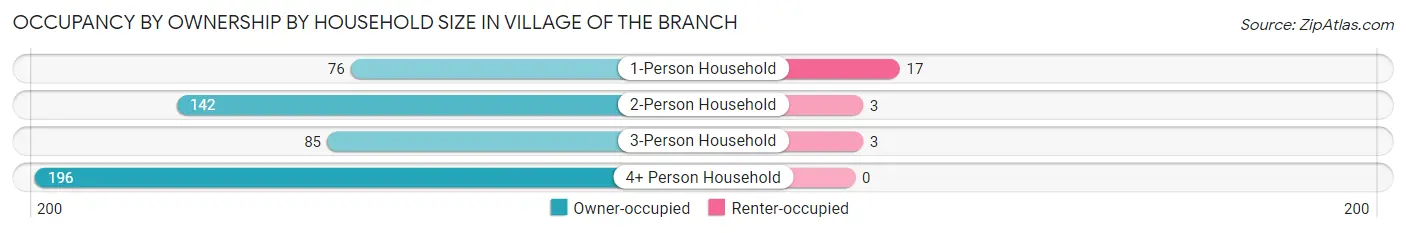
| Household Size | Owner-occupied | Renter-occupied |
| 1-Person Household | 76 (81.7%) | 17 (18.3%) |
| 2-Person Household | 142 (97.9%) | 3 (2.1%) |
| 3-Person Household | 85 (96.6%) | 3 (3.4%) |
| 4+ Person Household | 196 (100.0%) | 0 (0.0%) |
| Total Housing Units | 499 (95.6%) | 23 (4.4%) |
Occupancy by Educational Attainment in Village of the Branch
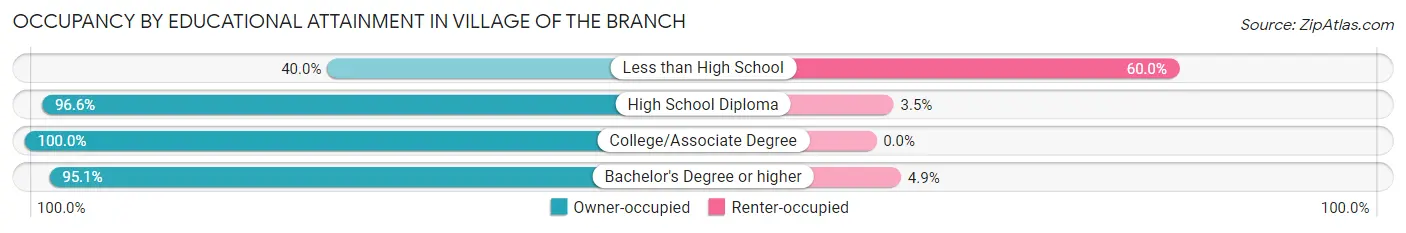
| Household Size | Owner-occupied | Renter-occupied |
| Less than High School | 2 (40.0%) | 3 (60.0%) |
| High School Diploma | 84 (96.6%) | 3 (3.5%) |
| College/Associate Degree | 83 (100.0%) | 0 (0.0%) |
| Bachelor's Degree or higher | 330 (95.1%) | 17 (4.9%) |
Occupancy by Age of Householder in Village of the Branch
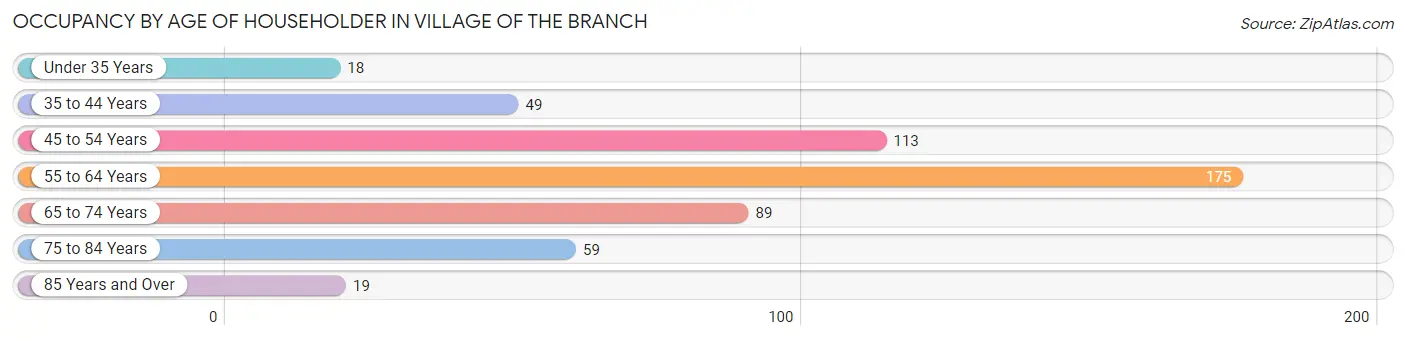
| Age Bracket | # Households | % Households |
| Under 35 Years | 18 | 3.5% |
| 35 to 44 Years | 49 | 9.4% |
| 45 to 54 Years | 113 | 21.6% |
| 55 to 64 Years | 175 | 33.5% |
| 65 to 74 Years | 89 | 17.1% |
| 75 to 84 Years | 59 | 11.3% |
| 85 Years and Over | 19 | 3.6% |
| Total | 522 | 100.0% |
Housing Finances in Village of the Branch
Median Income by Occupancy in Village of the Branch
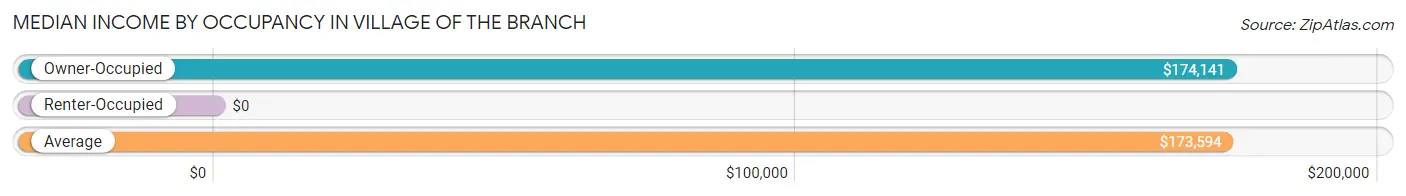
| Occupancy Type | # Households | Median Income |
| Owner-Occupied | 499 (95.6%) | $174,141 |
| Renter-Occupied | 23 (4.4%) | $0 |
| Average | 522 (100.0%) | $173,594 |
Occupancy by Householder Income Bracket in Village of the Branch
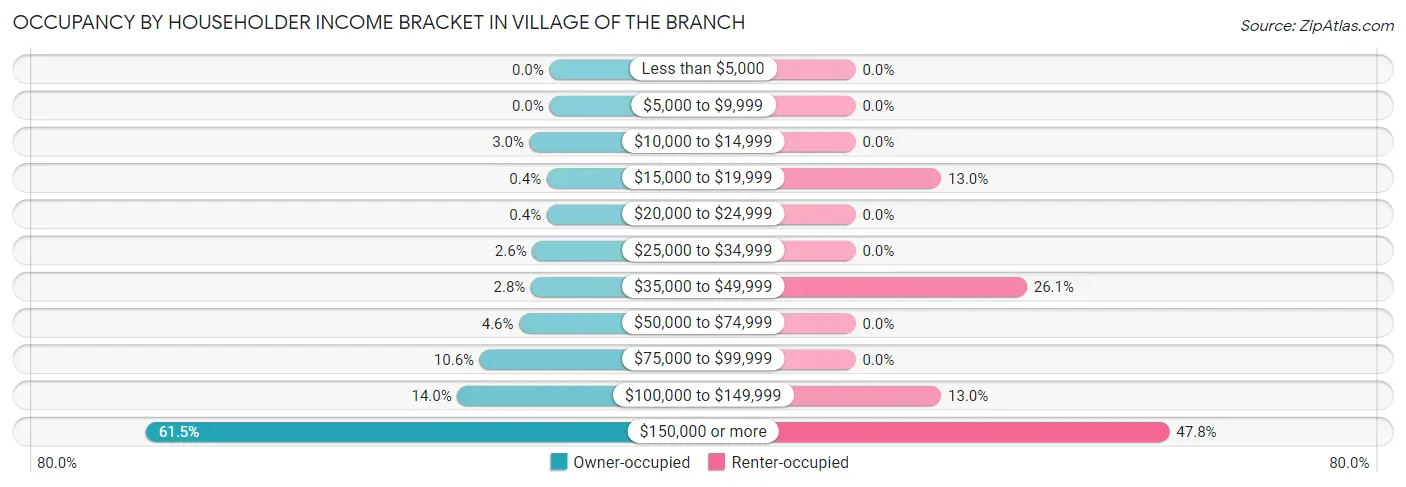
| Income Bracket | Owner-occupied | Renter-occupied |
| Less than $5,000 | 0 (0.0%) | 0 (0.0%) |
| $5,000 to $9,999 | 0 (0.0%) | 0 (0.0%) |
| $10,000 to $14,999 | 15 (3.0%) | 0 (0.0%) |
| $15,000 to $19,999 | 2 (0.4%) | 3 (13.0%) |
| $20,000 to $24,999 | 2 (0.4%) | 0 (0.0%) |
| $25,000 to $34,999 | 13 (2.6%) | 0 (0.0%) |
| $35,000 to $49,999 | 14 (2.8%) | 6 (26.1%) |
| $50,000 to $74,999 | 23 (4.6%) | 0 (0.0%) |
| $75,000 to $99,999 | 53 (10.6%) | 0 (0.0%) |
| $100,000 to $149,999 | 70 (14.0%) | 3 (13.0%) |
| $150,000 or more | 307 (61.5%) | 11 (47.8%) |
| Total | 499 (100.0%) | 23 (100.0%) |
Monthly Housing Cost Tiers in Village of the Branch
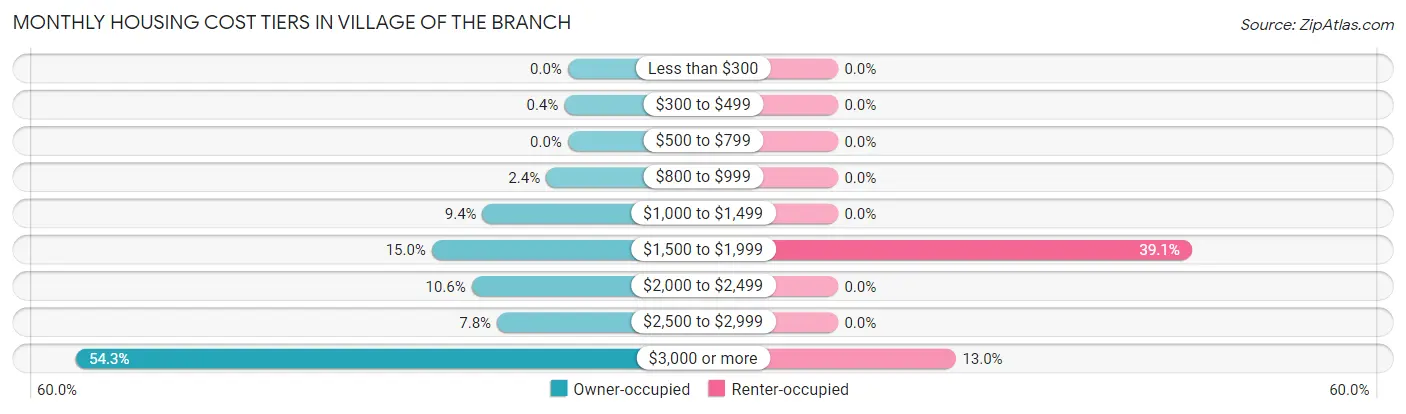
| Monthly Cost | Owner-occupied | Renter-occupied |
| Less than $300 | 0 (0.0%) | 0 (0.0%) |
| $300 to $499 | 2 (0.4%) | 0 (0.0%) |
| $500 to $799 | 0 (0.0%) | 0 (0.0%) |
| $800 to $999 | 12 (2.4%) | 0 (0.0%) |
| $1,000 to $1,499 | 47 (9.4%) | 0 (0.0%) |
| $1,500 to $1,999 | 75 (15.0%) | 9 (39.1%) |
| $2,000 to $2,499 | 53 (10.6%) | 0 (0.0%) |
| $2,500 to $2,999 | 39 (7.8%) | 0 (0.0%) |
| $3,000 or more | 271 (54.3%) | 3 (13.0%) |
| Total | 499 (100.0%) | 23 (100.0%) |
Physical Housing Characteristics in Village of the Branch
Housing Structures in Village of the Branch
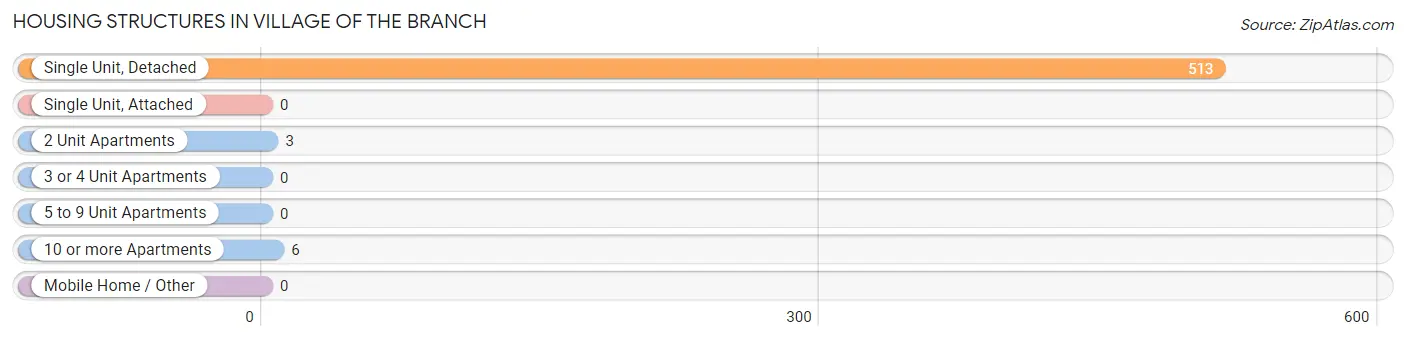
| Structure Type | # Housing Units | % Housing Units |
| Single Unit, Detached | 513 | 98.3% |
| Single Unit, Attached | 0 | 0.0% |
| 2 Unit Apartments | 3 | 0.6% |
| 3 or 4 Unit Apartments | 0 | 0.0% |
| 5 to 9 Unit Apartments | 0 | 0.0% |
| 10 or more Apartments | 6 | 1.1% |
| Mobile Home / Other | 0 | 0.0% |
| Total | 522 | 100.0% |
Housing Structures by Occupancy in Village of the Branch
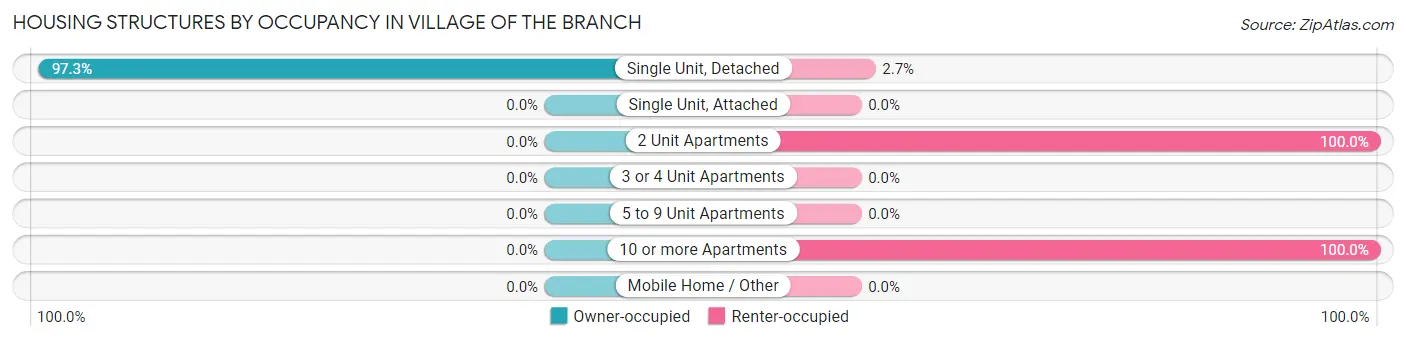
| Structure Type | Owner-occupied | Renter-occupied |
| Single Unit, Detached | 499 (97.3%) | 14 (2.7%) |
| Single Unit, Attached | 0 (0.0%) | 0 (0.0%) |
| 2 Unit Apartments | 0 (0.0%) | 3 (100.0%) |
| 3 or 4 Unit Apartments | 0 (0.0%) | 0 (0.0%) |
| 5 to 9 Unit Apartments | 0 (0.0%) | 0 (0.0%) |
| 10 or more Apartments | 0 (0.0%) | 6 (100.0%) |
| Mobile Home / Other | 0 (0.0%) | 0 (0.0%) |
| Total | 499 (95.6%) | 23 (4.4%) |
Housing Structures by Number of Rooms in Village of the Branch
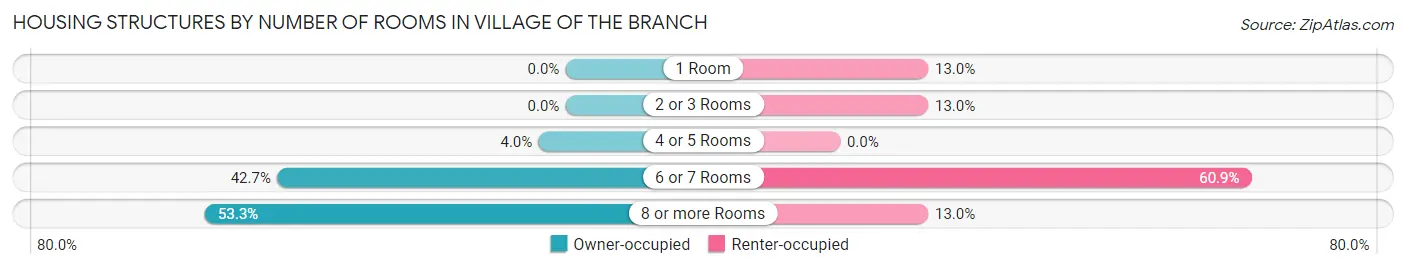
| Number of Rooms | Owner-occupied | Renter-occupied |
| 1 Room | 0 (0.0%) | 3 (13.0%) |
| 2 or 3 Rooms | 0 (0.0%) | 3 (13.0%) |
| 4 or 5 Rooms | 20 (4.0%) | 0 (0.0%) |
| 6 or 7 Rooms | 213 (42.7%) | 14 (60.9%) |
| 8 or more Rooms | 266 (53.3%) | 3 (13.0%) |
| Total | 499 (100.0%) | 23 (100.0%) |
Housing Structure by Heating Type in Village of the Branch
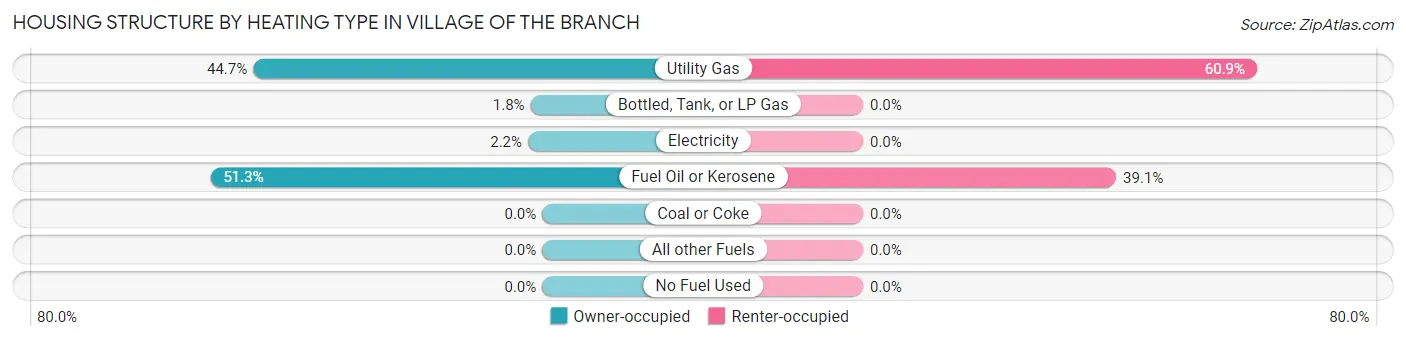
| Heating Type | Owner-occupied | Renter-occupied |
| Utility Gas | 223 (44.7%) | 14 (60.9%) |
| Bottled, Tank, or LP Gas | 9 (1.8%) | 0 (0.0%) |
| Electricity | 11 (2.2%) | 0 (0.0%) |
| Fuel Oil or Kerosene | 256 (51.3%) | 9 (39.1%) |
| Coal or Coke | 0 (0.0%) | 0 (0.0%) |
| All other Fuels | 0 (0.0%) | 0 (0.0%) |
| No Fuel Used | 0 (0.0%) | 0 (0.0%) |
| Total | 499 (100.0%) | 23 (100.0%) |
Household Vehicle Usage in Village of the Branch
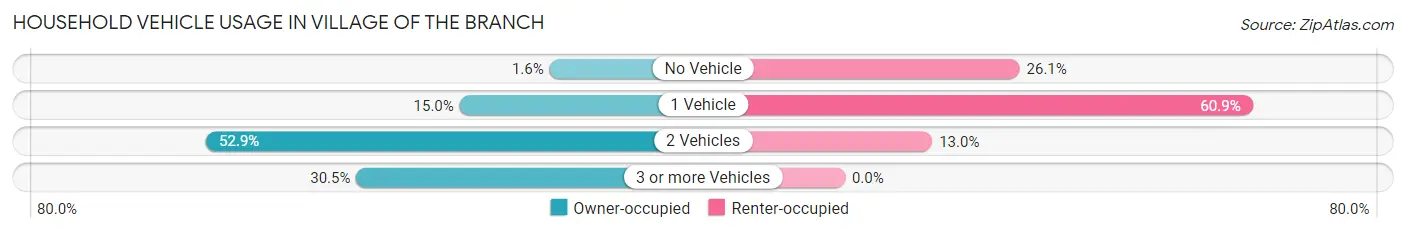
| Vehicles per Household | Owner-occupied | Renter-occupied |
| No Vehicle | 8 (1.6%) | 6 (26.1%) |
| 1 Vehicle | 75 (15.0%) | 14 (60.9%) |
| 2 Vehicles | 264 (52.9%) | 3 (13.0%) |
| 3 or more Vehicles | 152 (30.5%) | 0 (0.0%) |
| Total | 499 (100.0%) | 23 (100.0%) |
Real Estate & Mortgages in Village of the Branch
Real Estate and Mortgage Overview in Village of the Branch
| Characteristic | Without Mortgage | With Mortgage |
| Housing Units | 156 | 343 |
| Median Property Value | $605,300 | $621,400 |
| Median Household Income | $115,833 | $246 |
| Monthly Housing Costs | $1,501 | $268 |
| Real Estate Taxes | $10,001 | $0 |
Property Value by Mortgage Status in Village of the Branch
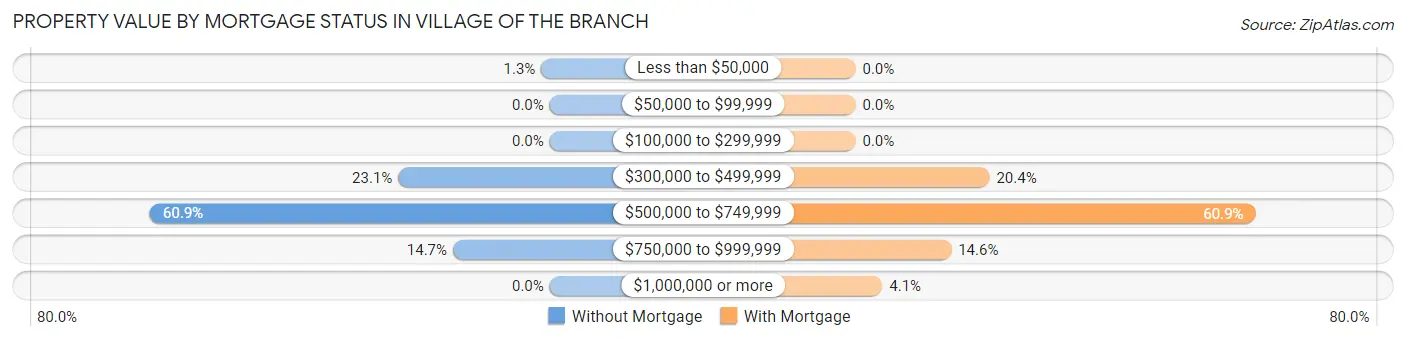
| Property Value | Without Mortgage | With Mortgage |
| Less than $50,000 | 2 (1.3%) | 0 (0.0%) |
| $50,000 to $99,999 | 0 (0.0%) | 0 (0.0%) |
| $100,000 to $299,999 | 0 (0.0%) | 0 (0.0%) |
| $300,000 to $499,999 | 36 (23.1%) | 70 (20.4%) |
| $500,000 to $749,999 | 95 (60.9%) | 209 (60.9%) |
| $750,000 to $999,999 | 23 (14.7%) | 50 (14.6%) |
| $1,000,000 or more | 0 (0.0%) | 14 (4.1%) |
| Total | 156 (100.0%) | 343 (100.0%) |
Household Income by Mortgage Status in Village of the Branch
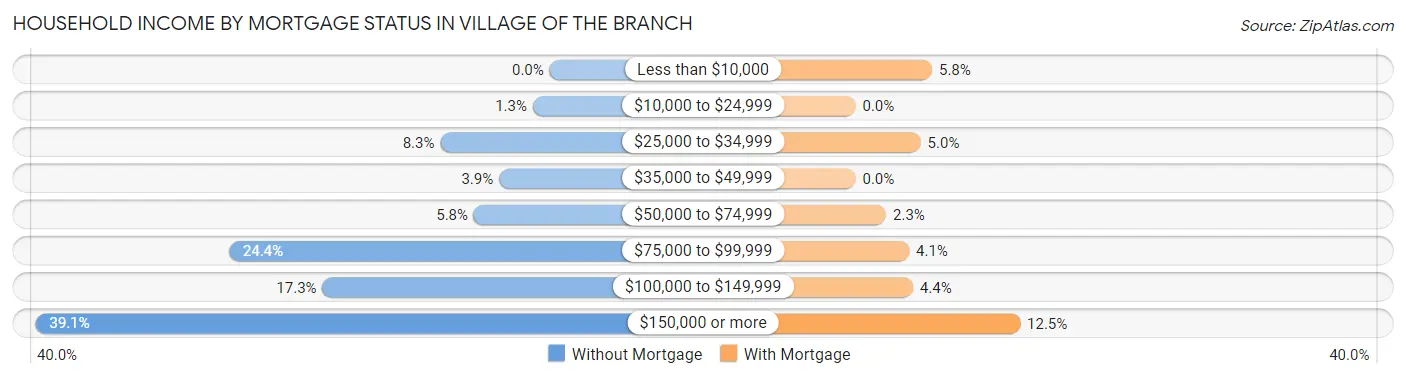
| Household Income | Without Mortgage | With Mortgage |
| Less than $10,000 | 0 (0.0%) | 20 (5.8%) |
| $10,000 to $24,999 | 2 (1.3%) | 0 (0.0%) |
| $25,000 to $34,999 | 13 (8.3%) | 17 (5.0%) |
| $35,000 to $49,999 | 6 (3.8%) | 0 (0.0%) |
| $50,000 to $74,999 | 9 (5.8%) | 8 (2.3%) |
| $75,000 to $99,999 | 38 (24.4%) | 14 (4.1%) |
| $100,000 to $149,999 | 27 (17.3%) | 15 (4.4%) |
| $150,000 or more | 61 (39.1%) | 43 (12.5%) |
| Total | 156 (100.0%) | 343 (100.0%) |
Property Value to Household Income Ratio in Village of the Branch
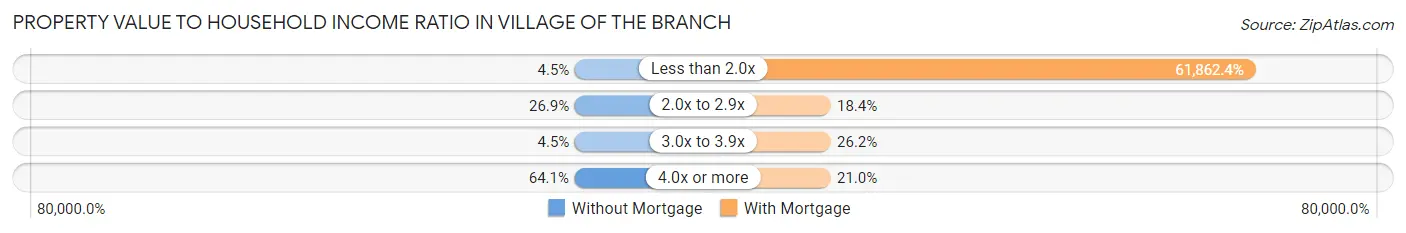
| Value-to-Income Ratio | Without Mortgage | With Mortgage |
| Less than 2.0x | 7 (4.5%) | 212,188 (61,862.4%) |
| 2.0x to 2.9x | 42 (26.9%) | 63 (18.4%) |
| 3.0x to 3.9x | 7 (4.5%) | 90 (26.2%) |
| 4.0x or more | 100 (64.1%) | 72 (21.0%) |
| Total | 156 (100.0%) | 343 (100.0%) |
Real Estate Taxes by Mortgage Status in Village of the Branch
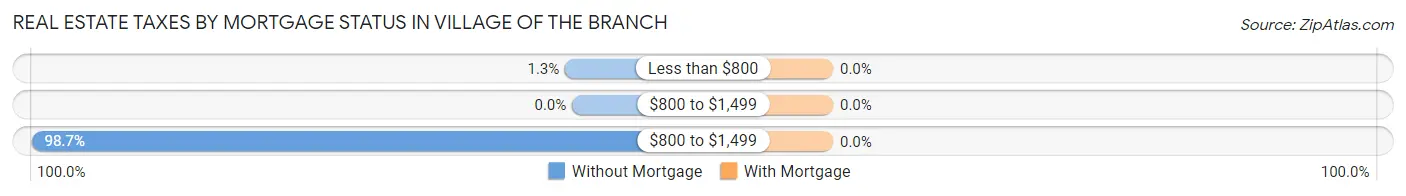
| Property Taxes | Without Mortgage | With Mortgage |
| Less than $800 | 2 (1.3%) | 0 (0.0%) |
| $800 to $1,499 | 0 (0.0%) | 0 (0.0%) |
| $800 to $1,499 | 154 (98.7%) | 0 (0.0%) |
| Total | 156 (100.0%) | 343 (100.0%) |
Health & Disability in Village of the Branch
Health Insurance Coverage by Age in Village of the Branch
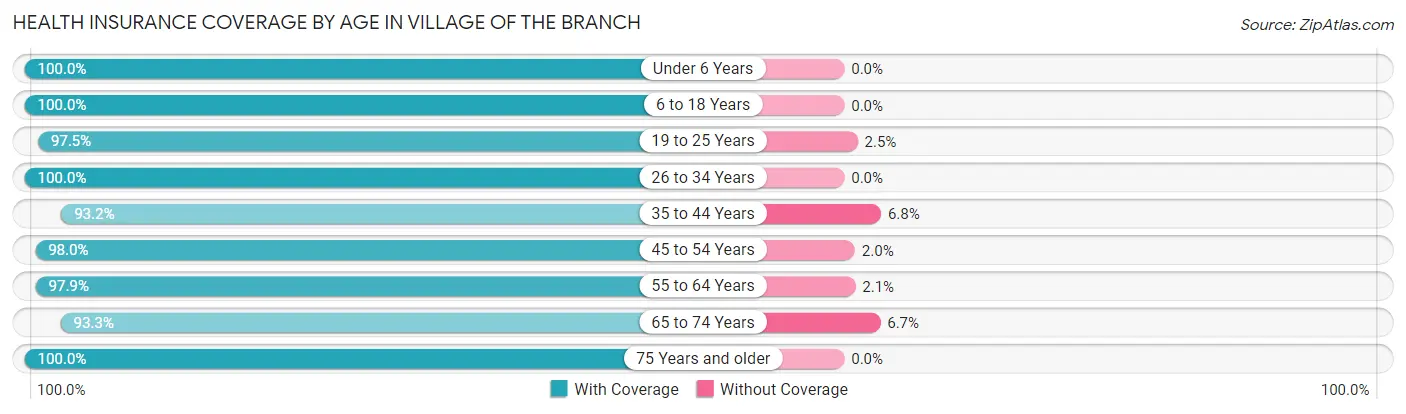
| Age Bracket | With Coverage | Without Coverage |
| Under 6 Years | 84 (100.0%) | 0 (0.0%) |
| 6 to 18 Years | 263 (100.0%) | 0 (0.0%) |
| 19 to 25 Years | 197 (97.5%) | 5 (2.5%) |
| 26 to 34 Years | 153 (100.0%) | 0 (0.0%) |
| 35 to 44 Years | 109 (93.2%) | 8 (6.8%) |
| 45 to 54 Years | 198 (98.0%) | 4 (2.0%) |
| 55 to 64 Years | 333 (97.9%) | 7 (2.1%) |
| 65 to 74 Years | 139 (93.3%) | 10 (6.7%) |
| 75 Years and older | 176 (100.0%) | 0 (0.0%) |
| Total | 1,652 (98.0%) | 34 (2.0%) |
Health Insurance Coverage by Citizenship Status in Village of the Branch
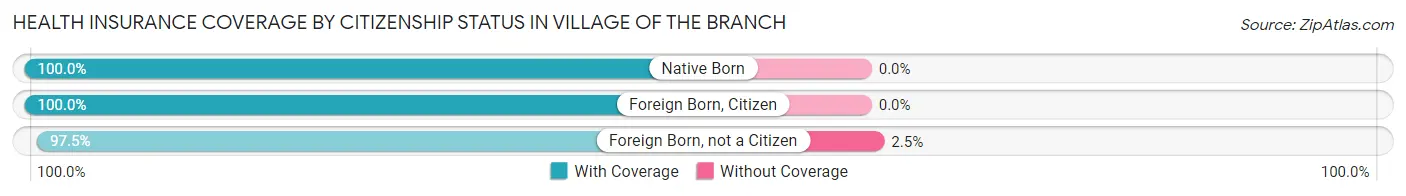
| Citizenship Status | With Coverage | Without Coverage |
| Native Born | 84 (100.0%) | 0 (0.0%) |
| Foreign Born, Citizen | 263 (100.0%) | 0 (0.0%) |
| Foreign Born, not a Citizen | 197 (97.5%) | 5 (2.5%) |
Health Insurance Coverage by Household Income in Village of the Branch
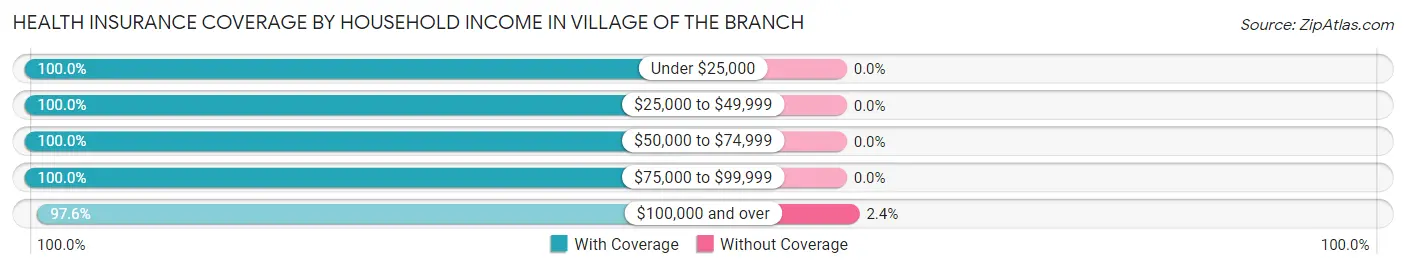
| Household Income | With Coverage | Without Coverage |
| Under $25,000 | 40 (100.0%) | 0 (0.0%) |
| $25,000 to $49,999 | 35 (100.0%) | 0 (0.0%) |
| $50,000 to $74,999 | 33 (100.0%) | 0 (0.0%) |
| $75,000 to $99,999 | 116 (100.0%) | 0 (0.0%) |
| $100,000 and over | 1,396 (97.6%) | 34 (2.4%) |
Public vs Private Health Insurance Coverage by Age in Village of the Branch
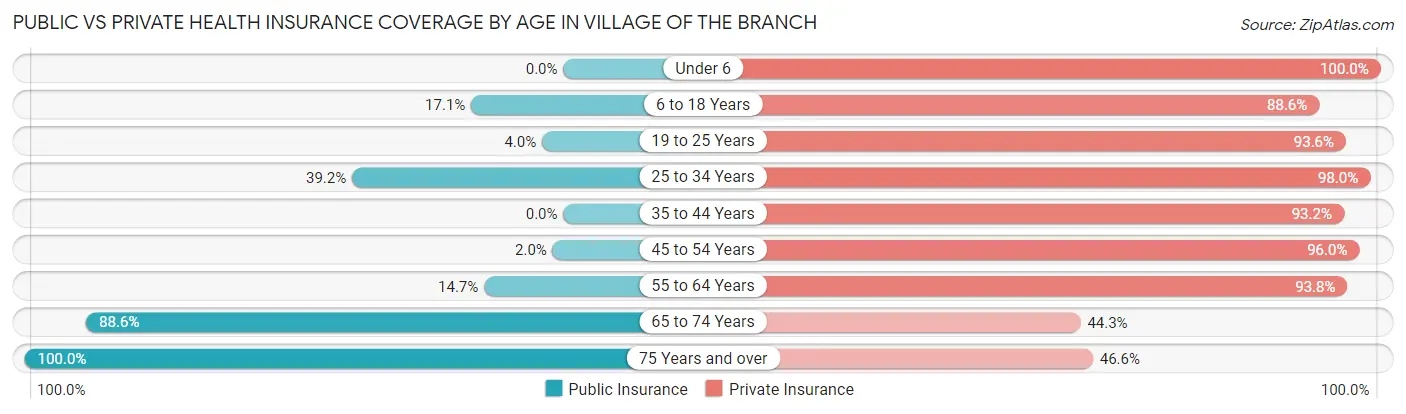
| Age Bracket | Public Insurance | Private Insurance |
| Under 6 | 0 (0.0%) | 84 (100.0%) |
| 6 to 18 Years | 45 (17.1%) | 233 (88.6%) |
| 19 to 25 Years | 8 (4.0%) | 189 (93.6%) |
| 25 to 34 Years | 60 (39.2%) | 150 (98.0%) |
| 35 to 44 Years | 0 (0.0%) | 109 (93.2%) |
| 45 to 54 Years | 4 (2.0%) | 194 (96.0%) |
| 55 to 64 Years | 50 (14.7%) | 319 (93.8%) |
| 65 to 74 Years | 132 (88.6%) | 66 (44.3%) |
| 75 Years and over | 176 (100.0%) | 82 (46.6%) |
| Total | 475 (28.2%) | 1,426 (84.6%) |
Disability Status by Sex by Age in Village of the Branch
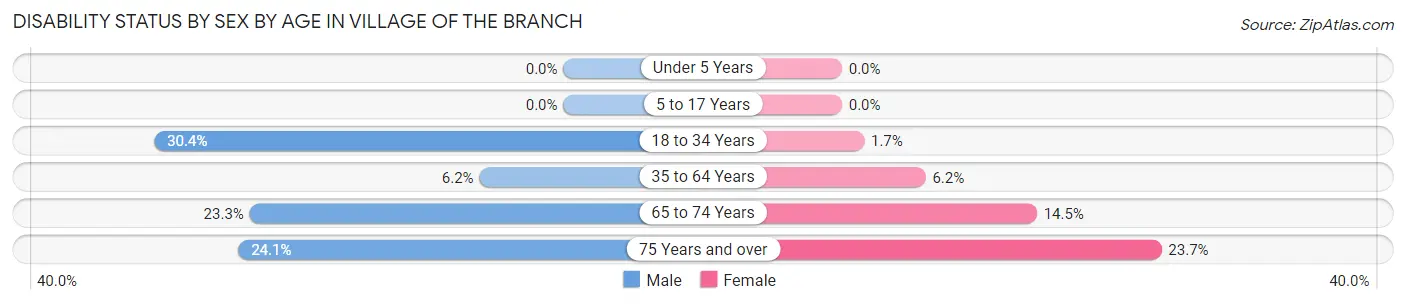
| Age Bracket | Male | Female |
| Under 5 Years | 0 (0.0%) | 0 (0.0%) |
| 5 to 17 Years | 0 (0.0%) | 0 (0.0%) |
| 18 to 34 Years | 62 (30.4%) | 3 (1.7%) |
| 35 to 64 Years | 21 (6.2%) | 20 (6.2%) |
| 65 to 74 Years | 17 (23.3%) | 11 (14.5%) |
| 75 Years and over | 14 (24.1%) | 28 (23.7%) |
Disability Class by Sex by Age in Village of the Branch
Disability Class: Hearing Difficulty
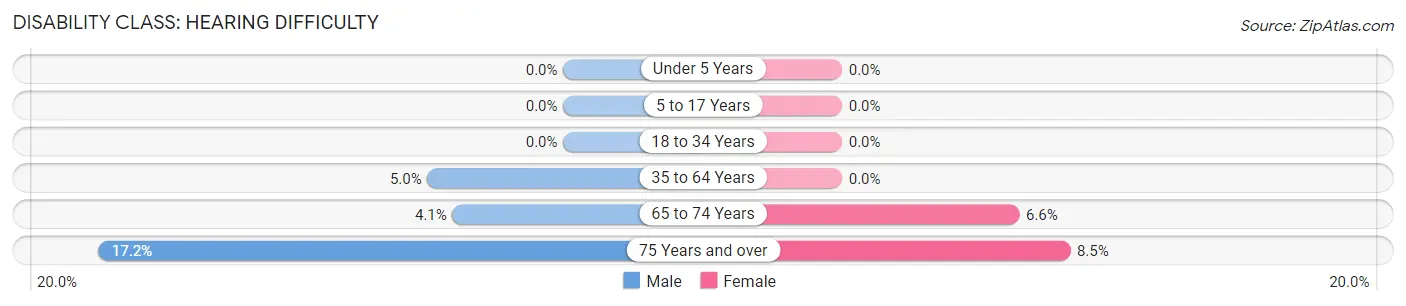
| Age Bracket | Male | Female |
| Under 5 Years | 0 (0.0%) | 0 (0.0%) |
| 5 to 17 Years | 0 (0.0%) | 0 (0.0%) |
| 18 to 34 Years | 0 (0.0%) | 0 (0.0%) |
| 35 to 64 Years | 17 (5.0%) | 0 (0.0%) |
| 65 to 74 Years | 3 (4.1%) | 5 (6.6%) |
| 75 Years and over | 10 (17.2%) | 10 (8.5%) |
Disability Class: Vision Difficulty
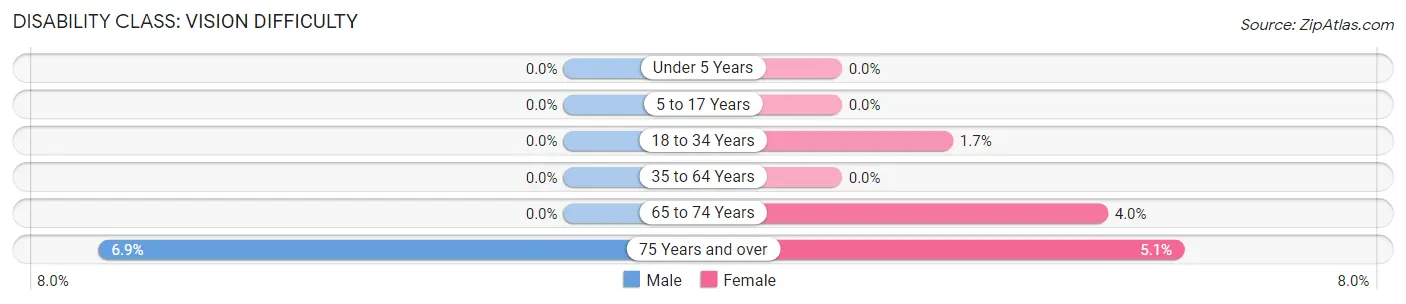
| Age Bracket | Male | Female |
| Under 5 Years | 0 (0.0%) | 0 (0.0%) |
| 5 to 17 Years | 0 (0.0%) | 0 (0.0%) |
| 18 to 34 Years | 0 (0.0%) | 3 (1.7%) |
| 35 to 64 Years | 0 (0.0%) | 0 (0.0%) |
| 65 to 74 Years | 0 (0.0%) | 3 (4.0%) |
| 75 Years and over | 4 (6.9%) | 6 (5.1%) |
Disability Class: Cognitive Difficulty
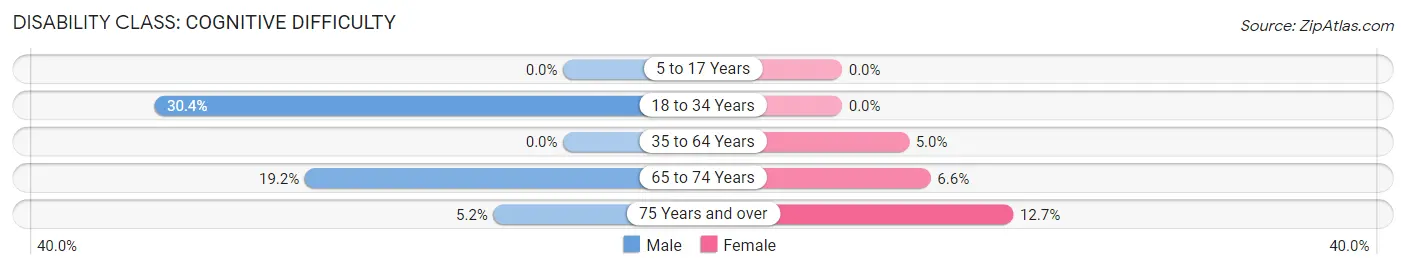
| Age Bracket | Male | Female |
| 5 to 17 Years | 0 (0.0%) | 0 (0.0%) |
| 18 to 34 Years | 62 (30.4%) | 0 (0.0%) |
| 35 to 64 Years | 0 (0.0%) | 16 (5.0%) |
| 65 to 74 Years | 14 (19.2%) | 5 (6.6%) |
| 75 Years and over | 3 (5.2%) | 15 (12.7%) |
Disability Class: Ambulatory Difficulty
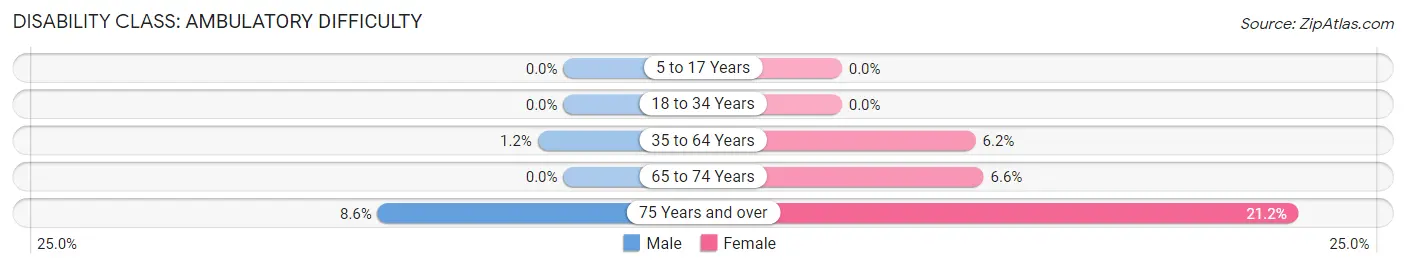
| Age Bracket | Male | Female |
| 5 to 17 Years | 0 (0.0%) | 0 (0.0%) |
| 18 to 34 Years | 0 (0.0%) | 0 (0.0%) |
| 35 to 64 Years | 4 (1.2%) | 20 (6.2%) |
| 65 to 74 Years | 0 (0.0%) | 5 (6.6%) |
| 75 Years and over | 5 (8.6%) | 25 (21.2%) |
Disability Class: Self-Care Difficulty
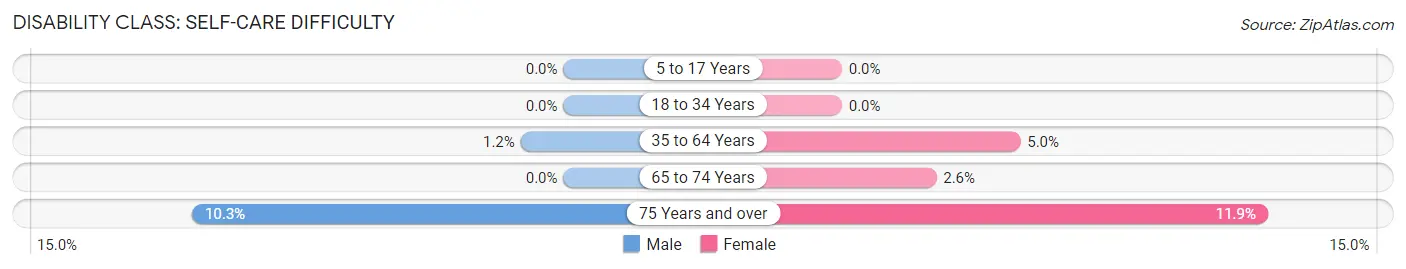
| Age Bracket | Male | Female |
| 5 to 17 Years | 0 (0.0%) | 0 (0.0%) |
| 18 to 34 Years | 0 (0.0%) | 0 (0.0%) |
| 35 to 64 Years | 4 (1.2%) | 16 (5.0%) |
| 65 to 74 Years | 0 (0.0%) | 2 (2.6%) |
| 75 Years and over | 6 (10.3%) | 14 (11.9%) |
Technology Access in Village of the Branch
Computing Device Access in Village of the Branch
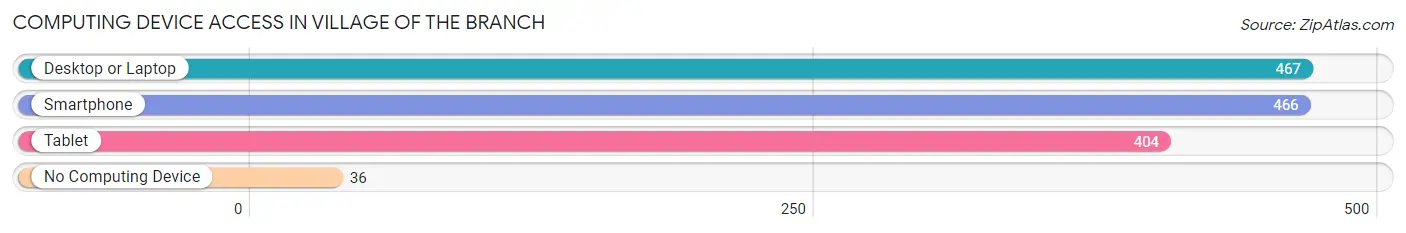
| Device Type | # Households | % Households |
| Desktop or Laptop | 467 | 89.5% |
| Smartphone | 466 | 89.3% |
| Tablet | 404 | 77.4% |
| No Computing Device | 36 | 6.9% |
| Total | 522 | 100.0% |
Internet Access in Village of the Branch
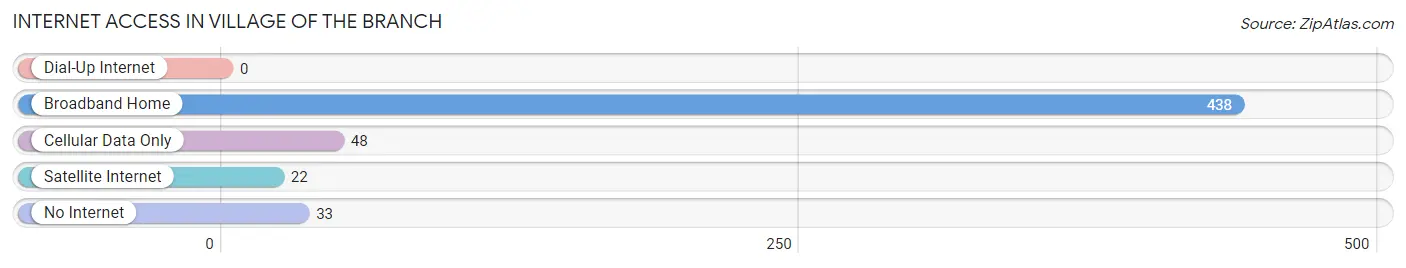
| Internet Type | # Households | % Households |
| Dial-Up Internet | 0 | 0.0% |
| Broadband Home | 438 | 83.9% |
| Cellular Data Only | 48 | 9.2% |
| Satellite Internet | 22 | 4.2% |
| No Internet | 33 | 6.3% |
| Total | 522 | 100.0% |
Village of the Branch Summary
Village of the Branch is a small village located in the Town of Smithtown in Suffolk County, New York. The village is situated on the north shore of Long Island, approximately 50 miles east of New York City. The village is home to approximately 2,000 people and is a popular destination for tourists and locals alike.
Geography
The Village of the Branch is located on the north shore of Long Island, approximately 50 miles east of New York City. The village is situated on the Nissequogue River, which is a tributary of the Long Island Sound. The village is bordered by the Town of Smithtown to the west, the Town of Huntington to the east, and the Town of Brookhaven to the south. The village is located in the heart of Suffolk County, and is surrounded by a number of other villages and hamlets, including St. James, Nissequogue, and Kings Park.
The village is situated on a flat plain, with an elevation of approximately 20 feet above sea level. The village is located in a temperate climate, with average temperatures ranging from the mid-30s in the winter to the mid-80s in the summer. The village receives an average of 45 inches of precipitation annually, with most of the precipitation occurring in the spring and summer months.
Economy
The Village of the Branch is primarily a residential community, with a small commercial district located in the center of the village. The village is home to a number of small businesses, including restaurants, retail stores, and professional services. The village is also home to a number of small manufacturing companies, including a furniture manufacturer and a printing company.
The village is also home to a number of recreational facilities, including a golf course, a tennis club, and a public beach. The village is also home to a number of parks and open spaces, including a nature preserve and a bird sanctuary.
Demographics
As of the 2010 census, the Village of the Branch had a population of 2,000 people. The population is predominantly white (90.2%), with a small percentage of African Americans (3.2%), Asians (2.2%), and Hispanics (2.2%). The median household income in the village is $75,000, and the median home value is $400,000.
The village is served by the Smithtown Central School District, which includes five elementary schools, two middle schools, and one high school. The village is also home to a number of private schools, including a Catholic school and a Montessori school.
Conclusion
The Village of the Branch is a small village located on the north shore of Long Island, approximately 50 miles east of New York City. The village is home to approximately 2,000 people and is a popular destination for tourists and locals alike. The village is primarily a residential community, with a small commercial district located in the center of the village. The village is also home to a number of recreational facilities, including a golf course, a tennis club, and a public beach. The population is predominantly white, with a small percentage of African Americans, Asians, and Hispanics. The median household income in the village is $75,000, and the median home value is $400,000. The village is served by the Smithtown Central School District, which includes five elementary schools, two middle schools, and one high school.
Common Questions
What is Per Capita Income in Village of the Branch?
Per Capita income in Village of the Branch is $64,330.
What is the Median Family Income in Village of the Branch?
Median Family Income in Village of the Branch is $205,859.
What is the Median Household income in Village of the Branch?
Median Household Income in Village of the Branch is $173,594.
What is Income or Wage Gap in Village of the Branch?
Income or Wage Gap in Village of the Branch is 43.7%.
Women in Village of the Branch earn 56.3 cents for every dollar earned by a man.
What is Inequality or Gini Index in Village of the Branch?
Inequality or Gini Index in Village of the Branch is 0.38.
What is the Total Population of Village of the Branch?
Total Population of Village of the Branch is 1,747.
What is the Total Male Population of Village of the Branch?
Total Male Population of Village of the Branch is 816.
What is the Total Female Population of Village of the Branch?
Total Female Population of Village of the Branch is 931.
What is the Ratio of Males per 100 Females in Village of the Branch?
There are 87.65 Males per 100 Females in Village of the Branch.
What is the Ratio of Females per 100 Males in Village of the Branch?
There are 114.09 Females per 100 Males in Village of the Branch.
What is the Median Population Age in Village of the Branch?
Median Population Age in Village of the Branch is 48.0 Years.
What is the Average Family Size in Village of the Branch
Average Family Size in Village of the Branch is 3.6 People.
What is the Average Household Size in Village of the Branch
Average Household Size in Village of the Branch is 3.2 People.
How Large is the Labor Force in Village of the Branch?
There are 871 People in the Labor Forcein in Village of the Branch.
What is the Percentage of People in the Labor Force in Village of the Branch?
58.6% of People are in the Labor Force in Village of the Branch.
What is the Unemployment Rate in Village of the Branch?
Unemployment Rate in Village of the Branch is 5.6%.