Victor, NY Map & Demographics
Victor Map
Victor Overview
$41,969
PER CAPITA INCOME
$109,125
AVG FAMILY INCOME
$89,911
AVG HOUSEHOLD INCOME
34.9%
WAGE / INCOME GAP [ % ]
65.1¢/ $1
WAGE / INCOME GAP [ $ ]
0.40
INEQUALITY / GINI INDEX
2,722
TOTAL POPULATION
1,313
MALE POPULATION
1,409
FEMALE POPULATION
93.19
MALES / 100 FEMALES
107.31
FEMALES / 100 MALES
40.1
MEDIAN AGE
2.9
AVG FAMILY SIZE
2.5
AVG HOUSEHOLD SIZE
1,326
LABOR FORCE [ PEOPLE ]
63.8%
PERCENT IN LABOR FORCE
1.4%
UNEMPLOYMENT RATE
Victor Zip Codes
Victor Area Codes
Income in Victor
Income Overview in Victor
Per Capita Income in Victor is $41,969, while median incomes of families and households are $109,125 and $89,911 respectively.
| Characteristic | Number | Measure |
| Per Capita Income | 2,722 | $41,969 |
| Median Family Income | 757 | $109,125 |
| Mean Family Income | 757 | $123,843 |
| Median Household Income | 1,099 | $89,911 |
| Mean Household Income | 1,099 | $103,081 |
| Income Deficit | 757 | $0 |
| Wage / Income Gap (%) | 2,722 | 34.90% |
| Wage / Income Gap ($) | 2,722 | 65.10¢ per $1 |
| Gini / Inequality Index | 2,722 | 0.40 |
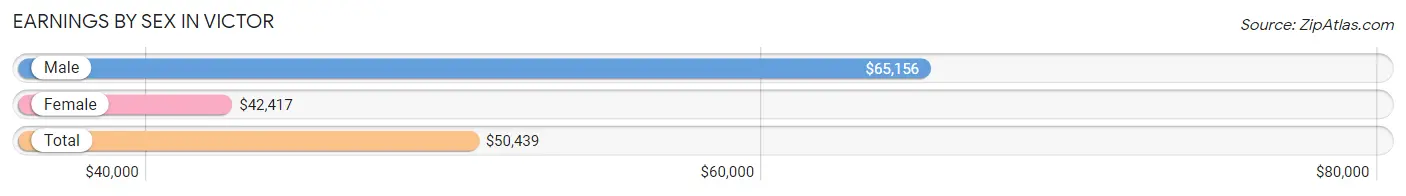
Earnings by Sex in Victor
Average Earnings in Victor are $50,439, $65,156 for men and $42,417 for women, a difference of 34.9%.
| Sex | Number | Average Earnings |
| Male | 739 (53.1%) | $65,156 |
| Female | 652 (46.9%) | $42,417 |
| Total | 1,391 (100.0%) | $50,439 |
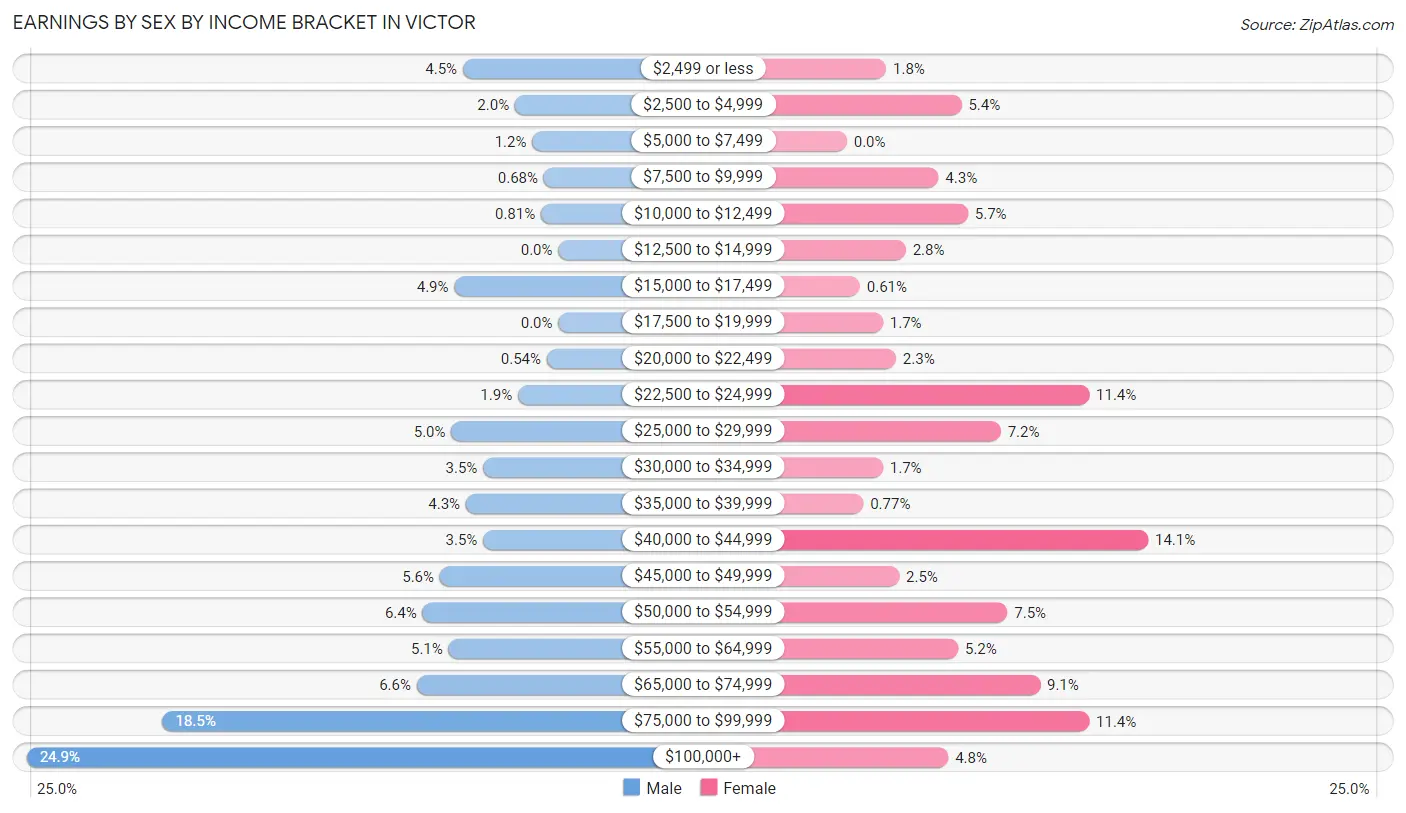
Earnings by Sex by Income Bracket in Victor
The most common earnings brackets in Victor are $100,000+ for men (184 | 24.9%) and $40,000 to $44,999 for women (92 | 14.1%).
| Income | Male | Female |
| $2,499 or less | 33 (4.5%) | 12 (1.8%) |
| $2,500 to $4,999 | 15 (2.0%) | 35 (5.4%) |
| $5,000 to $7,499 | 9 (1.2%) | 0 (0.0%) |
| $7,500 to $9,999 | 5 (0.7%) | 28 (4.3%) |
| $10,000 to $12,499 | 6 (0.8%) | 37 (5.7%) |
| $12,500 to $14,999 | 0 (0.0%) | 18 (2.8%) |
| $15,000 to $17,499 | 36 (4.9%) | 4 (0.6%) |
| $17,500 to $19,999 | 0 (0.0%) | 11 (1.7%) |
| $20,000 to $22,499 | 4 (0.5%) | 15 (2.3%) |
| $22,500 to $24,999 | 14 (1.9%) | 74 (11.4%) |
| $25,000 to $29,999 | 37 (5.0%) | 47 (7.2%) |
| $30,000 to $34,999 | 26 (3.5%) | 11 (1.7%) |
| $35,000 to $39,999 | 32 (4.3%) | 5 (0.8%) |
| $40,000 to $44,999 | 26 (3.5%) | 92 (14.1%) |
| $45,000 to $49,999 | 41 (5.6%) | 16 (2.5%) |
| $50,000 to $54,999 | 47 (6.4%) | 49 (7.5%) |
| $55,000 to $64,999 | 38 (5.1%) | 34 (5.2%) |
| $65,000 to $74,999 | 49 (6.6%) | 59 (9.0%) |
| $75,000 to $99,999 | 137 (18.5%) | 74 (11.4%) |
| $100,000+ | 184 (24.9%) | 31 (4.8%) |
| Total | 739 (100.0%) | 652 (100.0%) |
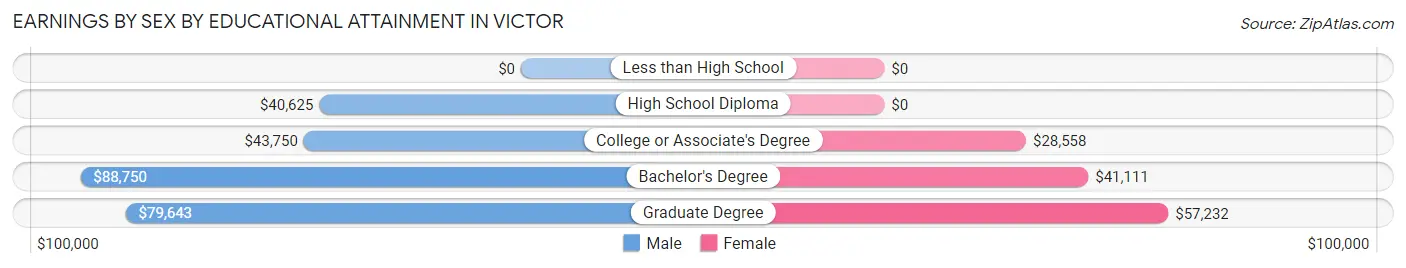
Earnings by Sex by Educational Attainment in Victor
Average earnings in Victor are $69,052 for men and $43,286 for women, a difference of 37.3%. Men with an educational attainment of bachelor's degree enjoy the highest average annual earnings of $88,750, while those with high school diploma education earn the least with $40,625. Women with an educational attainment of graduate degree earn the most with the average annual earnings of $57,232, while those with college or associate's degree education have the smallest earnings of $28,558.
| Educational Attainment | Male Income | Female Income |
| Less than High School | - | - |
| High School Diploma | $40,625 | $0 |
| College or Associate's Degree | $43,750 | $28,558 |
| Bachelor's Degree | $88,750 | $41,111 |
| Graduate Degree | $79,643 | $57,232 |
| Total | $69,052 | $43,286 |
Family Income in Victor
Family Income Brackets in Victor
According to the Victor family income data, there are 177 families falling into the $100,000 to $149,999 income range, which is the most common income bracket and makes up 23.4% of all families.
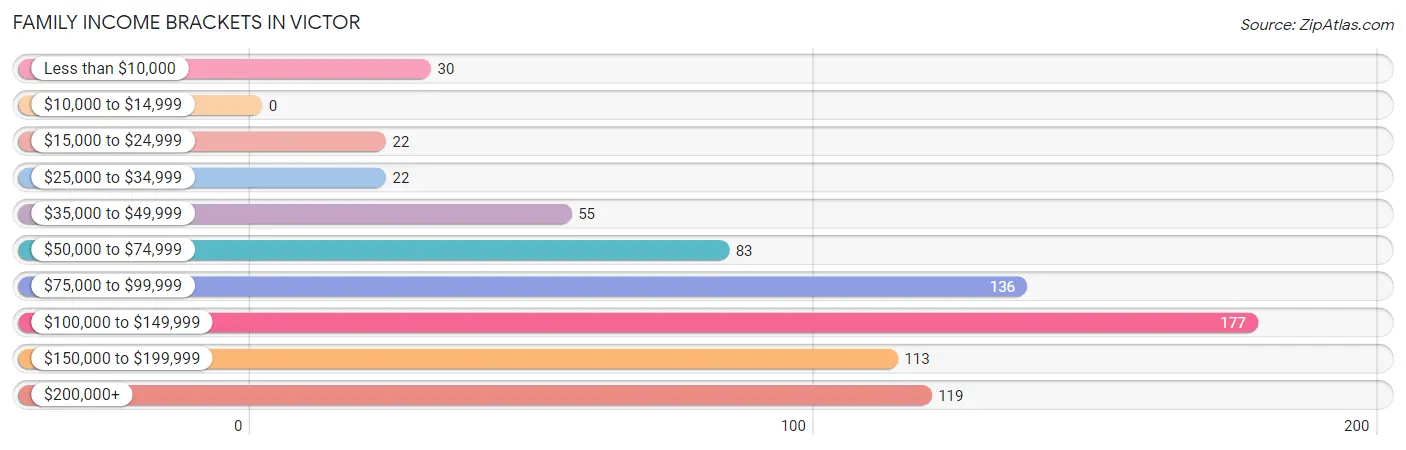
| Income Bracket | # Families | % Families |
| Less than $10,000 | 30 | 4.0% |
| $10,000 to $14,999 | 0 | 0.0% |
| $15,000 to $24,999 | 22 | 2.9% |
| $25,000 to $34,999 | 22 | 2.9% |
| $35,000 to $49,999 | 55 | 7.3% |
| $50,000 to $74,999 | 83 | 11.0% |
| $75,000 to $99,999 | 136 | 18.0% |
| $100,000 to $149,999 | 177 | 23.4% |
| $150,000 to $199,999 | 113 | 14.9% |
| $200,000+ | 119 | 15.7% |
Family Income by Famaliy Size in Victor
4-person families (147 | 19.4%) account for the highest median family income in Victor with $160,208 per family, while 2-person families (387 | 51.1%) have the highest median income of $43,825 per family member.
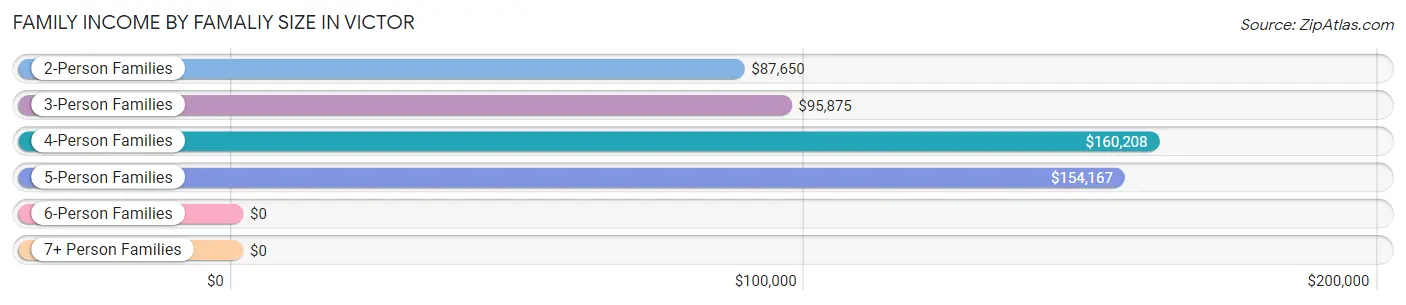
| Income Bracket | # Families | Median Income |
| 2-Person Families | 387 (51.1%) | $87,650 |
| 3-Person Families | 109 (14.4%) | $95,875 |
| 4-Person Families | 147 (19.4%) | $160,208 |
| 5-Person Families | 110 (14.5%) | $154,167 |
| 6-Person Families | 4 (0.5%) | $0 |
| 7+ Person Families | 0 (0.0%) | $0 |
| Total | 757 (100.0%) | $109,125 |
Family Income by Number of Earners in Victor
The median family income in Victor is $109,125, with families comprising 3+ earners (68) having the highest median family income of $173,000, while families with no earners (98) have the lowest median family income of $68,500, accounting for 9.0% and 13.0% of families, respectively.
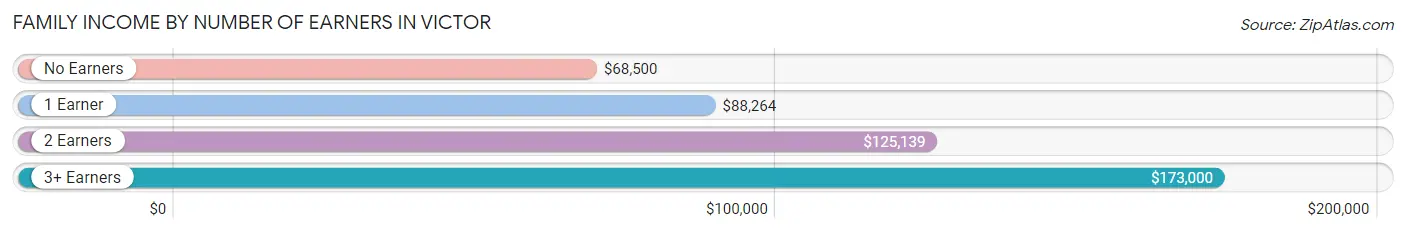
| Number of Earners | # Families | Median Income |
| No Earners | 98 (13.0%) | $68,500 |
| 1 Earner | 270 (35.7%) | $88,264 |
| 2 Earners | 321 (42.4%) | $125,139 |
| 3+ Earners | 68 (9.0%) | $173,000 |
| Total | 757 (100.0%) | $109,125 |
Household Income in Victor
Household Income Brackets in Victor
With 223 households falling in the category, the $100,000 to $149,999 income range is the most frequent in Victor, accounting for 20.3% of all households. In contrast, only 13 households (1.2%) fall into the $10,000 to $14,999 income bracket, making it the least populous group.
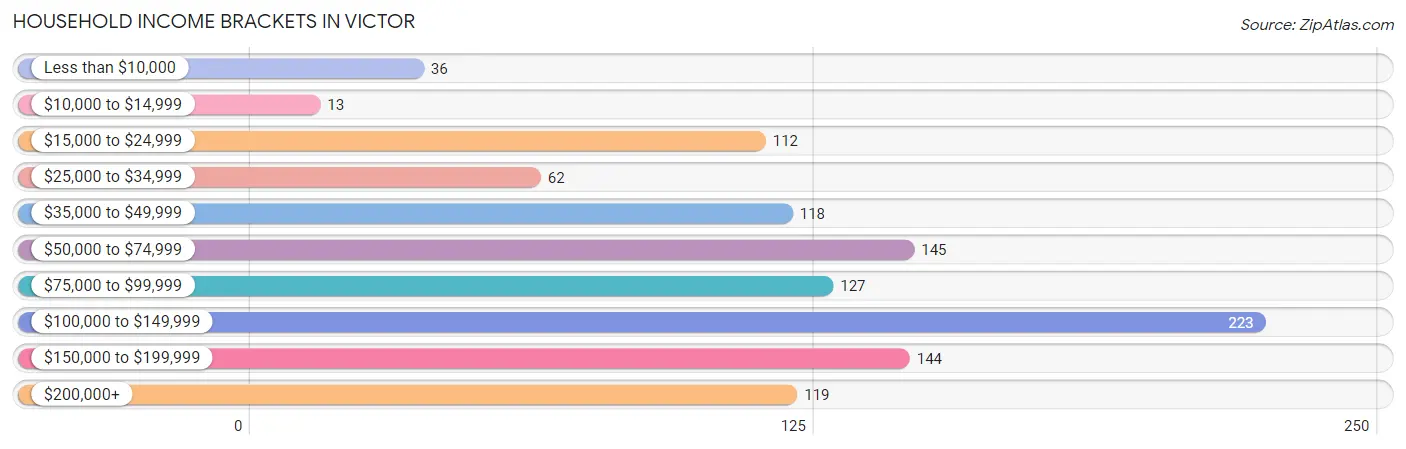
| Income Bracket | # Households | % Households |
| Less than $10,000 | 36 | 3.3% |
| $10,000 to $14,999 | 13 | 1.2% |
| $15,000 to $24,999 | 112 | 10.2% |
| $25,000 to $34,999 | 62 | 5.6% |
| $35,000 to $49,999 | 118 | 10.7% |
| $50,000 to $74,999 | 145 | 13.2% |
| $75,000 to $99,999 | 127 | 11.6% |
| $100,000 to $149,999 | 223 | 20.3% |
| $150,000 to $199,999 | 144 | 13.1% |
| $200,000+ | 119 | 10.8% |
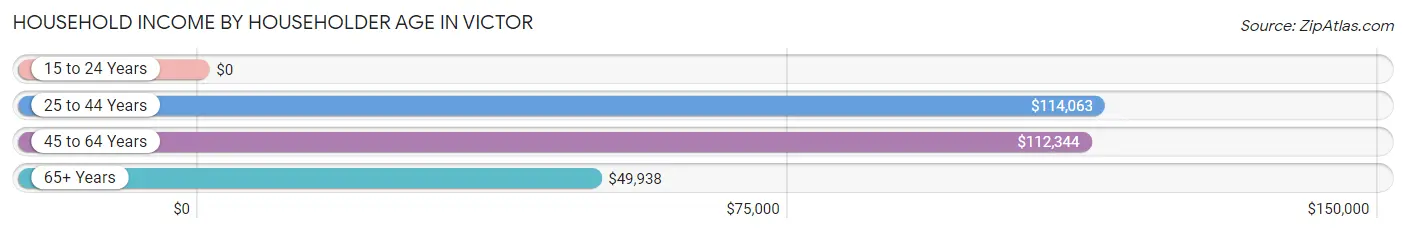
Household Income by Householder Age in Victor
The median household income in Victor is $89,911, with the highest median household income of $114,063 found in the 25 to 44 years age bracket for the primary householder. A total of 321 households (29.2%) fall into this category. Meanwhile, the 15 to 24 years age bracket for the primary householder has the lowest median household income of $0, with 19 households (1.7%) in this group.
| Income Bracket | # Households | Median Income |
| 15 to 24 Years | 19 (1.7%) | $0 |
| 25 to 44 Years | 321 (29.2%) | $114,063 |
| 45 to 64 Years | 405 (36.8%) | $112,344 |
| 65+ Years | 354 (32.2%) | $49,938 |
| Total | 1,099 (100.0%) | $89,911 |
Poverty in Victor
Income Below Poverty by Sex and Age in Victor
With 4.4% poverty level for males and 5.6% for females among the residents of Victor, 12 to 14 year old males and 18 to 24 year old females are the most vulnerable to poverty, with 12 males (19.1%) and 25 females (61.0%) in their respective age groups living below the poverty level.
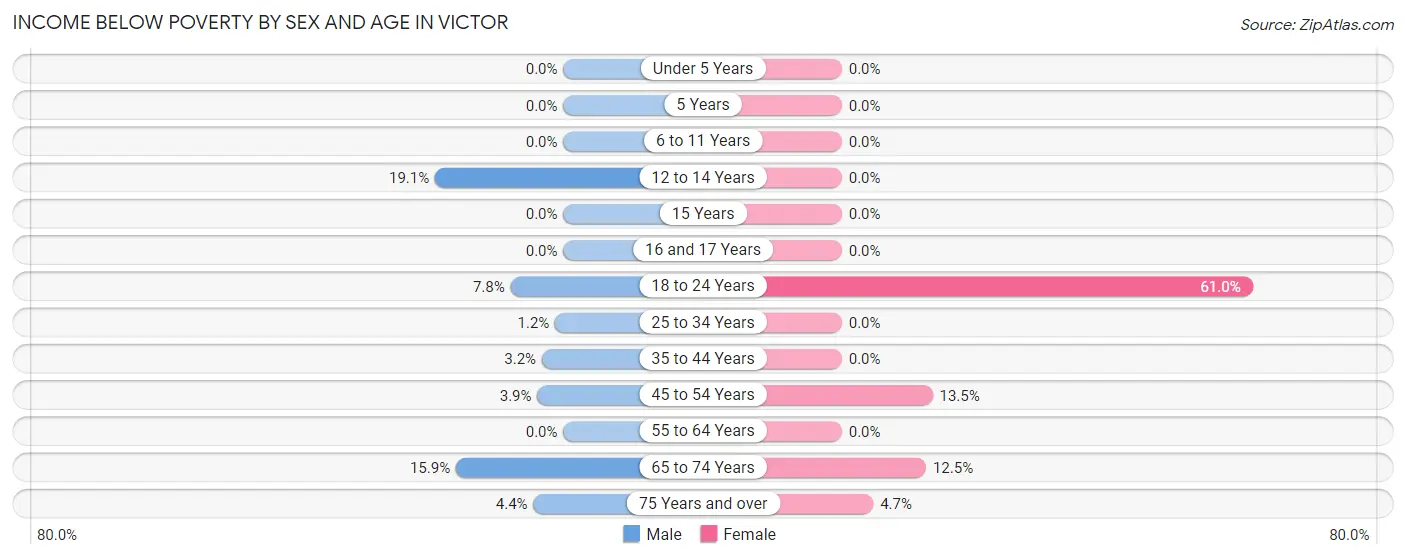
| Age Bracket | Male | Female |
| Under 5 Years | 0 (0.0%) | 0 (0.0%) |
| 5 Years | 0 (0.0%) | 0 (0.0%) |
| 6 to 11 Years | 0 (0.0%) | 0 (0.0%) |
| 12 to 14 Years | 12 (19.1%) | 0 (0.0%) |
| 15 Years | 0 (0.0%) | 0 (0.0%) |
| 16 and 17 Years | 0 (0.0%) | 0 (0.0%) |
| 18 to 24 Years | 4 (7.8%) | 25 (61.0%) |
| 25 to 34 Years | 2 (1.2%) | 0 (0.0%) |
| 35 to 44 Years | 5 (3.2%) | 0 (0.0%) |
| 45 to 54 Years | 8 (3.9%) | 24 (13.5%) |
| 55 to 64 Years | 0 (0.0%) | 0 (0.0%) |
| 65 to 74 Years | 22 (15.9%) | 23 (12.5%) |
| 75 Years and over | 4 (4.4%) | 7 (4.7%) |
| Total | 57 (4.4%) | 79 (5.6%) |
Income Above Poverty by Sex and Age in Victor
According to the poverty statistics in Victor, males aged under 5 years and females aged under 5 years are the age groups that are most secure financially, with 100.0% of males and 100.0% of females in these age groups living above the poverty line.
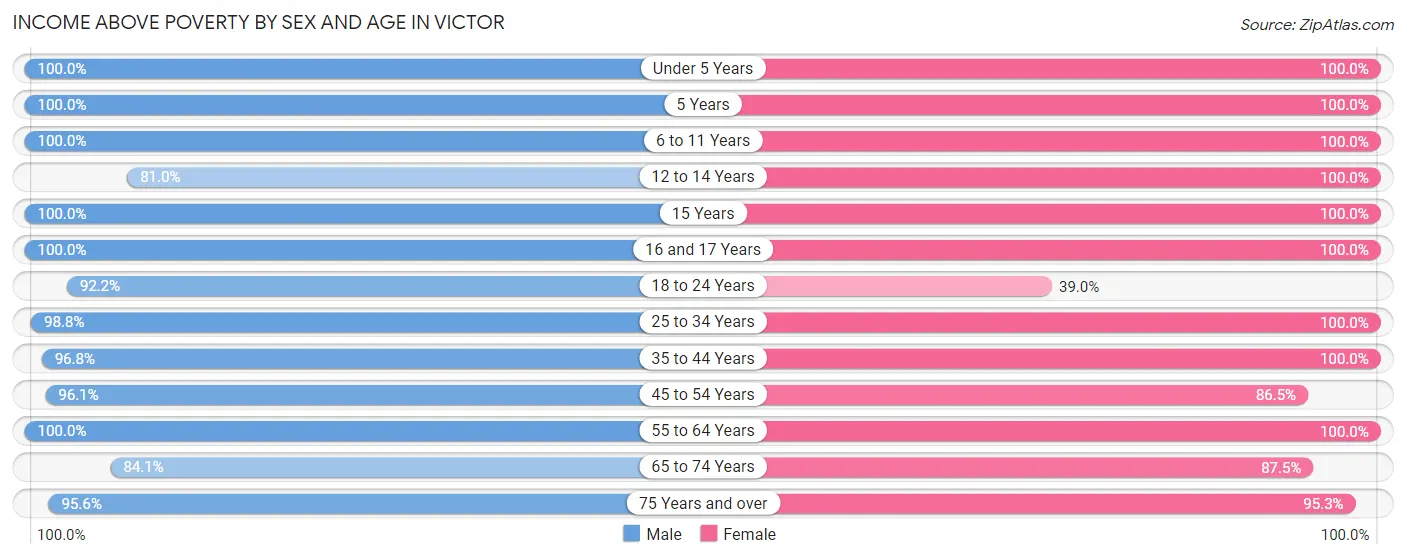
| Age Bracket | Male | Female |
| Under 5 Years | 80 (100.0%) | 86 (100.0%) |
| 5 Years | 32 (100.0%) | 10 (100.0%) |
| 6 to 11 Years | 115 (100.0%) | 113 (100.0%) |
| 12 to 14 Years | 51 (80.9%) | 76 (100.0%) |
| 15 Years | 23 (100.0%) | 30 (100.0%) |
| 16 and 17 Years | 16 (100.0%) | 29 (100.0%) |
| 18 to 24 Years | 47 (92.2%) | 16 (39.0%) |
| 25 to 34 Years | 163 (98.8%) | 178 (100.0%) |
| 35 to 44 Years | 152 (96.8%) | 192 (100.0%) |
| 45 to 54 Years | 199 (96.1%) | 154 (86.5%) |
| 55 to 64 Years | 161 (100.0%) | 142 (100.0%) |
| 65 to 74 Years | 116 (84.1%) | 161 (87.5%) |
| 75 Years and over | 86 (95.6%) | 143 (95.3%) |
| Total | 1,241 (95.6%) | 1,330 (94.4%) |
Income Below Poverty Among Married-Couple Families in Victor
The poverty statistics for married-couple families in Victor show that 3.8% or 23 of the total 611 families live below the poverty line. Families with no children have the highest poverty rate of 7.6%, comprising of 23 families. On the other hand, families with 1 or 2 children have the lowest poverty rate of 0.0%, which includes 0 families.
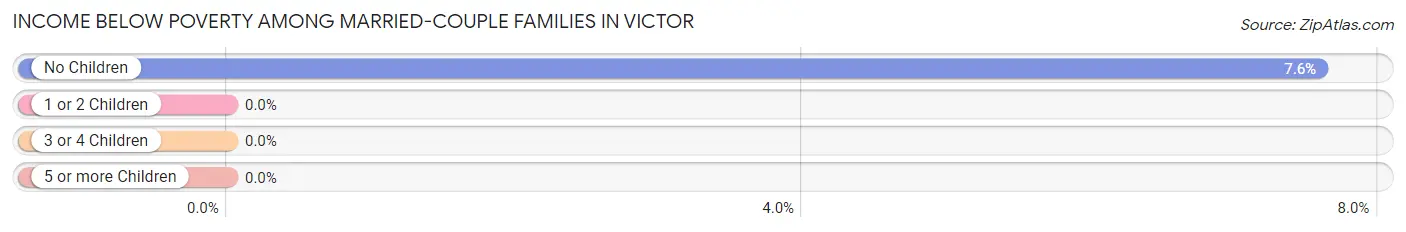
| Children | Above Poverty | Below Poverty |
| No Children | 280 (92.4%) | 23 (7.6%) |
| 1 or 2 Children | 215 (100.0%) | 0 (0.0%) |
| 3 or 4 Children | 93 (100.0%) | 0 (0.0%) |
| 5 or more Children | 0 (0.0%) | 0 (0.0%) |
| Total | 588 (96.2%) | 23 (3.8%) |
Income Below Poverty Among Single-Parent Households in Victor
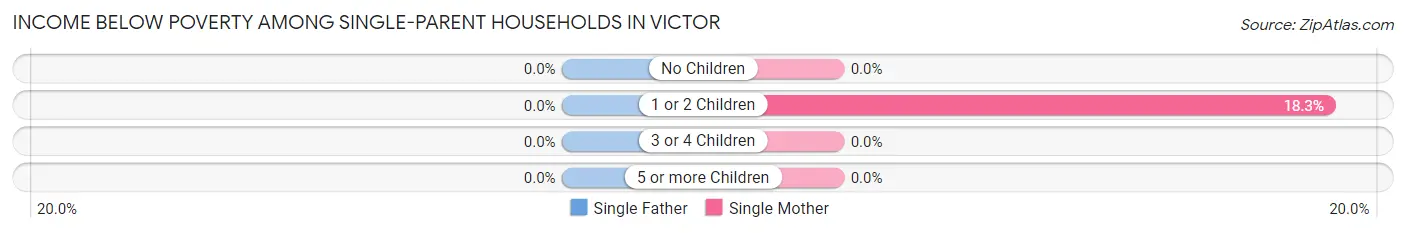
| Children | Single Father | Single Mother |
| No Children | 0 (0.0%) | 0 (0.0%) |
| 1 or 2 Children | 0 (0.0%) | 11 (18.3%) |
| 3 or 4 Children | 0 (0.0%) | 0 (0.0%) |
| 5 or more Children | 0 (0.0%) | 0 (0.0%) |
| Total | 0 (0.0%) | 11 (12.1%) |
Income Below Poverty Among Married-Couple vs Single-Parent Households in Victor
The poverty data for Victor shows that 23 of the married-couple family households (3.8%) and 11 of the single-parent households (7.5%) are living below the poverty level. Within the married-couple family households, those with no children have the highest poverty rate, with 23 households (7.6%) falling below the poverty line. Among the single-parent households, those with 1 or 2 children have the highest poverty rate, with 11 household (18.3%) living below poverty.
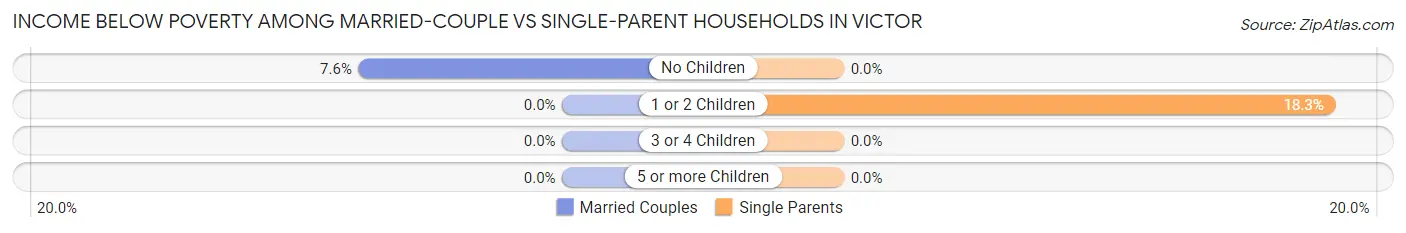
| Children | Married-Couple Families | Single-Parent Households |
| No Children | 23 (7.6%) | 0 (0.0%) |
| 1 or 2 Children | 0 (0.0%) | 11 (18.3%) |
| 3 or 4 Children | 0 (0.0%) | 0 (0.0%) |
| 5 or more Children | 0 (0.0%) | 0 (0.0%) |
| Total | 23 (3.8%) | 11 (7.5%) |
Race in Victor
The most populous races in Victor are White / Caucasian (2,591 | 95.2%), Asian (52 | 1.9%), and Two or more Races (49 | 1.8%).
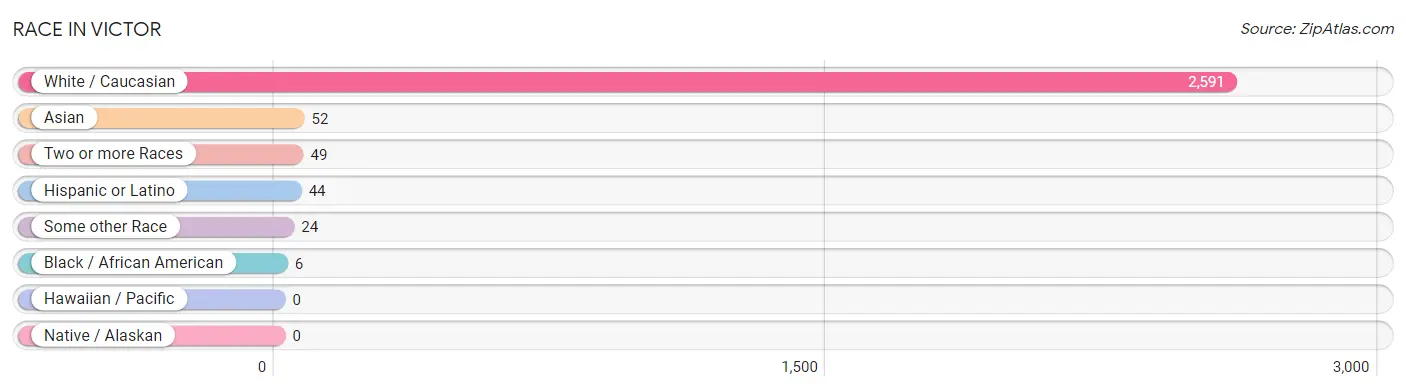
| Race | # Population | % Population |
| Asian | 52 | 1.9% |
| Black / African American | 6 | 0.2% |
| Hawaiian / Pacific | 0 | 0.0% |
| Hispanic or Latino | 44 | 1.6% |
| Native / Alaskan | 0 | 0.0% |
| White / Caucasian | 2,591 | 95.2% |
| Two or more Races | 49 | 1.8% |
| Some other Race | 24 | 0.9% |
| Total | 2,722 | 100.0% |
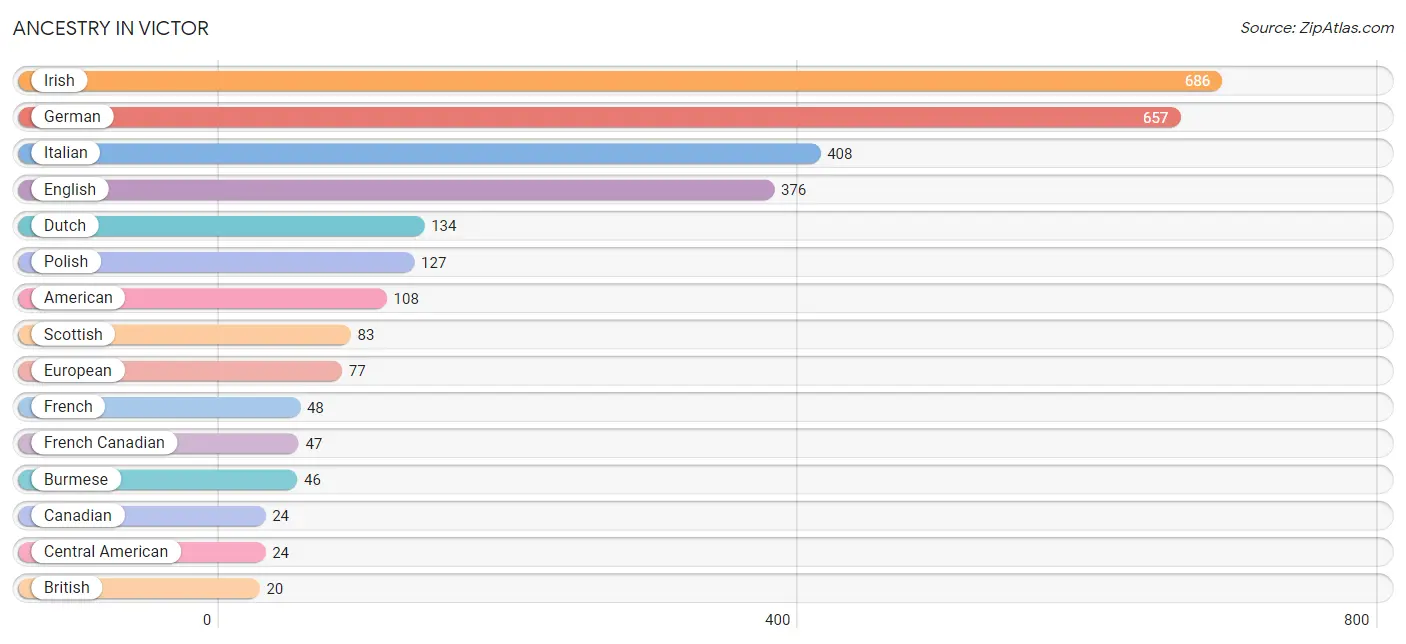
Ancestry in Victor
The most populous ancestries reported in Victor are Irish (686 | 25.2%), German (657 | 24.1%), Italian (408 | 15.0%), English (376 | 13.8%), and Dutch (134 | 4.9%), together accounting for 83.1% of all Victor residents.
| Ancestry | # Population | % Population |
| African | 4 | 0.2% |
| American | 108 | 4.0% |
| Argentinean | 7 | 0.3% |
| Austrian | 4 | 0.2% |
| Belgian | 14 | 0.5% |
| Bhutanese | 10 | 0.4% |
| British | 20 | 0.7% |
| Burmese | 46 | 1.7% |
| Canadian | 24 | 0.9% |
| Central American | 24 | 0.9% |
| Czech | 15 | 0.5% |
| Danish | 16 | 0.6% |
| Dutch | 134 | 4.9% |
| Eastern European | 11 | 0.4% |
| English | 376 | 13.8% |
| Estonian | 4 | 0.2% |
| European | 77 | 2.8% |
| French | 48 | 1.8% |
| French Canadian | 47 | 1.7% |
| German | 657 | 24.1% |
| Indian (Asian) | 10 | 0.4% |
| Iranian | 15 | 0.5% |
| Irish | 686 | 25.2% |
| Iroquois | 3 | 0.1% |
| Israeli | 5 | 0.2% |
| Italian | 408 | 15.0% |
| Northern European | 4 | 0.2% |
| Norwegian | 15 | 0.5% |
| Panamanian | 5 | 0.2% |
| Pennsylvania German | 14 | 0.5% |
| Polish | 127 | 4.7% |
| Puerto Rican | 11 | 0.4% |
| Romanian | 5 | 0.2% |
| Russian | 4 | 0.2% |
| Salvadoran | 19 | 0.7% |
| Scotch-Irish | 5 | 0.2% |
| Scottish | 83 | 3.0% |
| Slovak | 8 | 0.3% |
| South American | 7 | 0.3% |
| Sri Lankan | 7 | 0.3% |
| Subsaharan African | 4 | 0.2% |
| Swedish | 4 | 0.2% |
| Swiss | 7 | 0.3% |
| Thai | 10 | 0.4% |
| Ukrainian | 9 | 0.3% |
| Welsh | 19 | 0.7% | View All 46 Rows |
Immigrants in Victor
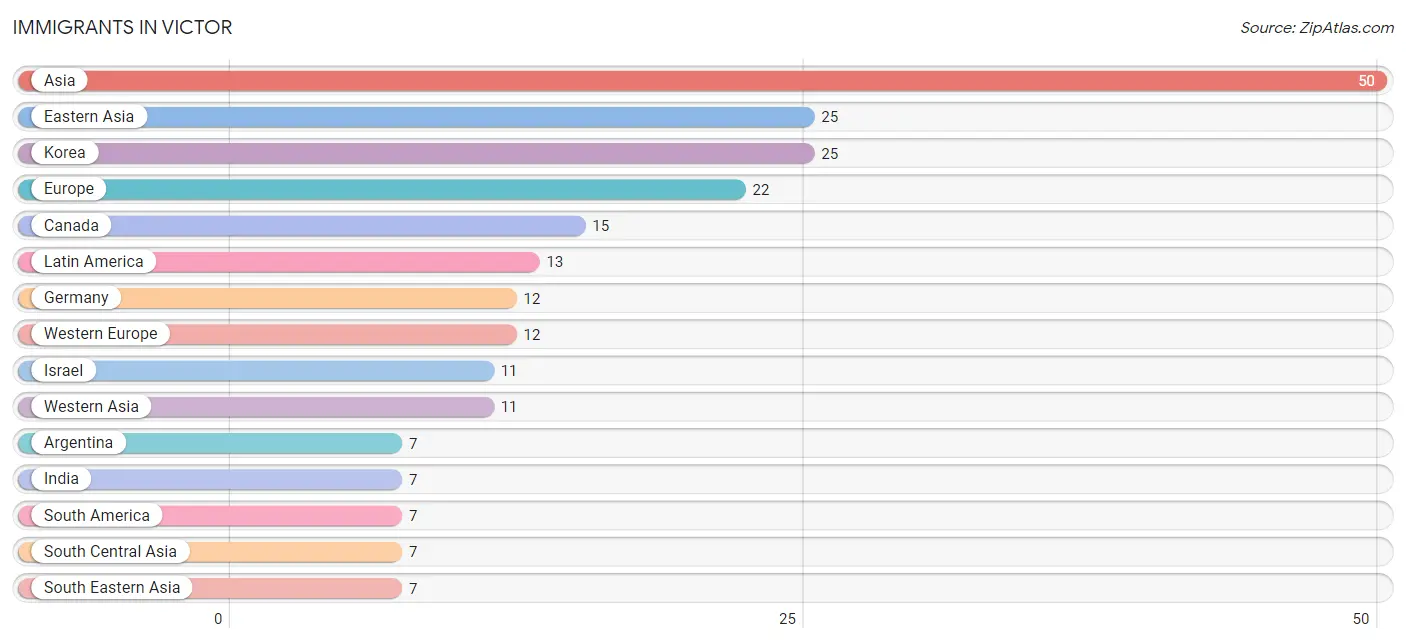
The most numerous immigrant groups reported in Victor came from Asia (50 | 1.8%), Eastern Asia (25 | 0.9%), Korea (25 | 0.9%), Europe (22 | 0.8%), and Canada (15 | 0.5%), together accounting for 5.0% of all Victor residents.
| Immigration Origin | # Population | % Population |
| Argentina | 7 | 0.3% |
| Asia | 50 | 1.8% |
| Canada | 15 | 0.5% |
| Central America | 6 | 0.2% |
| Eastern Asia | 25 | 0.9% |
| Eastern Europe | 5 | 0.2% |
| El Salvador | 6 | 0.2% |
| Europe | 22 | 0.8% |
| Germany | 12 | 0.4% |
| India | 7 | 0.3% |
| Israel | 11 | 0.4% |
| Italy | 5 | 0.2% |
| Korea | 25 | 0.9% |
| Latin America | 13 | 0.5% |
| Romania | 5 | 0.2% |
| South America | 7 | 0.3% |
| South Central Asia | 7 | 0.3% |
| South Eastern Asia | 7 | 0.3% |
| Southern Europe | 5 | 0.2% |
| Vietnam | 7 | 0.3% |
| Western Asia | 11 | 0.4% |
| Western Europe | 12 | 0.4% | View All 22 Rows |
Sex and Age in Victor
Sex and Age in Victor
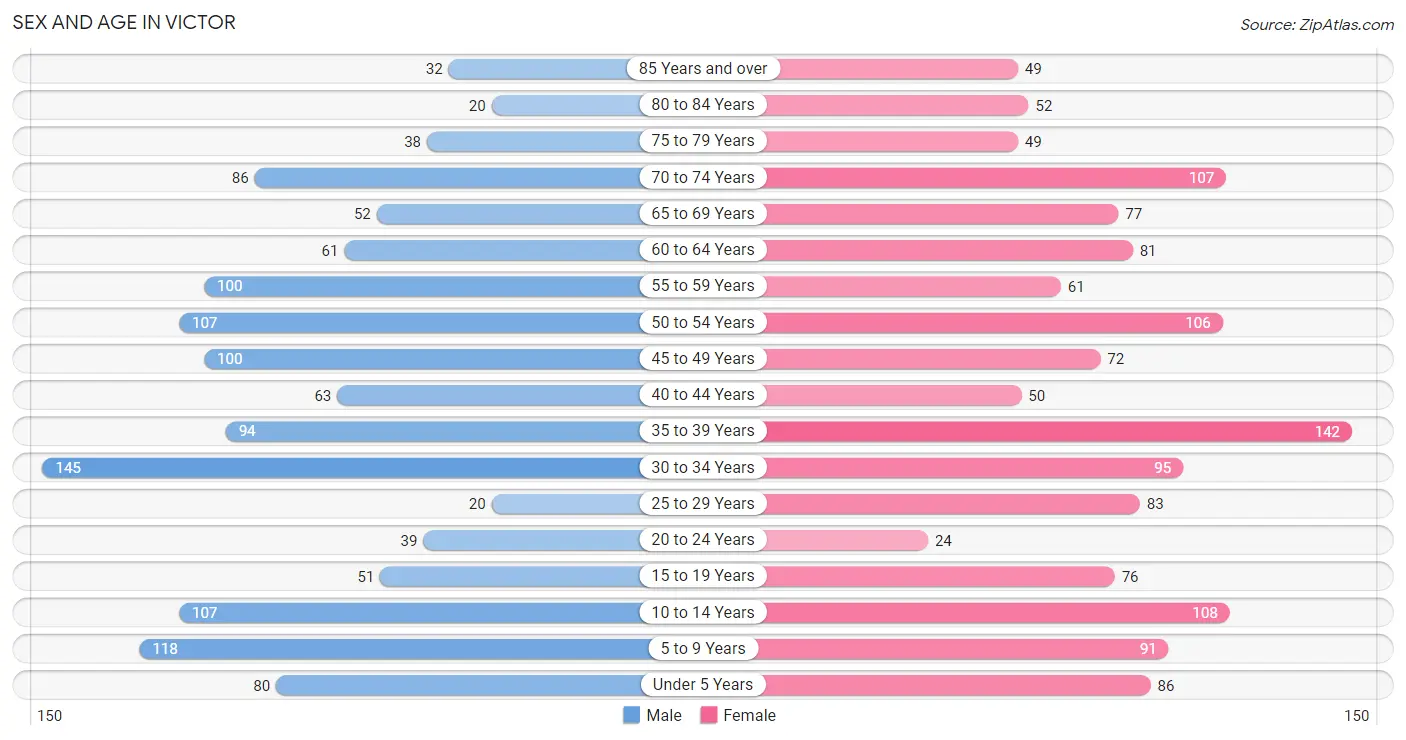
The most populous age groups in Victor are 30 to 34 Years (145 | 11.0%) for men and 35 to 39 Years (142 | 10.1%) for women.
| Age Bracket | Male | Female |
| Under 5 Years | 80 (6.1%) | 86 (6.1%) |
| 5 to 9 Years | 118 (9.0%) | 91 (6.5%) |
| 10 to 14 Years | 107 (8.2%) | 108 (7.7%) |
| 15 to 19 Years | 51 (3.9%) | 76 (5.4%) |
| 20 to 24 Years | 39 (3.0%) | 24 (1.7%) |
| 25 to 29 Years | 20 (1.5%) | 83 (5.9%) |
| 30 to 34 Years | 145 (11.0%) | 95 (6.7%) |
| 35 to 39 Years | 94 (7.2%) | 142 (10.1%) |
| 40 to 44 Years | 63 (4.8%) | 50 (3.5%) |
| 45 to 49 Years | 100 (7.6%) | 72 (5.1%) |
| 50 to 54 Years | 107 (8.2%) | 106 (7.5%) |
| 55 to 59 Years | 100 (7.6%) | 61 (4.3%) |
| 60 to 64 Years | 61 (4.6%) | 81 (5.8%) |
| 65 to 69 Years | 52 (4.0%) | 77 (5.5%) |
| 70 to 74 Years | 86 (6.6%) | 107 (7.6%) |
| 75 to 79 Years | 38 (2.9%) | 49 (3.5%) |
| 80 to 84 Years | 20 (1.5%) | 52 (3.7%) |
| 85 Years and over | 32 (2.4%) | 49 (3.5%) |
| Total | 1,313 (100.0%) | 1,409 (100.0%) |
Families and Households in Victor
Median Family Size in Victor
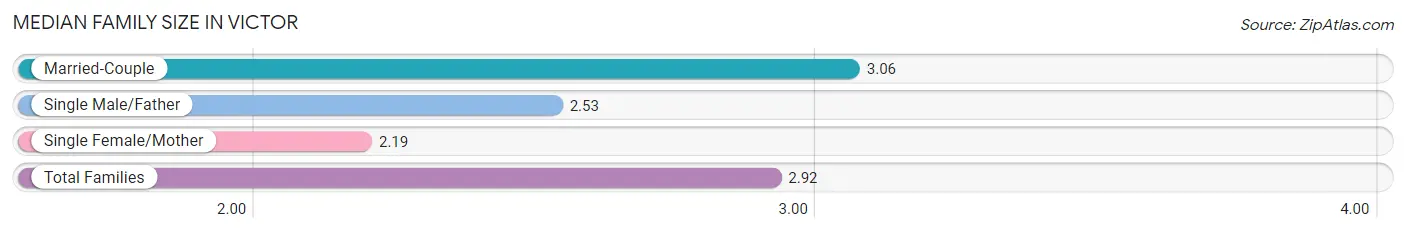
The median family size in Victor is 2.92 persons per family, with married-couple families (611 | 80.7%) accounting for the largest median family size of 3.06 persons per family. On the other hand, single female/mother families (91 | 12.0%) represent the smallest median family size with 2.19 persons per family.
| Family Type | # Families | Family Size |
| Married-Couple | 611 (80.7%) | 3.06 |
| Single Male/Father | 55 (7.3%) | 2.53 |
| Single Female/Mother | 91 (12.0%) | 2.19 |
| Total Families | 757 (100.0%) | 2.92 |
Median Household Size in Victor
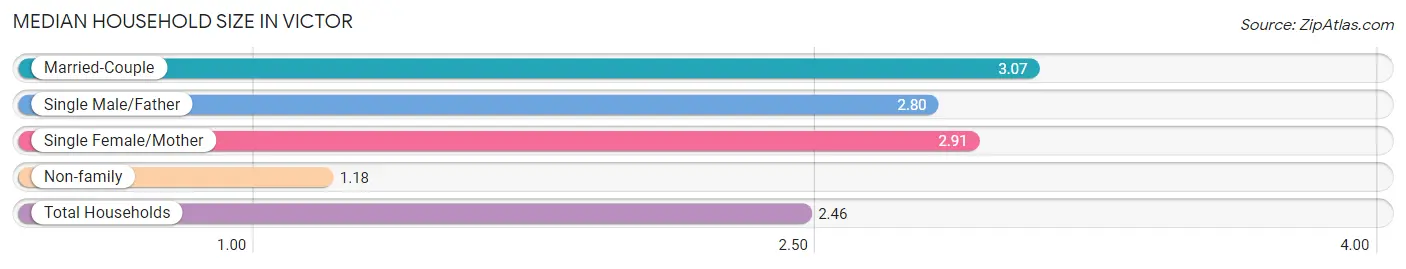
The median household size in Victor is 2.46 persons per household, with married-couple households (611 | 55.6%) accounting for the largest median household size of 3.07 persons per household. non-family households (342 | 31.1%) represent the smallest median household size with 1.18 persons per household.
| Household Type | # Households | Household Size |
| Married-Couple | 611 (55.6%) | 3.07 |
| Single Male/Father | 55 (5.0%) | 2.80 |
| Single Female/Mother | 91 (8.3%) | 2.91 |
| Non-family | 342 (31.1%) | 1.18 |
| Total Households | 1,099 (100.0%) | 2.46 |
Household Size by Marriage Status in Victor
Out of a total of 1,099 households in Victor, 757 (68.9%) are family households, while 342 (31.1%) are nonfamily households. The most numerous type of family households are 2-person households, comprising 343, and the most common type of nonfamily households are 1-person households, comprising 284.
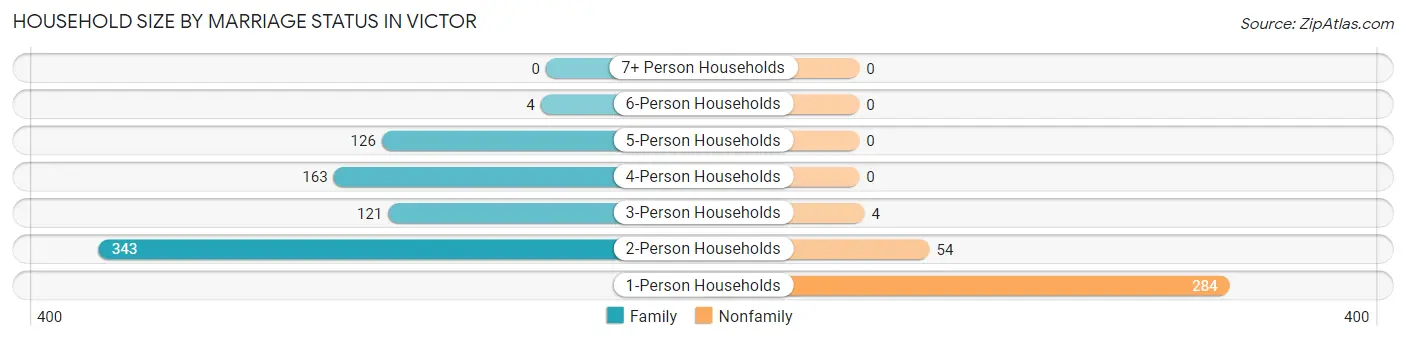
| Household Size | Family Households | Nonfamily Households |
| 1-Person Households | - | 284 (25.8%) |
| 2-Person Households | 343 (31.2%) | 54 (4.9%) |
| 3-Person Households | 121 (11.0%) | 4 (0.4%) |
| 4-Person Households | 163 (14.8%) | 0 (0.0%) |
| 5-Person Households | 126 (11.5%) | 0 (0.0%) |
| 6-Person Households | 4 (0.4%) | 0 (0.0%) |
| 7+ Person Households | 0 (0.0%) | 0 (0.0%) |
| Total | 757 (68.9%) | 342 (31.1%) |
Female Fertility in Victor
Fertility by Age in Victor
Average fertility rate in Victor is 77.0 births per 1,000 women. Women in the age bracket of 20 to 34 years have the highest fertility rate with 183.0 births per 1,000 women. Women in the age bracket of 20 to 34 years acount for 84.1% of all women with births.
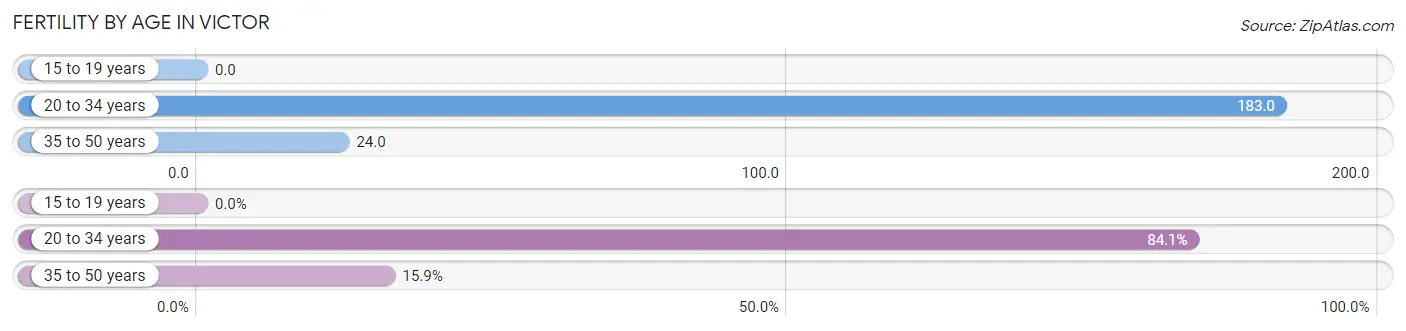
| Age Bracket | Women with Births | Births / 1,000 Women |
| 15 to 19 years | 0 (0.0%) | 0.0 |
| 20 to 34 years | 37 (84.1%) | 183.0 |
| 35 to 50 years | 7 (15.9%) | 24.0 |
| Total | 44 (100.0%) | 77.0 |
Fertility by Age by Marriage Status in Victor
90.9% of women with births (44) in Victor are married. The highest percentage of unmarried women with births falls into 20 to 34 years age bracket with 10.8% of them unmarried at the time of birth, while the lowest percentage of unmarried women with births belong to 35 to 50 years age bracket with 0.0% of them unmarried.
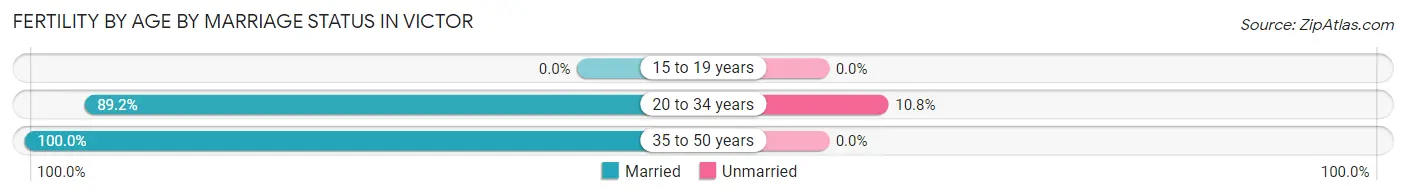
| Age Bracket | Married | Unmarried |
| 15 to 19 years | 0 (0.0%) | 0 (0.0%) |
| 20 to 34 years | 33 (89.2%) | 4 (10.8%) |
| 35 to 50 years | 7 (100.0%) | 0 (0.0%) |
| Total | 40 (90.9%) | 4 (9.1%) |
Fertility by Education in Victor
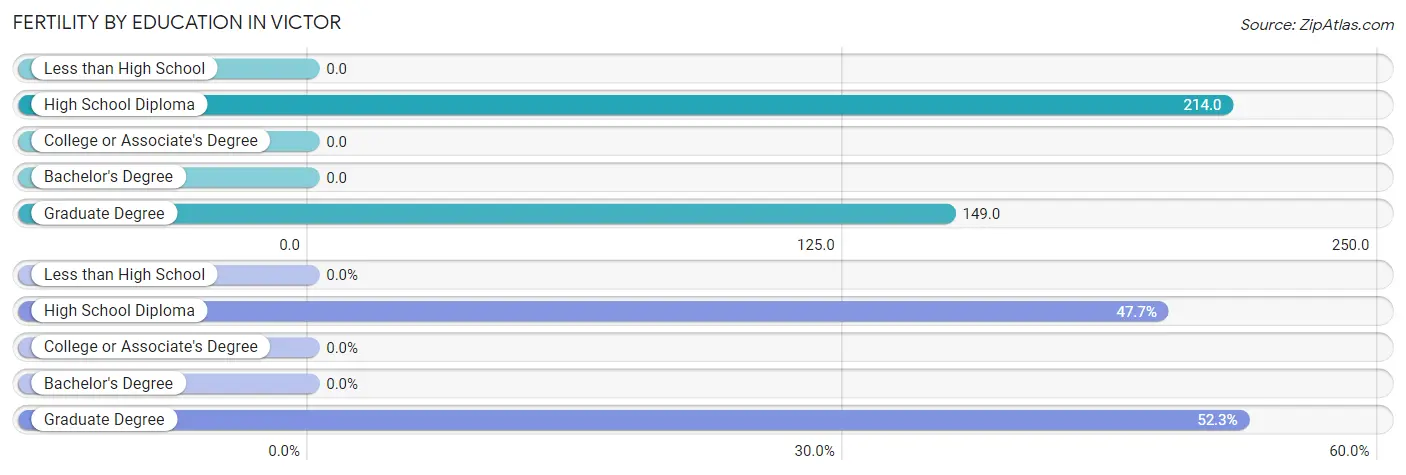
| Educational Attainment | Women with Births | Births / 1,000 Women |
| Less than High School | 0 (0.0%) | 0.0 |
| High School Diploma | 21 (47.7%) | 214.0 |
| College or Associate's Degree | 0 (0.0%) | 0.0 |
| Bachelor's Degree | 0 (0.0%) | 0.0 |
| Graduate Degree | 23 (52.3%) | 149.0 |
| Total | 44 (100.0%) | 77.0 |
Fertility by Education by Marriage Status in Victor
9.1% of women with births in Victor are unmarried. Women with the educational attainment of graduate degree are most likely to be married with 100.0% of them married at childbirth, while women with the educational attainment of high school diploma are least likely to be married with 19.1% of them unmarried at childbirth.
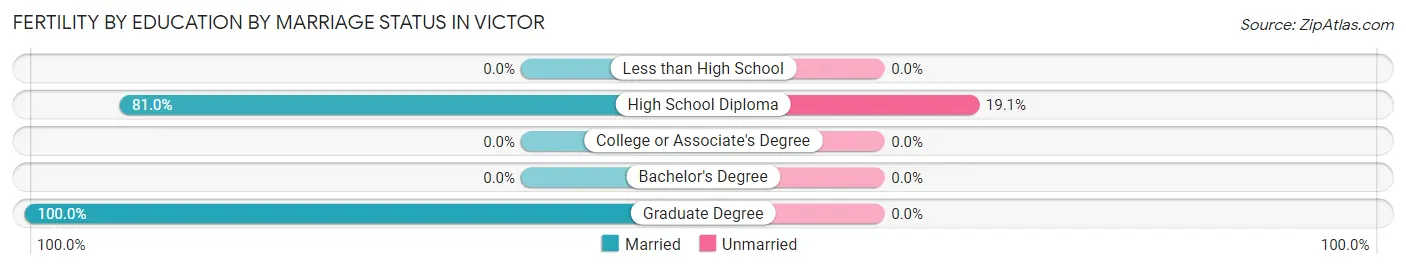
| Educational Attainment | Married | Unmarried |
| Less than High School | 0 (0.0%) | 0 (0.0%) |
| High School Diploma | 17 (80.9%) | 4 (19.1%) |
| College or Associate's Degree | 0 (0.0%) | 0 (0.0%) |
| Bachelor's Degree | 0 (0.0%) | 0 (0.0%) |
| Graduate Degree | 23 (100.0%) | 0 (0.0%) |
| Total | 40 (90.9%) | 4 (9.1%) |
Employment Characteristics in Victor
Employment by Class of Employer in Victor
Among the 1,301 employed individuals in Victor, private company employees (875 | 67.3%), not-for-profit organizations (142 | 10.9%), and local government employees (123 | 9.5%) make up the most common classes of employment.
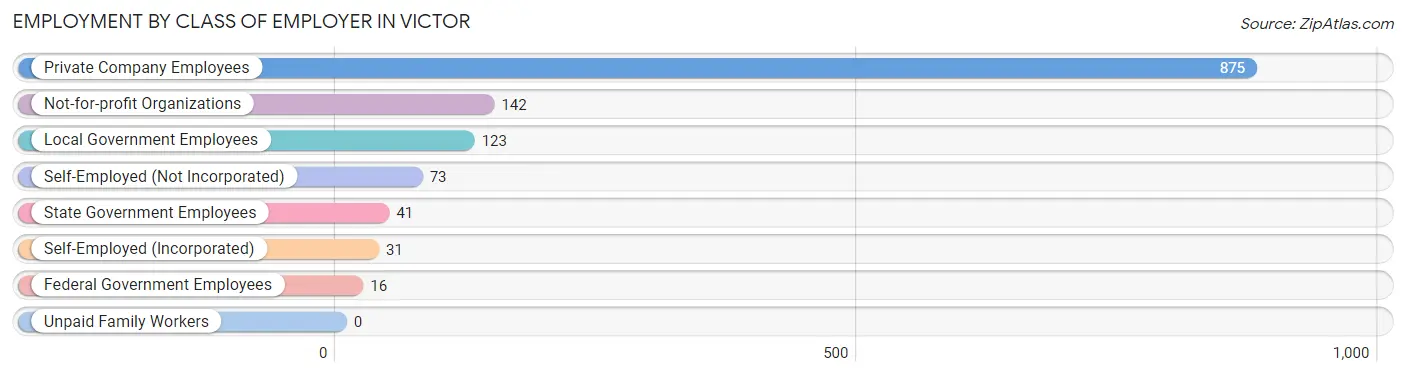
| Employer Class | # Employees | % Employees |
| Private Company Employees | 875 | 67.3% |
| Self-Employed (Incorporated) | 31 | 2.4% |
| Self-Employed (Not Incorporated) | 73 | 5.6% |
| Not-for-profit Organizations | 142 | 10.9% |
| Local Government Employees | 123 | 9.5% |
| State Government Employees | 41 | 3.2% |
| Federal Government Employees | 16 | 1.2% |
| Unpaid Family Workers | 0 | 0.0% |
| Total | 1,301 | 100.0% |
Employment Status by Age in Victor
According to the labor force statistics for Victor, out of the total population over 16 years of age (2,079), 63.8% or 1,326 individuals are in the labor force, with 1.4% or 19 of them unemployed. The age group with the highest labor force participation rate is 25 to 29 years, with 90.3% or 93 individuals in the labor force. Within the labor force, the 45 to 54 years age range has the highest percentage of unemployed individuals, with 3.8% or 13 of them being unemployed.
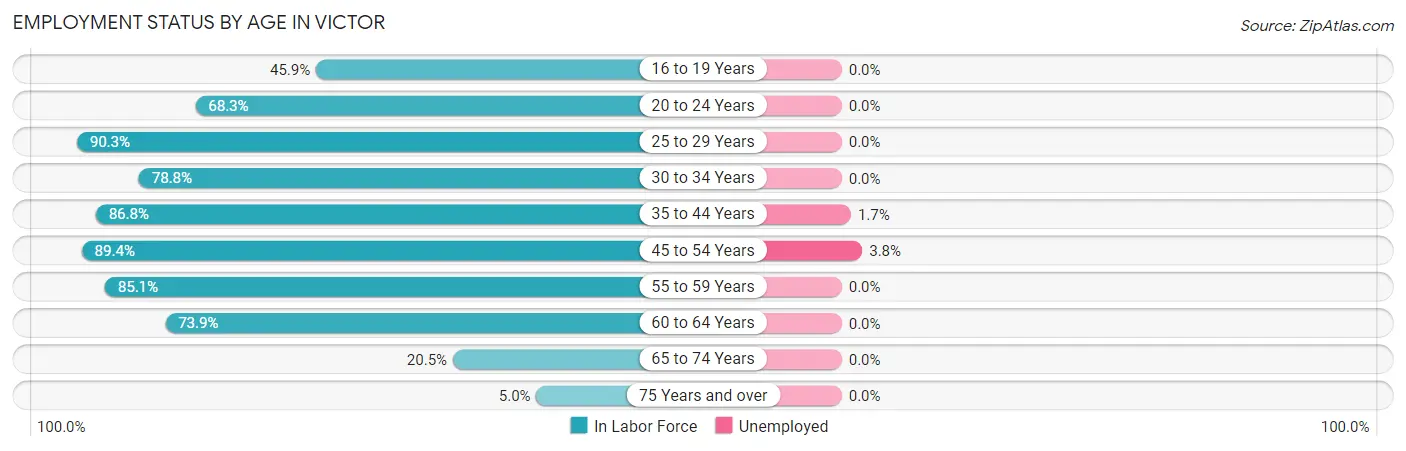
| Age Bracket | In Labor Force | Unemployed |
| 16 to 19 Years | 34 (45.9%) | 0 (0.0%) |
| 20 to 24 Years | 43 (68.3%) | 0 (0.0%) |
| 25 to 29 Years | 93 (90.3%) | 0 (0.0%) |
| 30 to 34 Years | 189 (78.8%) | 0 (0.0%) |
| 35 to 44 Years | 303 (86.8%) | 5 (1.7%) |
| 45 to 54 Years | 344 (89.4%) | 13 (3.8%) |
| 55 to 59 Years | 137 (85.1%) | 0 (0.0%) |
| 60 to 64 Years | 105 (73.9%) | 0 (0.0%) |
| 65 to 74 Years | 66 (20.5%) | 0 (0.0%) |
| 75 Years and over | 12 (5.0%) | 0 (0.0%) |
| Total | 1,326 (63.8%) | 19 (1.4%) |
Employment Status by Educational Attainment in Victor
According to labor force statistics for Victor, 84.9% of individuals (1,172) out of the total population between 25 and 64 years of age (1,380) are in the labor force, with 1.5% or 18 of them being unemployed. The group with the highest labor force participation rate are those with the educational attainment of bachelor's degree or higher, with 94.2% or 654 individuals in the labor force. Within the labor force, individuals with college / associate degree education have the highest percentage of unemployment, with 4.0% or 13 of them being unemployed.
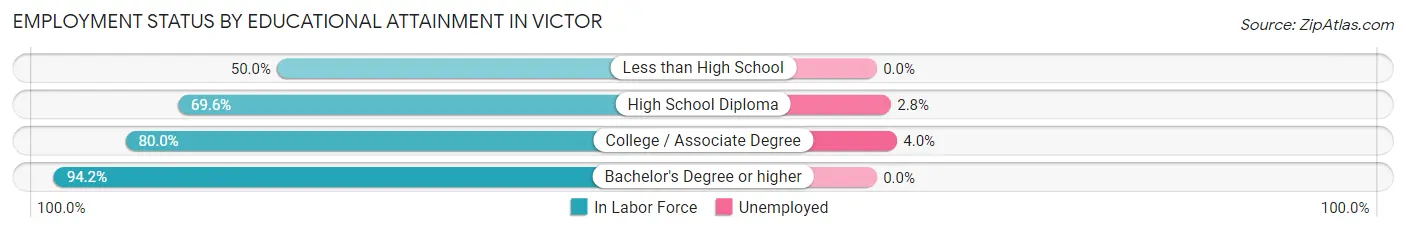
| Educational Attainment | In Labor Force | Unemployed |
| Less than High School | 9 (50.0%) | 0 (0.0%) |
| High School Diploma | 179 (69.6%) | 7 (2.8%) |
| College / Associate Degree | 329 (80.0%) | 16 (4.0%) |
| Bachelor's Degree or higher | 654 (94.2%) | 0 (0.0%) |
| Total | 1,172 (84.9%) | 21 (1.5%) |
Employment Occupations by Sex in Victor
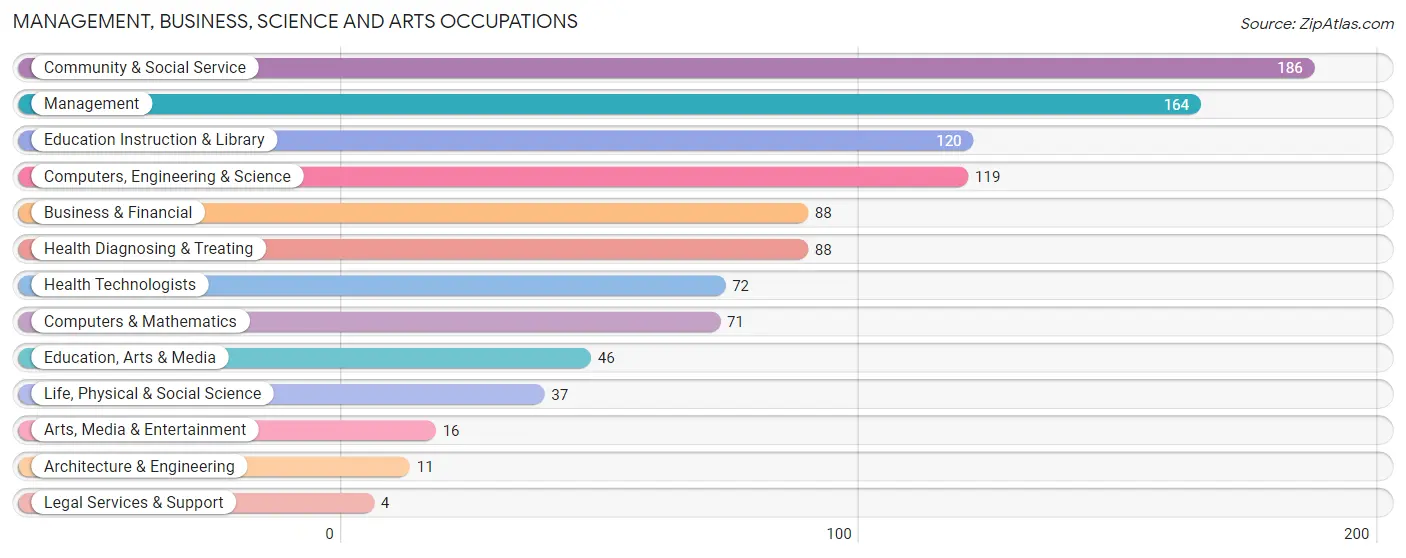
Management, Business, Science and Arts Occupations
The most common Management, Business, Science and Arts occupations in Victor are Community & Social Service (186 | 14.2%), Management (164 | 12.5%), Education Instruction & Library (120 | 9.2%), Computers, Engineering & Science (119 | 9.1%), and Business & Financial (88 | 6.7%).
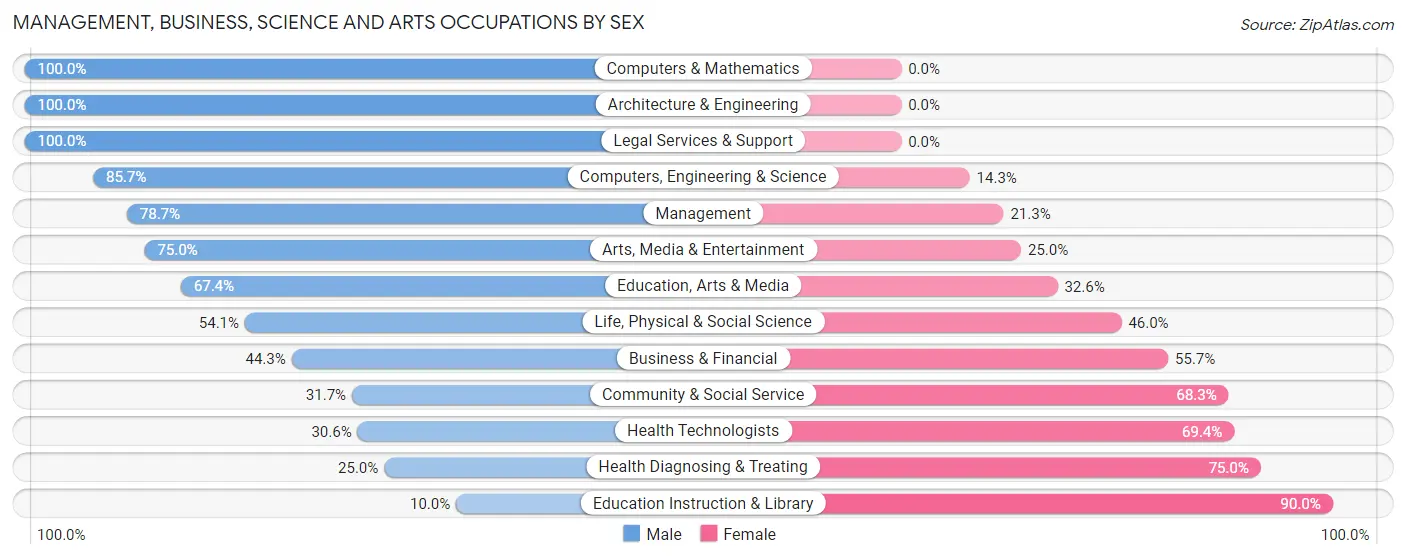
Management, Business, Science and Arts Occupations by Sex
Within the Management, Business, Science and Arts occupations in Victor, the most male-oriented occupations are Computers & Mathematics (100.0%), Architecture & Engineering (100.0%), and Legal Services & Support (100.0%), while the most female-oriented occupations are Education Instruction & Library (90.0%), Health Diagnosing & Treating (75.0%), and Health Technologists (69.4%).
| Occupation | Male | Female |
| Management | 129 (78.7%) | 35 (21.3%) |
| Business & Financial | 39 (44.3%) | 49 (55.7%) |
| Computers, Engineering & Science | 102 (85.7%) | 17 (14.3%) |
| Computers & Mathematics | 71 (100.0%) | 0 (0.0%) |
| Architecture & Engineering | 11 (100.0%) | 0 (0.0%) |
| Life, Physical & Social Science | 20 (54.0%) | 17 (46.0%) |
| Community & Social Service | 59 (31.7%) | 127 (68.3%) |
| Education, Arts & Media | 31 (67.4%) | 15 (32.6%) |
| Legal Services & Support | 4 (100.0%) | 0 (0.0%) |
| Education Instruction & Library | 12 (10.0%) | 108 (90.0%) |
| Arts, Media & Entertainment | 12 (75.0%) | 4 (25.0%) |
| Health Diagnosing & Treating | 22 (25.0%) | 66 (75.0%) |
| Health Technologists | 22 (30.6%) | 50 (69.4%) |
| Total (Category) | 351 (54.4%) | 294 (45.6%) |
| Total (Overall) | 693 (53.0%) | 615 (47.0%) |
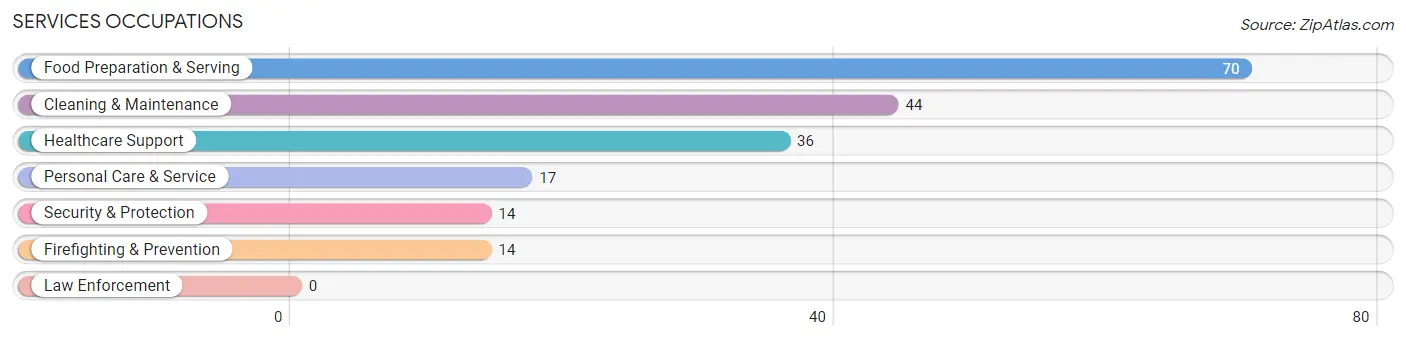
Services Occupations
The most common Services occupations in Victor are Food Preparation & Serving (70 | 5.3%), Cleaning & Maintenance (44 | 3.4%), Healthcare Support (36 | 2.8%), Personal Care & Service (17 | 1.3%), and Security & Protection (14 | 1.1%).
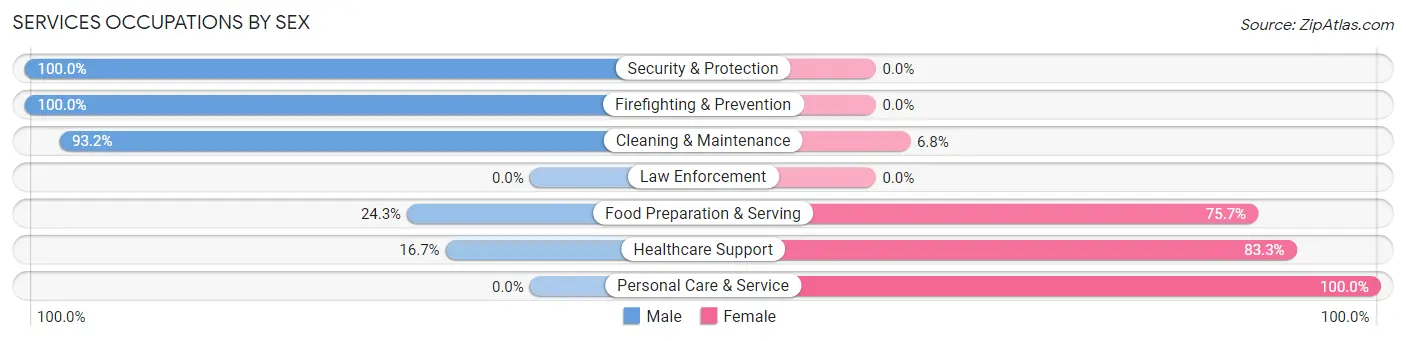
Services Occupations by Sex
Within the Services occupations in Victor, the most male-oriented occupations are Security & Protection (100.0%), Firefighting & Prevention (100.0%), and Cleaning & Maintenance (93.2%), while the most female-oriented occupations are Personal Care & Service (100.0%), Healthcare Support (83.3%), and Food Preparation & Serving (75.7%).
| Occupation | Male | Female |
| Healthcare Support | 6 (16.7%) | 30 (83.3%) |
| Security & Protection | 14 (100.0%) | 0 (0.0%) |
| Firefighting & Prevention | 14 (100.0%) | 0 (0.0%) |
| Law Enforcement | 0 (0.0%) | 0 (0.0%) |
| Food Preparation & Serving | 17 (24.3%) | 53 (75.7%) |
| Cleaning & Maintenance | 41 (93.2%) | 3 (6.8%) |
| Personal Care & Service | 0 (0.0%) | 17 (100.0%) |
| Total (Category) | 78 (43.1%) | 103 (56.9%) |
| Total (Overall) | 693 (53.0%) | 615 (47.0%) |
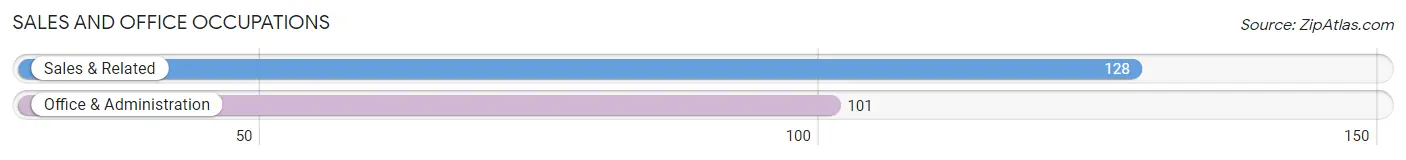
Sales and Office Occupations
The most common Sales and Office occupations in Victor are Sales & Related (128 | 9.8%), and Office & Administration (101 | 7.7%).
Sales and Office Occupations by Sex
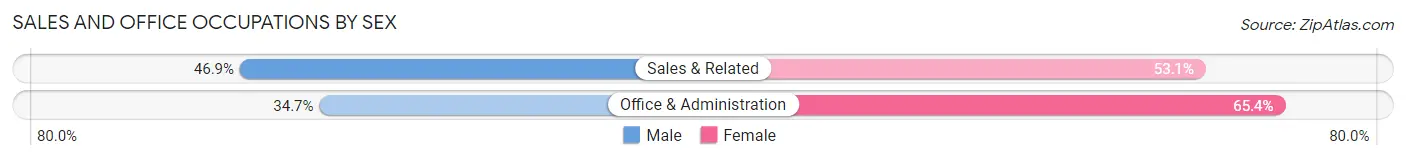
| Occupation | Male | Female |
| Sales & Related | 60 (46.9%) | 68 (53.1%) |
| Office & Administration | 35 (34.6%) | 66 (65.3%) |
| Total (Category) | 95 (41.5%) | 134 (58.5%) |
| Total (Overall) | 693 (53.0%) | 615 (47.0%) |
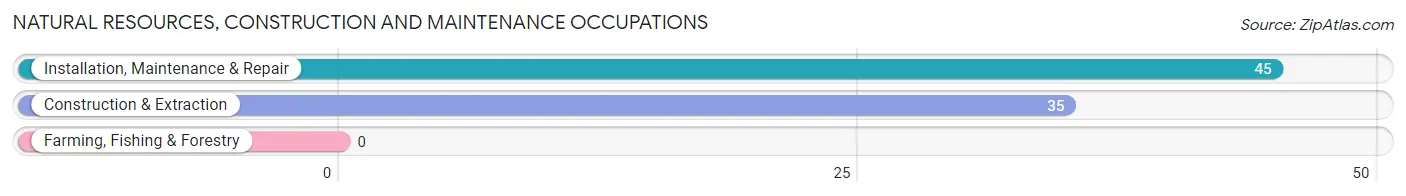
Natural Resources, Construction and Maintenance Occupations
The most common Natural Resources, Construction and Maintenance occupations in Victor are Installation, Maintenance & Repair (45 | 3.4%), and Construction & Extraction (35 | 2.7%).
Natural Resources, Construction and Maintenance Occupations by Sex
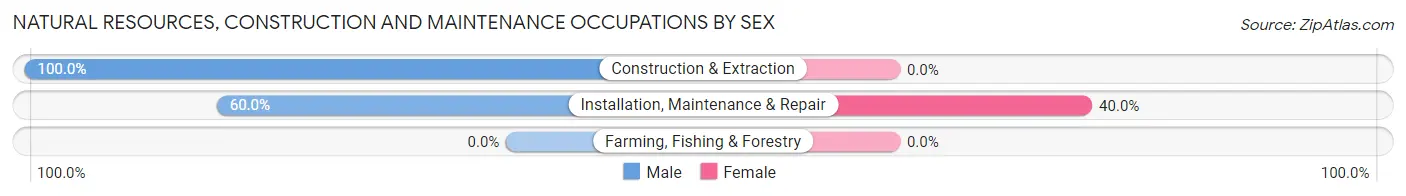
| Occupation | Male | Female |
| Farming, Fishing & Forestry | 0 (0.0%) | 0 (0.0%) |
| Construction & Extraction | 35 (100.0%) | 0 (0.0%) |
| Installation, Maintenance & Repair | 27 (60.0%) | 18 (40.0%) |
| Total (Category) | 62 (77.5%) | 18 (22.5%) |
| Total (Overall) | 693 (53.0%) | 615 (47.0%) |
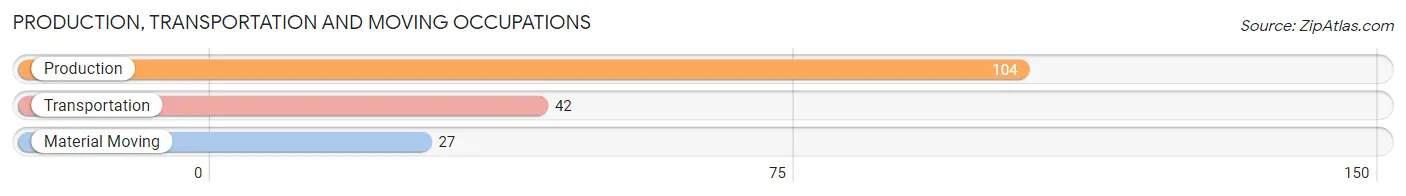
Production, Transportation and Moving Occupations
The most common Production, Transportation and Moving occupations in Victor are Production (104 | 8.0%), Transportation (42 | 3.2%), and Material Moving (27 | 2.1%).
Production, Transportation and Moving Occupations by Sex
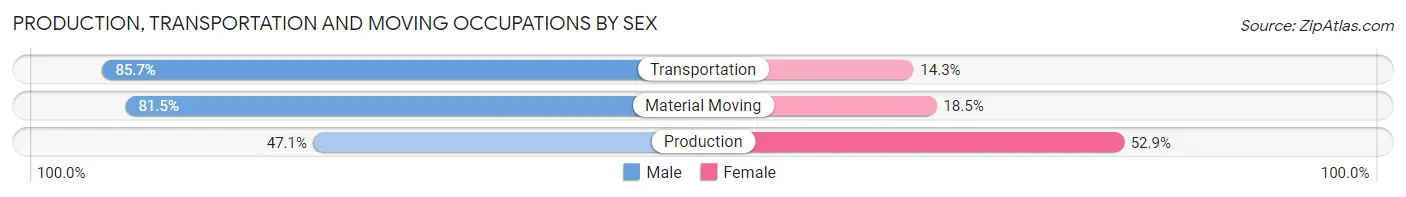
| Occupation | Male | Female |
| Production | 49 (47.1%) | 55 (52.9%) |
| Transportation | 36 (85.7%) | 6 (14.3%) |
| Material Moving | 22 (81.5%) | 5 (18.5%) |
| Total (Category) | 107 (61.9%) | 66 (38.2%) |
| Total (Overall) | 693 (53.0%) | 615 (47.0%) |
Employment Industries by Sex in Victor
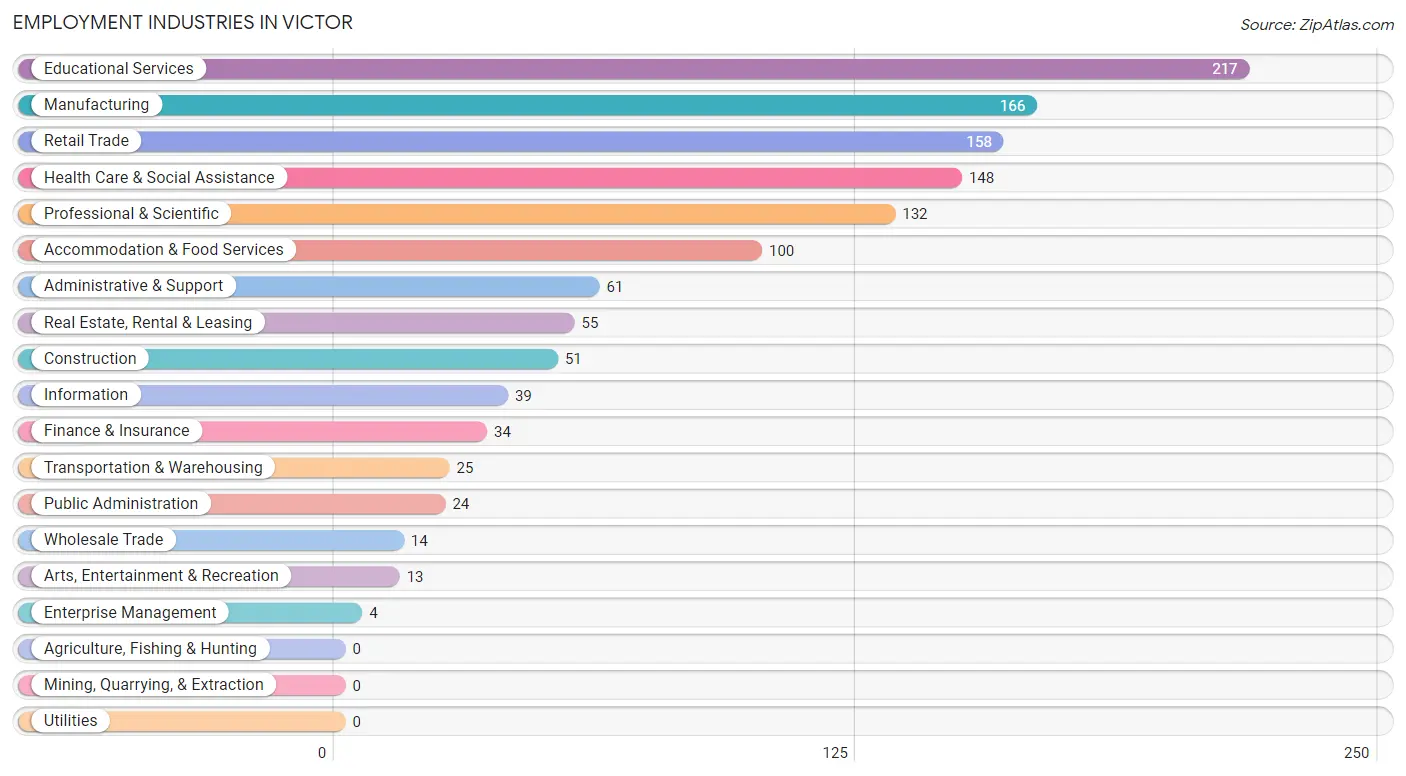
Employment Industries in Victor
The major employment industries in Victor include Educational Services (217 | 16.6%), Manufacturing (166 | 12.7%), Retail Trade (158 | 12.1%), Health Care & Social Assistance (148 | 11.3%), and Professional & Scientific (132 | 10.1%).
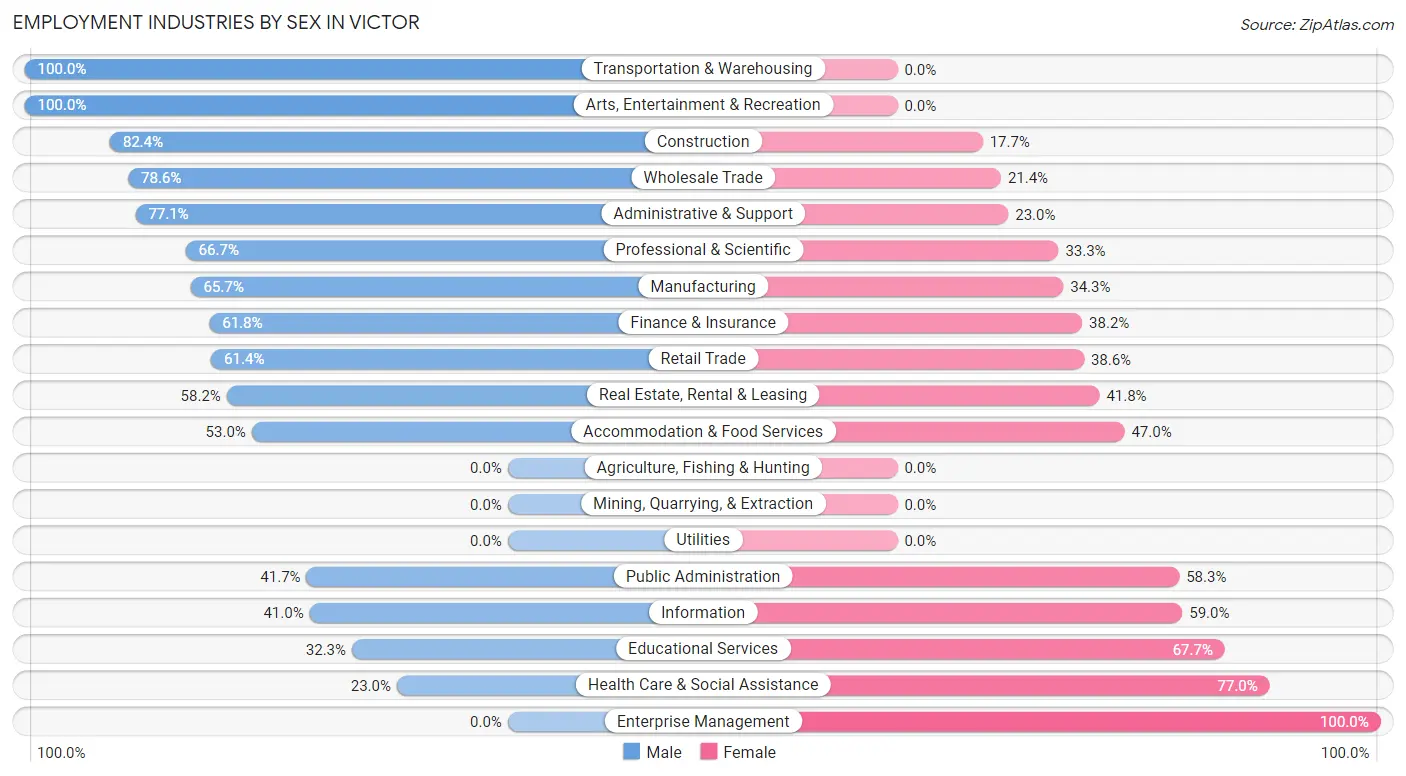
Employment Industries by Sex in Victor
The Victor industries that see more men than women are Transportation & Warehousing (100.0%), Arts, Entertainment & Recreation (100.0%), and Construction (82.4%), whereas the industries that tend to have a higher number of women are Enterprise Management (100.0%), Health Care & Social Assistance (77.0%), and Educational Services (67.7%).
| Industry | Male | Female |
| Agriculture, Fishing & Hunting | 0 (0.0%) | 0 (0.0%) |
| Mining, Quarrying, & Extraction | 0 (0.0%) | 0 (0.0%) |
| Construction | 42 (82.4%) | 9 (17.6%) |
| Manufacturing | 109 (65.7%) | 57 (34.3%) |
| Wholesale Trade | 11 (78.6%) | 3 (21.4%) |
| Retail Trade | 97 (61.4%) | 61 (38.6%) |
| Transportation & Warehousing | 25 (100.0%) | 0 (0.0%) |
| Utilities | 0 (0.0%) | 0 (0.0%) |
| Information | 16 (41.0%) | 23 (59.0%) |
| Finance & Insurance | 21 (61.8%) | 13 (38.2%) |
| Real Estate, Rental & Leasing | 32 (58.2%) | 23 (41.8%) |
| Professional & Scientific | 88 (66.7%) | 44 (33.3%) |
| Enterprise Management | 0 (0.0%) | 4 (100.0%) |
| Administrative & Support | 47 (77.0%) | 14 (23.0%) |
| Educational Services | 70 (32.3%) | 147 (67.7%) |
| Health Care & Social Assistance | 34 (23.0%) | 114 (77.0%) |
| Arts, Entertainment & Recreation | 13 (100.0%) | 0 (0.0%) |
| Accommodation & Food Services | 53 (53.0%) | 47 (47.0%) |
| Public Administration | 10 (41.7%) | 14 (58.3%) |
| Total | 693 (53.0%) | 615 (47.0%) |
Education in Victor
School Enrollment in Victor
The most common levels of schooling among the 610 students in Victor are elementary school (171 | 28.0%), high school (159 | 26.1%), and middle school (133 | 21.8%).
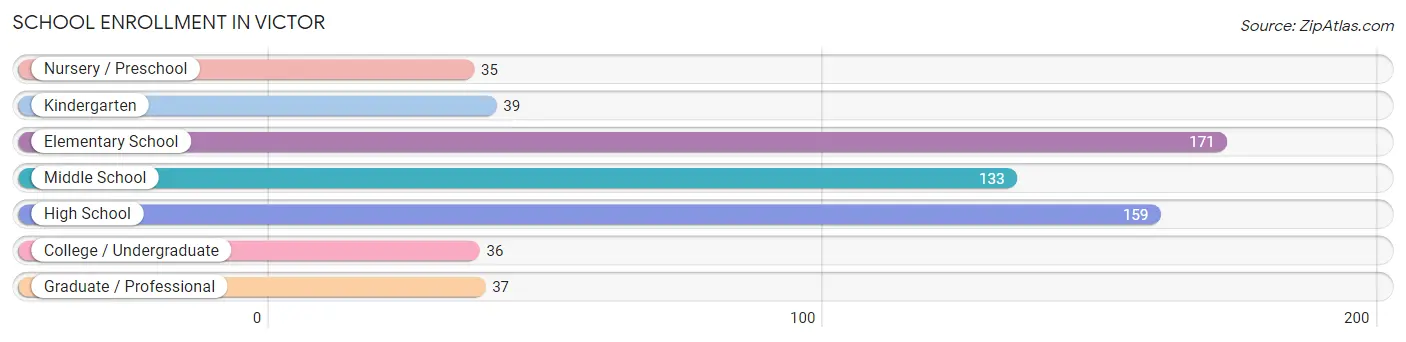
| School Level | # Students | % Students |
| Nursery / Preschool | 35 | 5.7% |
| Kindergarten | 39 | 6.4% |
| Elementary School | 171 | 28.0% |
| Middle School | 133 | 21.8% |
| High School | 159 | 26.1% |
| College / Undergraduate | 36 | 5.9% |
| Graduate / Professional | 37 | 6.1% |
| Total | 610 | 100.0% |
School Enrollment by Age by Funding Source in Victor
Out of a total of 610 students who are enrolled in schools in Victor, 106 (17.4%) attend a private institution, while the remaining 504 (82.6%) are enrolled in public schools. The age group of 3 to 4 year olds has the highest likelihood of being enrolled in private schools, with 26 (100.0% in the age bracket) enrolled. Conversely, the age group of 5 to 9 year old has the lowest likelihood of being enrolled in a private school, with 188 (96.9% in the age bracket) attending a public institution.
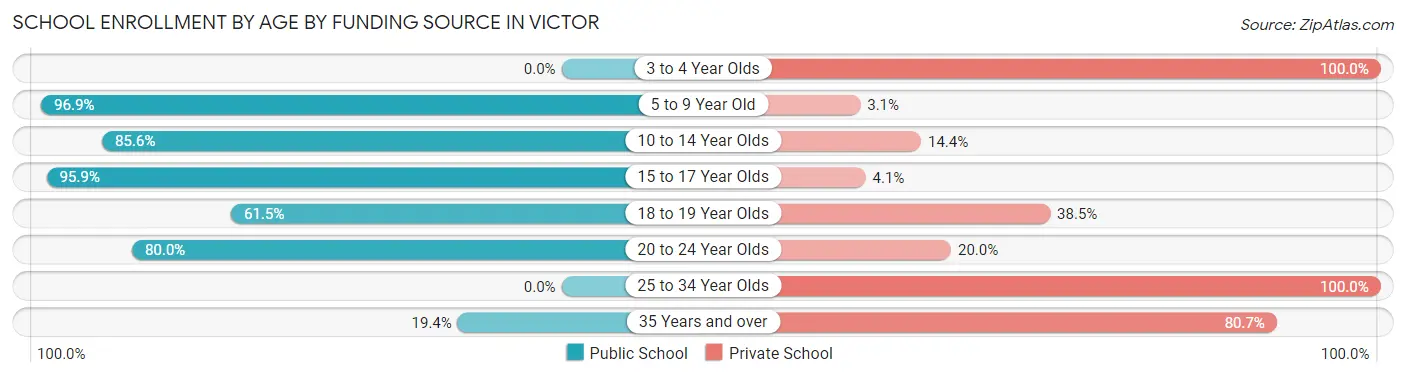
| Age Bracket | Public School | Private School |
| 3 to 4 Year Olds | 0 (0.0%) | 26 (100.0%) |
| 5 to 9 Year Old | 188 (96.9%) | 6 (3.1%) |
| 10 to 14 Year Olds | 184 (85.6%) | 31 (14.4%) |
| 15 to 17 Year Olds | 94 (95.9%) | 4 (4.1%) |
| 18 to 19 Year Olds | 8 (61.5%) | 5 (38.5%) |
| 20 to 24 Year Olds | 24 (80.0%) | 6 (20.0%) |
| 25 to 34 Year Olds | 0 (0.0%) | 3 (100.0%) |
| 35 Years and over | 6 (19.4%) | 25 (80.6%) |
| Total | 504 (82.6%) | 106 (17.4%) |
Educational Attainment by Field of Study in Victor
Business (205 | 21.1%), education (138 | 14.2%), science & technology (104 | 10.7%), computers & mathematics (93 | 9.6%), and engineering (88 | 9.0%) are the most common fields of study among 973 individuals in Victor who have obtained a bachelor's degree or higher.
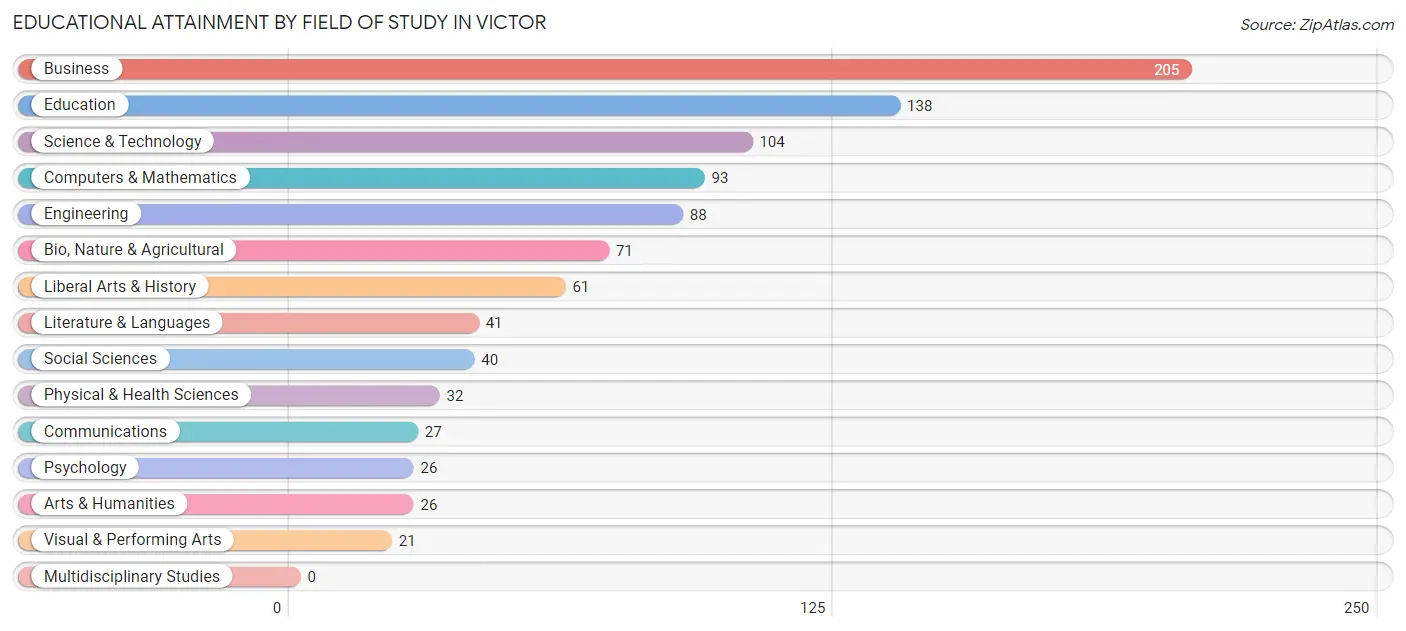
| Field of Study | # Graduates | % Graduates |
| Computers & Mathematics | 93 | 9.6% |
| Bio, Nature & Agricultural | 71 | 7.3% |
| Physical & Health Sciences | 32 | 3.3% |
| Psychology | 26 | 2.7% |
| Social Sciences | 40 | 4.1% |
| Engineering | 88 | 9.0% |
| Multidisciplinary Studies | 0 | 0.0% |
| Science & Technology | 104 | 10.7% |
| Business | 205 | 21.1% |
| Education | 138 | 14.2% |
| Literature & Languages | 41 | 4.2% |
| Liberal Arts & History | 61 | 6.3% |
| Visual & Performing Arts | 21 | 2.2% |
| Communications | 27 | 2.8% |
| Arts & Humanities | 26 | 2.7% |
| Total | 973 | 100.0% |
Transportation & Commute in Victor
Vehicle Availability by Sex in Victor
The most prevalent vehicle ownership categories in Victor are males with 2 vehicles (380, accounting for 54.8%) and females with 2 vehicles (299, making up 62.5%).
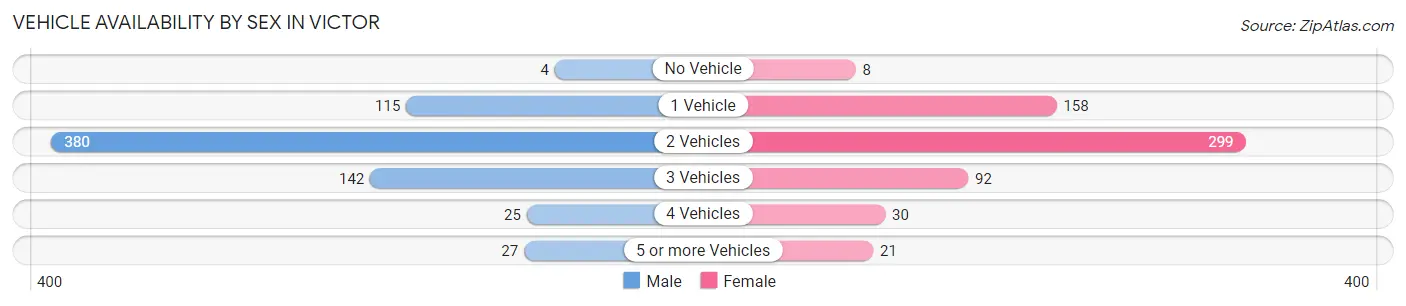
| Vehicles Available | Male | Female |
| No Vehicle | 4 (0.6%) | 8 (1.3%) |
| 1 Vehicle | 115 (16.6%) | 158 (26.0%) |
| 2 Vehicles | 380 (54.8%) | 299 (49.2%) |
| 3 Vehicles | 142 (20.5%) | 92 (15.1%) |
| 4 Vehicles | 25 (3.6%) | 30 (4.9%) |
| 5 or more Vehicles | 27 (3.9%) | 21 (3.5%) |
| Total | 693 (100.0%) | 608 (100.0%) |
Commute Time in Victor
The most frequently occuring commute durations in Victor are 5 to 9 minutes (189 commuters, 16.0%), 10 to 14 minutes (188 commuters, 15.9%), and 30 to 34 minutes (177 commuters, 15.0%).
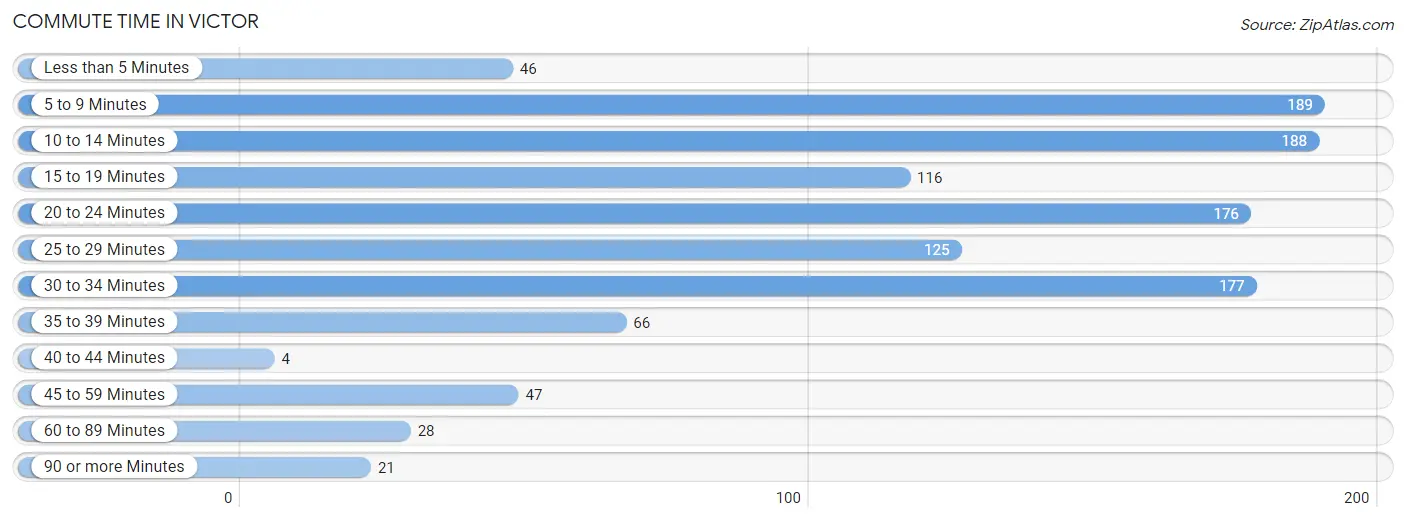
| Commute Time | # Commuters | % Commuters |
| Less than 5 Minutes | 46 | 3.9% |
| 5 to 9 Minutes | 189 | 16.0% |
| 10 to 14 Minutes | 188 | 15.9% |
| 15 to 19 Minutes | 116 | 9.8% |
| 20 to 24 Minutes | 176 | 14.9% |
| 25 to 29 Minutes | 125 | 10.6% |
| 30 to 34 Minutes | 177 | 15.0% |
| 35 to 39 Minutes | 66 | 5.6% |
| 40 to 44 Minutes | 4 | 0.3% |
| 45 to 59 Minutes | 47 | 4.0% |
| 60 to 89 Minutes | 28 | 2.4% |
| 90 or more Minutes | 21 | 1.8% |
Commute Time by Sex in Victor
The most common commute times in Victor are 20 to 24 minutes (98 commuters, 15.8%) for males and 10 to 14 minutes (138 commuters, 24.6%) for females.
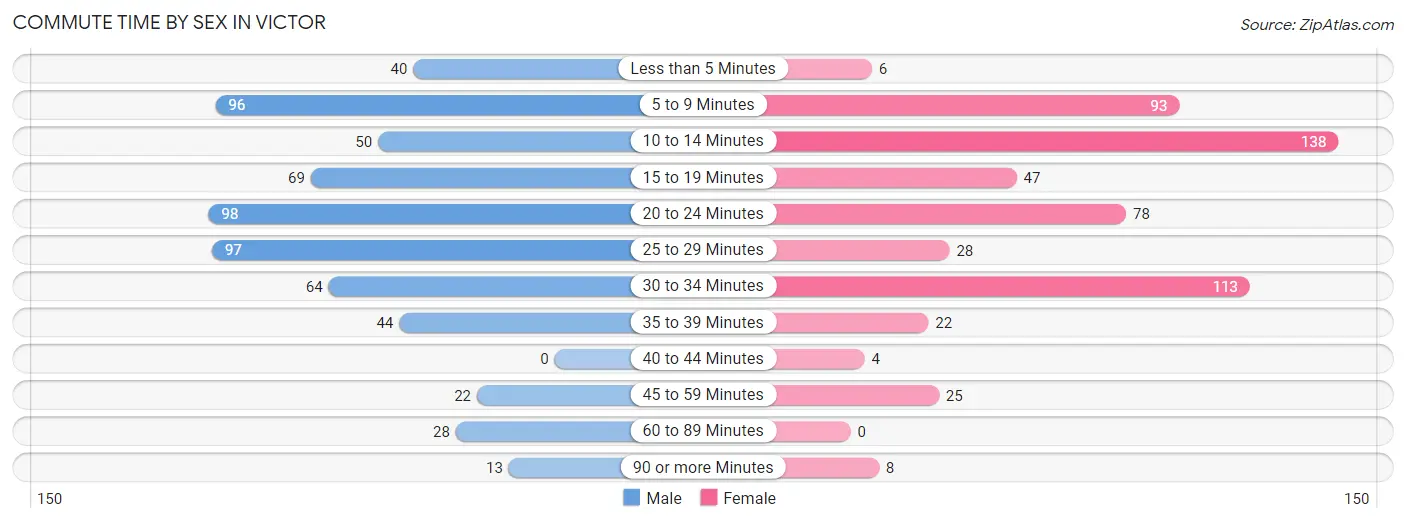
| Commute Time | Male | Female |
| Less than 5 Minutes | 40 (6.4%) | 6 (1.1%) |
| 5 to 9 Minutes | 96 (15.5%) | 93 (16.6%) |
| 10 to 14 Minutes | 50 (8.1%) | 138 (24.6%) |
| 15 to 19 Minutes | 69 (11.1%) | 47 (8.4%) |
| 20 to 24 Minutes | 98 (15.8%) | 78 (13.9%) |
| 25 to 29 Minutes | 97 (15.6%) | 28 (5.0%) |
| 30 to 34 Minutes | 64 (10.3%) | 113 (20.1%) |
| 35 to 39 Minutes | 44 (7.1%) | 22 (3.9%) |
| 40 to 44 Minutes | 0 (0.0%) | 4 (0.7%) |
| 45 to 59 Minutes | 22 (3.5%) | 25 (4.4%) |
| 60 to 89 Minutes | 28 (4.5%) | 0 (0.0%) |
| 90 or more Minutes | 13 (2.1%) | 8 (1.4%) |
Time of Departure to Work by Sex in Victor
The most frequent times of departure to work in Victor are 8:00 AM to 8:29 AM (115, 18.5%) for males and 7:00 AM to 7:29 AM (139, 24.7%) for females.
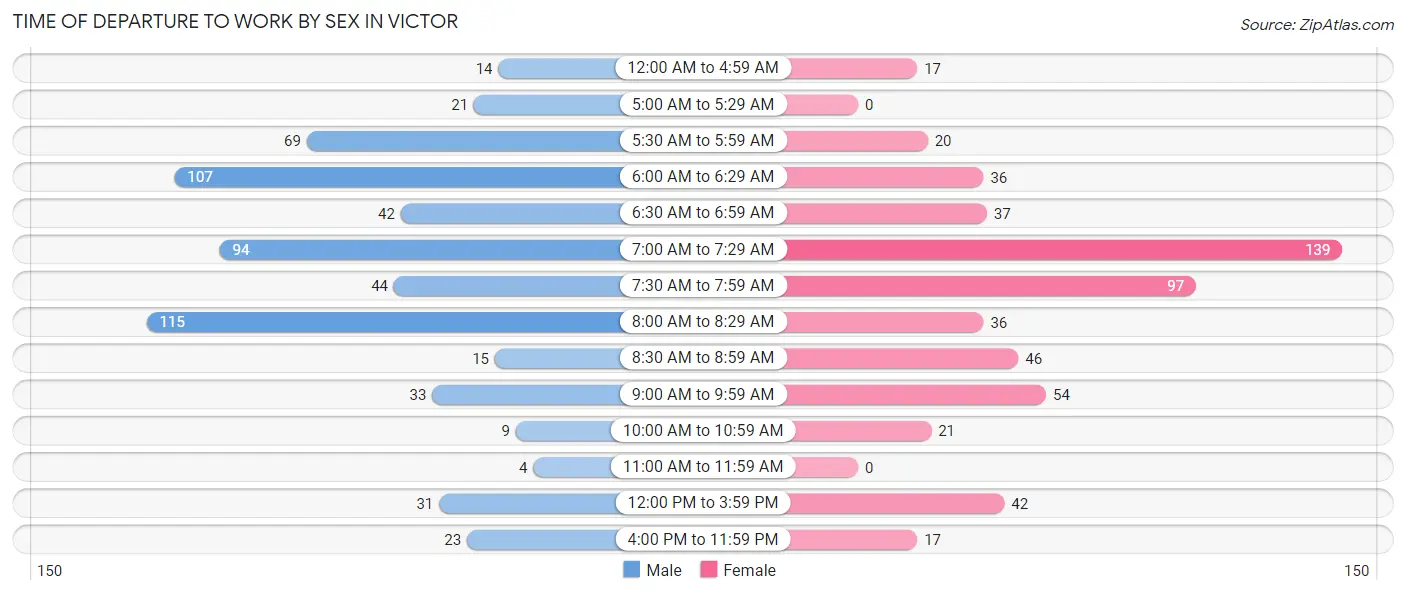
| Time of Departure | Male | Female |
| 12:00 AM to 4:59 AM | 14 (2.2%) | 17 (3.0%) |
| 5:00 AM to 5:29 AM | 21 (3.4%) | 0 (0.0%) |
| 5:30 AM to 5:59 AM | 69 (11.1%) | 20 (3.6%) |
| 6:00 AM to 6:29 AM | 107 (17.2%) | 36 (6.4%) |
| 6:30 AM to 6:59 AM | 42 (6.8%) | 37 (6.6%) |
| 7:00 AM to 7:29 AM | 94 (15.1%) | 139 (24.7%) |
| 7:30 AM to 7:59 AM | 44 (7.1%) | 97 (17.3%) |
| 8:00 AM to 8:29 AM | 115 (18.5%) | 36 (6.4%) |
| 8:30 AM to 8:59 AM | 15 (2.4%) | 46 (8.2%) |
| 9:00 AM to 9:59 AM | 33 (5.3%) | 54 (9.6%) |
| 10:00 AM to 10:59 AM | 9 (1.5%) | 21 (3.7%) |
| 11:00 AM to 11:59 AM | 4 (0.6%) | 0 (0.0%) |
| 12:00 PM to 3:59 PM | 31 (5.0%) | 42 (7.5%) |
| 4:00 PM to 11:59 PM | 23 (3.7%) | 17 (3.0%) |
| Total | 621 (100.0%) | 562 (100.0%) |
Housing Occupancy in Victor
Occupancy by Ownership in Victor
Of the total 1,099 dwellings in Victor, owner-occupied units account for 812 (73.9%), while renter-occupied units make up 287 (26.1%).
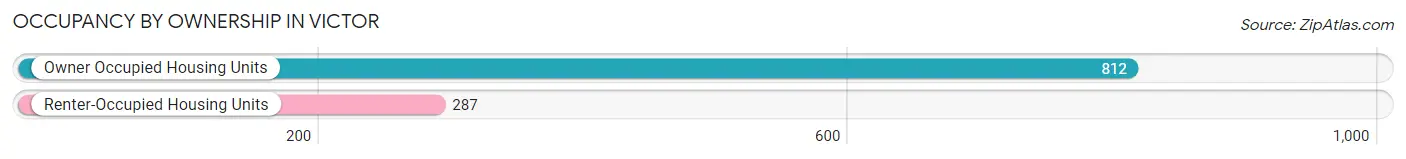
| Occupancy | # Housing Units | % Housing Units |
| Owner Occupied Housing Units | 812 | 73.9% |
| Renter-Occupied Housing Units | 287 | 26.1% |
| Total Occupied Housing Units | 1,099 | 100.0% |
Occupancy by Household Size in Victor
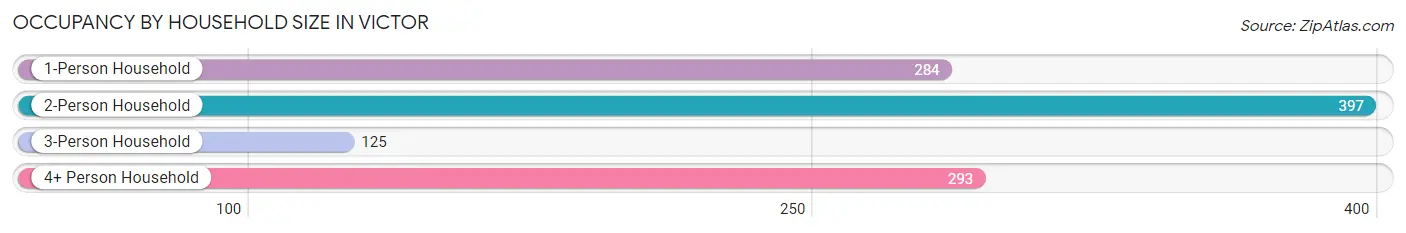
| Household Size | # Housing Units | % Housing Units |
| 1-Person Household | 284 | 25.8% |
| 2-Person Household | 397 | 36.1% |
| 3-Person Household | 125 | 11.4% |
| 4+ Person Household | 293 | 26.7% |
| Total Housing Units | 1,099 | 100.0% |
Occupancy by Ownership by Household Size in Victor
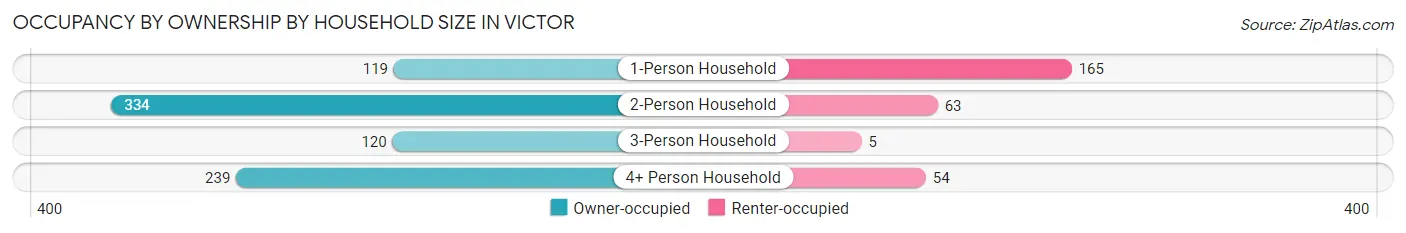
| Household Size | Owner-occupied | Renter-occupied |
| 1-Person Household | 119 (41.9%) | 165 (58.1%) |
| 2-Person Household | 334 (84.1%) | 63 (15.9%) |
| 3-Person Household | 120 (96.0%) | 5 (4.0%) |
| 4+ Person Household | 239 (81.6%) | 54 (18.4%) |
| Total Housing Units | 812 (73.9%) | 287 (26.1%) |
Occupancy by Educational Attainment in Victor
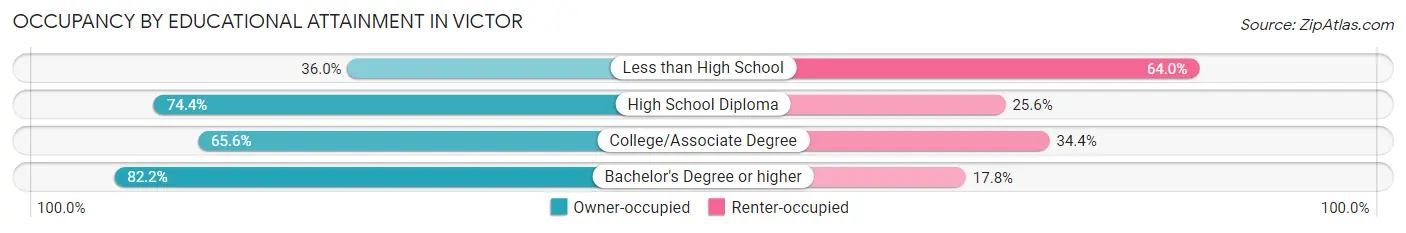
| Household Size | Owner-occupied | Renter-occupied |
| Less than High School | 18 (36.0%) | 32 (64.0%) |
| High School Diploma | 145 (74.4%) | 50 (25.6%) |
| College/Associate Degree | 210 (65.6%) | 110 (34.4%) |
| Bachelor's Degree or higher | 439 (82.2%) | 95 (17.8%) |
Occupancy by Age of Householder in Victor
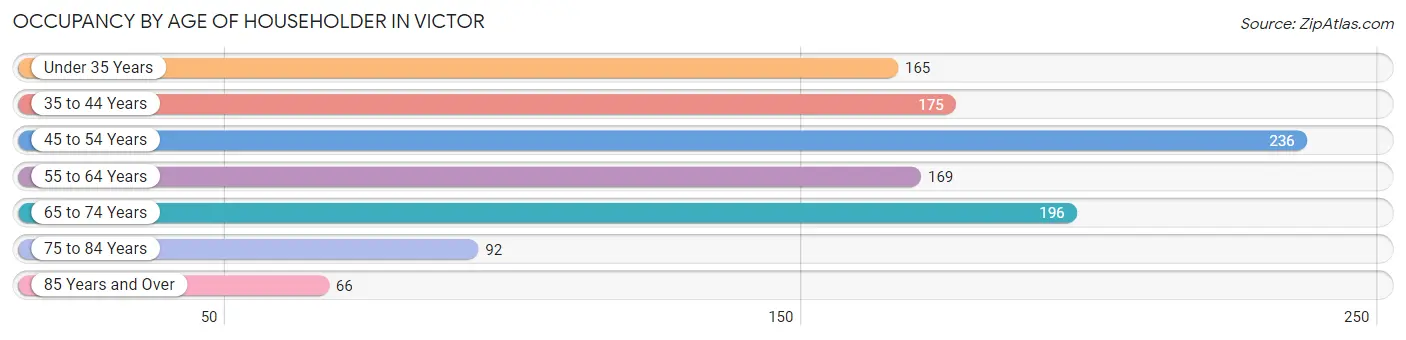
| Age Bracket | # Households | % Households |
| Under 35 Years | 165 | 15.0% |
| 35 to 44 Years | 175 | 15.9% |
| 45 to 54 Years | 236 | 21.5% |
| 55 to 64 Years | 169 | 15.4% |
| 65 to 74 Years | 196 | 17.8% |
| 75 to 84 Years | 92 | 8.4% |
| 85 Years and Over | 66 | 6.0% |
| Total | 1,099 | 100.0% |
Housing Finances in Victor
Median Income by Occupancy in Victor
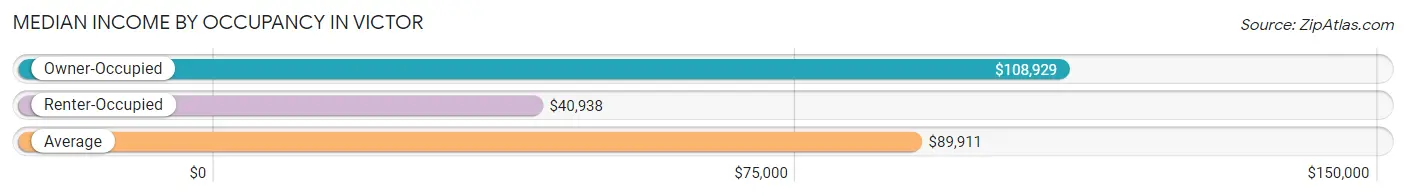
| Occupancy Type | # Households | Median Income |
| Owner-Occupied | 812 (73.9%) | $108,929 |
| Renter-Occupied | 287 (26.1%) | $40,938 |
| Average | 1,099 (100.0%) | $89,911 |
Occupancy by Householder Income Bracket in Victor
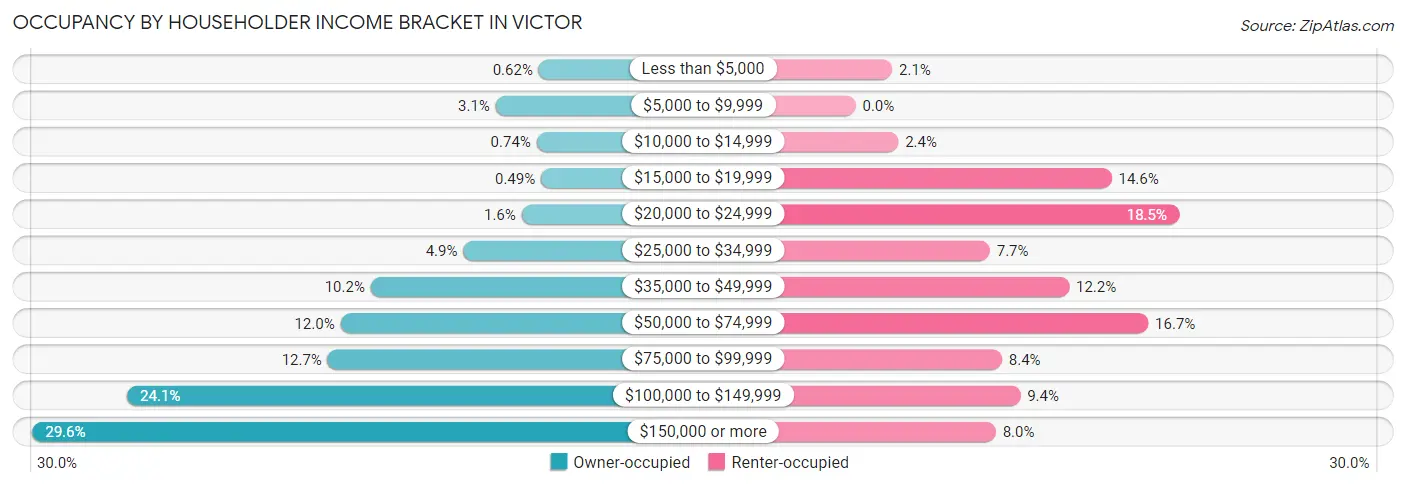
| Income Bracket | Owner-occupied | Renter-occupied |
| Less than $5,000 | 5 (0.6%) | 6 (2.1%) |
| $5,000 to $9,999 | 25 (3.1%) | 0 (0.0%) |
| $10,000 to $14,999 | 6 (0.7%) | 7 (2.4%) |
| $15,000 to $19,999 | 4 (0.5%) | 42 (14.6%) |
| $20,000 to $24,999 | 13 (1.6%) | 53 (18.5%) |
| $25,000 to $34,999 | 40 (4.9%) | 22 (7.7%) |
| $35,000 to $49,999 | 83 (10.2%) | 35 (12.2%) |
| $50,000 to $74,999 | 97 (11.9%) | 48 (16.7%) |
| $75,000 to $99,999 | 103 (12.7%) | 24 (8.4%) |
| $100,000 to $149,999 | 196 (24.1%) | 27 (9.4%) |
| $150,000 or more | 240 (29.6%) | 23 (8.0%) |
| Total | 812 (100.0%) | 287 (100.0%) |
Monthly Housing Cost Tiers in Victor
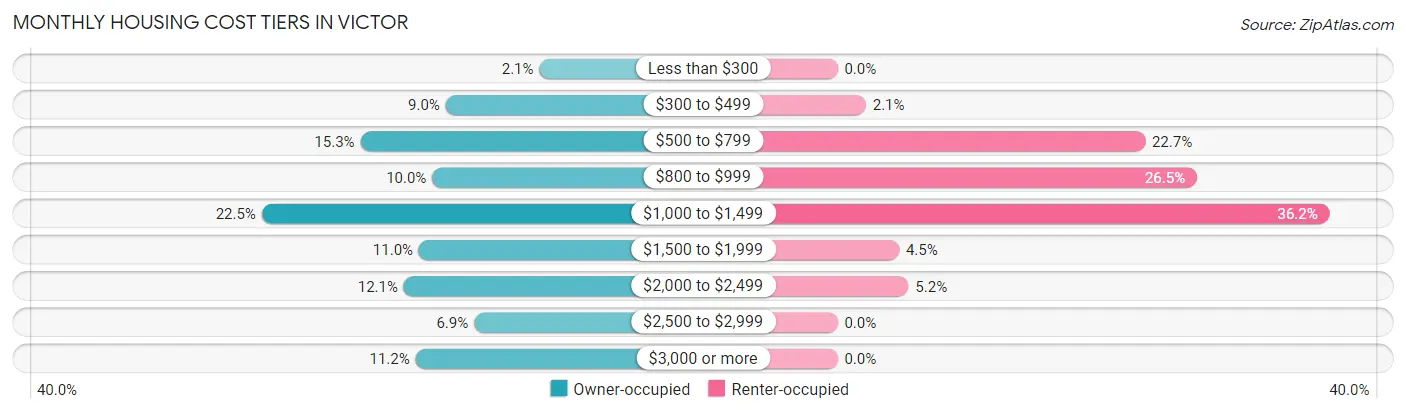
| Monthly Cost | Owner-occupied | Renter-occupied |
| Less than $300 | 17 (2.1%) | 0 (0.0%) |
| $300 to $499 | 73 (9.0%) | 6 (2.1%) |
| $500 to $799 | 124 (15.3%) | 65 (22.7%) |
| $800 to $999 | 81 (10.0%) | 76 (26.5%) |
| $1,000 to $1,499 | 183 (22.5%) | 104 (36.2%) |
| $1,500 to $1,999 | 89 (11.0%) | 13 (4.5%) |
| $2,000 to $2,499 | 98 (12.1%) | 15 (5.2%) |
| $2,500 to $2,999 | 56 (6.9%) | 0 (0.0%) |
| $3,000 or more | 91 (11.2%) | 0 (0.0%) |
| Total | 812 (100.0%) | 287 (100.0%) |
Physical Housing Characteristics in Victor
Housing Structures in Victor
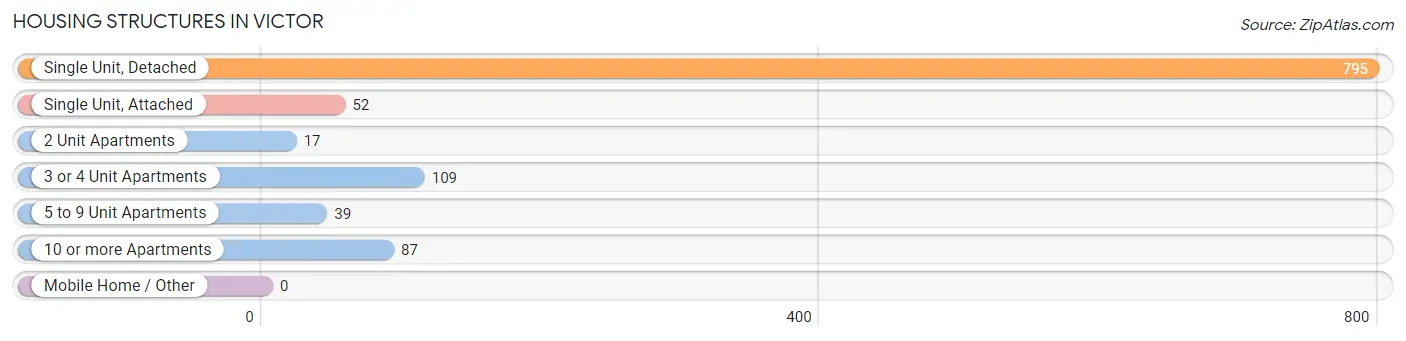
| Structure Type | # Housing Units | % Housing Units |
| Single Unit, Detached | 795 | 72.3% |
| Single Unit, Attached | 52 | 4.7% |
| 2 Unit Apartments | 17 | 1.5% |
| 3 or 4 Unit Apartments | 109 | 9.9% |
| 5 to 9 Unit Apartments | 39 | 3.5% |
| 10 or more Apartments | 87 | 7.9% |
| Mobile Home / Other | 0 | 0.0% |
| Total | 1,099 | 100.0% |
Housing Structures by Occupancy in Victor
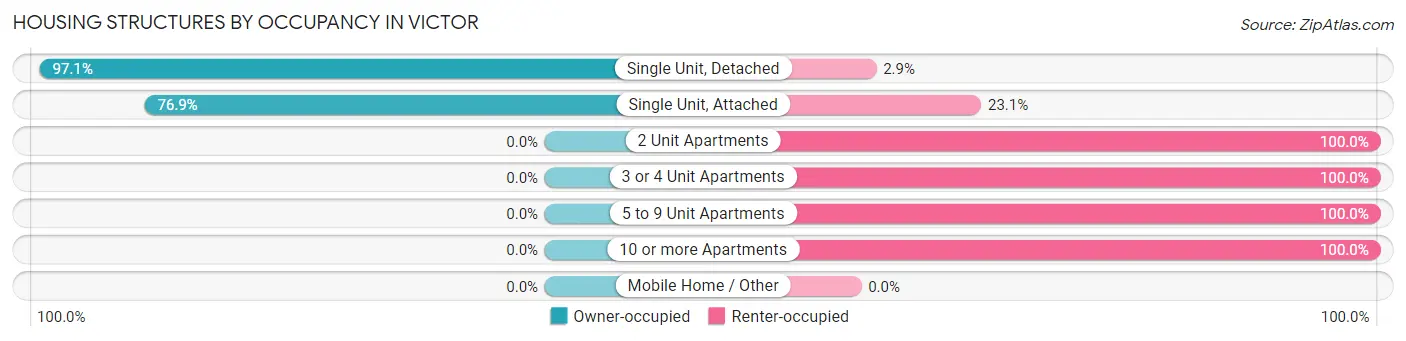
| Structure Type | Owner-occupied | Renter-occupied |
| Single Unit, Detached | 772 (97.1%) | 23 (2.9%) |
| Single Unit, Attached | 40 (76.9%) | 12 (23.1%) |
| 2 Unit Apartments | 0 (0.0%) | 17 (100.0%) |
| 3 or 4 Unit Apartments | 0 (0.0%) | 109 (100.0%) |
| 5 to 9 Unit Apartments | 0 (0.0%) | 39 (100.0%) |
| 10 or more Apartments | 0 (0.0%) | 87 (100.0%) |
| Mobile Home / Other | 0 (0.0%) | 0 (0.0%) |
| Total | 812 (73.9%) | 287 (26.1%) |
Housing Structures by Number of Rooms in Victor
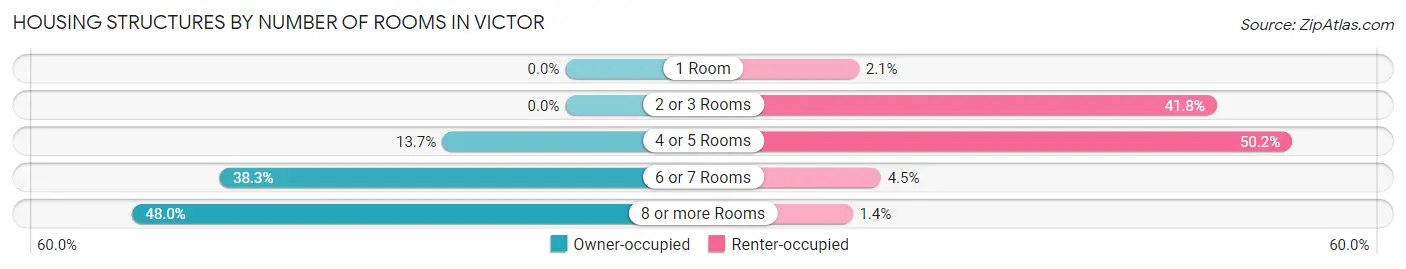
| Number of Rooms | Owner-occupied | Renter-occupied |
| 1 Room | 0 (0.0%) | 6 (2.1%) |
| 2 or 3 Rooms | 0 (0.0%) | 120 (41.8%) |
| 4 or 5 Rooms | 111 (13.7%) | 144 (50.2%) |
| 6 or 7 Rooms | 311 (38.3%) | 13 (4.5%) |
| 8 or more Rooms | 390 (48.0%) | 4 (1.4%) |
| Total | 812 (100.0%) | 287 (100.0%) |
Housing Structure by Heating Type in Victor
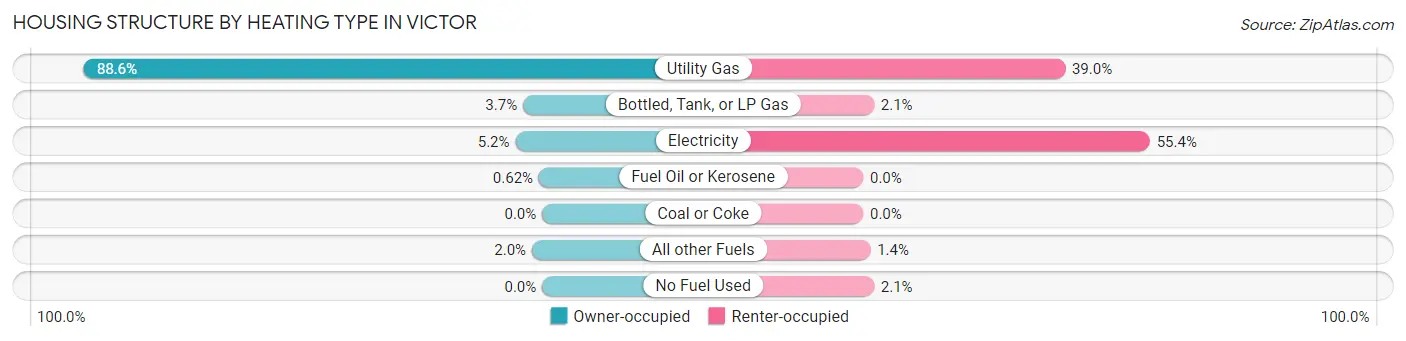
| Heating Type | Owner-occupied | Renter-occupied |
| Utility Gas | 719 (88.5%) | 112 (39.0%) |
| Bottled, Tank, or LP Gas | 30 (3.7%) | 6 (2.1%) |
| Electricity | 42 (5.2%) | 159 (55.4%) |
| Fuel Oil or Kerosene | 5 (0.6%) | 0 (0.0%) |
| Coal or Coke | 0 (0.0%) | 0 (0.0%) |
| All other Fuels | 16 (2.0%) | 4 (1.4%) |
| No Fuel Used | 0 (0.0%) | 6 (2.1%) |
| Total | 812 (100.0%) | 287 (100.0%) |
Household Vehicle Usage in Victor
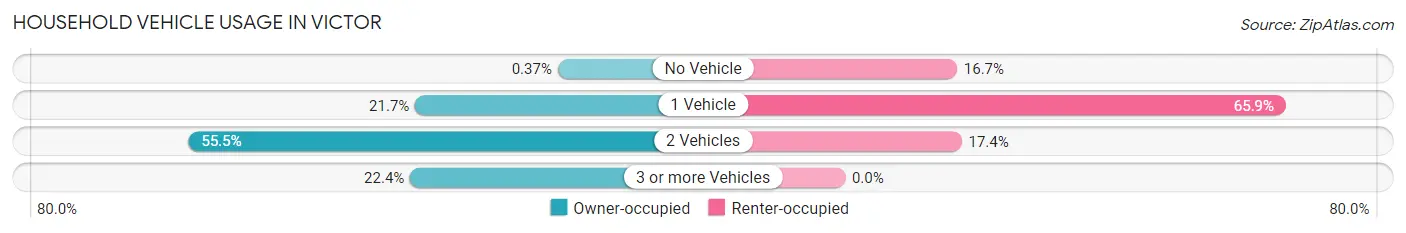
| Vehicles per Household | Owner-occupied | Renter-occupied |
| No Vehicle | 3 (0.4%) | 48 (16.7%) |
| 1 Vehicle | 176 (21.7%) | 189 (65.8%) |
| 2 Vehicles | 451 (55.5%) | 50 (17.4%) |
| 3 or more Vehicles | 182 (22.4%) | 0 (0.0%) |
| Total | 812 (100.0%) | 287 (100.0%) |
Real Estate & Mortgages in Victor
Real Estate and Mortgage Overview in Victor
| Characteristic | Without Mortgage | With Mortgage |
| Housing Units | 281 | 531 |
| Median Property Value | $243,400 | $281,900 |
| Median Household Income | $79,438 | $173 |
| Monthly Housing Costs | $618 | $91 |
| Real Estate Taxes | $3,884 | $0 |
Property Value by Mortgage Status in Victor
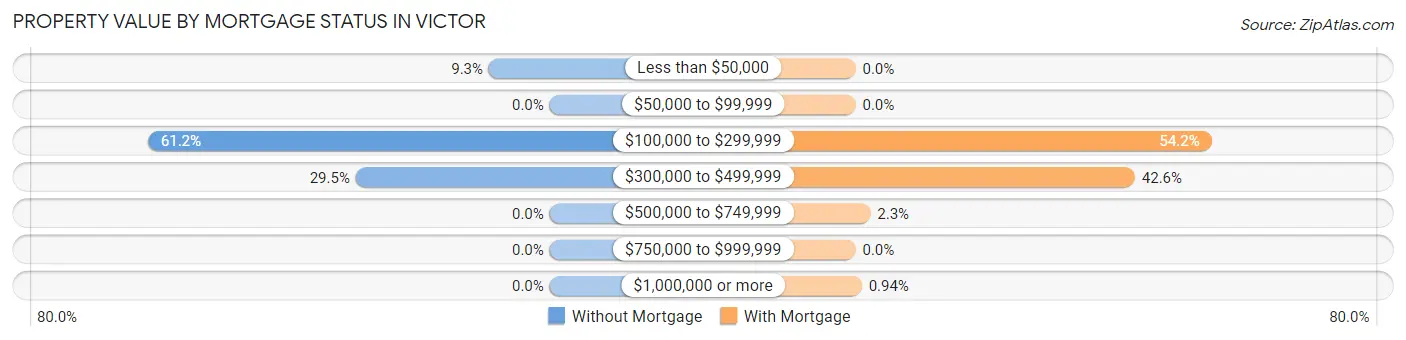
| Property Value | Without Mortgage | With Mortgage |
| Less than $50,000 | 26 (9.2%) | 0 (0.0%) |
| $50,000 to $99,999 | 0 (0.0%) | 0 (0.0%) |
| $100,000 to $299,999 | 172 (61.2%) | 288 (54.2%) |
| $300,000 to $499,999 | 83 (29.5%) | 226 (42.6%) |
| $500,000 to $749,999 | 0 (0.0%) | 12 (2.3%) |
| $750,000 to $999,999 | 0 (0.0%) | 0 (0.0%) |
| $1,000,000 or more | 0 (0.0%) | 5 (0.9%) |
| Total | 281 (100.0%) | 531 (100.0%) |
Household Income by Mortgage Status in Victor
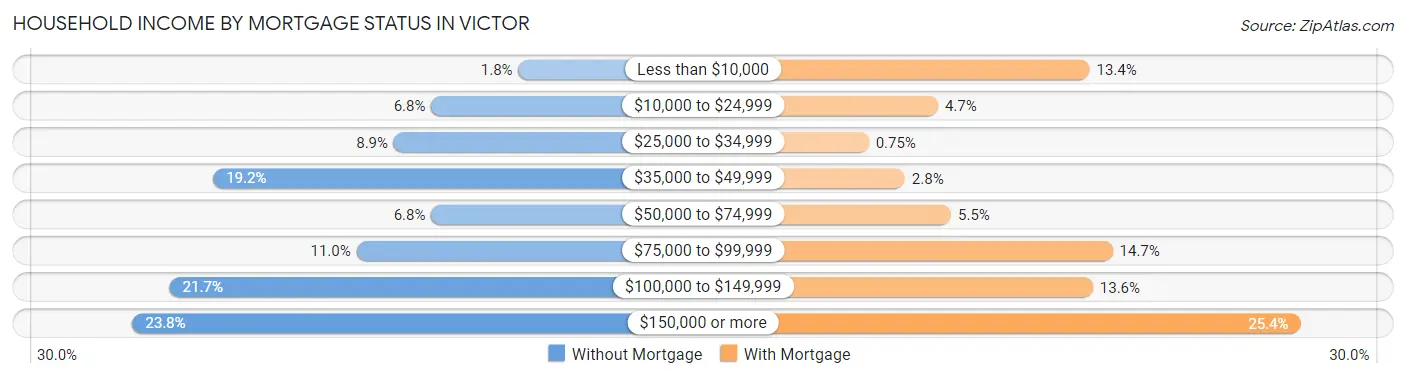
| Household Income | Without Mortgage | With Mortgage |
| Less than $10,000 | 5 (1.8%) | 71 (13.4%) |
| $10,000 to $24,999 | 19 (6.8%) | 25 (4.7%) |
| $25,000 to $34,999 | 25 (8.9%) | 4 (0.7%) |
| $35,000 to $49,999 | 54 (19.2%) | 15 (2.8%) |
| $50,000 to $74,999 | 19 (6.8%) | 29 (5.5%) |
| $75,000 to $99,999 | 31 (11.0%) | 78 (14.7%) |
| $100,000 to $149,999 | 61 (21.7%) | 72 (13.6%) |
| $150,000 or more | 67 (23.8%) | 135 (25.4%) |
| Total | 281 (100.0%) | 531 (100.0%) |
Property Value to Household Income Ratio in Victor
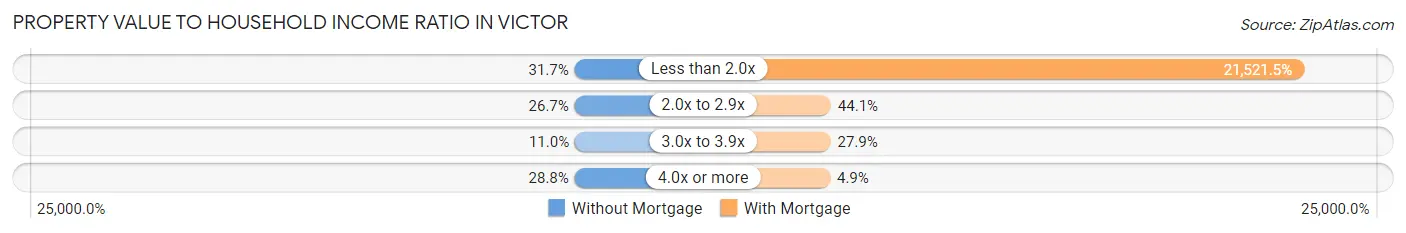
| Value-to-Income Ratio | Without Mortgage | With Mortgage |
| Less than 2.0x | 89 (31.7%) | 114,279 (21,521.5%) |
| 2.0x to 2.9x | 75 (26.7%) | 234 (44.1%) |
| 3.0x to 3.9x | 31 (11.0%) | 148 (27.9%) |
| 4.0x or more | 81 (28.8%) | 26 (4.9%) |
| Total | 281 (100.0%) | 531 (100.0%) |
Real Estate Taxes by Mortgage Status in Victor
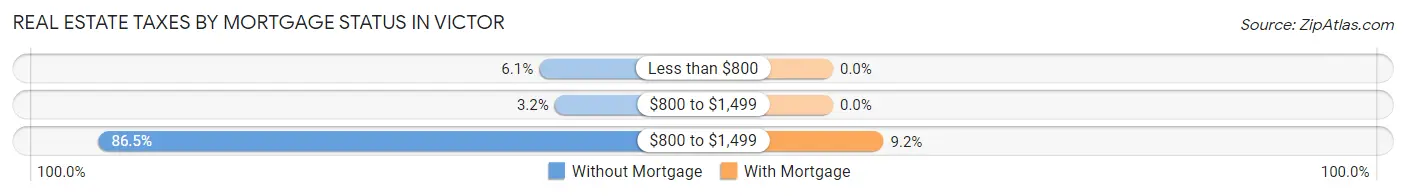
| Property Taxes | Without Mortgage | With Mortgage |
| Less than $800 | 17 (6.0%) | 0 (0.0%) |
| $800 to $1,499 | 9 (3.2%) | 0 (0.0%) |
| $800 to $1,499 | 243 (86.5%) | 49 (9.2%) |
| Total | 281 (100.0%) | 531 (100.0%) |
Health & Disability in Victor
Health Insurance Coverage by Age in Victor
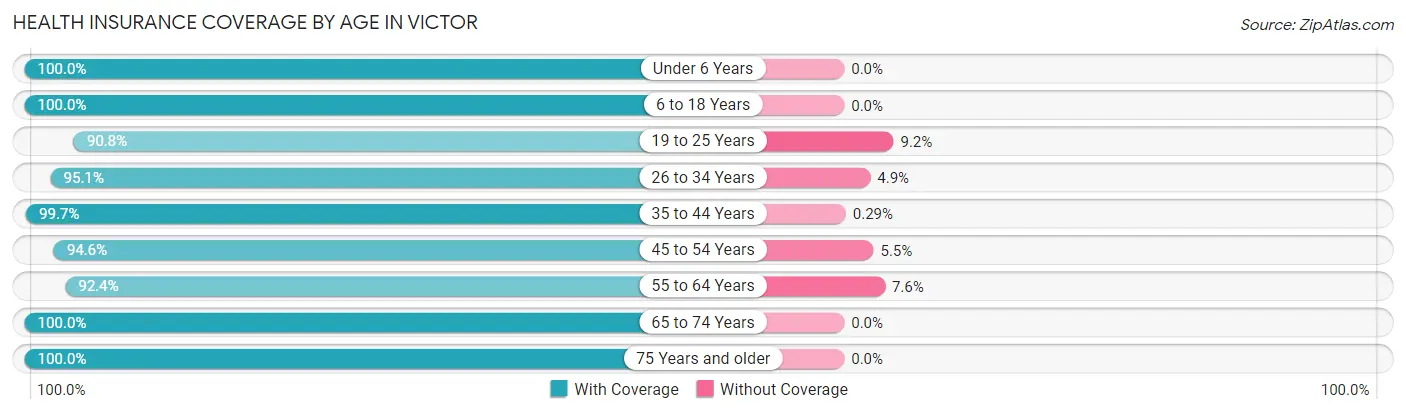
| Age Bracket | With Coverage | Without Coverage |
| Under 6 Years | 223 (100.0%) | 0 (0.0%) |
| 6 to 18 Years | 473 (100.0%) | 0 (0.0%) |
| 19 to 25 Years | 89 (90.8%) | 9 (9.2%) |
| 26 to 34 Years | 313 (95.1%) | 16 (4.9%) |
| 35 to 44 Years | 348 (99.7%) | 1 (0.3%) |
| 45 to 54 Years | 364 (94.6%) | 21 (5.4%) |
| 55 to 64 Years | 280 (92.4%) | 23 (7.6%) |
| 65 to 74 Years | 322 (100.0%) | 0 (0.0%) |
| 75 Years and older | 240 (100.0%) | 0 (0.0%) |
| Total | 2,652 (97.4%) | 70 (2.6%) |
Health Insurance Coverage by Citizenship Status in Victor
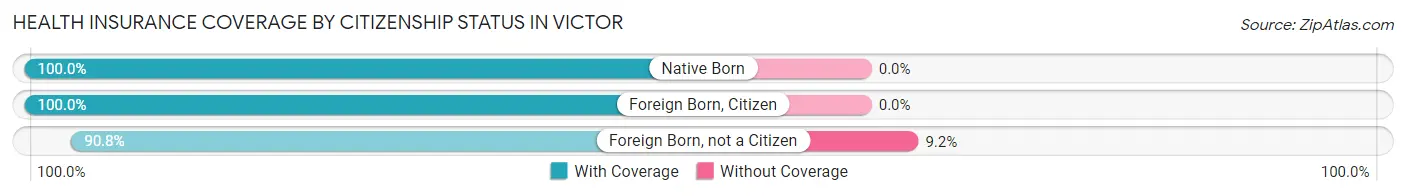
| Citizenship Status | With Coverage | Without Coverage |
| Native Born | 223 (100.0%) | 0 (0.0%) |
| Foreign Born, Citizen | 473 (100.0%) | 0 (0.0%) |
| Foreign Born, not a Citizen | 89 (90.8%) | 9 (9.2%) |
Health Insurance Coverage by Household Income in Victor
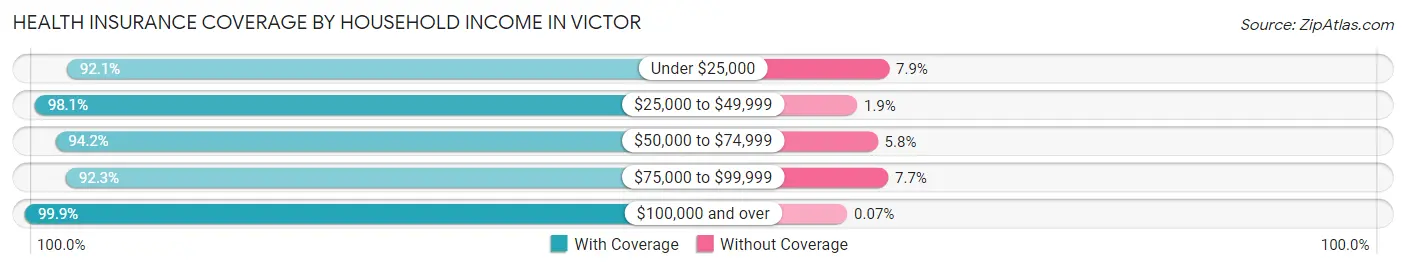
| Household Income | With Coverage | Without Coverage |
| Under $25,000 | 209 (92.1%) | 18 (7.9%) |
| $25,000 to $49,999 | 256 (98.1%) | 5 (1.9%) |
| $50,000 to $74,999 | 326 (94.2%) | 20 (5.8%) |
| $75,000 to $99,999 | 310 (92.3%) | 26 (7.7%) |
| $100,000 and over | 1,528 (99.9%) | 1 (0.1%) |
Public vs Private Health Insurance Coverage by Age in Victor
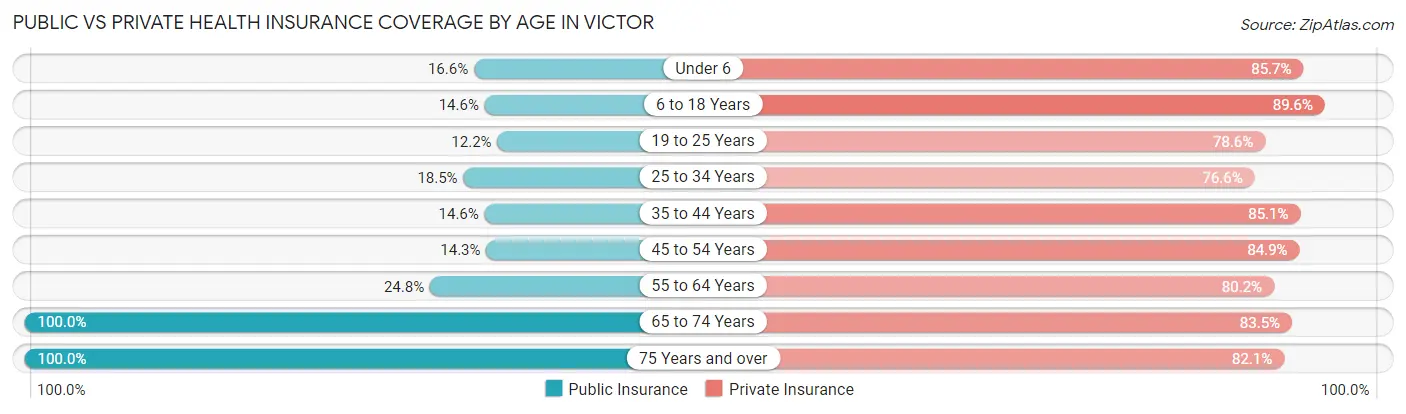
| Age Bracket | Public Insurance | Private Insurance |
| Under 6 | 37 (16.6%) | 191 (85.7%) |
| 6 to 18 Years | 69 (14.6%) | 424 (89.6%) |
| 19 to 25 Years | 12 (12.2%) | 77 (78.6%) |
| 25 to 34 Years | 61 (18.5%) | 252 (76.6%) |
| 35 to 44 Years | 51 (14.6%) | 297 (85.1%) |
| 45 to 54 Years | 55 (14.3%) | 327 (84.9%) |
| 55 to 64 Years | 75 (24.7%) | 243 (80.2%) |
| 65 to 74 Years | 322 (100.0%) | 269 (83.5%) |
| 75 Years and over | 240 (100.0%) | 197 (82.1%) |
| Total | 922 (33.9%) | 2,277 (83.7%) |
Disability Status by Sex by Age in Victor
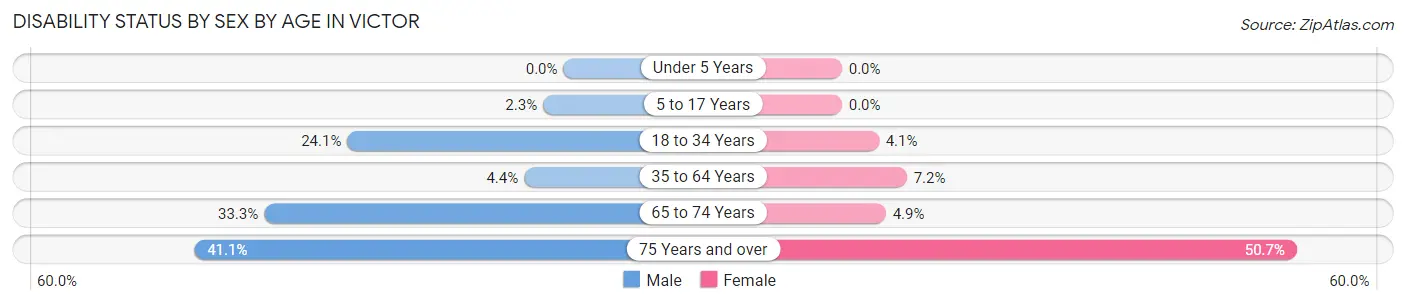
| Age Bracket | Male | Female |
| Under 5 Years | 0 (0.0%) | 0 (0.0%) |
| 5 to 17 Years | 6 (2.3%) | 0 (0.0%) |
| 18 to 34 Years | 52 (24.1%) | 9 (4.1%) |
| 35 to 64 Years | 23 (4.4%) | 37 (7.2%) |
| 65 to 74 Years | 46 (33.3%) | 9 (4.9%) |
| 75 Years and over | 37 (41.1%) | 76 (50.7%) |
Disability Class by Sex by Age in Victor
Disability Class: Hearing Difficulty
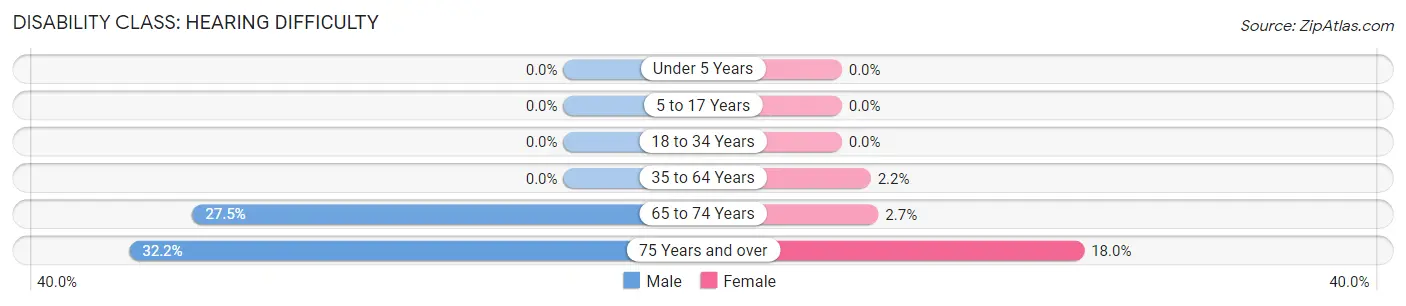
| Age Bracket | Male | Female |
| Under 5 Years | 0 (0.0%) | 0 (0.0%) |
| 5 to 17 Years | 0 (0.0%) | 0 (0.0%) |
| 18 to 34 Years | 0 (0.0%) | 0 (0.0%) |
| 35 to 64 Years | 0 (0.0%) | 11 (2.1%) |
| 65 to 74 Years | 38 (27.5%) | 5 (2.7%) |
| 75 Years and over | 29 (32.2%) | 27 (18.0%) |
Disability Class: Vision Difficulty
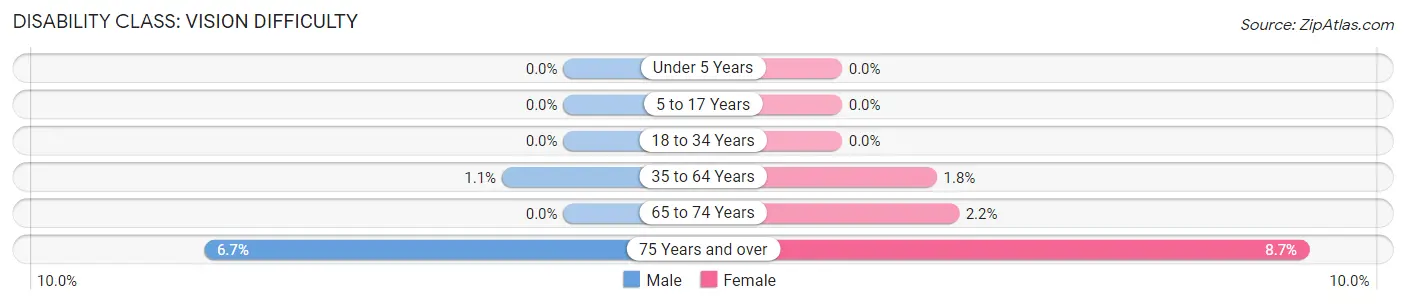
| Age Bracket | Male | Female |
| Under 5 Years | 0 (0.0%) | 0 (0.0%) |
| 5 to 17 Years | 0 (0.0%) | 0 (0.0%) |
| 18 to 34 Years | 0 (0.0%) | 0 (0.0%) |
| 35 to 64 Years | 6 (1.1%) | 9 (1.8%) |
| 65 to 74 Years | 0 (0.0%) | 4 (2.2%) |
| 75 Years and over | 6 (6.7%) | 13 (8.7%) |
Disability Class: Cognitive Difficulty
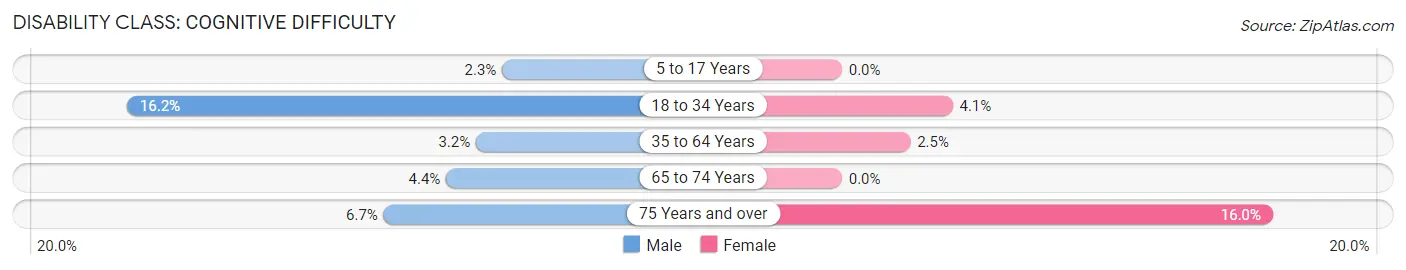
| Age Bracket | Male | Female |
| 5 to 17 Years | 6 (2.3%) | 0 (0.0%) |
| 18 to 34 Years | 35 (16.2%) | 9 (4.1%) |
| 35 to 64 Years | 17 (3.2%) | 13 (2.5%) |
| 65 to 74 Years | 6 (4.3%) | 0 (0.0%) |
| 75 Years and over | 6 (6.7%) | 24 (16.0%) |
Disability Class: Ambulatory Difficulty
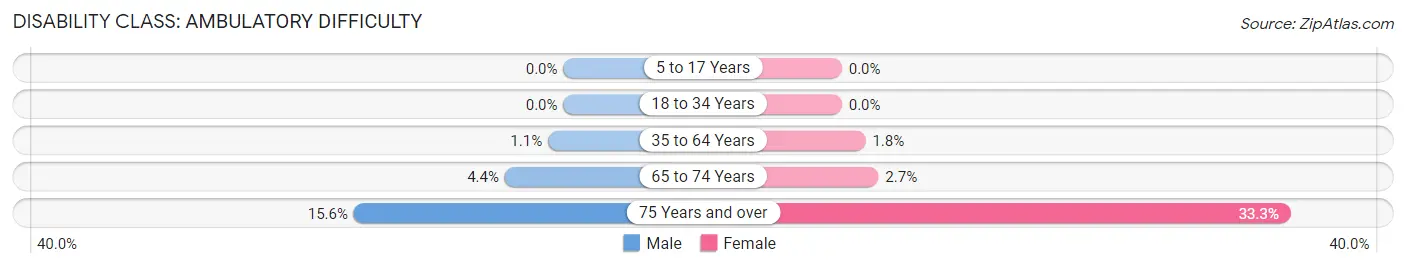
| Age Bracket | Male | Female |
| 5 to 17 Years | 0 (0.0%) | 0 (0.0%) |
| 18 to 34 Years | 0 (0.0%) | 0 (0.0%) |
| 35 to 64 Years | 6 (1.1%) | 9 (1.8%) |
| 65 to 74 Years | 6 (4.3%) | 5 (2.7%) |
| 75 Years and over | 14 (15.6%) | 50 (33.3%) |
Disability Class: Self-Care Difficulty
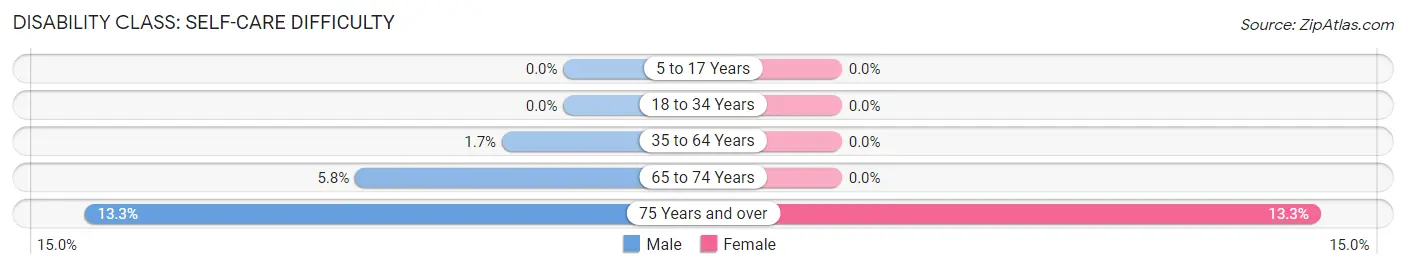
| Age Bracket | Male | Female |
| 5 to 17 Years | 0 (0.0%) | 0 (0.0%) |
| 18 to 34 Years | 0 (0.0%) | 0 (0.0%) |
| 35 to 64 Years | 9 (1.7%) | 0 (0.0%) |
| 65 to 74 Years | 8 (5.8%) | 0 (0.0%) |
| 75 Years and over | 12 (13.3%) | 20 (13.3%) |
Technology Access in Victor
Computing Device Access in Victor
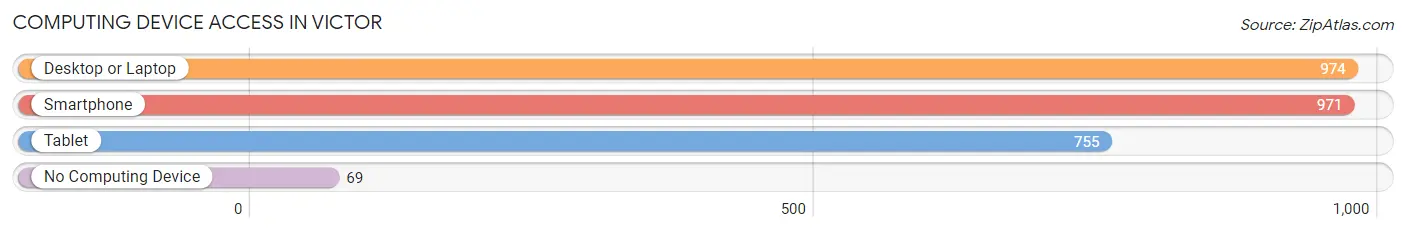
| Device Type | # Households | % Households |
| Desktop or Laptop | 974 | 88.6% |
| Smartphone | 971 | 88.3% |
| Tablet | 755 | 68.7% |
| No Computing Device | 69 | 6.3% |
| Total | 1,099 | 100.0% |
Internet Access in Victor
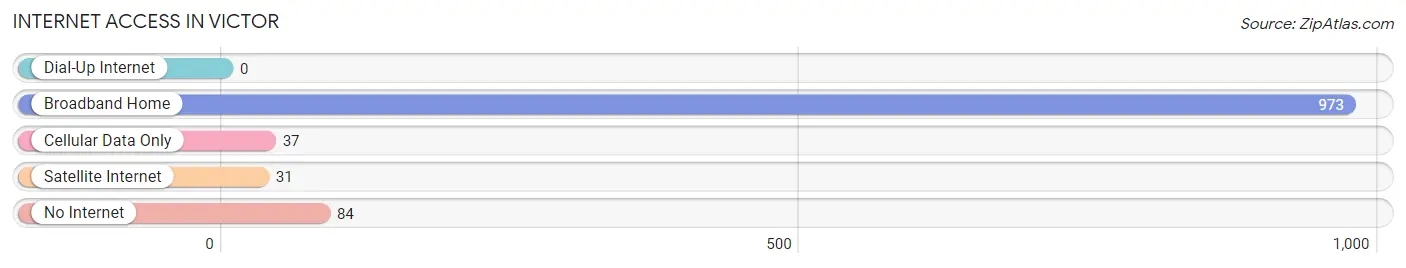
| Internet Type | # Households | % Households |
| Dial-Up Internet | 0 | 0.0% |
| Broadband Home | 973 | 88.5% |
| Cellular Data Only | 37 | 3.4% |
| Satellite Internet | 31 | 2.8% |
| No Internet | 84 | 7.6% |
| Total | 1,099 | 100.0% |
Victor Summary
Victor, New York is a town located in Ontario County, New York, United States. The population was 8,735 at the 2010 census. The town is named after Claudius Victor Boughton, an early settler.
History
Victor was first settled in 1789 by Claudius Victor Boughton, a Revolutionary War veteran. The town was originally part of the town of Farmington, but was incorporated as its own town in 1812. The town was named after Boughton, who was a major landowner in the area.
Victor was an agricultural community for much of its history, with many of its residents working in the dairy industry. In the late 19th century, the town began to develop into a manufacturing center, with several factories being built in the area. The Victor Iron Works was one of the most prominent of these factories, producing iron products for the local market.
Geography
Victor is located in the Finger Lakes region of New York, about 20 miles southeast of Rochester. The town is bordered by the towns of Farmington to the north, East Bloomfield to the east, Mendon to the south, and Canandaigua to the west.
Victor is located on the western edge of the Finger Lakes, with Canandaigua Lake to the west and Honeoye Lake to the east. The town is mostly flat, with some rolling hills in the northern and eastern parts of the town. The highest point in the town is a hill in the northeast corner, which rises to an elevation of 1,100 feet.
Economy
Victor’s economy is largely based on agriculture and manufacturing. The town is home to several large farms, which produce a variety of crops, including corn, soybeans, and hay. The town is also home to several manufacturing companies, including Victor Iron Works, which produces iron products for the local market.
The town is also home to several retail businesses, including several restaurants, a grocery store, and a hardware store. The town is also home to several small businesses, including a winery, a brewery, and a distillery.
Demographics
As of the 2010 census, there were 8,735 people, 3,521 households, and 2,521 families living in the town. The population density was 517.3 people per square mile. The racial makeup of the town was 97.2% White, 0.7% African American, 0.2% Native American, 0.7% Asian, 0.1% Pacific Islander, 0.3% from other races, and 0.9% from two or more races. Hispanic or Latino of any race were 1.7% of the population.
The median income for a household in the town was $60,938, and the median income for a family was $71,944. The per capita income for the town was $27,945. About 4.2% of families and 5.7% of the population were below the poverty line, including 6.3% of those under age 18 and 4.2% of those age 65 or over.
Common Questions
What is Per Capita Income in Victor?
Per Capita income in Victor is $41,969.
What is the Median Family Income in Victor?
Median Family Income in Victor is $109,125.
What is the Median Household income in Victor?
Median Household Income in Victor is $89,911.
What is Income or Wage Gap in Victor?
Income or Wage Gap in Victor is 34.9%.
Women in Victor earn 65.1 cents for every dollar earned by a man.
What is Inequality or Gini Index in Victor?
Inequality or Gini Index in Victor is 0.40.
What is the Total Population of Victor?
Total Population of Victor is 2,722.
What is the Total Male Population of Victor?
Total Male Population of Victor is 1,313.
What is the Total Female Population of Victor?
Total Female Population of Victor is 1,409.
What is the Ratio of Males per 100 Females in Victor?
There are 93.19 Males per 100 Females in Victor.
What is the Ratio of Females per 100 Males in Victor?
There are 107.31 Females per 100 Males in Victor.
What is the Median Population Age in Victor?
Median Population Age in Victor is 40.1 Years.
What is the Average Family Size in Victor
Average Family Size in Victor is 2.9 People.
What is the Average Household Size in Victor
Average Household Size in Victor is 2.5 People.
How Large is the Labor Force in Victor?
There are 1,326 People in the Labor Forcein in Victor.
What is the Percentage of People in the Labor Force in Victor?
63.8% of People are in the Labor Force in Victor.
What is the Unemployment Rate in Victor?
Unemployment Rate in Victor is 1.4%.