Valhalla, NY Map & Demographics
Valhalla Map
Valhalla Overview
$54,611
PER CAPITA INCOME
$129,583
AVG FAMILY INCOME
$87,451
AVG HOUSEHOLD INCOME
28.9%
WAGE / INCOME GAP [ % ]
71.1¢/ $1
WAGE / INCOME GAP [ $ ]
$7,573
FAMILY INCOME DEFICIT
0.47
INEQUALITY / GINI INDEX
3,052
TOTAL POPULATION
1,604
MALE POPULATION
1,448
FEMALE POPULATION
110.77
MALES / 100 FEMALES
90.27
FEMALES / 100 MALES
45.5
MEDIAN AGE
3.2
AVG FAMILY SIZE
2.8
AVG HOUSEHOLD SIZE
1,536
LABOR FORCE [ PEOPLE ]
59.6%
PERCENT IN LABOR FORCE
4.4%
UNEMPLOYMENT RATE
Valhalla Zip Codes
Valhalla Area Codes
Income in Valhalla
Income Overview in Valhalla
Per Capita Income in Valhalla is $54,611, while median incomes of families and households are $129,583 and $87,451 respectively.
| Characteristic | Number | Measure |
| Per Capita Income | 3,052 | $54,611 |
| Median Family Income | 769 | $129,583 |
| Mean Family Income | 769 | $169,256 |
| Median Household Income | 1,095 | $87,451 |
| Mean Household Income | 1,095 | $145,019 |
| Income Deficit | 769 | $7,573 |
| Wage / Income Gap (%) | 3,052 | 28.88% |
| Wage / Income Gap ($) | 3,052 | 71.12¢ per $1 |
| Gini / Inequality Index | 3,052 | 0.47 |
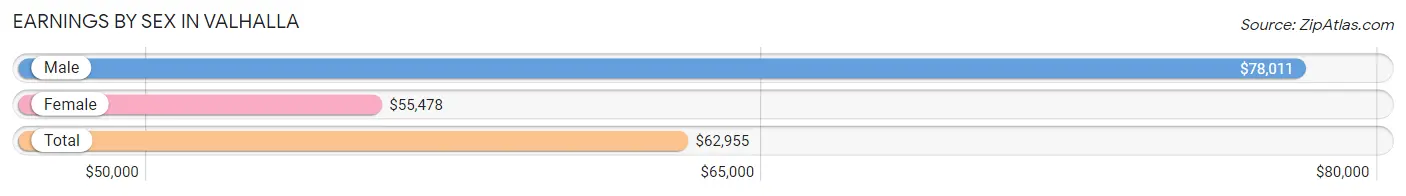
Earnings by Sex in Valhalla
Average Earnings in Valhalla are $62,955, $78,011 for men and $55,478 for women, a difference of 28.9%.
| Sex | Number | Average Earnings |
| Male | 871 (53.8%) | $78,011 |
| Female | 749 (46.2%) | $55,478 |
| Total | 1,620 (100.0%) | $62,955 |
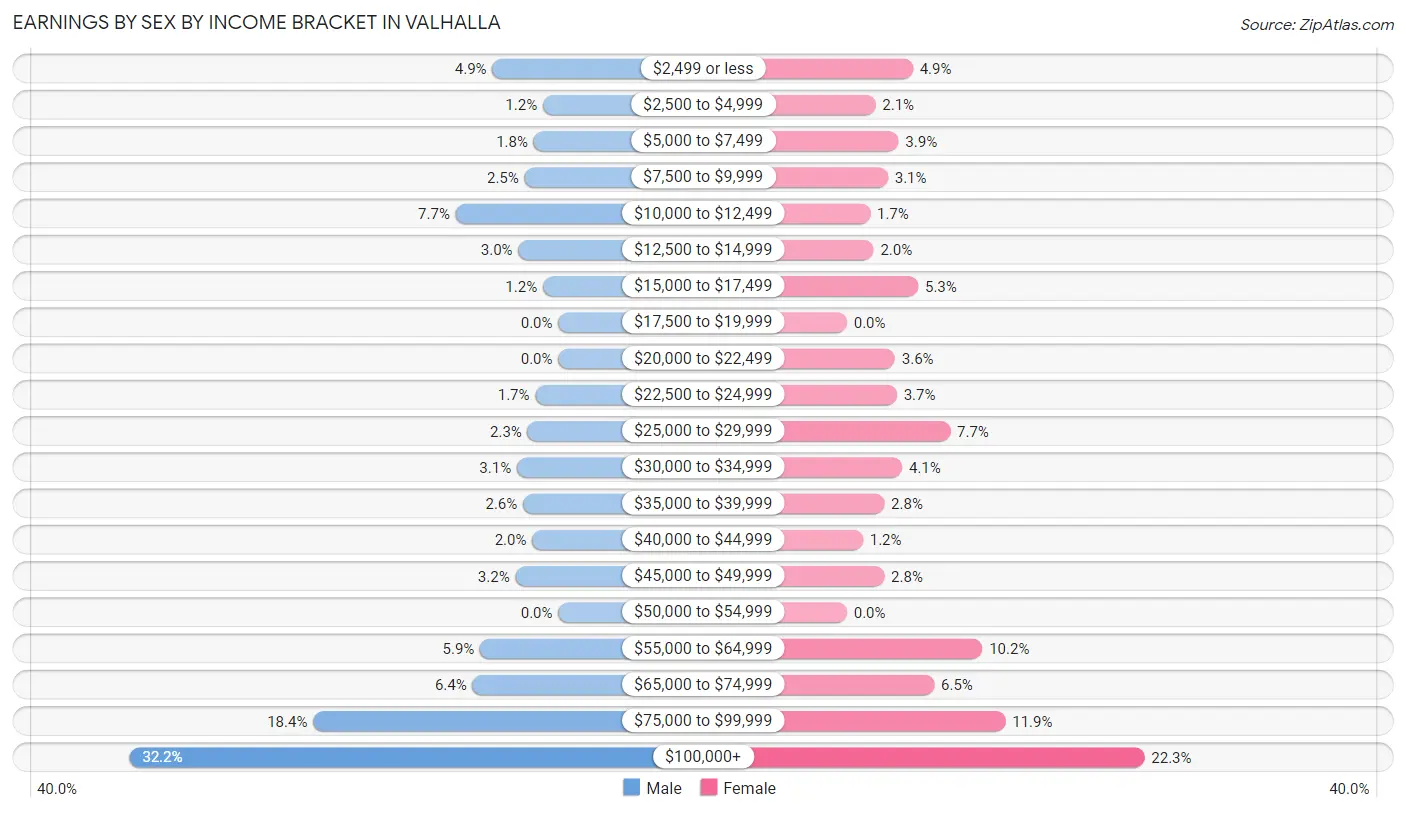
Earnings by Sex by Income Bracket in Valhalla
The most common earnings brackets in Valhalla are $100,000+ for men (280 | 32.2%) and $100,000+ for women (167 | 22.3%).
| Income | Male | Female |
| $2,499 or less | 43 (4.9%) | 37 (4.9%) |
| $2,500 to $4,999 | 10 (1.1%) | 16 (2.1%) |
| $5,000 to $7,499 | 16 (1.8%) | 29 (3.9%) |
| $7,500 to $9,999 | 22 (2.5%) | 23 (3.1%) |
| $10,000 to $12,499 | 67 (7.7%) | 13 (1.7%) |
| $12,500 to $14,999 | 26 (3.0%) | 15 (2.0%) |
| $15,000 to $17,499 | 10 (1.1%) | 40 (5.3%) |
| $17,500 to $19,999 | 0 (0.0%) | 0 (0.0%) |
| $20,000 to $22,499 | 0 (0.0%) | 27 (3.6%) |
| $22,500 to $24,999 | 15 (1.7%) | 28 (3.7%) |
| $25,000 to $29,999 | 20 (2.3%) | 58 (7.7%) |
| $30,000 to $34,999 | 27 (3.1%) | 31 (4.1%) |
| $35,000 to $39,999 | 23 (2.6%) | 21 (2.8%) |
| $40,000 to $44,999 | 17 (1.9%) | 9 (1.2%) |
| $45,000 to $49,999 | 28 (3.2%) | 21 (2.8%) |
| $50,000 to $54,999 | 0 (0.0%) | 0 (0.0%) |
| $55,000 to $64,999 | 51 (5.9%) | 76 (10.2%) |
| $65,000 to $74,999 | 56 (6.4%) | 49 (6.5%) |
| $75,000 to $99,999 | 160 (18.4%) | 89 (11.9%) |
| $100,000+ | 280 (32.2%) | 167 (22.3%) |
| Total | 871 (100.0%) | 749 (100.0%) |
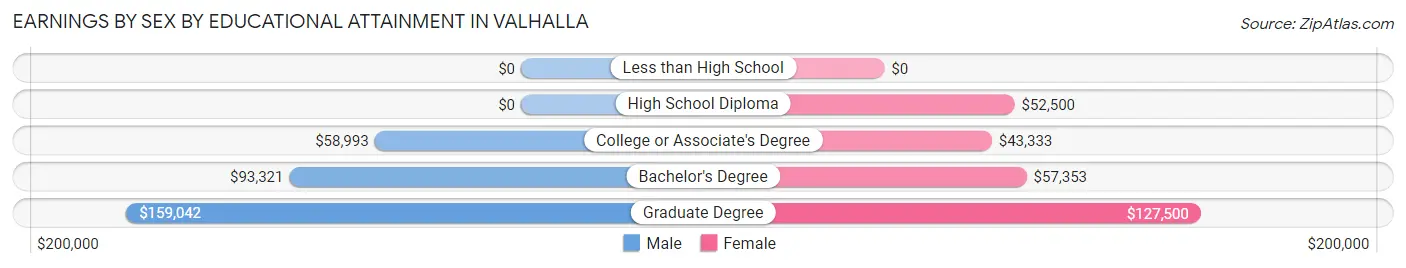
Earnings by Sex by Educational Attainment in Valhalla
Average earnings in Valhalla are $78,068 for men and $59,315 for women, a difference of 24.0%. Men with an educational attainment of graduate degree enjoy the highest average annual earnings of $159,042, while those with college or associate's degree education earn the least with $58,993. Women with an educational attainment of graduate degree earn the most with the average annual earnings of $127,500, while those with college or associate's degree education have the smallest earnings of $43,333.
| Educational Attainment | Male Income | Female Income |
| Less than High School | - | - |
| High School Diploma | - | - |
| College or Associate's Degree | $58,993 | $43,333 |
| Bachelor's Degree | $93,321 | $57,353 |
| Graduate Degree | $159,042 | $127,500 |
| Total | $78,068 | $59,315 |
Family Income in Valhalla
Family Income Brackets in Valhalla
According to the Valhalla family income data, there are 276 families falling into the $200,000+ income range, which is the most common income bracket and makes up 35.9% of all families.
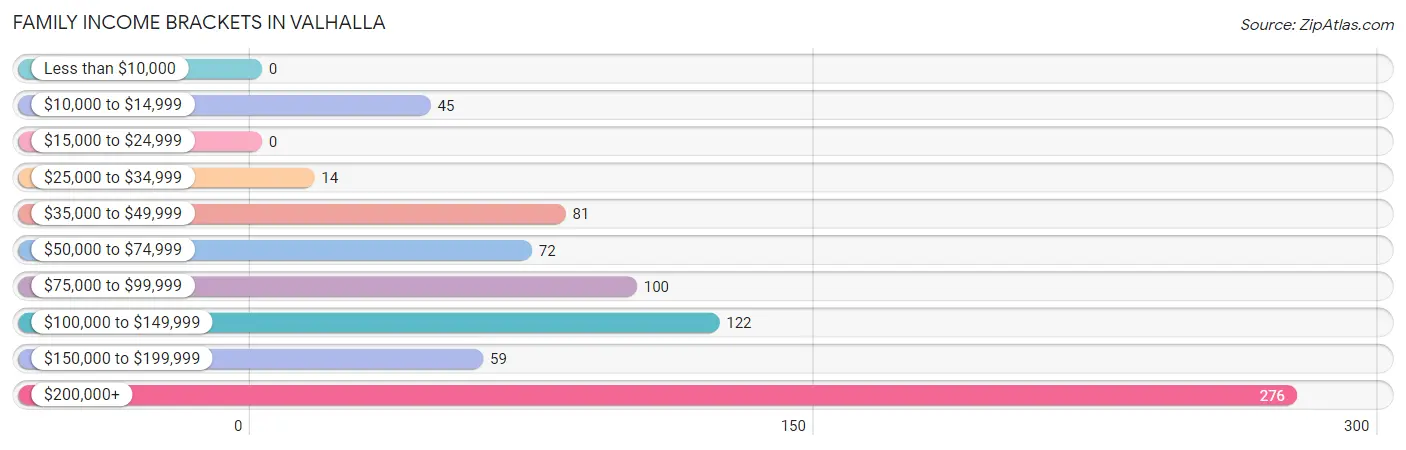
| Income Bracket | # Families | % Families |
| Less than $10,000 | 0 | 0.0% |
| $10,000 to $14,999 | 45 | 5.9% |
| $15,000 to $24,999 | 0 | 0.0% |
| $25,000 to $34,999 | 14 | 1.8% |
| $35,000 to $49,999 | 81 | 10.5% |
| $50,000 to $74,999 | 72 | 9.4% |
| $75,000 to $99,999 | 100 | 13.0% |
| $100,000 to $149,999 | 122 | 15.9% |
| $150,000 to $199,999 | 59 | 7.7% |
| $200,000+ | 276 | 35.9% |
Family Income by Famaliy Size in Valhalla
5-person families (75 | 9.8%) account for the highest median family income in Valhalla with $250,001 per family, while 4-person families (143 | 18.6%) have the highest median income of $54,688 per family member.
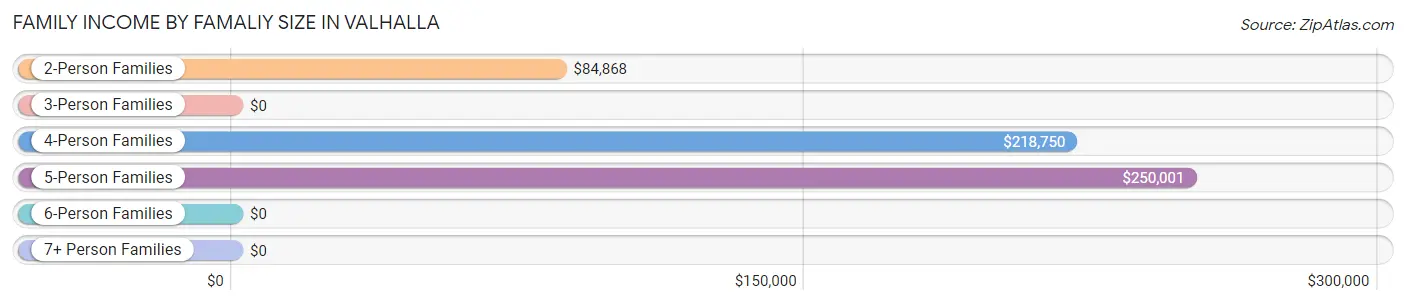
| Income Bracket | # Families | Median Income |
| 2-Person Families | 352 (45.8%) | $84,868 |
| 3-Person Families | 195 (25.4%) | $0 |
| 4-Person Families | 143 (18.6%) | $218,750 |
| 5-Person Families | 75 (9.8%) | $250,001 |
| 6-Person Families | 0 (0.0%) | $0 |
| 7+ Person Families | 4 (0.5%) | $0 |
| Total | 769 (100.0%) | $129,583 |
Family Income by Number of Earners in Valhalla
The median family income in Valhalla is $129,583, with families comprising 3+ earners (144) having the highest median family income of $222,283, while families with no earners (176) have the lowest median family income of $46,842, accounting for 18.7% and 22.9% of families, respectively.
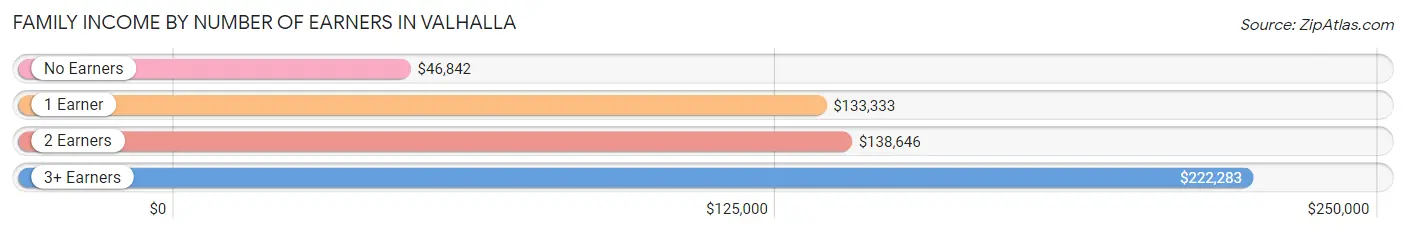
| Number of Earners | # Families | Median Income |
| No Earners | 176 (22.9%) | $46,842 |
| 1 Earner | 178 (23.2%) | $133,333 |
| 2 Earners | 271 (35.2%) | $138,646 |
| 3+ Earners | 144 (18.7%) | $222,283 |
| Total | 769 (100.0%) | $129,583 |
Household Income in Valhalla
Household Income Brackets in Valhalla
With 299 households falling in the category, the $200,000+ income range is the most frequent in Valhalla, accounting for 27.3% of all households.
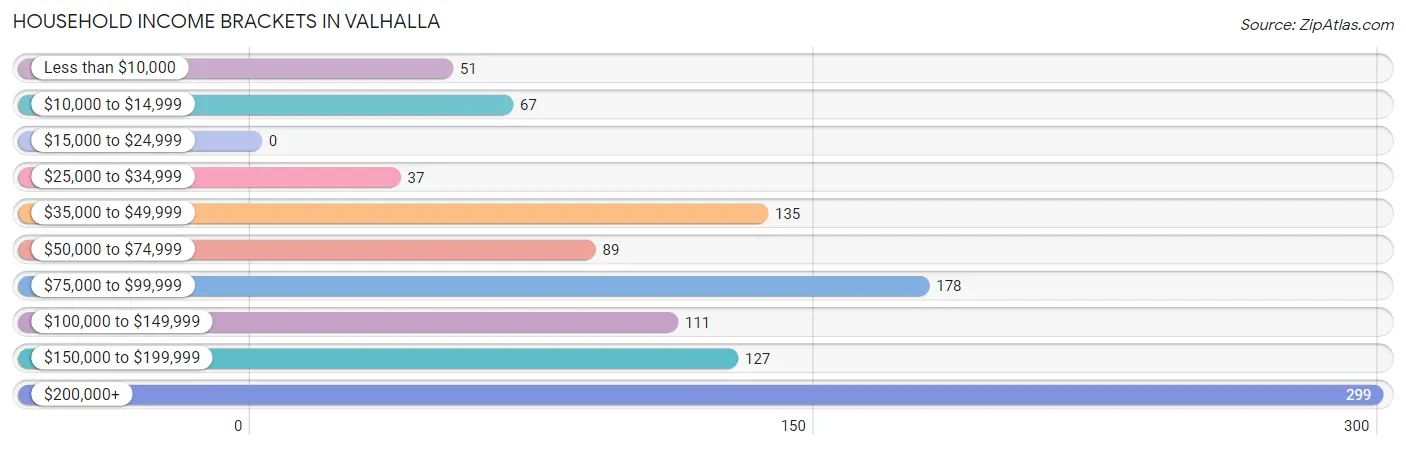
| Income Bracket | # Households | % Households |
| Less than $10,000 | 51 | 4.7% |
| $10,000 to $14,999 | 67 | 6.1% |
| $15,000 to $24,999 | 0 | 0.0% |
| $25,000 to $34,999 | 37 | 3.4% |
| $35,000 to $49,999 | 135 | 12.3% |
| $50,000 to $74,999 | 89 | 8.1% |
| $75,000 to $99,999 | 178 | 16.3% |
| $100,000 to $149,999 | 111 | 10.1% |
| $150,000 to $199,999 | 127 | 11.6% |
| $200,000+ | 299 | 27.3% |
Household Income by Householder Age in Valhalla
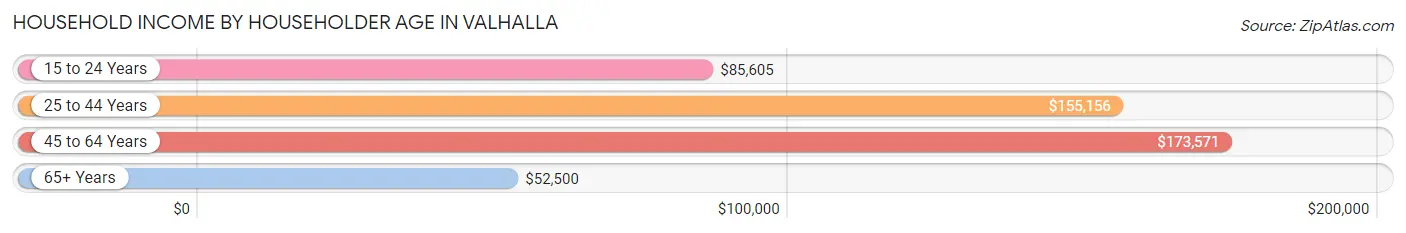
The median household income in Valhalla is $87,451, with the highest median household income of $173,571 found in the 45 to 64 years age bracket for the primary householder. A total of 416 households (38.0%) fall into this category. Meanwhile, the 65+ years age bracket for the primary householder has the lowest median household income of $52,500, with 406 households (37.1%) in this group.
| Income Bracket | # Households | Median Income |
| 15 to 24 Years | 94 (8.6%) | $85,605 |
| 25 to 44 Years | 179 (16.4%) | $155,156 |
| 45 to 64 Years | 416 (38.0%) | $173,571 |
| 65+ Years | 406 (37.1%) | $52,500 |
| Total | 1,095 (100.0%) | $87,451 |
Poverty in Valhalla
Income Below Poverty by Sex and Age in Valhalla
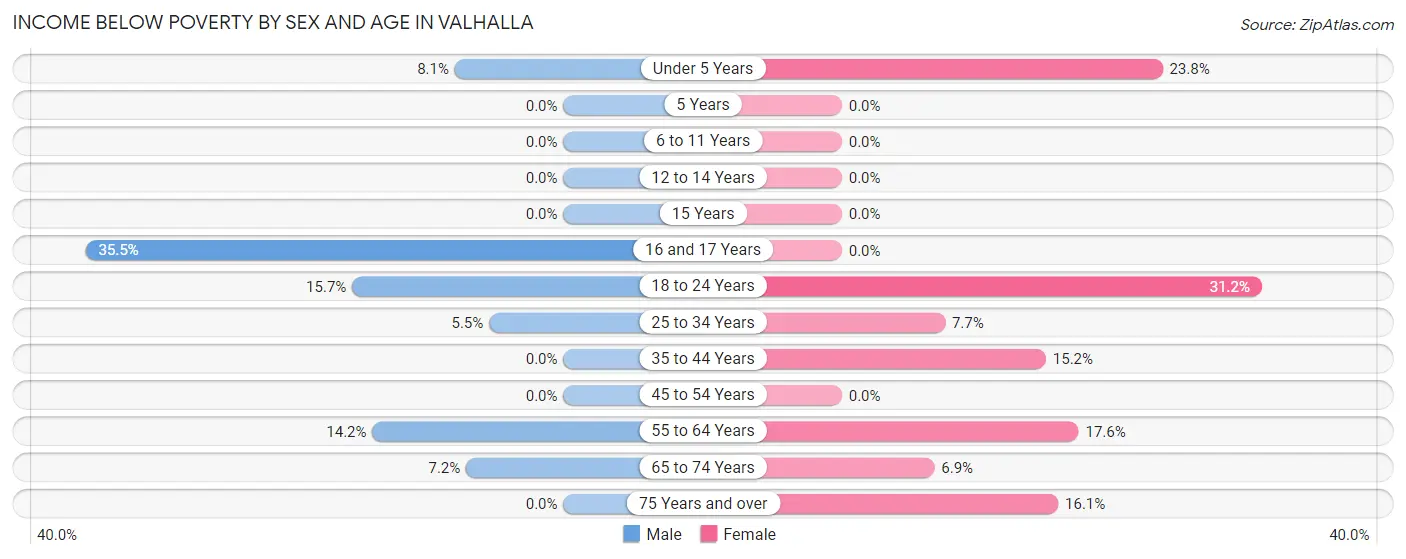
With 7.2% poverty level for males and 12.0% for females among the residents of Valhalla, 16 and 17 year old males and 18 to 24 year old females are the most vulnerable to poverty, with 11 males (35.5%) and 29 females (31.2%) in their respective age groups living below the poverty level.
| Age Bracket | Male | Female |
| Under 5 Years | 10 (8.1%) | 10 (23.8%) |
| 5 Years | 0 (0.0%) | 0 (0.0%) |
| 6 to 11 Years | 0 (0.0%) | 0 (0.0%) |
| 12 to 14 Years | 0 (0.0%) | 0 (0.0%) |
| 15 Years | 0 (0.0%) | 0 (0.0%) |
| 16 and 17 Years | 11 (35.5%) | 0 (0.0%) |
| 18 to 24 Years | 29 (15.7%) | 29 (31.2%) |
| 25 to 34 Years | 13 (5.5%) | 16 (7.7%) |
| 35 to 44 Years | 0 (0.0%) | 15 (15.1%) |
| 45 to 54 Years | 0 (0.0%) | 0 (0.0%) |
| 55 to 64 Years | 39 (14.2%) | 45 (17.6%) |
| 65 to 74 Years | 13 (7.2%) | 9 (6.9%) |
| 75 Years and over | 0 (0.0%) | 40 (16.1%) |
| Total | 115 (7.2%) | 164 (12.0%) |
Income Above Poverty by Sex and Age in Valhalla
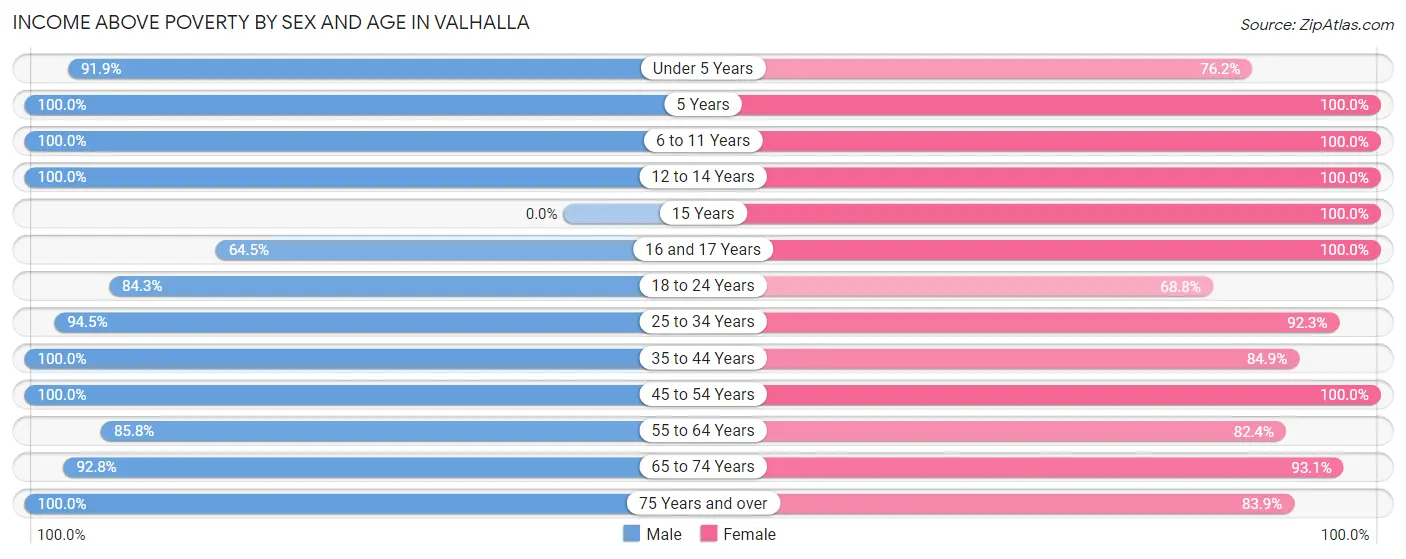
According to the poverty statistics in Valhalla, males aged 5 years and females aged 5 years are the age groups that are most secure financially, with 100.0% of males and 100.0% of females in these age groups living above the poverty line.
| Age Bracket | Male | Female |
| Under 5 Years | 114 (91.9%) | 32 (76.2%) |
| 5 Years | 5 (100.0%) | 8 (100.0%) |
| 6 to 11 Years | 68 (100.0%) | 47 (100.0%) |
| 12 to 14 Years | 60 (100.0%) | 16 (100.0%) |
| 15 Years | 0 (0.0%) | 38 (100.0%) |
| 16 and 17 Years | 20 (64.5%) | 7 (100.0%) |
| 18 to 24 Years | 156 (84.3%) | 64 (68.8%) |
| 25 to 34 Years | 223 (94.5%) | 193 (92.3%) |
| 35 to 44 Years | 159 (100.0%) | 84 (84.9%) |
| 45 to 54 Years | 113 (100.0%) | 171 (100.0%) |
| 55 to 64 Years | 236 (85.8%) | 211 (82.4%) |
| 65 to 74 Years | 167 (92.8%) | 122 (93.1%) |
| 75 Years and over | 160 (100.0%) | 209 (83.9%) |
| Total | 1,481 (92.8%) | 1,202 (88.0%) |
Income Below Poverty Among Married-Couple Families in Valhalla
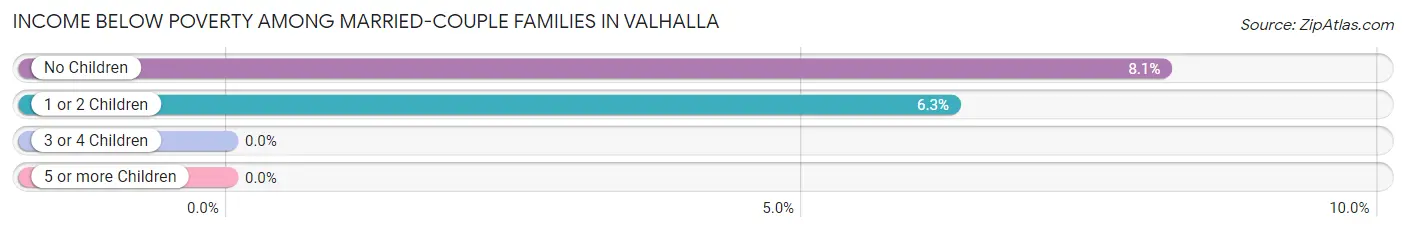
The poverty statistics for married-couple families in Valhalla show that 7.5% or 45 of the total 597 families live below the poverty line. Families with no children have the highest poverty rate of 8.1%, comprising of 34 families. On the other hand, families with 5 or more children have the lowest poverty rate of 0.0%, which includes 0 families.
| Children | Above Poverty | Below Poverty |
| No Children | 384 (91.9%) | 34 (8.1%) |
| 1 or 2 Children | 164 (93.7%) | 11 (6.3%) |
| 3 or 4 Children | 0 (0.0%) | 0 (0.0%) |
| 5 or more Children | 4 (100.0%) | 0 (0.0%) |
| Total | 552 (92.5%) | 45 (7.5%) |
Income Below Poverty Among Single-Parent Households in Valhalla
| Children | Single Father | Single Mother |
| No Children | 0 (0.0%) | 0 (0.0%) |
| 1 or 2 Children | 0 (0.0%) | 0 (0.0%) |
| 3 or 4 Children | 0 (0.0%) | 0 (0.0%) |
| 5 or more Children | 0 (0.0%) | 0 (0.0%) |
| Total | 0 (0.0%) | 0 (0.0%) |
Income Below Poverty Among Married-Couple vs Single-Parent Households in Valhalla

| Children | Married-Couple Families | Single-Parent Households |
| No Children | 34 (8.1%) | 0 (0.0%) |
| 1 or 2 Children | 11 (6.3%) | 0 (0.0%) |
| 3 or 4 Children | 0 (0.0%) | 0 (0.0%) |
| 5 or more Children | 0 (0.0%) | 0 (0.0%) |
| Total | 45 (7.5%) | 0 (0.0%) |
Race in Valhalla
The most populous races in Valhalla are White / Caucasian (2,408 | 78.9%), Hispanic or Latino (451 | 14.8%), and Asian (218 | 7.1%).
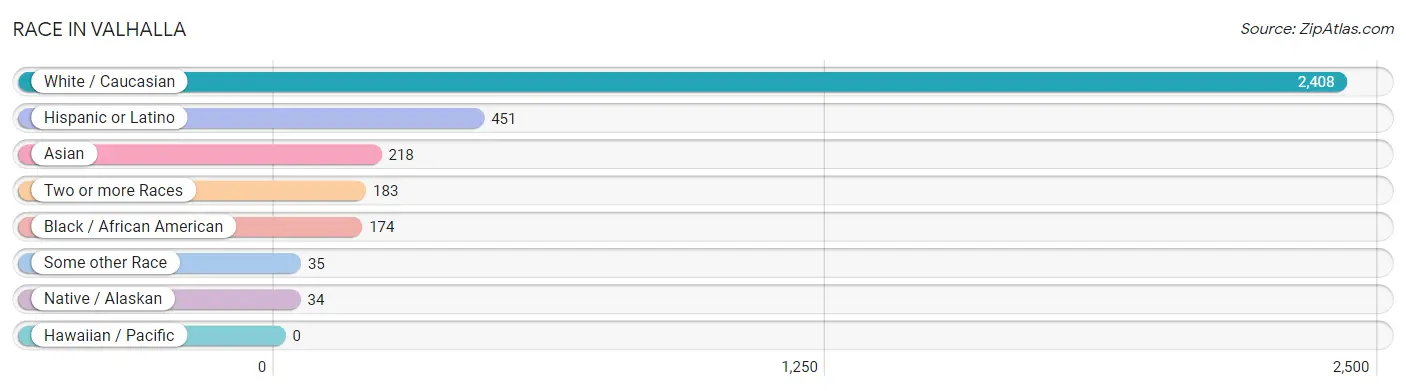
| Race | # Population | % Population |
| Asian | 218 | 7.1% |
| Black / African American | 174 | 5.7% |
| Hawaiian / Pacific | 0 | 0.0% |
| Hispanic or Latino | 451 | 14.8% |
| Native / Alaskan | 34 | 1.1% |
| White / Caucasian | 2,408 | 78.9% |
| Two or more Races | 183 | 6.0% |
| Some other Race | 35 | 1.1% |
| Total | 3,052 | 100.0% |
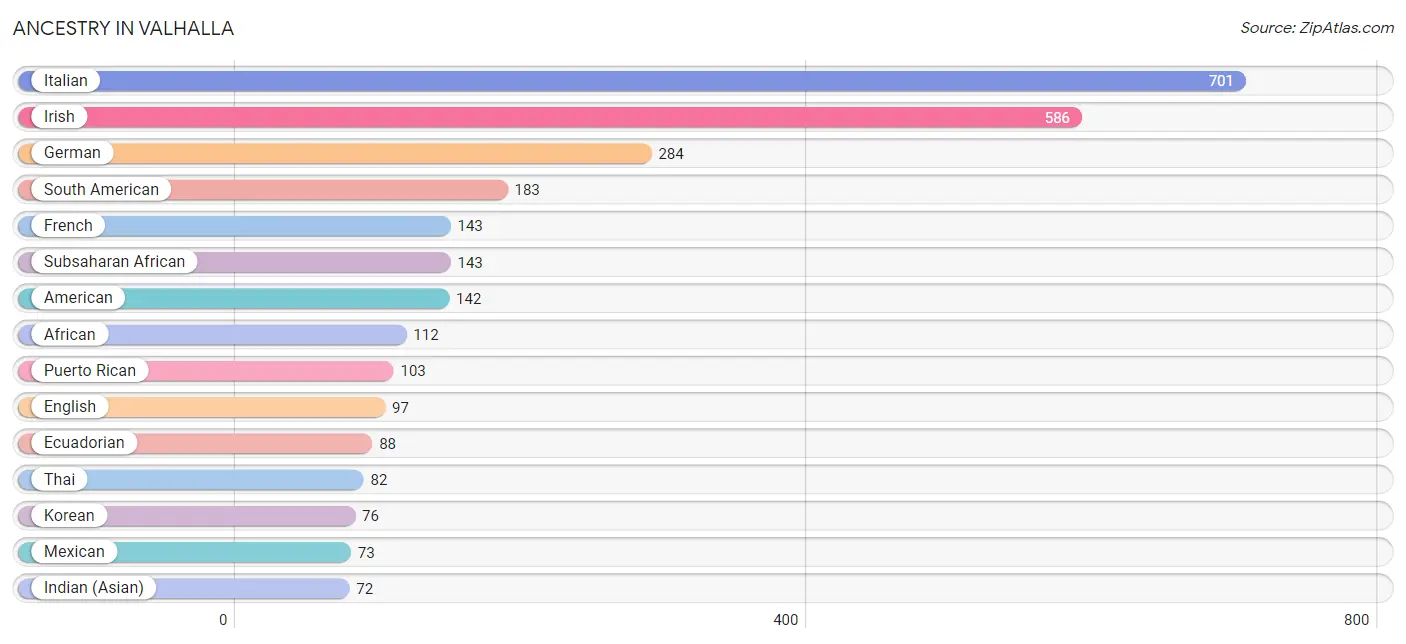
Ancestry in Valhalla
The most populous ancestries reported in Valhalla are Italian (701 | 23.0%), Irish (586 | 19.2%), German (284 | 9.3%), South American (183 | 6.0%), and French (143 | 4.7%), together accounting for 62.2% of all Valhalla residents.
| Ancestry | # Population | % Population |
| African | 112 | 3.7% |
| Albanian | 31 | 1.0% |
| American | 142 | 4.6% |
| British | 19 | 0.6% |
| Burmese | 15 | 0.5% |
| Central American | 2 | 0.1% |
| Colombian | 14 | 0.5% |
| Cuban | 16 | 0.5% |
| Czech | 19 | 0.6% |
| Danish | 52 | 1.7% |
| Dominican | 54 | 1.8% |
| Dutch | 8 | 0.3% |
| Eastern European | 35 | 1.1% |
| Ecuadorian | 88 | 2.9% |
| English | 97 | 3.2% |
| European | 52 | 1.7% |
| French | 143 | 4.7% |
| French Canadian | 9 | 0.3% |
| German | 284 | 9.3% |
| Greek | 10 | 0.3% |
| Guyanese | 3 | 0.1% |
| Indian (Asian) | 72 | 2.4% |
| Iranian | 59 | 1.9% |
| Irish | 586 | 19.2% |
| Italian | 701 | 23.0% |
| Korean | 76 | 2.5% |
| Lithuanian | 10 | 0.3% |
| Mexican | 73 | 2.4% |
| Norwegian | 10 | 0.3% |
| Peruvian | 40 | 1.3% |
| Polish | 63 | 2.1% |
| Puerto Rican | 103 | 3.4% |
| Russian | 33 | 1.1% |
| Salvadoran | 2 | 0.1% |
| Scotch-Irish | 25 | 0.8% |
| Slavic | 18 | 0.6% |
| South American | 183 | 6.0% |
| South American Indian | 31 | 1.0% |
| Spanish | 12 | 0.4% |
| Subsaharan African | 143 | 4.7% |
| Swedish | 14 | 0.5% |
| Swiss | 14 | 0.5% |
| Thai | 82 | 2.7% |
| Uruguayan | 41 | 1.3% | View All 44 Rows |
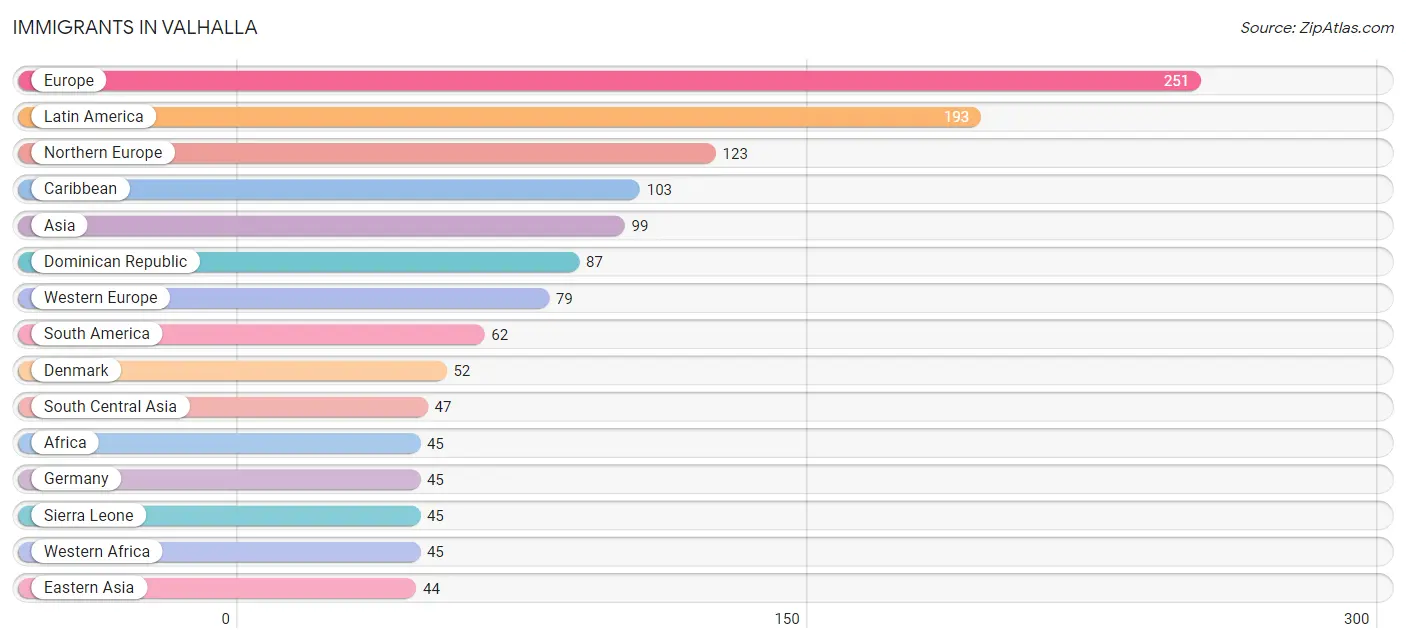
Immigrants in Valhalla
The most numerous immigrant groups reported in Valhalla came from Europe (251 | 8.2%), Latin America (193 | 6.3%), Northern Europe (123 | 4.0%), Caribbean (103 | 3.4%), and Asia (99 | 3.2%), together accounting for 25.2% of all Valhalla residents.
| Immigration Origin | # Population | % Population |
| Africa | 45 | 1.5% |
| Asia | 99 | 3.2% |
| Caribbean | 103 | 3.4% |
| Central America | 28 | 0.9% |
| China | 36 | 1.2% |
| Colombia | 12 | 0.4% |
| Denmark | 52 | 1.7% |
| Dominican Republic | 87 | 2.9% |
| Eastern Asia | 44 | 1.4% |
| Eastern Europe | 20 | 0.7% |
| England | 32 | 1.1% |
| Europe | 251 | 8.2% |
| France | 34 | 1.1% |
| Germany | 45 | 1.5% |
| Guyana | 3 | 0.1% |
| Hong Kong | 8 | 0.3% |
| India | 17 | 0.6% |
| Iran | 30 | 1.0% |
| Ireland | 10 | 0.3% |
| Italy | 29 | 0.9% |
| Jamaica | 16 | 0.5% |
| Korea | 8 | 0.3% |
| Latin America | 193 | 6.3% |
| Mexico | 28 | 0.9% |
| Northern Europe | 123 | 4.0% |
| Peru | 6 | 0.2% |
| Philippines | 8 | 0.3% |
| Sierra Leone | 45 | 1.5% |
| South America | 62 | 2.0% |
| South Central Asia | 47 | 1.5% |
| South Eastern Asia | 8 | 0.3% |
| Southern Europe | 29 | 0.9% |
| Uruguay | 41 | 1.3% |
| Western Africa | 45 | 1.5% |
| Western Europe | 79 | 2.6% | View All 35 Rows |
Sex and Age in Valhalla
Sex and Age in Valhalla
The most populous age groups in Valhalla are 55 to 59 Years (173 | 10.8%) for men and 60 to 64 Years (177 | 12.2%) for women.
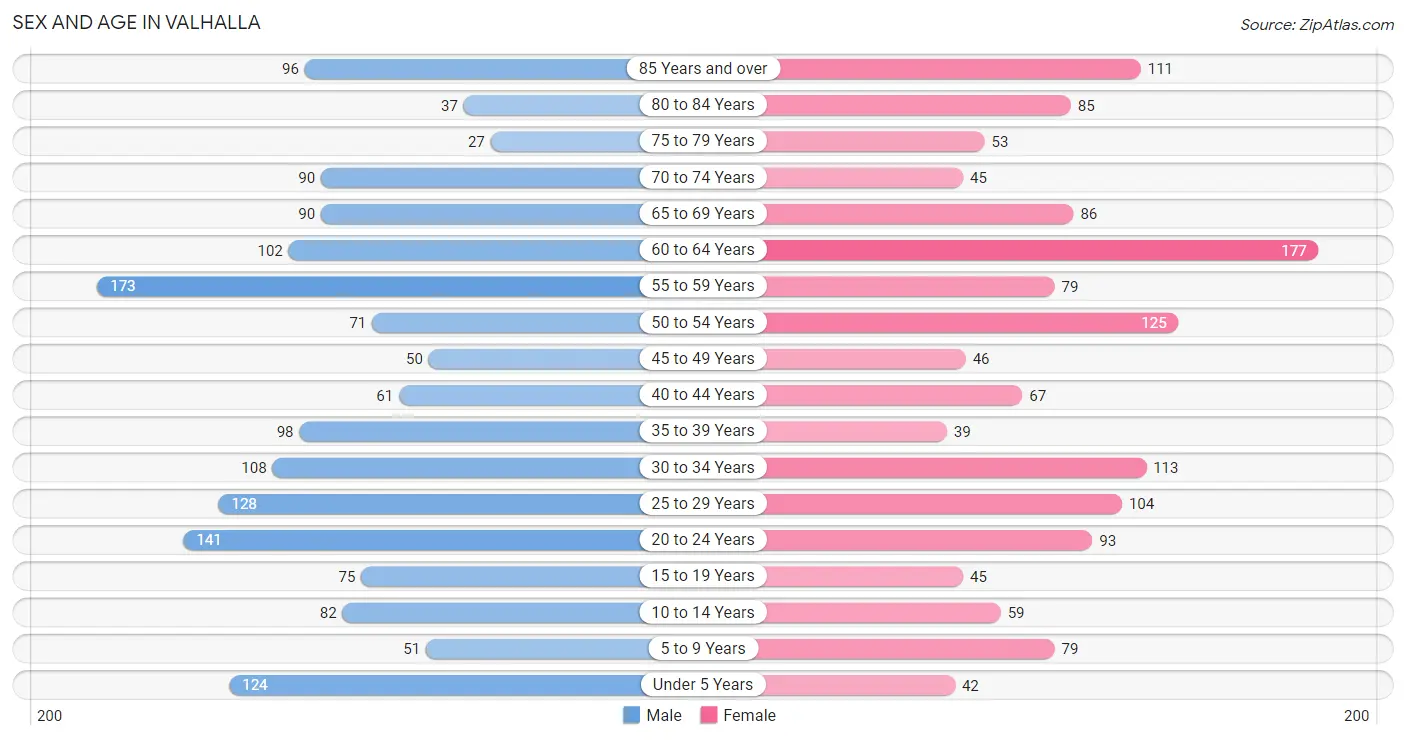
| Age Bracket | Male | Female |
| Under 5 Years | 124 (7.7%) | 42 (2.9%) |
| 5 to 9 Years | 51 (3.2%) | 79 (5.5%) |
| 10 to 14 Years | 82 (5.1%) | 59 (4.1%) |
| 15 to 19 Years | 75 (4.7%) | 45 (3.1%) |
| 20 to 24 Years | 141 (8.8%) | 93 (6.4%) |
| 25 to 29 Years | 128 (8.0%) | 104 (7.2%) |
| 30 to 34 Years | 108 (6.7%) | 113 (7.8%) |
| 35 to 39 Years | 98 (6.1%) | 39 (2.7%) |
| 40 to 44 Years | 61 (3.8%) | 67 (4.6%) |
| 45 to 49 Years | 50 (3.1%) | 46 (3.2%) |
| 50 to 54 Years | 71 (4.4%) | 125 (8.6%) |
| 55 to 59 Years | 173 (10.8%) | 79 (5.5%) |
| 60 to 64 Years | 102 (6.4%) | 177 (12.2%) |
| 65 to 69 Years | 90 (5.6%) | 86 (5.9%) |
| 70 to 74 Years | 90 (5.6%) | 45 (3.1%) |
| 75 to 79 Years | 27 (1.7%) | 53 (3.7%) |
| 80 to 84 Years | 37 (2.3%) | 85 (5.9%) |
| 85 Years and over | 96 (6.0%) | 111 (7.7%) |
| Total | 1,604 (100.0%) | 1,448 (100.0%) |
Families and Households in Valhalla
Median Family Size in Valhalla
The median family size in Valhalla is 3.19 persons per family, with married-couple families (597 | 77.6%) accounting for the largest median family size of 3.25 persons per family. On the other hand, single male/father families (84 | 10.9%) represent the smallest median family size with 2.85 persons per family.
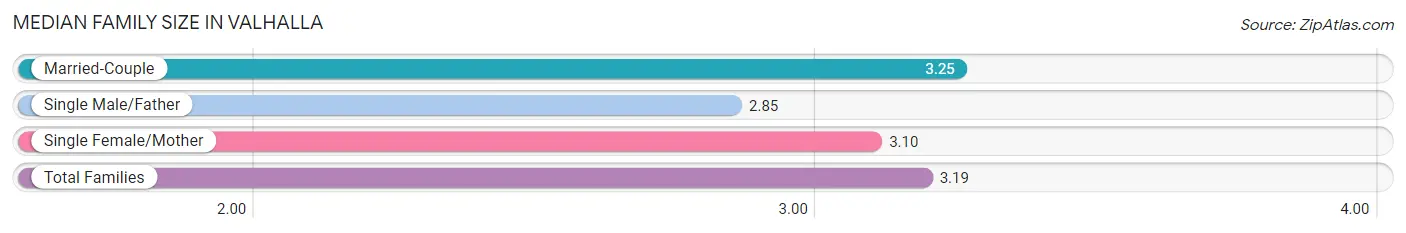
| Family Type | # Families | Family Size |
| Married-Couple | 597 (77.6%) | 3.25 |
| Single Male/Father | 84 (10.9%) | 2.85 |
| Single Female/Mother | 88 (11.4%) | 3.10 |
| Total Families | 769 (100.0%) | 3.19 |
Median Household Size in Valhalla
The median household size in Valhalla is 2.77 persons per household, with married-couple households (597 | 54.5%) accounting for the largest median household size of 3.46 persons per household. non-family households (326 | 29.8%) represent the smallest median household size with 1.33 persons per household.
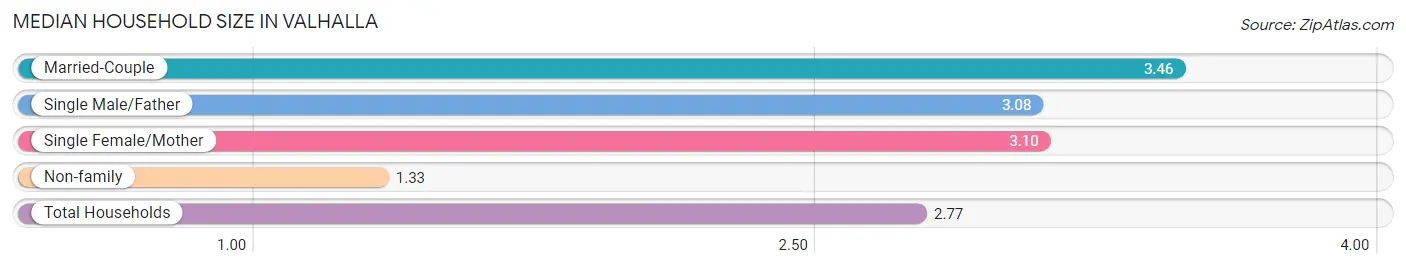
| Household Type | # Households | Household Size |
| Married-Couple | 597 (54.5%) | 3.46 |
| Single Male/Father | 84 (7.7%) | 3.08 |
| Single Female/Mother | 88 (8.0%) | 3.10 |
| Non-family | 326 (29.8%) | 1.33 |
| Total Households | 1,095 (100.0%) | 2.77 |
Household Size by Marriage Status in Valhalla
Out of a total of 1,095 households in Valhalla, 769 (70.2%) are family households, while 326 (29.8%) are nonfamily households. The most numerous type of family households are 2-person households, comprising 322, and the most common type of nonfamily households are 1-person households, comprising 294.
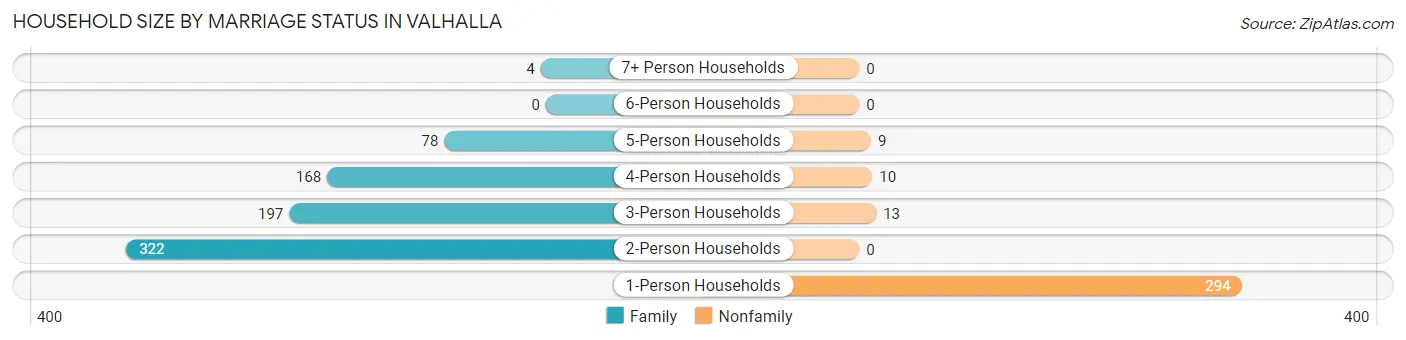
| Household Size | Family Households | Nonfamily Households |
| 1-Person Households | - | 294 (26.9%) |
| 2-Person Households | 322 (29.4%) | 0 (0.0%) |
| 3-Person Households | 197 (18.0%) | 13 (1.2%) |
| 4-Person Households | 168 (15.3%) | 10 (0.9%) |
| 5-Person Households | 78 (7.1%) | 9 (0.8%) |
| 6-Person Households | 0 (0.0%) | 0 (0.0%) |
| 7+ Person Households | 4 (0.4%) | 0 (0.0%) |
| Total | 769 (70.2%) | 326 (29.8%) |
Female Fertility in Valhalla
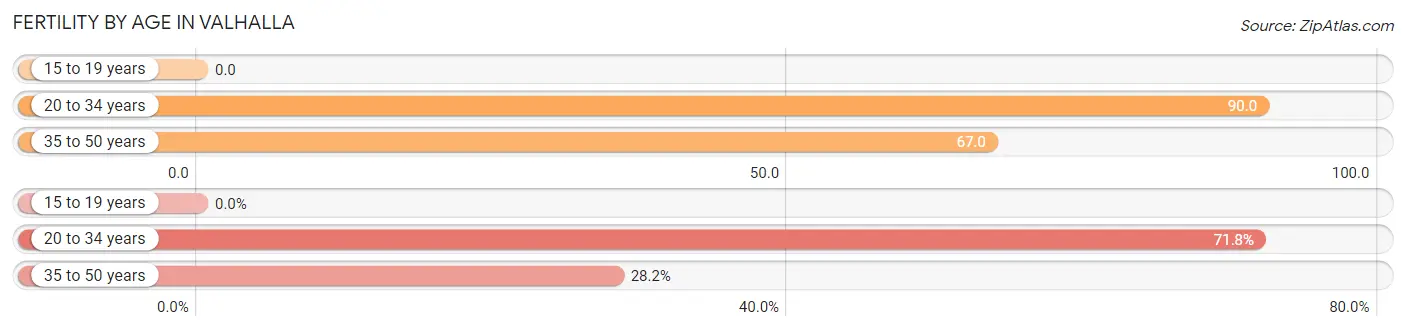
Fertility by Age in Valhalla
Average fertility rate in Valhalla is 75.0 births per 1,000 women. Women in the age bracket of 20 to 34 years have the highest fertility rate with 90.0 births per 1,000 women. Women in the age bracket of 20 to 34 years acount for 71.8% of all women with births.
| Age Bracket | Women with Births | Births / 1,000 Women |
| 15 to 19 years | 0 (0.0%) | 0.0 |
| 20 to 34 years | 28 (71.8%) | 90.0 |
| 35 to 50 years | 11 (28.2%) | 67.0 |
| Total | 39 (100.0%) | 75.0 |
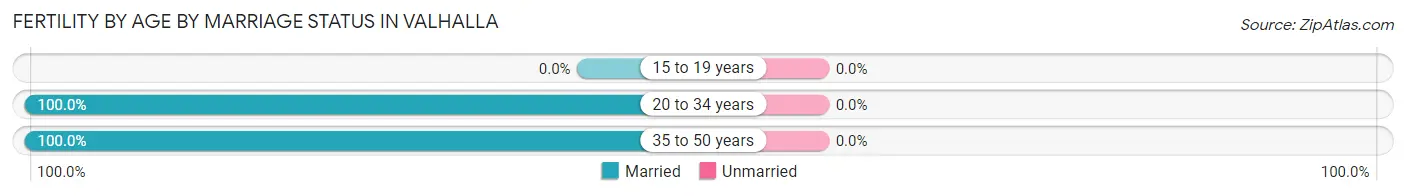
Fertility by Age by Marriage Status in Valhalla
| Age Bracket | Married | Unmarried |
| 15 to 19 years | 0 (0.0%) | 0 (0.0%) |
| 20 to 34 years | 28 (100.0%) | 0 (0.0%) |
| 35 to 50 years | 11 (100.0%) | 0 (0.0%) |
| Total | 39 (100.0%) | 0 (0.0%) |
Fertility by Education in Valhalla
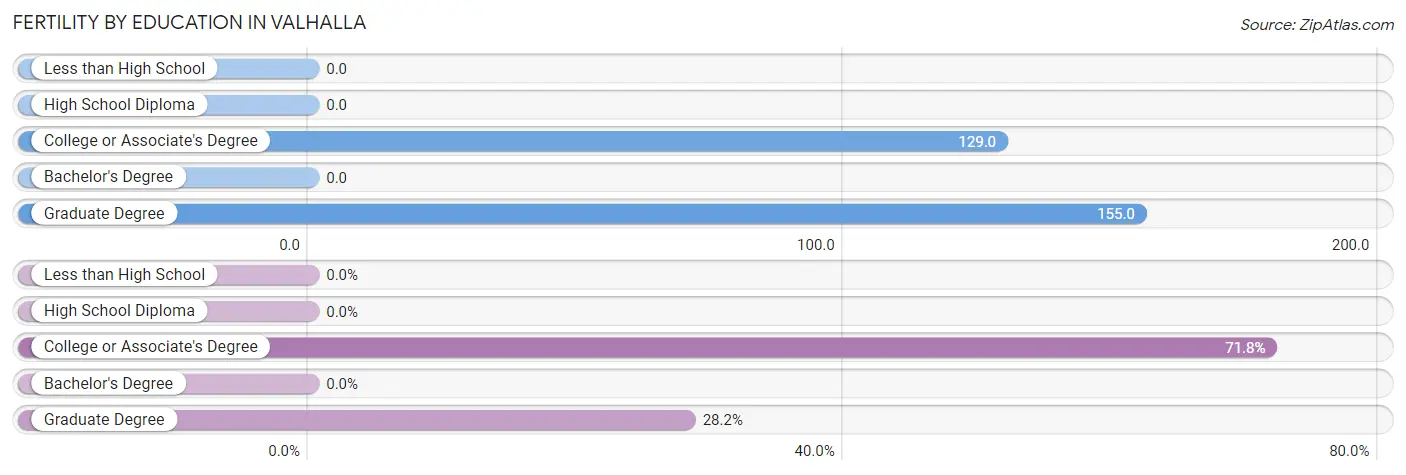
| Educational Attainment | Women with Births | Births / 1,000 Women |
| Less than High School | 0 (0.0%) | 0.0 |
| High School Diploma | 0 (0.0%) | 0.0 |
| College or Associate's Degree | 28 (71.8%) | 129.0 |
| Bachelor's Degree | 0 (0.0%) | 0.0 |
| Graduate Degree | 11 (28.2%) | 155.0 |
| Total | 39 (100.0%) | 75.0 |
Fertility by Education by Marriage Status in Valhalla
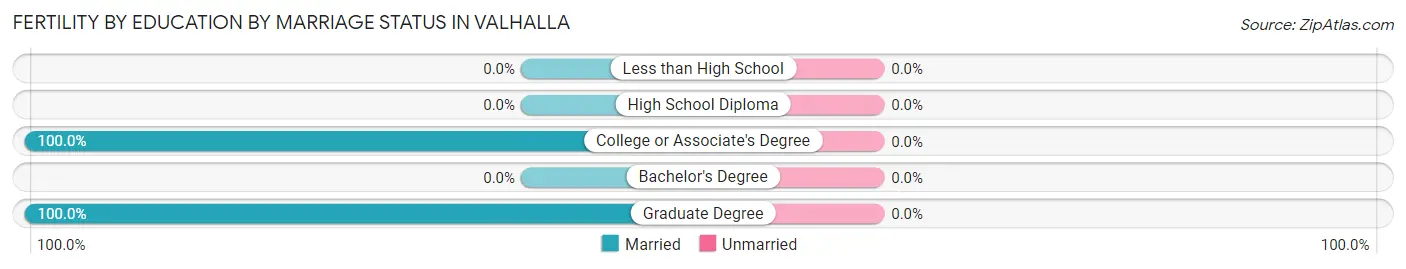
| Educational Attainment | Married | Unmarried |
| Less than High School | 0 (0.0%) | 0 (0.0%) |
| High School Diploma | 0 (0.0%) | 0 (0.0%) |
| College or Associate's Degree | 28 (100.0%) | 0 (0.0%) |
| Bachelor's Degree | 0 (0.0%) | 0 (0.0%) |
| Graduate Degree | 11 (100.0%) | 0 (0.0%) |
| Total | 39 (100.0%) | 0 (0.0%) |
Employment Characteristics in Valhalla
Employment by Class of Employer in Valhalla
Among the 1,407 employed individuals in Valhalla, private company employees (711 | 50.5%), local government employees (227 | 16.1%), and not-for-profit organizations (204 | 14.5%) make up the most common classes of employment.

| Employer Class | # Employees | % Employees |
| Private Company Employees | 711 | 50.5% |
| Self-Employed (Incorporated) | 32 | 2.3% |
| Self-Employed (Not Incorporated) | 163 | 11.6% |
| Not-for-profit Organizations | 204 | 14.5% |
| Local Government Employees | 227 | 16.1% |
| State Government Employees | 47 | 3.3% |
| Federal Government Employees | 23 | 1.6% |
| Unpaid Family Workers | 0 | 0.0% |
| Total | 1,407 | 100.0% |
Employment Status by Age in Valhalla
According to the labor force statistics for Valhalla, out of the total population over 16 years of age (2,577), 59.6% or 1,536 individuals are in the labor force, with 4.4% or 68 of them unemployed. The age group with the highest labor force participation rate is 45 to 54 years, with 93.2% or 272 individuals in the labor force. Within the labor force, the 65 to 74 years age range has the highest percentage of unemployed individuals, with 15.3% or 9 of them being unemployed.
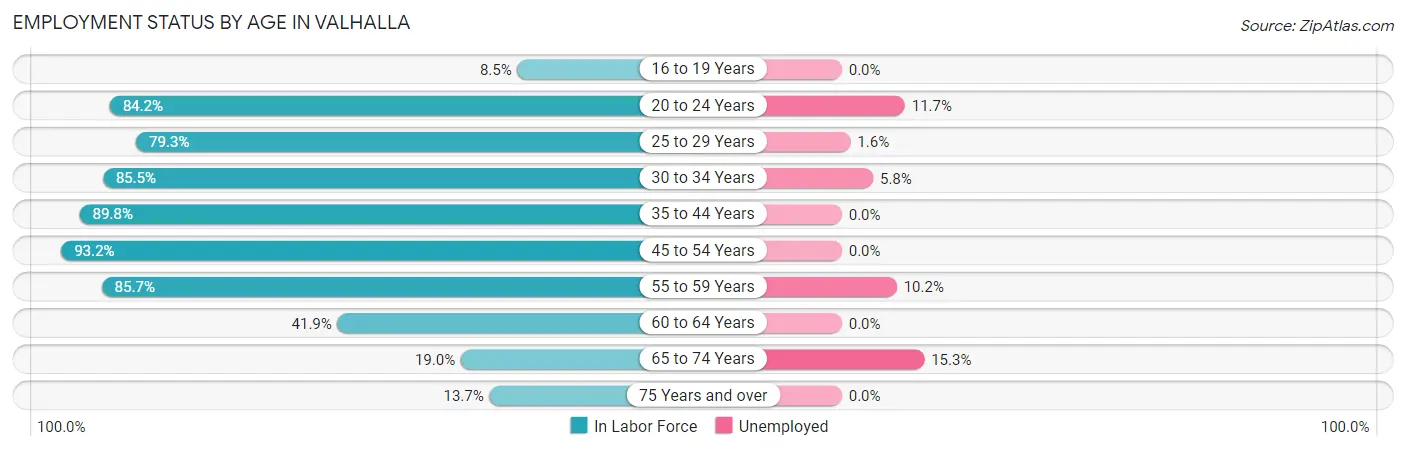
| Age Bracket | In Labor Force | Unemployed |
| 16 to 19 Years | 7 (8.5%) | 0 (0.0%) |
| 20 to 24 Years | 197 (84.2%) | 23 (11.7%) |
| 25 to 29 Years | 184 (79.3%) | 3 (1.6%) |
| 30 to 34 Years | 189 (85.5%) | 11 (5.8%) |
| 35 to 44 Years | 238 (89.8%) | 0 (0.0%) |
| 45 to 54 Years | 272 (93.2%) | 0 (0.0%) |
| 55 to 59 Years | 216 (85.7%) | 22 (10.2%) |
| 60 to 64 Years | 117 (41.9%) | 0 (0.0%) |
| 65 to 74 Years | 59 (19.0%) | 9 (15.3%) |
| 75 Years and over | 56 (13.7%) | 0 (0.0%) |
| Total | 1,536 (59.6%) | 68 (4.4%) |
Employment Status by Educational Attainment in Valhalla
According to labor force statistics for Valhalla, 78.9% of individuals (1,216) out of the total population between 25 and 64 years of age (1,541) are in the labor force, with 3.0% or 36 of them being unemployed. The group with the highest labor force participation rate are those with the educational attainment of college / associate degree, with 86.4% or 369 individuals in the labor force. Within the labor force, individuals with high school diploma education have the highest percentage of unemployment, with 3.6% or 4 of them being unemployed.
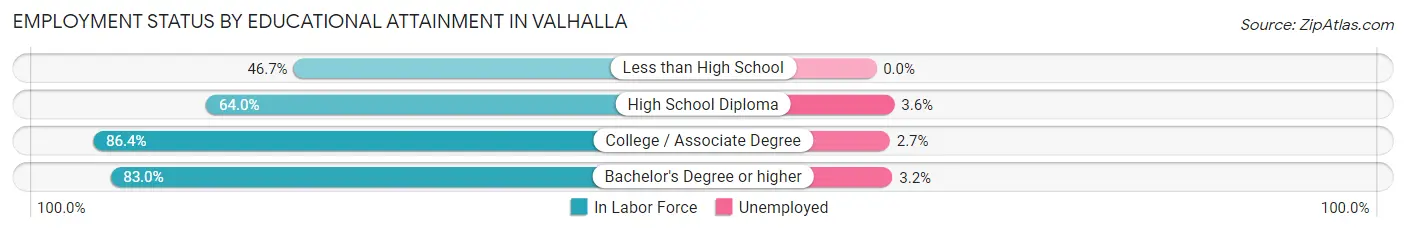
| Educational Attainment | In Labor Force | Unemployed |
| Less than High School | 57 (46.7%) | 0 (0.0%) |
| High School Diploma | 112 (64.0%) | 6 (3.6%) |
| College / Associate Degree | 369 (86.4%) | 12 (2.7%) |
| Bachelor's Degree or higher | 678 (83.0%) | 26 (3.2%) |
| Total | 1,216 (78.9%) | 46 (3.0%) |
Employment Occupations by Sex in Valhalla
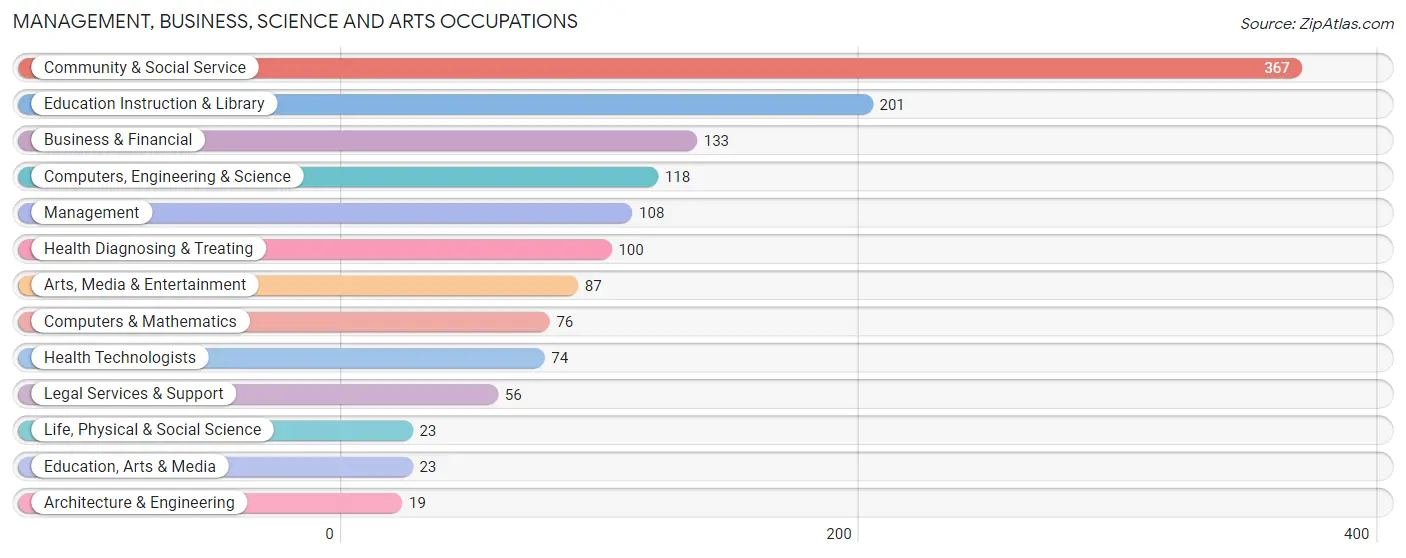
Management, Business, Science and Arts Occupations
The most common Management, Business, Science and Arts occupations in Valhalla are Community & Social Service (367 | 25.0%), Education Instruction & Library (201 | 13.7%), Business & Financial (133 | 9.1%), Computers, Engineering & Science (118 | 8.0%), and Management (108 | 7.4%).
Management, Business, Science and Arts Occupations by Sex
Within the Management, Business, Science and Arts occupations in Valhalla, the most male-oriented occupations are Computers, Engineering & Science (100.0%), Computers & Mathematics (100.0%), and Architecture & Engineering (100.0%), while the most female-oriented occupations are Education, Arts & Media (100.0%), Health Technologists (100.0%), and Health Diagnosing & Treating (89.0%).
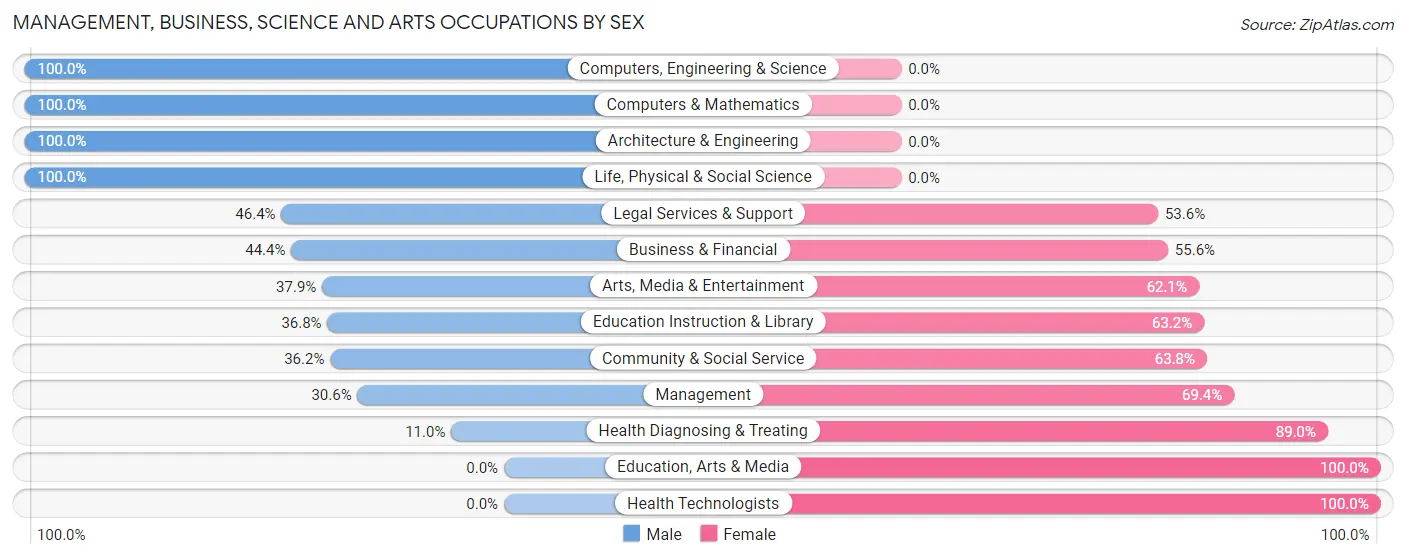
| Occupation | Male | Female |
| Management | 33 (30.6%) | 75 (69.4%) |
| Business & Financial | 59 (44.4%) | 74 (55.6%) |
| Computers, Engineering & Science | 118 (100.0%) | 0 (0.0%) |
| Computers & Mathematics | 76 (100.0%) | 0 (0.0%) |
| Architecture & Engineering | 19 (100.0%) | 0 (0.0%) |
| Life, Physical & Social Science | 23 (100.0%) | 0 (0.0%) |
| Community & Social Service | 133 (36.2%) | 234 (63.8%) |
| Education, Arts & Media | 0 (0.0%) | 23 (100.0%) |
| Legal Services & Support | 26 (46.4%) | 30 (53.6%) |
| Education Instruction & Library | 74 (36.8%) | 127 (63.2%) |
| Arts, Media & Entertainment | 33 (37.9%) | 54 (62.1%) |
| Health Diagnosing & Treating | 11 (11.0%) | 89 (89.0%) |
| Health Technologists | 0 (0.0%) | 74 (100.0%) |
| Total (Category) | 354 (42.9%) | 472 (57.1%) |
| Total (Overall) | 760 (51.8%) | 707 (48.2%) |
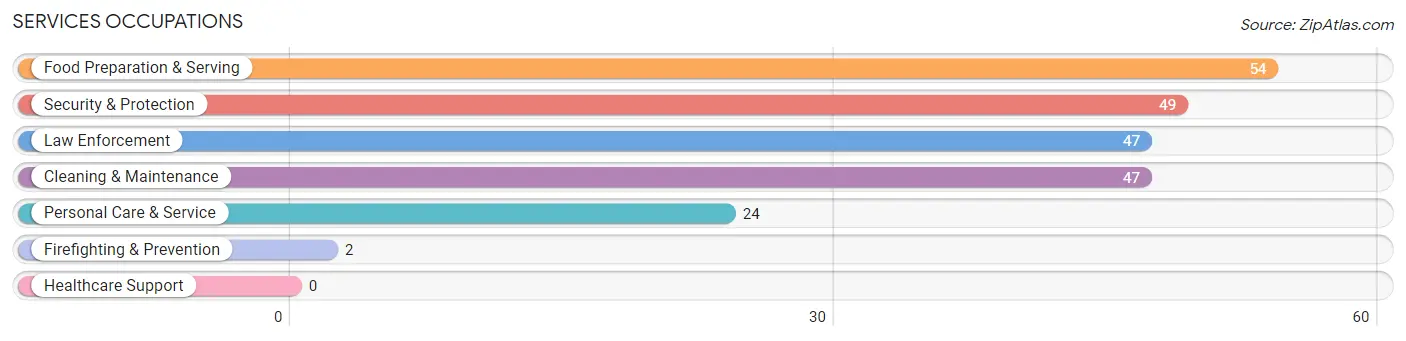
Services Occupations
The most common Services occupations in Valhalla are Food Preparation & Serving (54 | 3.7%), Security & Protection (49 | 3.3%), Law Enforcement (47 | 3.2%), Cleaning & Maintenance (47 | 3.2%), and Personal Care & Service (24 | 1.6%).
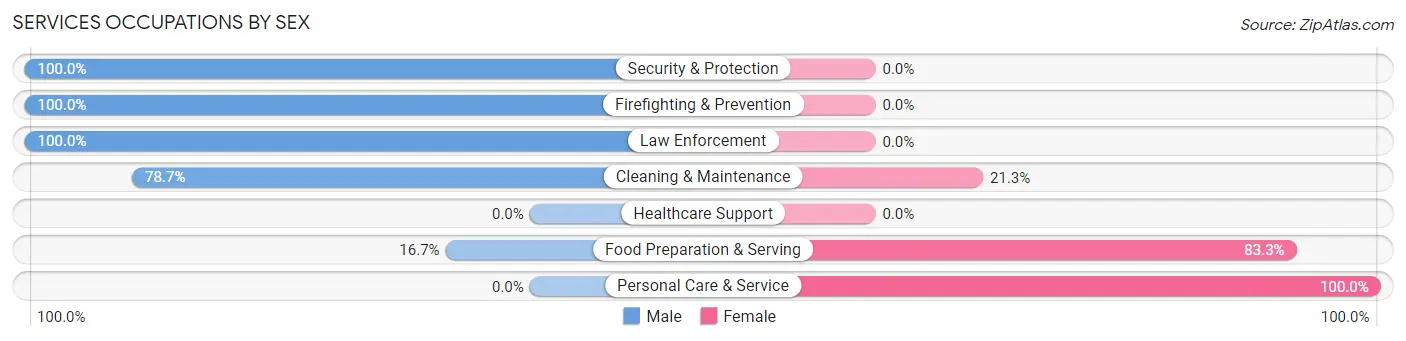
Services Occupations by Sex
Within the Services occupations in Valhalla, the most male-oriented occupations are Security & Protection (100.0%), Firefighting & Prevention (100.0%), and Law Enforcement (100.0%), while the most female-oriented occupations are Personal Care & Service (100.0%), Food Preparation & Serving (83.3%), and Cleaning & Maintenance (21.3%).
| Occupation | Male | Female |
| Healthcare Support | 0 (0.0%) | 0 (0.0%) |
| Security & Protection | 49 (100.0%) | 0 (0.0%) |
| Firefighting & Prevention | 2 (100.0%) | 0 (0.0%) |
| Law Enforcement | 47 (100.0%) | 0 (0.0%) |
| Food Preparation & Serving | 9 (16.7%) | 45 (83.3%) |
| Cleaning & Maintenance | 37 (78.7%) | 10 (21.3%) |
| Personal Care & Service | 0 (0.0%) | 24 (100.0%) |
| Total (Category) | 95 (54.6%) | 79 (45.4%) |
| Total (Overall) | 760 (51.8%) | 707 (48.2%) |
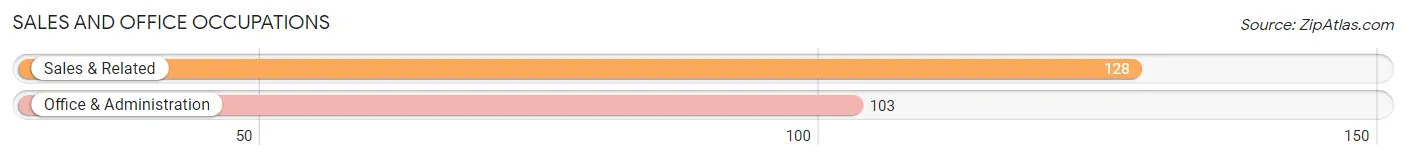
Sales and Office Occupations
The most common Sales and Office occupations in Valhalla are Sales & Related (128 | 8.7%), and Office & Administration (103 | 7.0%).
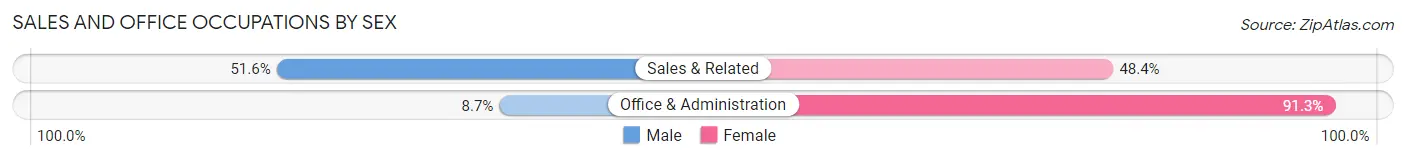
Sales and Office Occupations by Sex
| Occupation | Male | Female |
| Sales & Related | 66 (51.6%) | 62 (48.4%) |
| Office & Administration | 9 (8.7%) | 94 (91.3%) |
| Total (Category) | 75 (32.5%) | 156 (67.5%) |
| Total (Overall) | 760 (51.8%) | 707 (48.2%) |
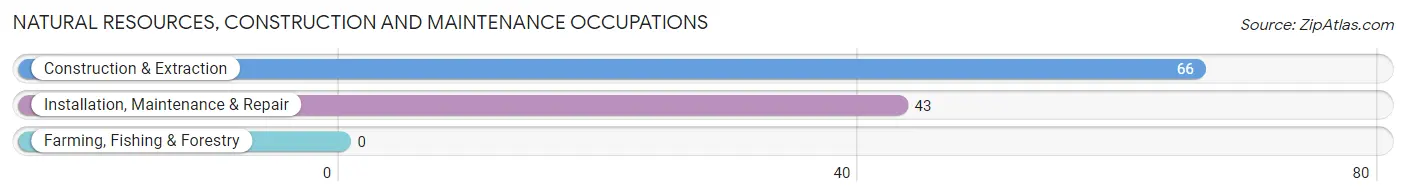
Natural Resources, Construction and Maintenance Occupations
The most common Natural Resources, Construction and Maintenance occupations in Valhalla are Construction & Extraction (66 | 4.5%), and Installation, Maintenance & Repair (43 | 2.9%).
Natural Resources, Construction and Maintenance Occupations by Sex
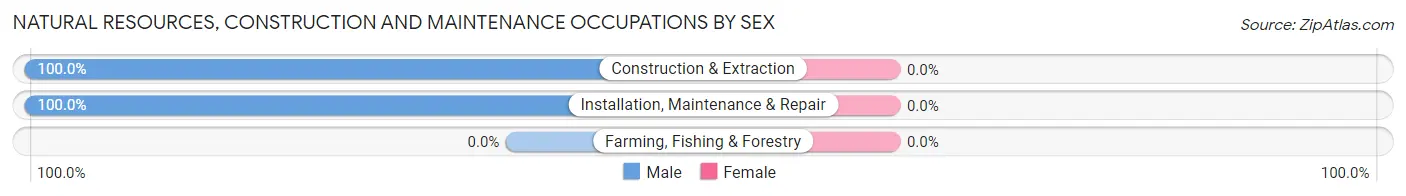
| Occupation | Male | Female |
| Farming, Fishing & Forestry | 0 (0.0%) | 0 (0.0%) |
| Construction & Extraction | 66 (100.0%) | 0 (0.0%) |
| Installation, Maintenance & Repair | 43 (100.0%) | 0 (0.0%) |
| Total (Category) | 109 (100.0%) | 0 (0.0%) |
| Total (Overall) | 760 (51.8%) | 707 (48.2%) |
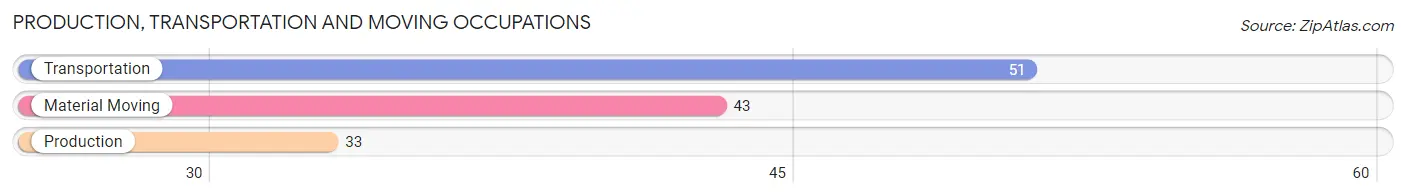
Production, Transportation and Moving Occupations
The most common Production, Transportation and Moving occupations in Valhalla are Transportation (51 | 3.5%), Material Moving (43 | 2.9%), and Production (33 | 2.2%).
Production, Transportation and Moving Occupations by Sex
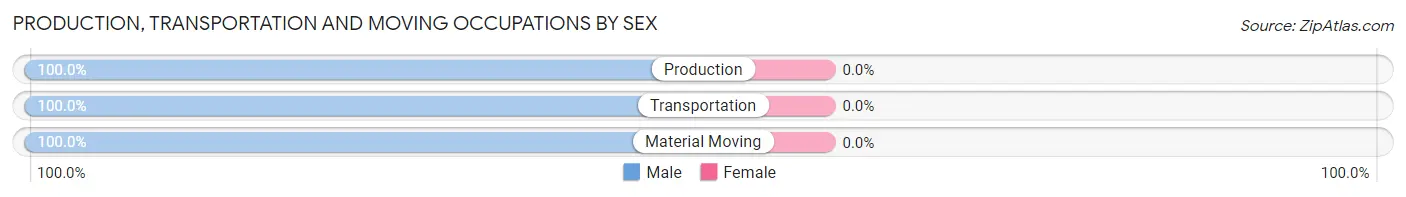
| Occupation | Male | Female |
| Production | 33 (100.0%) | 0 (0.0%) |
| Transportation | 51 (100.0%) | 0 (0.0%) |
| Material Moving | 43 (100.0%) | 0 (0.0%) |
| Total (Category) | 127 (100.0%) | 0 (0.0%) |
| Total (Overall) | 760 (51.8%) | 707 (48.2%) |
Employment Industries by Sex in Valhalla
Employment Industries in Valhalla
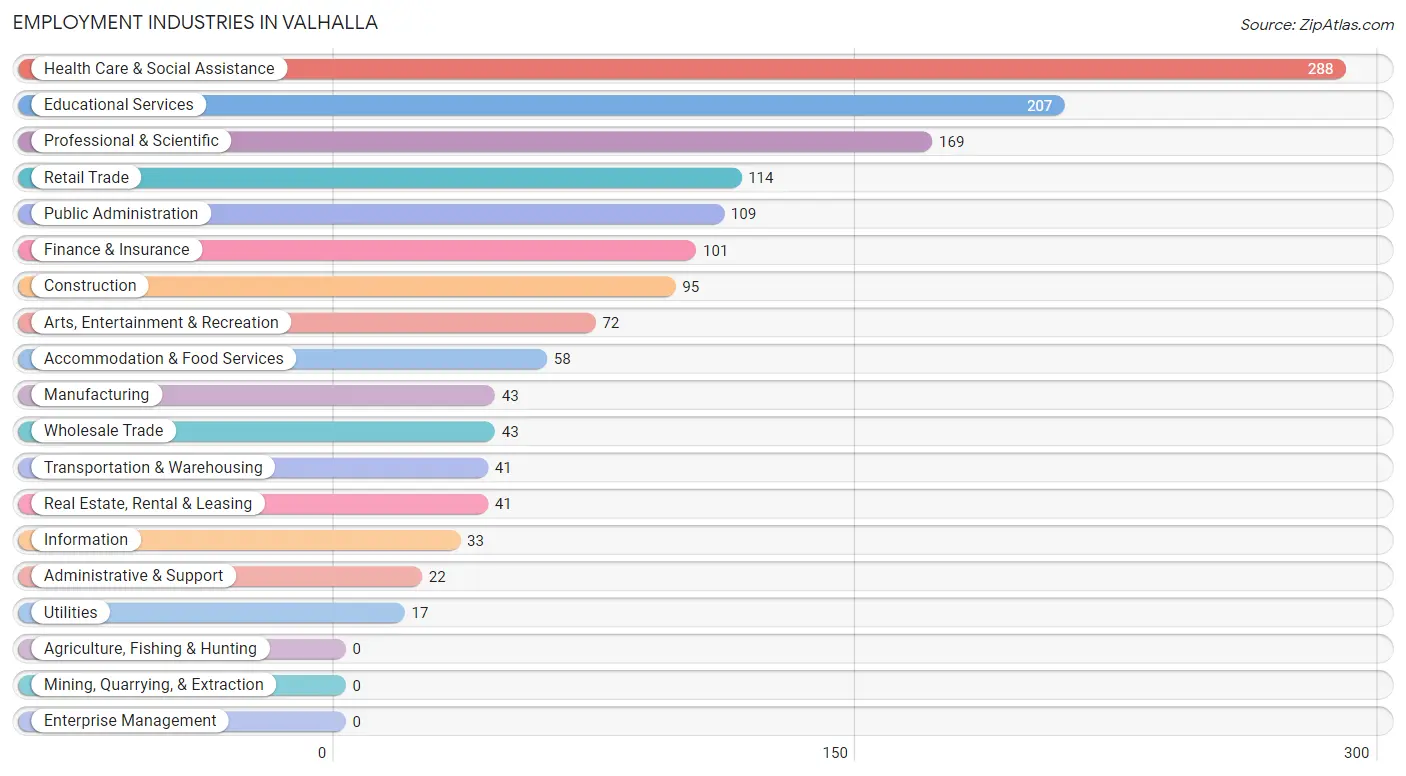
The major employment industries in Valhalla include Health Care & Social Assistance (288 | 19.6%), Educational Services (207 | 14.1%), Professional & Scientific (169 | 11.5%), Retail Trade (114 | 7.8%), and Public Administration (109 | 7.4%).
Employment Industries by Sex in Valhalla
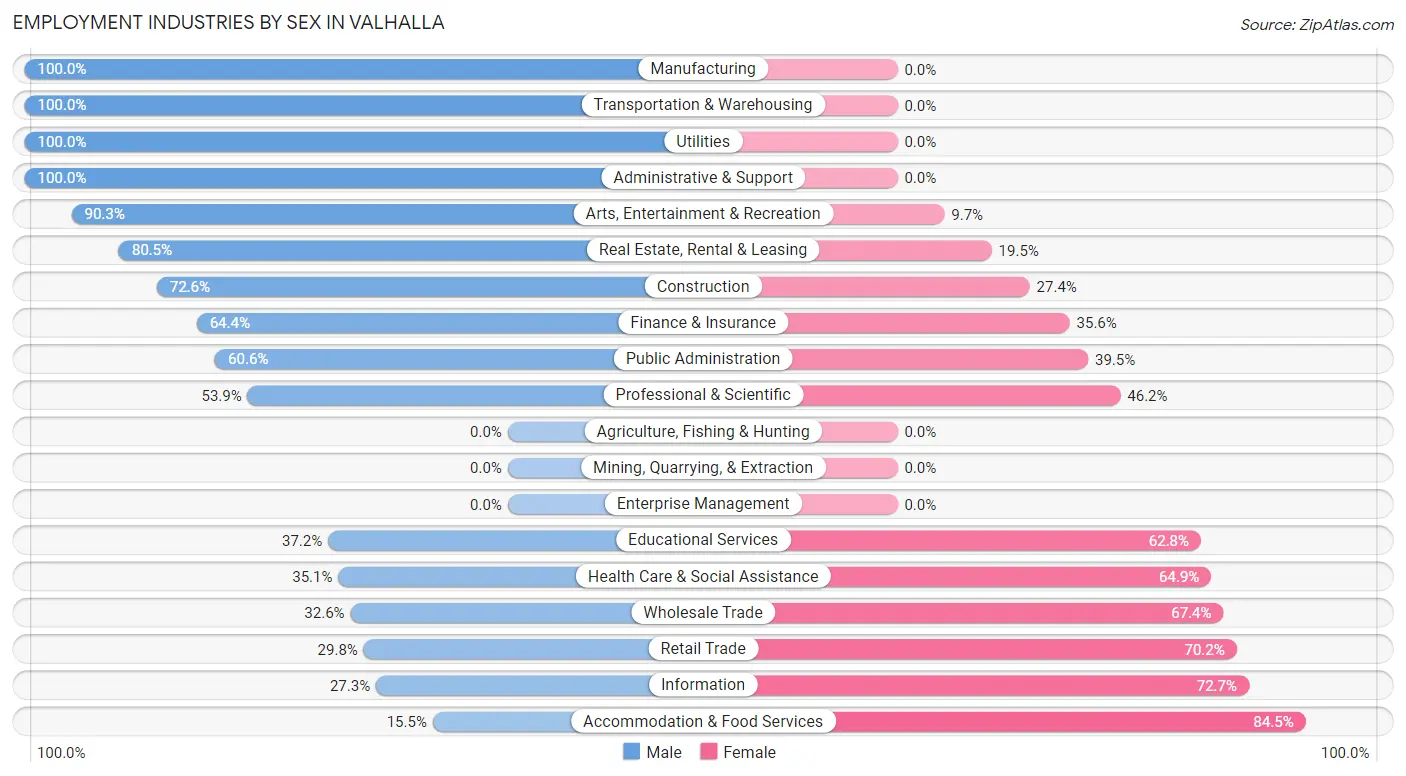
The Valhalla industries that see more men than women are Manufacturing (100.0%), Transportation & Warehousing (100.0%), and Utilities (100.0%), whereas the industries that tend to have a higher number of women are Accommodation & Food Services (84.5%), Information (72.7%), and Retail Trade (70.2%).
| Industry | Male | Female |
| Agriculture, Fishing & Hunting | 0 (0.0%) | 0 (0.0%) |
| Mining, Quarrying, & Extraction | 0 (0.0%) | 0 (0.0%) |
| Construction | 69 (72.6%) | 26 (27.4%) |
| Manufacturing | 43 (100.0%) | 0 (0.0%) |
| Wholesale Trade | 14 (32.6%) | 29 (67.4%) |
| Retail Trade | 34 (29.8%) | 80 (70.2%) |
| Transportation & Warehousing | 41 (100.0%) | 0 (0.0%) |
| Utilities | 17 (100.0%) | 0 (0.0%) |
| Information | 9 (27.3%) | 24 (72.7%) |
| Finance & Insurance | 65 (64.4%) | 36 (35.6%) |
| Real Estate, Rental & Leasing | 33 (80.5%) | 8 (19.5%) |
| Professional & Scientific | 91 (53.8%) | 78 (46.2%) |
| Enterprise Management | 0 (0.0%) | 0 (0.0%) |
| Administrative & Support | 22 (100.0%) | 0 (0.0%) |
| Educational Services | 77 (37.2%) | 130 (62.8%) |
| Health Care & Social Assistance | 101 (35.1%) | 187 (64.9%) |
| Arts, Entertainment & Recreation | 65 (90.3%) | 7 (9.7%) |
| Accommodation & Food Services | 9 (15.5%) | 49 (84.5%) |
| Public Administration | 66 (60.6%) | 43 (39.5%) |
| Total | 760 (51.8%) | 707 (48.2%) |
Education in Valhalla
School Enrollment in Valhalla
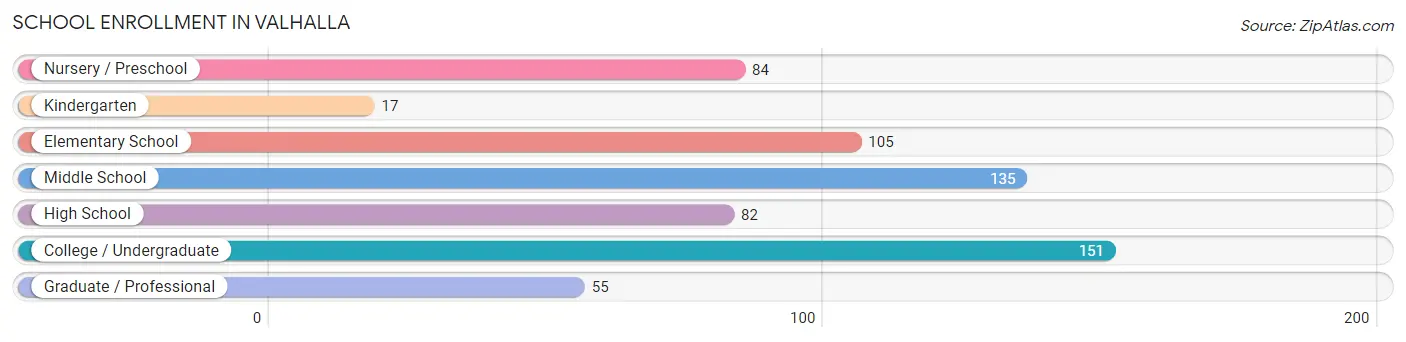
The most common levels of schooling among the 629 students in Valhalla are college / undergraduate (151 | 24.0%), middle school (135 | 21.5%), and elementary school (105 | 16.7%).
| School Level | # Students | % Students |
| Nursery / Preschool | 84 | 13.4% |
| Kindergarten | 17 | 2.7% |
| Elementary School | 105 | 16.7% |
| Middle School | 135 | 21.5% |
| High School | 82 | 13.0% |
| College / Undergraduate | 151 | 24.0% |
| Graduate / Professional | 55 | 8.7% |
| Total | 629 | 100.0% |
School Enrollment by Age by Funding Source in Valhalla
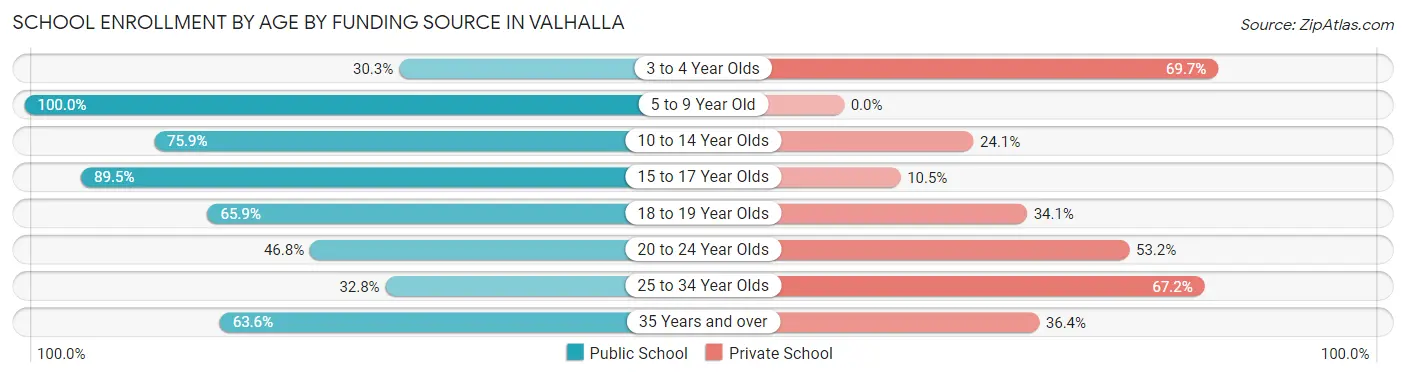
Out of a total of 629 students who are enrolled in schools in Valhalla, 201 (32.0%) attend a private institution, while the remaining 428 (68.0%) are enrolled in public schools. The age group of 3 to 4 year olds has the highest likelihood of being enrolled in private schools, with 53 (69.7% in the age bracket) enrolled. Conversely, the age group of 5 to 9 year old has the lowest likelihood of being enrolled in a private school, with 130 (100.0% in the age bracket) attending a public institution.
| Age Bracket | Public School | Private School |
| 3 to 4 Year Olds | 23 (30.3%) | 53 (69.7%) |
| 5 to 9 Year Old | 130 (100.0%) | 0 (0.0%) |
| 10 to 14 Year Olds | 107 (75.9%) | 34 (24.1%) |
| 15 to 17 Year Olds | 68 (89.5%) | 8 (10.5%) |
| 18 to 19 Year Olds | 29 (65.9%) | 15 (34.1%) |
| 20 to 24 Year Olds | 37 (46.8%) | 42 (53.2%) |
| 25 to 34 Year Olds | 20 (32.8%) | 41 (67.2%) |
| 35 Years and over | 14 (63.6%) | 8 (36.4%) |
| Total | 428 (68.0%) | 201 (32.0%) |
Educational Attainment by Field of Study in Valhalla
Business (274 | 25.0%), psychology (105 | 9.6%), literature & languages (102 | 9.3%), social sciences (81 | 7.4%), and communications (69 | 6.3%) are the most common fields of study among 1,095 individuals in Valhalla who have obtained a bachelor's degree or higher.
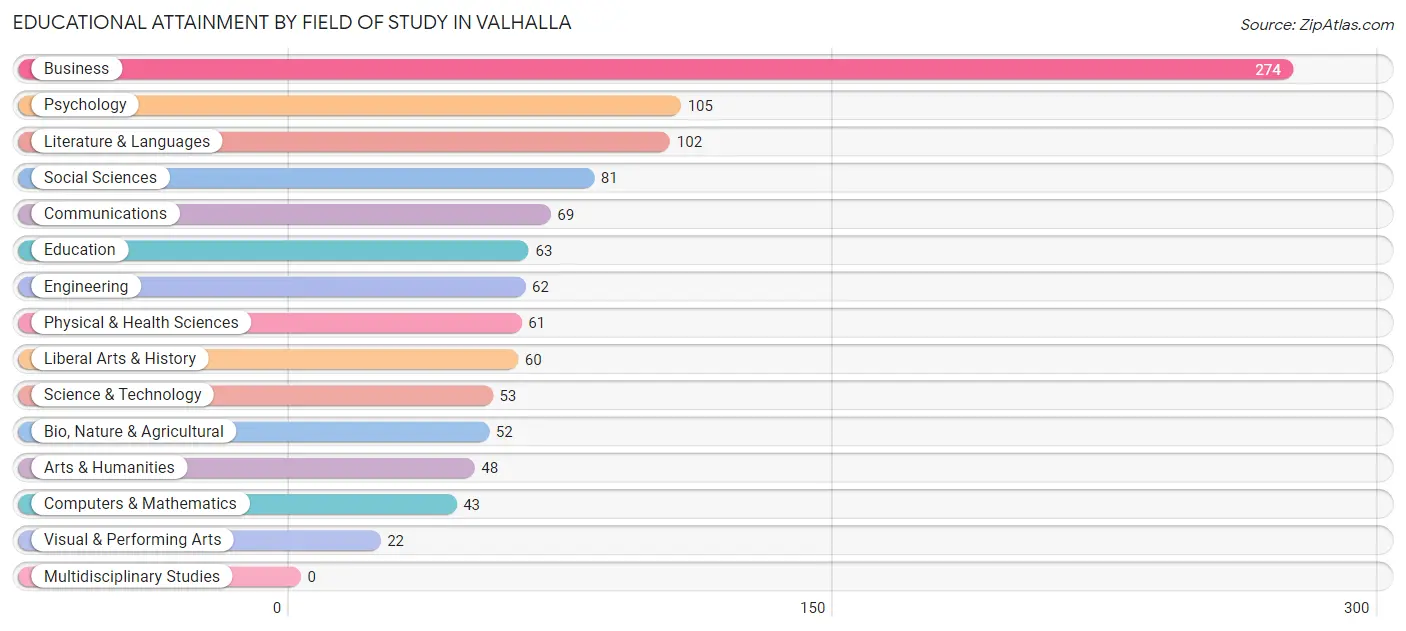
| Field of Study | # Graduates | % Graduates |
| Computers & Mathematics | 43 | 3.9% |
| Bio, Nature & Agricultural | 52 | 4.8% |
| Physical & Health Sciences | 61 | 5.6% |
| Psychology | 105 | 9.6% |
| Social Sciences | 81 | 7.4% |
| Engineering | 62 | 5.7% |
| Multidisciplinary Studies | 0 | 0.0% |
| Science & Technology | 53 | 4.8% |
| Business | 274 | 25.0% |
| Education | 63 | 5.8% |
| Literature & Languages | 102 | 9.3% |
| Liberal Arts & History | 60 | 5.5% |
| Visual & Performing Arts | 22 | 2.0% |
| Communications | 69 | 6.3% |
| Arts & Humanities | 48 | 4.4% |
| Total | 1,095 | 100.0% |
Transportation & Commute in Valhalla
Vehicle Availability by Sex in Valhalla
The most prevalent vehicle ownership categories in Valhalla are males with 2 vehicles (198, accounting for 26.1%) and females with 2 vehicles (152, making up 30.6%).
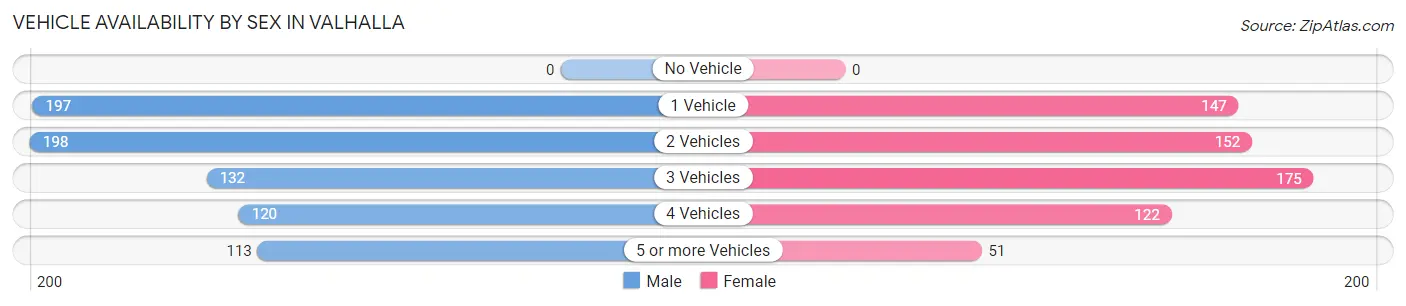
| Vehicles Available | Male | Female |
| No Vehicle | 0 (0.0%) | 0 (0.0%) |
| 1 Vehicle | 197 (25.9%) | 147 (22.7%) |
| 2 Vehicles | 198 (26.1%) | 152 (23.5%) |
| 3 Vehicles | 132 (17.4%) | 175 (27.1%) |
| 4 Vehicles | 120 (15.8%) | 122 (18.9%) |
| 5 or more Vehicles | 113 (14.9%) | 51 (7.9%) |
| Total | 760 (100.0%) | 647 (100.0%) |
Commute Time in Valhalla
The most frequently occuring commute durations in Valhalla are 20 to 24 minutes (205 commuters, 17.6%), 15 to 19 minutes (203 commuters, 17.4%), and 10 to 14 minutes (190 commuters, 16.3%).
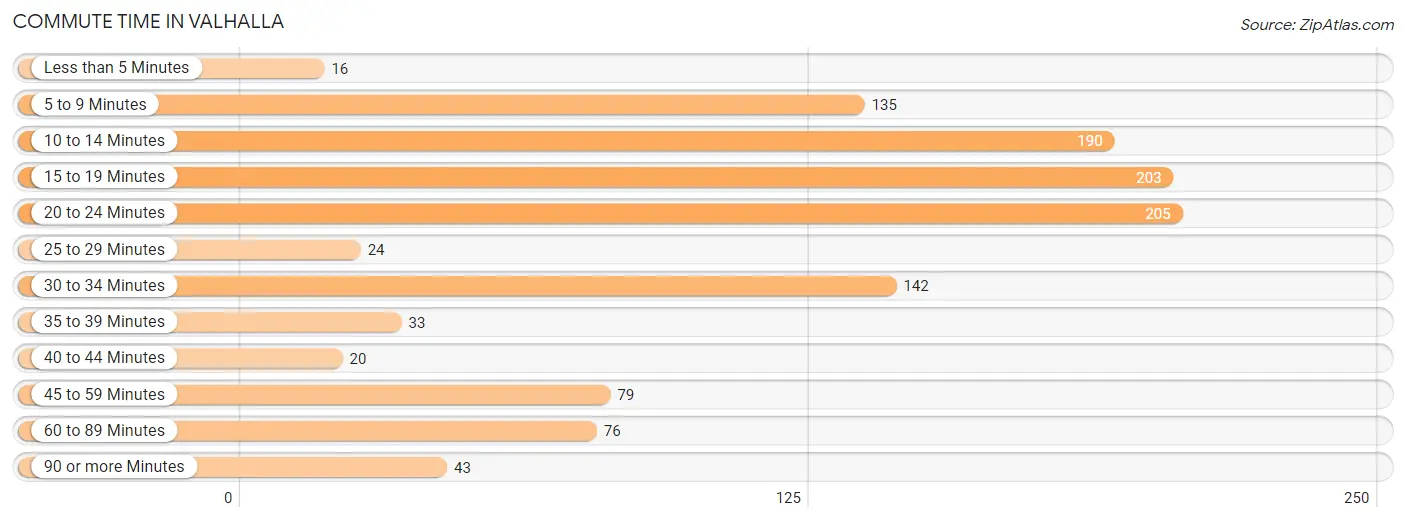
| Commute Time | # Commuters | % Commuters |
| Less than 5 Minutes | 16 | 1.4% |
| 5 to 9 Minutes | 135 | 11.6% |
| 10 to 14 Minutes | 190 | 16.3% |
| 15 to 19 Minutes | 203 | 17.4% |
| 20 to 24 Minutes | 205 | 17.6% |
| 25 to 29 Minutes | 24 | 2.1% |
| 30 to 34 Minutes | 142 | 12.2% |
| 35 to 39 Minutes | 33 | 2.8% |
| 40 to 44 Minutes | 20 | 1.7% |
| 45 to 59 Minutes | 79 | 6.8% |
| 60 to 89 Minutes | 76 | 6.5% |
| 90 or more Minutes | 43 | 3.7% |
Commute Time by Sex in Valhalla
The most common commute times in Valhalla are 5 to 9 minutes (126 commuters, 20.8%) for males and 20 to 24 minutes (146 commuters, 26.1%) for females.
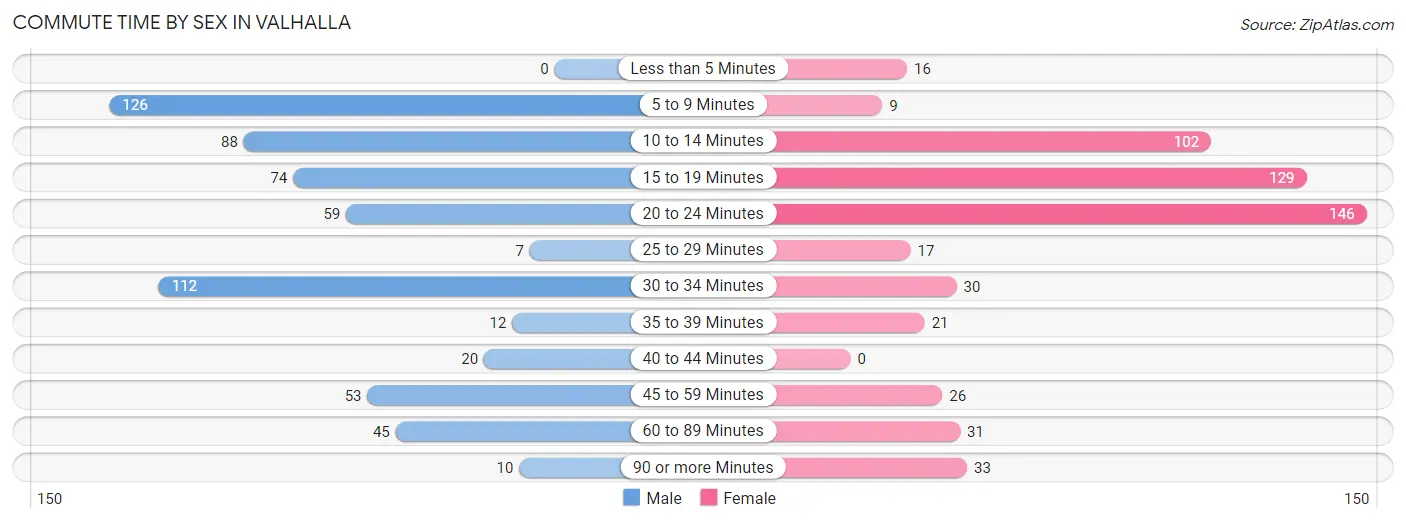
| Commute Time | Male | Female |
| Less than 5 Minutes | 0 (0.0%) | 16 (2.9%) |
| 5 to 9 Minutes | 126 (20.8%) | 9 (1.6%) |
| 10 to 14 Minutes | 88 (14.5%) | 102 (18.2%) |
| 15 to 19 Minutes | 74 (12.2%) | 129 (23.0%) |
| 20 to 24 Minutes | 59 (9.7%) | 146 (26.1%) |
| 25 to 29 Minutes | 7 (1.2%) | 17 (3.0%) |
| 30 to 34 Minutes | 112 (18.5%) | 30 (5.4%) |
| 35 to 39 Minutes | 12 (2.0%) | 21 (3.7%) |
| 40 to 44 Minutes | 20 (3.3%) | 0 (0.0%) |
| 45 to 59 Minutes | 53 (8.7%) | 26 (4.6%) |
| 60 to 89 Minutes | 45 (7.4%) | 31 (5.5%) |
| 90 or more Minutes | 10 (1.7%) | 33 (5.9%) |
Time of Departure to Work by Sex in Valhalla
The most frequent times of departure to work in Valhalla are 7:00 AM to 7:29 AM (229, 37.8%) for males and 8:00 AM to 8:29 AM (168, 30.0%) for females.
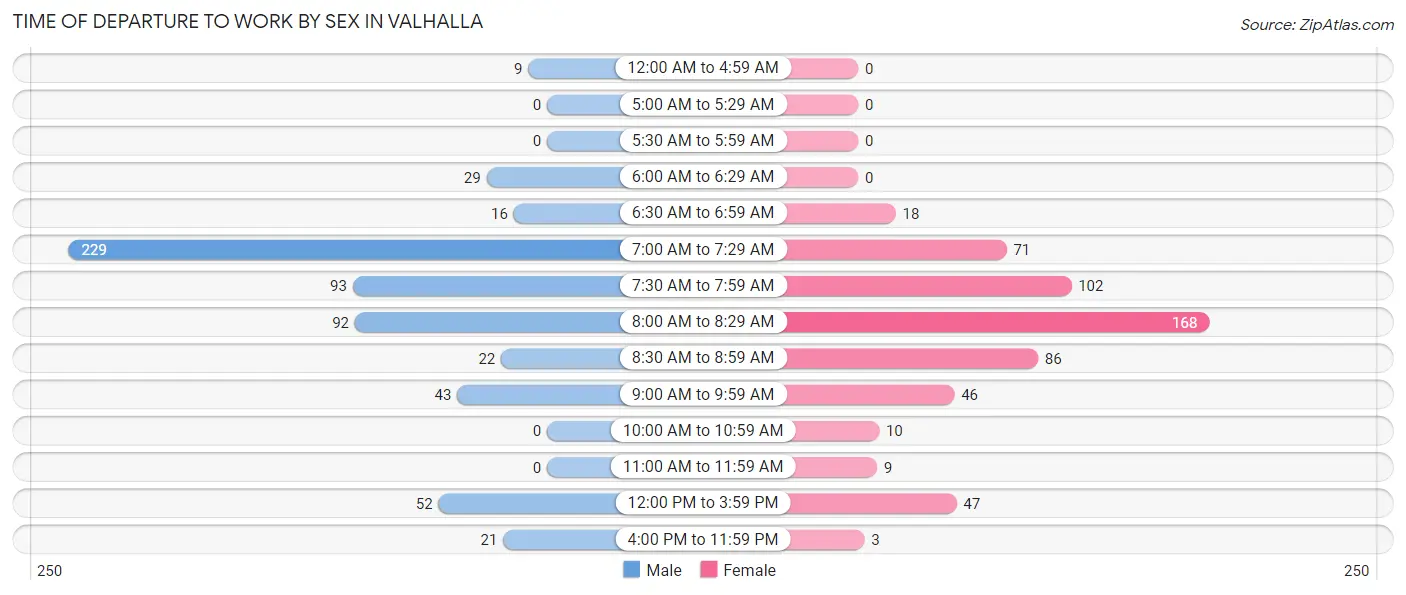
| Time of Departure | Male | Female |
| 12:00 AM to 4:59 AM | 9 (1.5%) | 0 (0.0%) |
| 5:00 AM to 5:29 AM | 0 (0.0%) | 0 (0.0%) |
| 5:30 AM to 5:59 AM | 0 (0.0%) | 0 (0.0%) |
| 6:00 AM to 6:29 AM | 29 (4.8%) | 0 (0.0%) |
| 6:30 AM to 6:59 AM | 16 (2.6%) | 18 (3.2%) |
| 7:00 AM to 7:29 AM | 229 (37.8%) | 71 (12.7%) |
| 7:30 AM to 7:59 AM | 93 (15.3%) | 102 (18.2%) |
| 8:00 AM to 8:29 AM | 92 (15.2%) | 168 (30.0%) |
| 8:30 AM to 8:59 AM | 22 (3.6%) | 86 (15.4%) |
| 9:00 AM to 9:59 AM | 43 (7.1%) | 46 (8.2%) |
| 10:00 AM to 10:59 AM | 0 (0.0%) | 10 (1.8%) |
| 11:00 AM to 11:59 AM | 0 (0.0%) | 9 (1.6%) |
| 12:00 PM to 3:59 PM | 52 (8.6%) | 47 (8.4%) |
| 4:00 PM to 11:59 PM | 21 (3.5%) | 3 (0.5%) |
| Total | 606 (100.0%) | 560 (100.0%) |
Housing Occupancy in Valhalla
Occupancy by Ownership in Valhalla
Of the total 1,095 dwellings in Valhalla, owner-occupied units account for 890 (81.3%), while renter-occupied units make up 205 (18.7%).
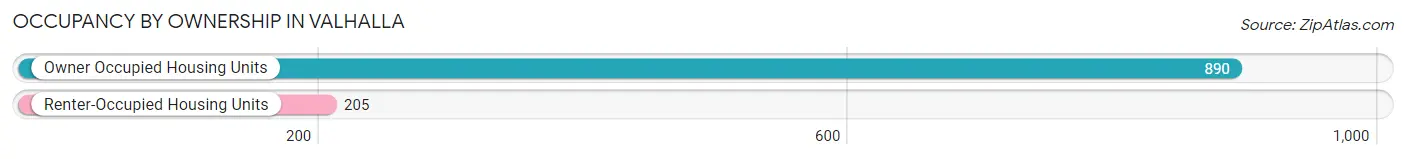
| Occupancy | # Housing Units | % Housing Units |
| Owner Occupied Housing Units | 890 | 81.3% |
| Renter-Occupied Housing Units | 205 | 18.7% |
| Total Occupied Housing Units | 1,095 | 100.0% |
Occupancy by Household Size in Valhalla
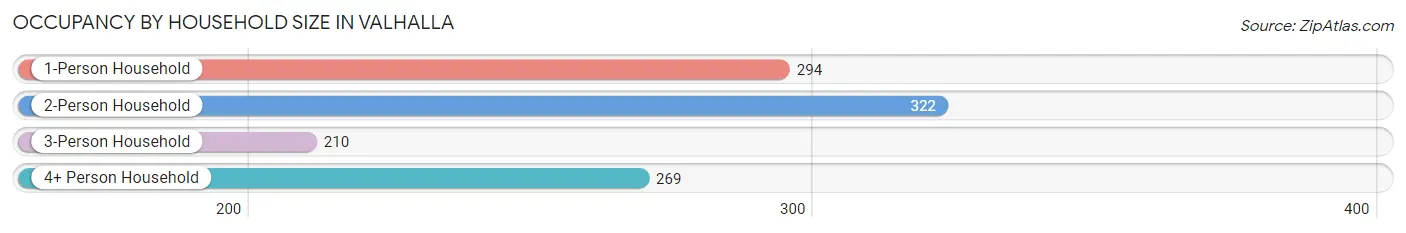
| Household Size | # Housing Units | % Housing Units |
| 1-Person Household | 294 | 26.9% |
| 2-Person Household | 322 | 29.4% |
| 3-Person Household | 210 | 19.2% |
| 4+ Person Household | 269 | 24.6% |
| Total Housing Units | 1,095 | 100.0% |
Occupancy by Ownership by Household Size in Valhalla
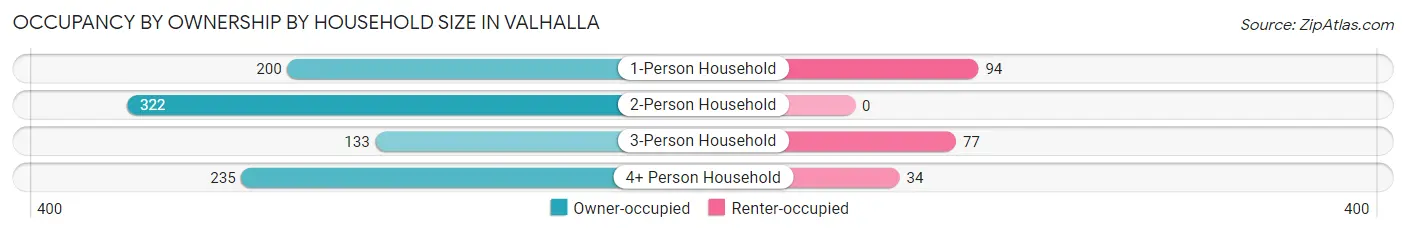
| Household Size | Owner-occupied | Renter-occupied |
| 1-Person Household | 200 (68.0%) | 94 (32.0%) |
| 2-Person Household | 322 (100.0%) | 0 (0.0%) |
| 3-Person Household | 133 (63.3%) | 77 (36.7%) |
| 4+ Person Household | 235 (87.4%) | 34 (12.6%) |
| Total Housing Units | 890 (81.3%) | 205 (18.7%) |
Occupancy by Educational Attainment in Valhalla
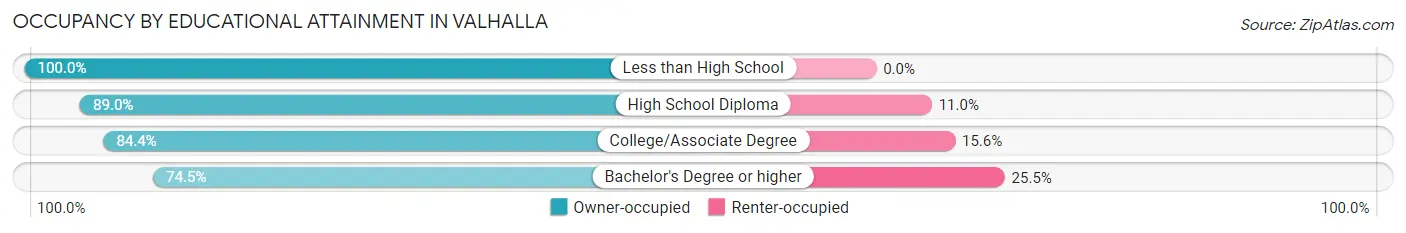
| Household Size | Owner-occupied | Renter-occupied |
| Less than High School | 45 (100.0%) | 0 (0.0%) |
| High School Diploma | 218 (89.0%) | 27 (11.0%) |
| College/Associate Degree | 232 (84.4%) | 43 (15.6%) |
| Bachelor's Degree or higher | 395 (74.5%) | 135 (25.5%) |
Occupancy by Age of Householder in Valhalla
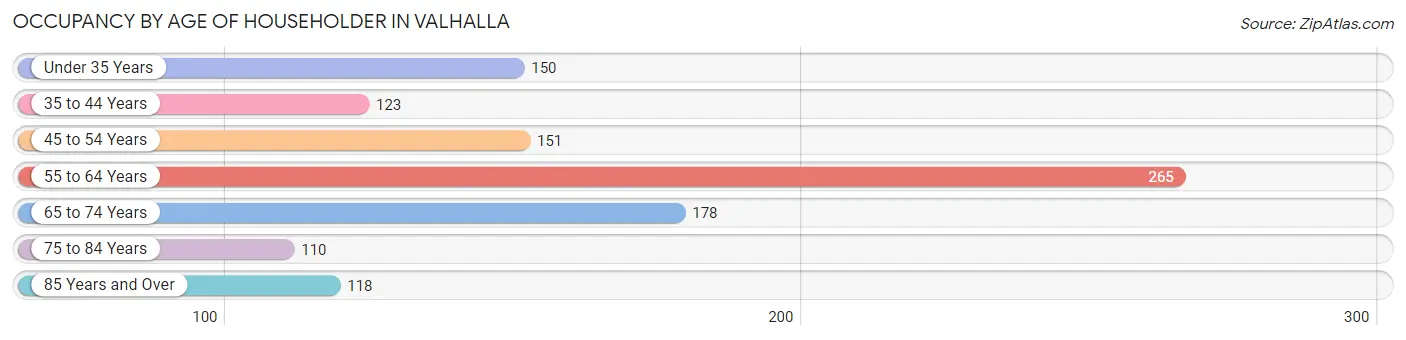
| Age Bracket | # Households | % Households |
| Under 35 Years | 150 | 13.7% |
| 35 to 44 Years | 123 | 11.2% |
| 45 to 54 Years | 151 | 13.8% |
| 55 to 64 Years | 265 | 24.2% |
| 65 to 74 Years | 178 | 16.3% |
| 75 to 84 Years | 110 | 10.1% |
| 85 Years and Over | 118 | 10.8% |
| Total | 1,095 | 100.0% |
Housing Finances in Valhalla
Median Income by Occupancy in Valhalla
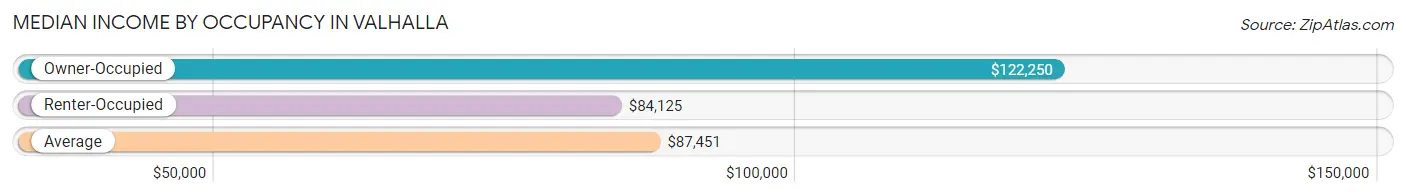
| Occupancy Type | # Households | Median Income |
| Owner-Occupied | 890 (81.3%) | $122,250 |
| Renter-Occupied | 205 (18.7%) | $84,125 |
| Average | 1,095 (100.0%) | $87,451 |
Occupancy by Householder Income Bracket in Valhalla
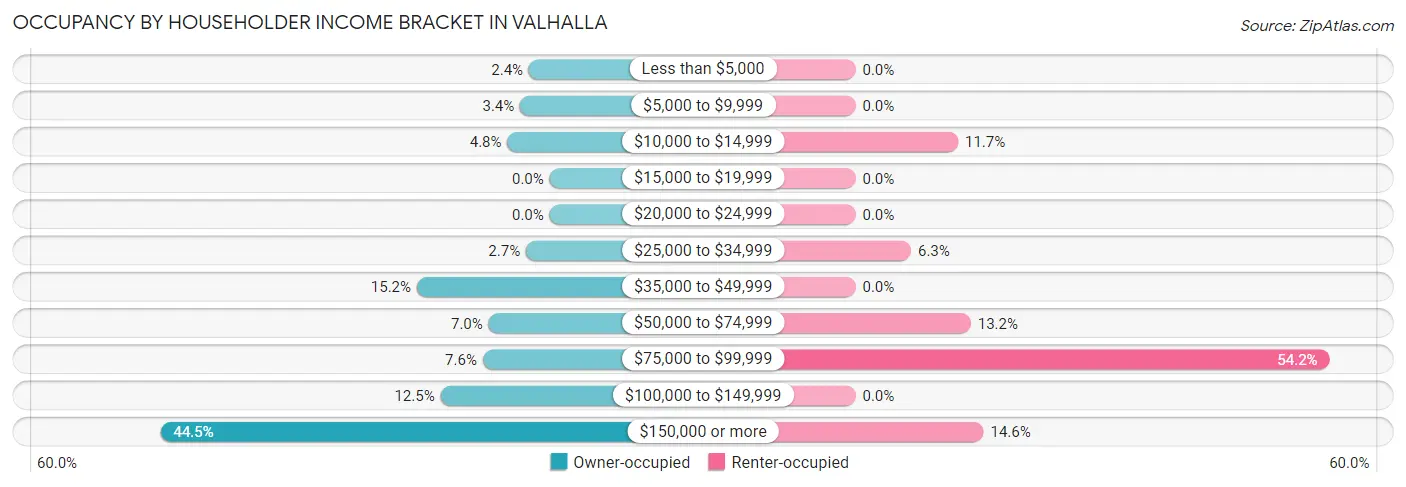
| Income Bracket | Owner-occupied | Renter-occupied |
| Less than $5,000 | 21 (2.4%) | 0 (0.0%) |
| $5,000 to $9,999 | 30 (3.4%) | 0 (0.0%) |
| $10,000 to $14,999 | 43 (4.8%) | 24 (11.7%) |
| $15,000 to $19,999 | 0 (0.0%) | 0 (0.0%) |
| $20,000 to $24,999 | 0 (0.0%) | 0 (0.0%) |
| $25,000 to $34,999 | 24 (2.7%) | 13 (6.3%) |
| $35,000 to $49,999 | 135 (15.2%) | 0 (0.0%) |
| $50,000 to $74,999 | 62 (7.0%) | 27 (13.2%) |
| $75,000 to $99,999 | 68 (7.6%) | 111 (54.1%) |
| $100,000 to $149,999 | 111 (12.5%) | 0 (0.0%) |
| $150,000 or more | 396 (44.5%) | 30 (14.6%) |
| Total | 890 (100.0%) | 205 (100.0%) |
Monthly Housing Cost Tiers in Valhalla
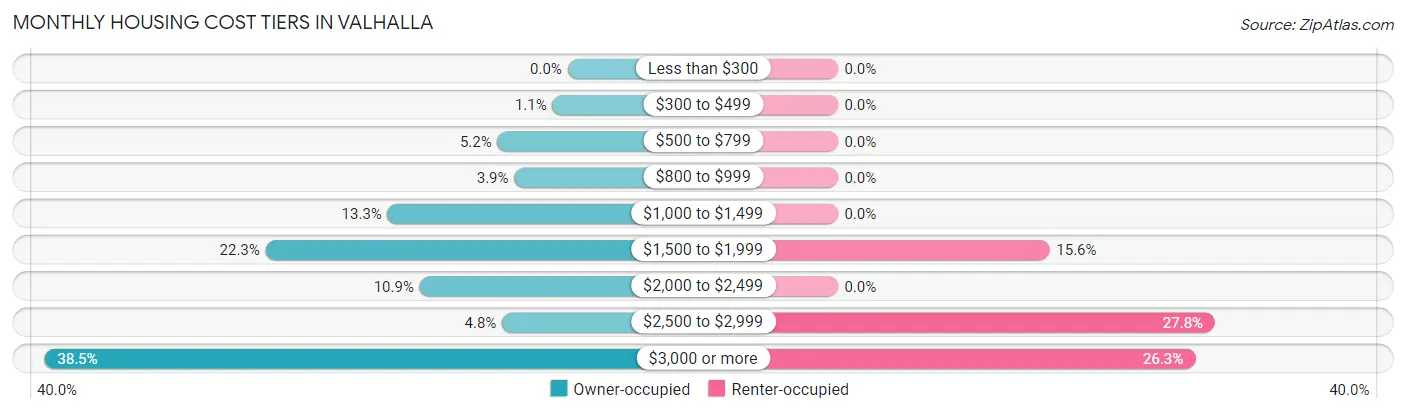
| Monthly Cost | Owner-occupied | Renter-occupied |
| Less than $300 | 0 (0.0%) | 0 (0.0%) |
| $300 to $499 | 10 (1.1%) | 0 (0.0%) |
| $500 to $799 | 46 (5.2%) | 0 (0.0%) |
| $800 to $999 | 35 (3.9%) | 0 (0.0%) |
| $1,000 to $1,499 | 118 (13.3%) | 0 (0.0%) |
| $1,500 to $1,999 | 198 (22.3%) | 32 (15.6%) |
| $2,000 to $2,499 | 97 (10.9%) | 0 (0.0%) |
| $2,500 to $2,999 | 43 (4.8%) | 57 (27.8%) |
| $3,000 or more | 343 (38.5%) | 54 (26.3%) |
| Total | 890 (100.0%) | 205 (100.0%) |
Physical Housing Characteristics in Valhalla
Housing Structures in Valhalla
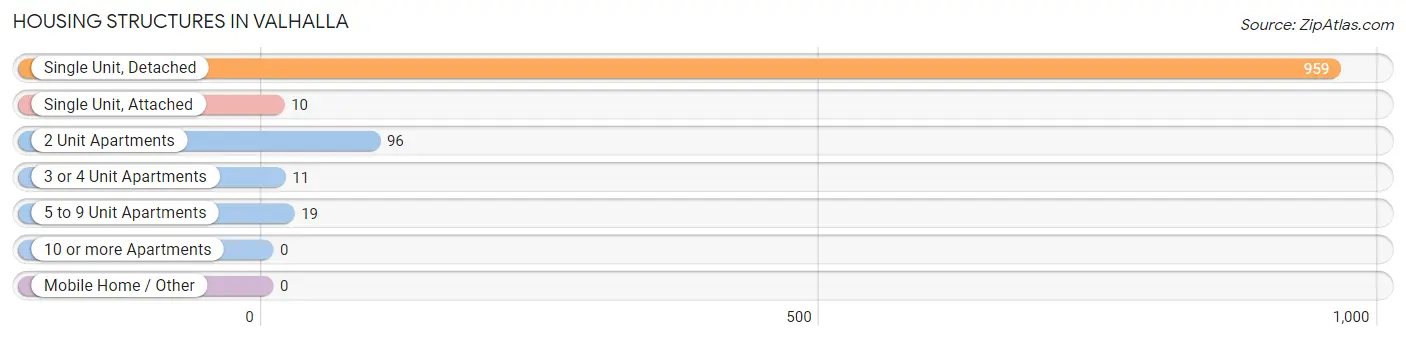
| Structure Type | # Housing Units | % Housing Units |
| Single Unit, Detached | 959 | 87.6% |
| Single Unit, Attached | 10 | 0.9% |
| 2 Unit Apartments | 96 | 8.8% |
| 3 or 4 Unit Apartments | 11 | 1.0% |
| 5 to 9 Unit Apartments | 19 | 1.7% |
| 10 or more Apartments | 0 | 0.0% |
| Mobile Home / Other | 0 | 0.0% |
| Total | 1,095 | 100.0% |
Housing Structures by Occupancy in Valhalla
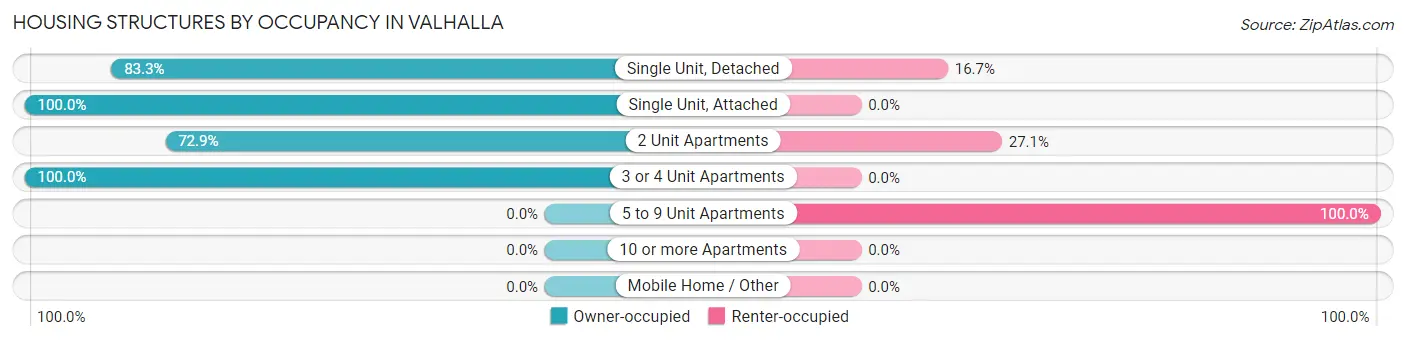
| Structure Type | Owner-occupied | Renter-occupied |
| Single Unit, Detached | 799 (83.3%) | 160 (16.7%) |
| Single Unit, Attached | 10 (100.0%) | 0 (0.0%) |
| 2 Unit Apartments | 70 (72.9%) | 26 (27.1%) |
| 3 or 4 Unit Apartments | 11 (100.0%) | 0 (0.0%) |
| 5 to 9 Unit Apartments | 0 (0.0%) | 19 (100.0%) |
| 10 or more Apartments | 0 (0.0%) | 0 (0.0%) |
| Mobile Home / Other | 0 (0.0%) | 0 (0.0%) |
| Total | 890 (81.3%) | 205 (18.7%) |
Housing Structures by Number of Rooms in Valhalla
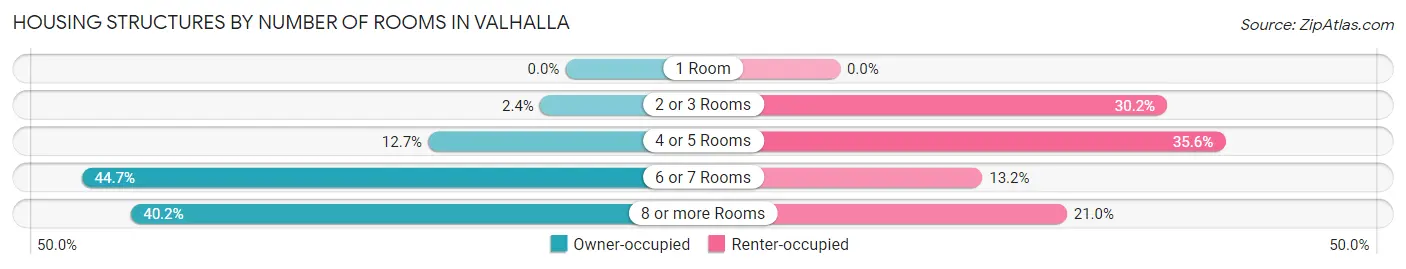
| Number of Rooms | Owner-occupied | Renter-occupied |
| 1 Room | 0 (0.0%) | 0 (0.0%) |
| 2 or 3 Rooms | 21 (2.4%) | 62 (30.2%) |
| 4 or 5 Rooms | 113 (12.7%) | 73 (35.6%) |
| 6 or 7 Rooms | 398 (44.7%) | 27 (13.2%) |
| 8 or more Rooms | 358 (40.2%) | 43 (21.0%) |
| Total | 890 (100.0%) | 205 (100.0%) |
Housing Structure by Heating Type in Valhalla
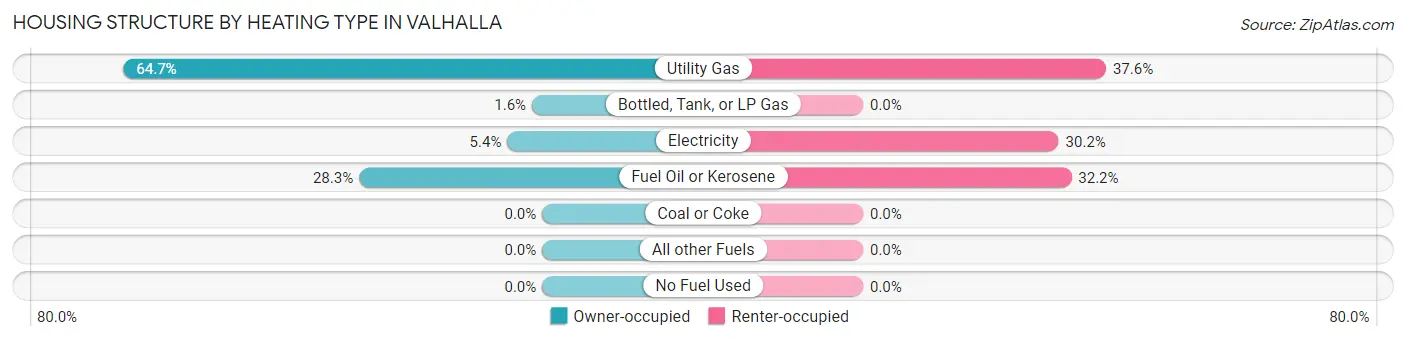
| Heating Type | Owner-occupied | Renter-occupied |
| Utility Gas | 576 (64.7%) | 77 (37.6%) |
| Bottled, Tank, or LP Gas | 14 (1.6%) | 0 (0.0%) |
| Electricity | 48 (5.4%) | 62 (30.2%) |
| Fuel Oil or Kerosene | 252 (28.3%) | 66 (32.2%) |
| Coal or Coke | 0 (0.0%) | 0 (0.0%) |
| All other Fuels | 0 (0.0%) | 0 (0.0%) |
| No Fuel Used | 0 (0.0%) | 0 (0.0%) |
| Total | 890 (100.0%) | 205 (100.0%) |
Household Vehicle Usage in Valhalla
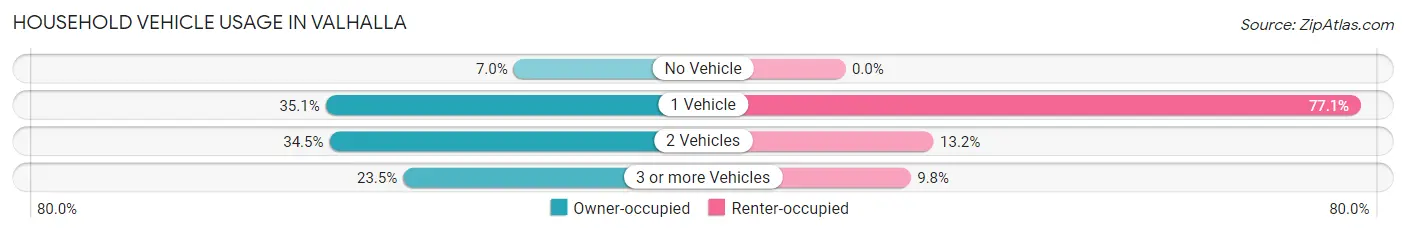
| Vehicles per Household | Owner-occupied | Renter-occupied |
| No Vehicle | 62 (7.0%) | 0 (0.0%) |
| 1 Vehicle | 312 (35.1%) | 158 (77.1%) |
| 2 Vehicles | 307 (34.5%) | 27 (13.2%) |
| 3 or more Vehicles | 209 (23.5%) | 20 (9.8%) |
| Total | 890 (100.0%) | 205 (100.0%) |
Real Estate & Mortgages in Valhalla
Real Estate and Mortgage Overview in Valhalla
| Characteristic | Without Mortgage | With Mortgage |
| Housing Units | 396 | 494 |
| Median Property Value | $621,000 | $580,900 |
| Median Household Income | $65,250 | $269 |
| Monthly Housing Costs | $1,501 | $343 |
| Real Estate Taxes | $10,001 | $16 |
Property Value by Mortgage Status in Valhalla
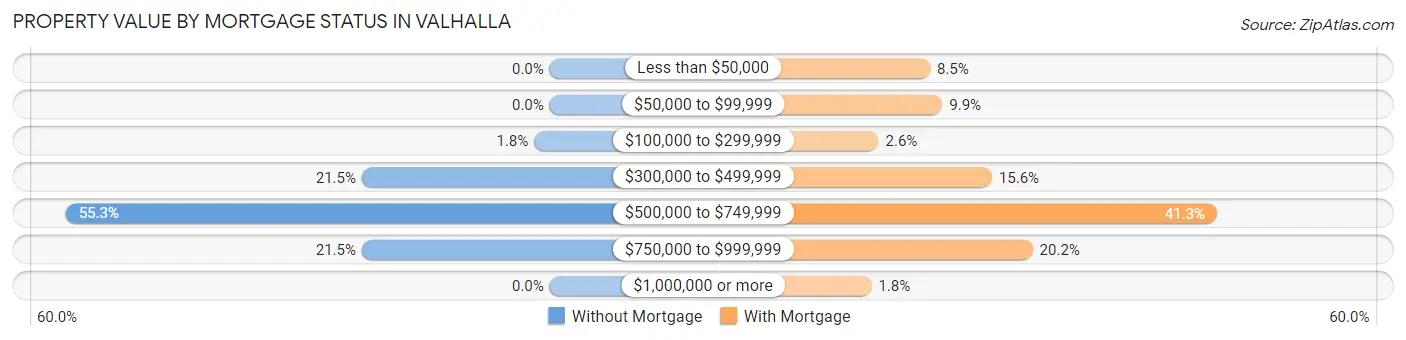
| Property Value | Without Mortgage | With Mortgage |
| Less than $50,000 | 0 (0.0%) | 42 (8.5%) |
| $50,000 to $99,999 | 0 (0.0%) | 49 (9.9%) |
| $100,000 to $299,999 | 7 (1.8%) | 13 (2.6%) |
| $300,000 to $499,999 | 85 (21.5%) | 77 (15.6%) |
| $500,000 to $749,999 | 219 (55.3%) | 204 (41.3%) |
| $750,000 to $999,999 | 85 (21.5%) | 100 (20.2%) |
| $1,000,000 or more | 0 (0.0%) | 9 (1.8%) |
| Total | 396 (100.0%) | 494 (100.0%) |
Household Income by Mortgage Status in Valhalla
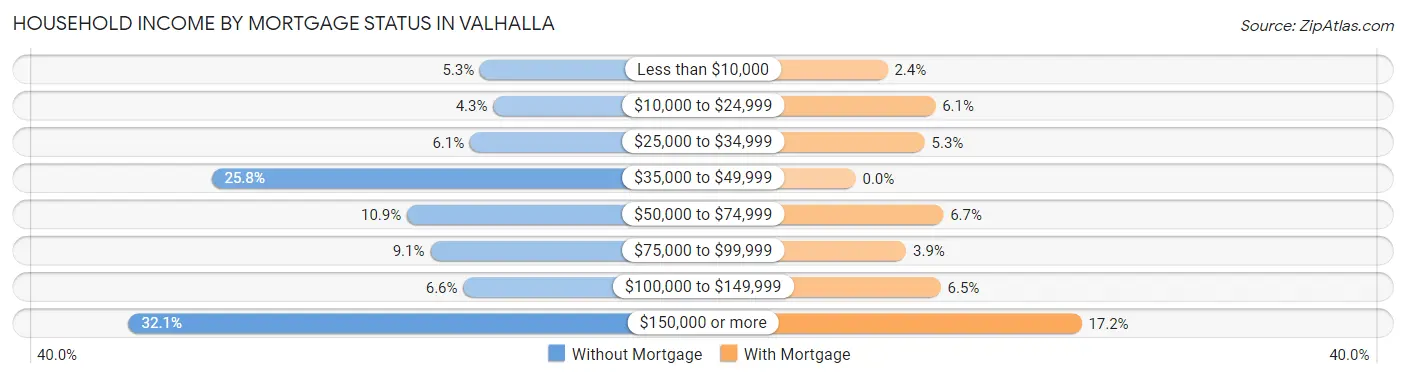
| Household Income | Without Mortgage | With Mortgage |
| Less than $10,000 | 21 (5.3%) | 12 (2.4%) |
| $10,000 to $24,999 | 17 (4.3%) | 30 (6.1%) |
| $25,000 to $34,999 | 24 (6.1%) | 26 (5.3%) |
| $35,000 to $49,999 | 102 (25.8%) | 0 (0.0%) |
| $50,000 to $74,999 | 43 (10.9%) | 33 (6.7%) |
| $75,000 to $99,999 | 36 (9.1%) | 19 (3.8%) |
| $100,000 to $149,999 | 26 (6.6%) | 32 (6.5%) |
| $150,000 or more | 127 (32.1%) | 85 (17.2%) |
| Total | 396 (100.0%) | 494 (100.0%) |
Property Value to Household Income Ratio in Valhalla
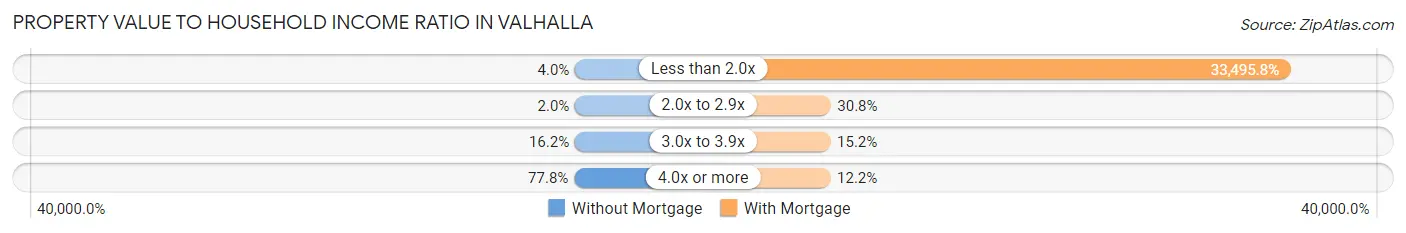
| Value-to-Income Ratio | Without Mortgage | With Mortgage |
| Less than 2.0x | 16 (4.0%) | 165,469 (33,495.7%) |
| 2.0x to 2.9x | 8 (2.0%) | 152 (30.8%) |
| 3.0x to 3.9x | 64 (16.2%) | 75 (15.2%) |
| 4.0x or more | 308 (77.8%) | 60 (12.1%) |
| Total | 396 (100.0%) | 494 (100.0%) |
Real Estate Taxes by Mortgage Status in Valhalla
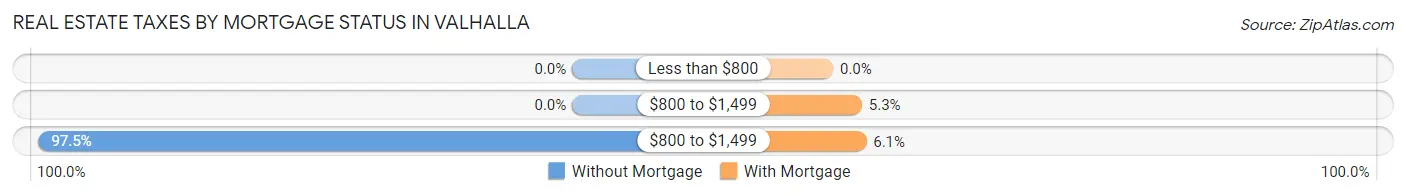
| Property Taxes | Without Mortgage | With Mortgage |
| Less than $800 | 0 (0.0%) | 0 (0.0%) |
| $800 to $1,499 | 0 (0.0%) | 26 (5.3%) |
| $800 to $1,499 | 386 (97.5%) | 30 (6.1%) |
| Total | 396 (100.0%) | 494 (100.0%) |
Health & Disability in Valhalla
Health Insurance Coverage by Age in Valhalla
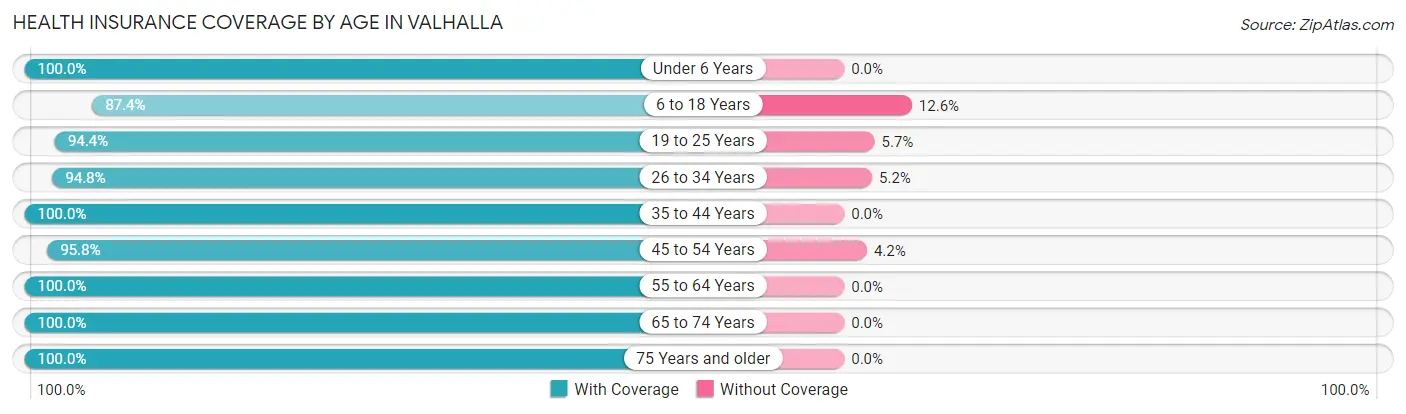
| Age Bracket | With Coverage | Without Coverage |
| Under 6 Years | 179 (100.0%) | 0 (0.0%) |
| 6 to 18 Years | 305 (87.4%) | 44 (12.6%) |
| 19 to 25 Years | 267 (94.4%) | 16 (5.7%) |
| 26 to 34 Years | 403 (94.8%) | 22 (5.2%) |
| 35 to 44 Years | 258 (100.0%) | 0 (0.0%) |
| 45 to 54 Years | 272 (95.8%) | 12 (4.2%) |
| 55 to 64 Years | 531 (100.0%) | 0 (0.0%) |
| 65 to 74 Years | 311 (100.0%) | 0 (0.0%) |
| 75 Years and older | 409 (100.0%) | 0 (0.0%) |
| Total | 2,935 (96.9%) | 94 (3.1%) |
Health Insurance Coverage by Citizenship Status in Valhalla
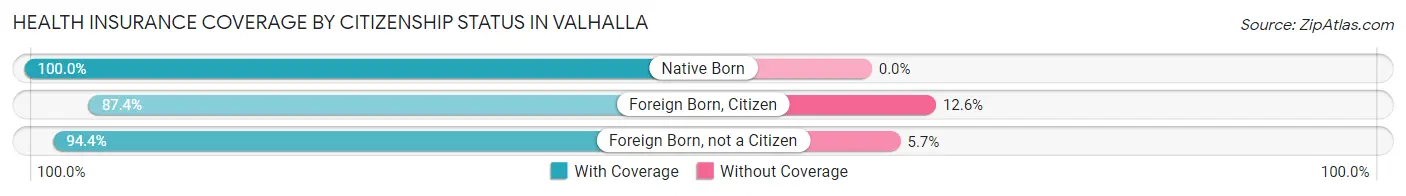
| Citizenship Status | With Coverage | Without Coverage |
| Native Born | 179 (100.0%) | 0 (0.0%) |
| Foreign Born, Citizen | 305 (87.4%) | 44 (12.6%) |
| Foreign Born, not a Citizen | 267 (94.4%) | 16 (5.7%) |
Health Insurance Coverage by Household Income in Valhalla
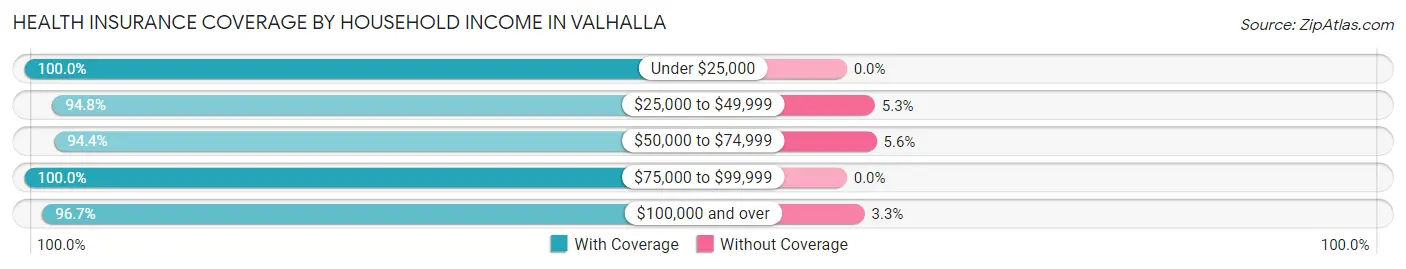
| Household Income | With Coverage | Without Coverage |
| Under $25,000 | 199 (100.0%) | 0 (0.0%) |
| $25,000 to $49,999 | 289 (94.8%) | 16 (5.2%) |
| $50,000 to $74,999 | 203 (94.4%) | 12 (5.6%) |
| $75,000 to $99,999 | 327 (100.0%) | 0 (0.0%) |
| $100,000 and over | 1,917 (96.7%) | 66 (3.3%) |
Public vs Private Health Insurance Coverage by Age in Valhalla
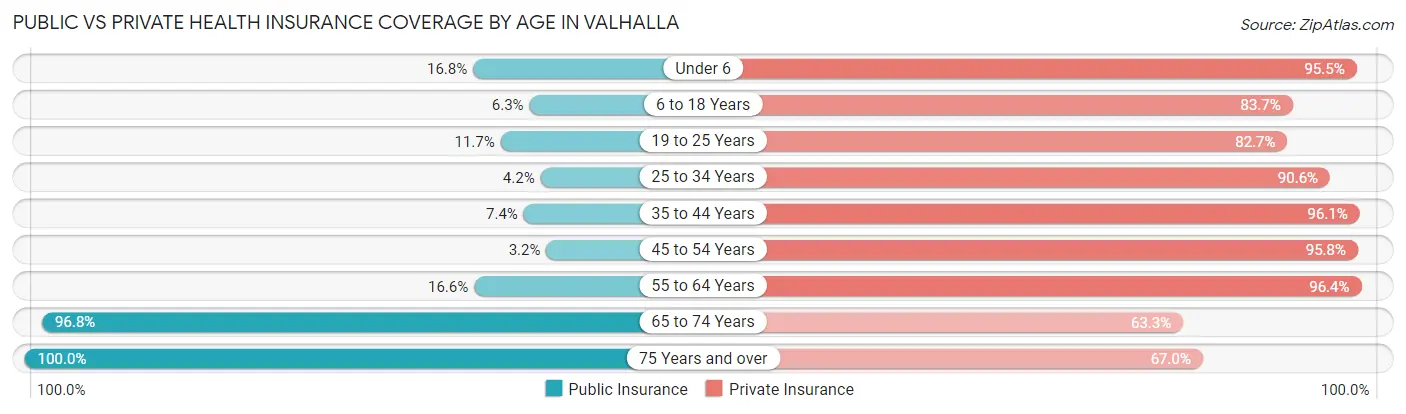
| Age Bracket | Public Insurance | Private Insurance |
| Under 6 | 30 (16.8%) | 171 (95.5%) |
| 6 to 18 Years | 22 (6.3%) | 292 (83.7%) |
| 19 to 25 Years | 33 (11.7%) | 234 (82.7%) |
| 25 to 34 Years | 18 (4.2%) | 385 (90.6%) |
| 35 to 44 Years | 19 (7.4%) | 248 (96.1%) |
| 45 to 54 Years | 9 (3.2%) | 272 (95.8%) |
| 55 to 64 Years | 88 (16.6%) | 512 (96.4%) |
| 65 to 74 Years | 301 (96.8%) | 197 (63.3%) |
| 75 Years and over | 409 (100.0%) | 274 (67.0%) |
| Total | 929 (30.7%) | 2,585 (85.3%) |
Disability Status by Sex by Age in Valhalla
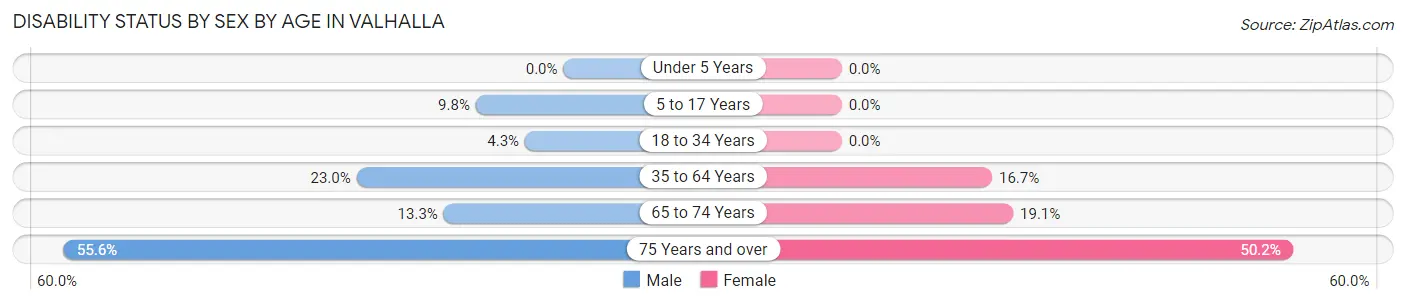
| Age Bracket | Male | Female |
| Under 5 Years | 0 (0.0%) | 0 (0.0%) |
| 5 to 17 Years | 16 (9.8%) | 0 (0.0%) |
| 18 to 34 Years | 18 (4.3%) | 0 (0.0%) |
| 35 to 64 Years | 126 (23.0%) | 88 (16.7%) |
| 65 to 74 Years | 24 (13.3%) | 25 (19.1%) |
| 75 Years and over | 89 (55.6%) | 125 (50.2%) |
Disability Class by Sex by Age in Valhalla
Disability Class: Hearing Difficulty
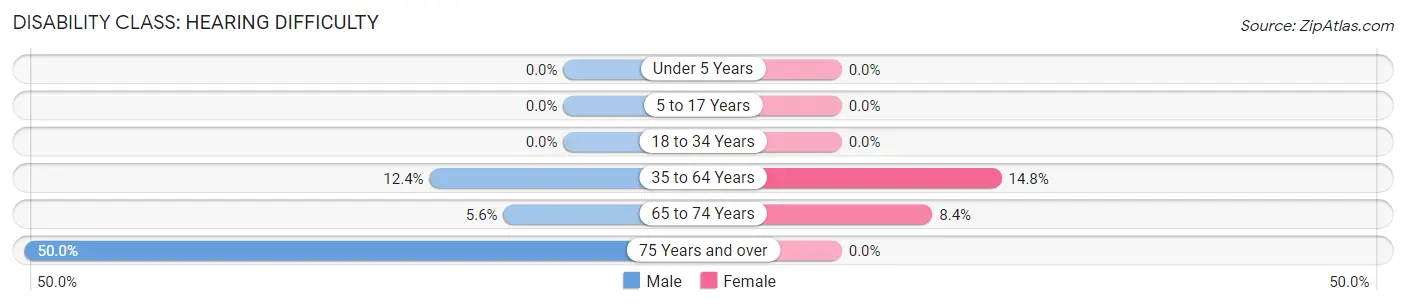
| Age Bracket | Male | Female |
| Under 5 Years | 0 (0.0%) | 0 (0.0%) |
| 5 to 17 Years | 0 (0.0%) | 0 (0.0%) |
| 18 to 34 Years | 0 (0.0%) | 0 (0.0%) |
| 35 to 64 Years | 68 (12.4%) | 78 (14.8%) |
| 65 to 74 Years | 10 (5.6%) | 11 (8.4%) |
| 75 Years and over | 80 (50.0%) | 0 (0.0%) |
Disability Class: Vision Difficulty
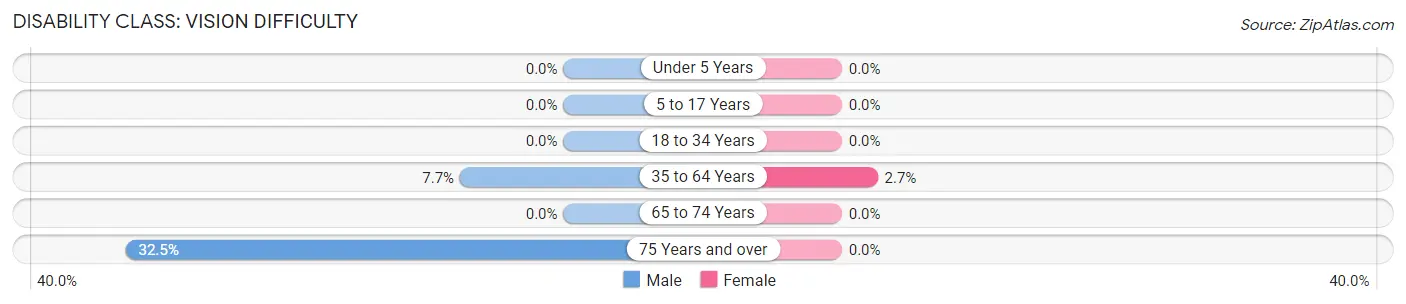
| Age Bracket | Male | Female |
| Under 5 Years | 0 (0.0%) | 0 (0.0%) |
| 5 to 17 Years | 0 (0.0%) | 0 (0.0%) |
| 18 to 34 Years | 0 (0.0%) | 0 (0.0%) |
| 35 to 64 Years | 42 (7.7%) | 14 (2.7%) |
| 65 to 74 Years | 0 (0.0%) | 0 (0.0%) |
| 75 Years and over | 52 (32.5%) | 0 (0.0%) |
Disability Class: Cognitive Difficulty
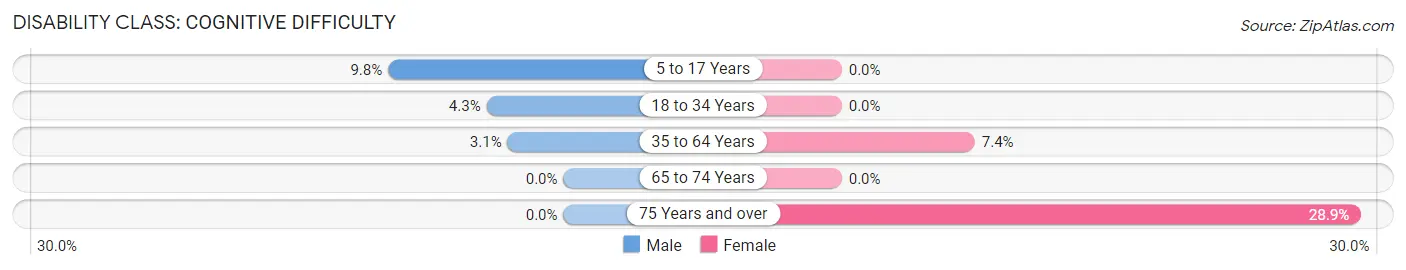
| Age Bracket | Male | Female |
| 5 to 17 Years | 16 (9.8%) | 0 (0.0%) |
| 18 to 34 Years | 18 (4.3%) | 0 (0.0%) |
| 35 to 64 Years | 17 (3.1%) | 39 (7.4%) |
| 65 to 74 Years | 0 (0.0%) | 0 (0.0%) |
| 75 Years and over | 0 (0.0%) | 72 (28.9%) |
Disability Class: Ambulatory Difficulty
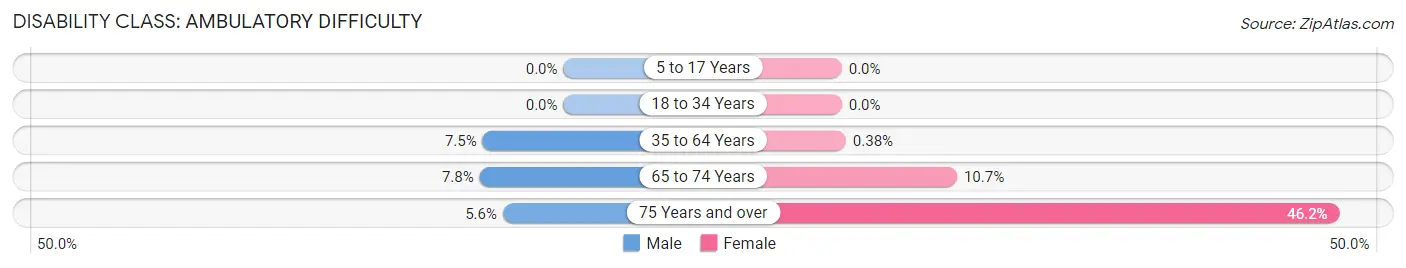
| Age Bracket | Male | Female |
| 5 to 17 Years | 0 (0.0%) | 0 (0.0%) |
| 18 to 34 Years | 0 (0.0%) | 0 (0.0%) |
| 35 to 64 Years | 41 (7.5%) | 2 (0.4%) |
| 65 to 74 Years | 14 (7.8%) | 14 (10.7%) |
| 75 Years and over | 9 (5.6%) | 115 (46.2%) |
Disability Class: Self-Care Difficulty
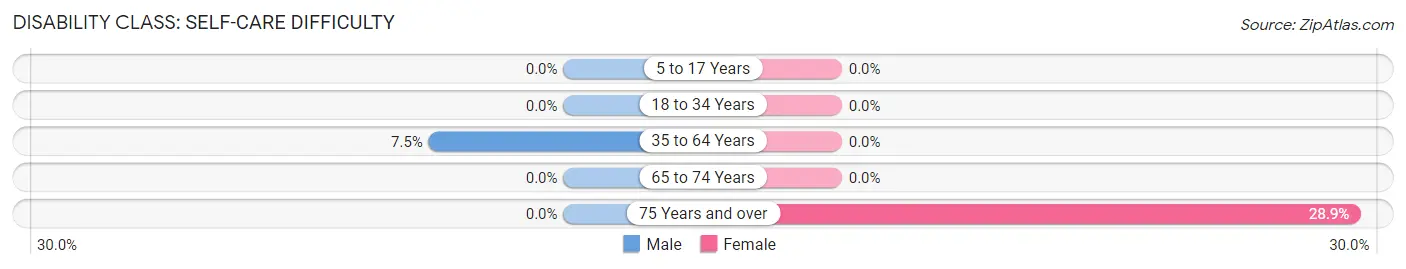
| Age Bracket | Male | Female |
| 5 to 17 Years | 0 (0.0%) | 0 (0.0%) |
| 18 to 34 Years | 0 (0.0%) | 0 (0.0%) |
| 35 to 64 Years | 41 (7.5%) | 0 (0.0%) |
| 65 to 74 Years | 0 (0.0%) | 0 (0.0%) |
| 75 Years and over | 0 (0.0%) | 72 (28.9%) |
Technology Access in Valhalla
Computing Device Access in Valhalla
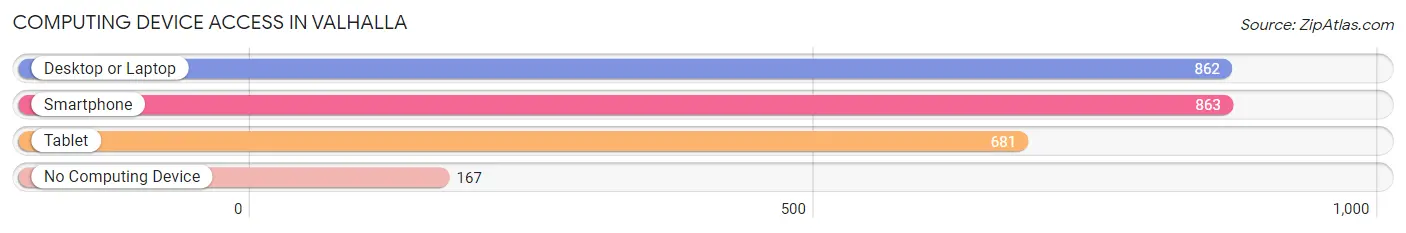
| Device Type | # Households | % Households |
| Desktop or Laptop | 862 | 78.7% |
| Smartphone | 863 | 78.8% |
| Tablet | 681 | 62.2% |
| No Computing Device | 167 | 15.2% |
| Total | 1,095 | 100.0% |
Internet Access in Valhalla
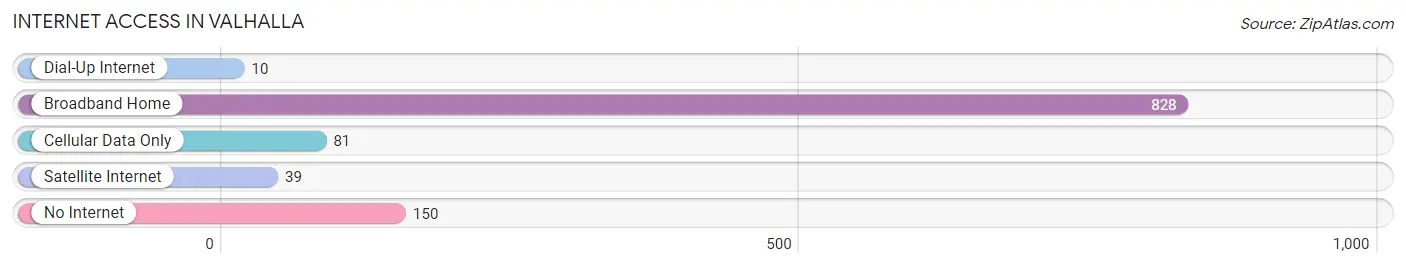
| Internet Type | # Households | % Households |
| Dial-Up Internet | 10 | 0.9% |
| Broadband Home | 828 | 75.6% |
| Cellular Data Only | 81 | 7.4% |
| Satellite Internet | 39 | 3.6% |
| No Internet | 150 | 13.7% |
| Total | 1,095 | 100.0% |
Valhalla Summary
Valhalla, NY is a small village located in Westchester County, New York. It is situated in the town of Mount Pleasant, and is part of the New York metropolitan area. The village is located approximately 25 miles north of New York City, and is bordered by the towns of North Castle, Harrison, and White Plains.
History
Valhalla was originally part of the town of North Castle, and was known as Kensico until 1891. The name was changed to Valhalla in 1892, after the Norse mythological hall of the slain. The village was incorporated in 1917, and was the first village to be incorporated in Westchester County.
Geography
Valhalla is located in the southeastern corner of Westchester County, and is bordered by the towns of North Castle, Harrison, and White Plains. The village is situated on the Kensico Reservoir, which is part of the New York City water supply system. The village is located approximately 25 miles north of New York City, and is accessible by the Metro-North Railroad.
Economy
Valhalla is primarily a residential community, and is home to a number of corporate headquarters, including PepsiCo, MasterCard, and Heineken USA. The village is also home to a number of small businesses, including restaurants, retail stores, and professional services.
Demographics
As of the 2010 census, the population of Valhalla was 5,379. The racial makeup of the village was 87.3% White, 4.2% African American, 0.2% Native American, 4.2% Asian, and 4.1% from other races. The median household income was $90,917, and the median family income was $103,917.
Valhalla is a small village with a rich history and a vibrant economy. It is home to a diverse population, and is a great place to live and work. With its close proximity to New York City, Valhalla is an ideal place for those looking for a suburban lifestyle with easy access to the city.
Common Questions
What is Per Capita Income in Valhalla?
Per Capita income in Valhalla is $54,611.
What is the Median Family Income in Valhalla?
Median Family Income in Valhalla is $129,583.
What is the Median Household income in Valhalla?
Median Household Income in Valhalla is $87,451.
What is Income or Wage Gap in Valhalla?
Income or Wage Gap in Valhalla is 28.9%.
Women in Valhalla earn 71.1 cents for every dollar earned by a man.
What is Family Income Deficit in Valhalla?
Family Income Deficit in Valhalla is $7,573.
Families that are below poverty line in Valhalla earn $7,573 less on average than the poverty threshold level.
What is Inequality or Gini Index in Valhalla?
Inequality or Gini Index in Valhalla is 0.47.
What is the Total Population of Valhalla?
Total Population of Valhalla is 3,052.
What is the Total Male Population of Valhalla?
Total Male Population of Valhalla is 1,604.
What is the Total Female Population of Valhalla?
Total Female Population of Valhalla is 1,448.
What is the Ratio of Males per 100 Females in Valhalla?
There are 110.77 Males per 100 Females in Valhalla.
What is the Ratio of Females per 100 Males in Valhalla?
There are 90.27 Females per 100 Males in Valhalla.
What is the Median Population Age in Valhalla?
Median Population Age in Valhalla is 45.5 Years.
What is the Average Family Size in Valhalla
Average Family Size in Valhalla is 3.2 People.
What is the Average Household Size in Valhalla
Average Household Size in Valhalla is 2.8 People.
How Large is the Labor Force in Valhalla?
There are 1,536 People in the Labor Forcein in Valhalla.
What is the Percentage of People in the Labor Force in Valhalla?
59.6% of People are in the Labor Force in Valhalla.
What is the Unemployment Rate in Valhalla?
Unemployment Rate in Valhalla is 4.4%.