Valatie, NY Map & Demographics
Valatie Map
Valatie Overview
$42,808
PER CAPITA INCOME
$117,000
AVG FAMILY INCOME
$93,824
AVG HOUSEHOLD INCOME
46.5%
WAGE / INCOME GAP [ % ]
53.5¢/ $1
WAGE / INCOME GAP [ $ ]
$18,310
FAMILY INCOME DEFICIT
0.41
INEQUALITY / GINI INDEX
1,668
TOTAL POPULATION
845
MALE POPULATION
823
FEMALE POPULATION
102.67
MALES / 100 FEMALES
97.40
FEMALES / 100 MALES
46.7
MEDIAN AGE
3.0
AVG FAMILY SIZE
2.4
AVG HOUSEHOLD SIZE
774
LABOR FORCE [ PEOPLE ]
56.3%
PERCENT IN LABOR FORCE
7.1%
UNEMPLOYMENT RATE
Valatie Zip Codes
Valatie Area Codes
Income in Valatie
Income Overview in Valatie
Per Capita Income in Valatie is $42,808, while median incomes of families and households are $117,000 and $93,824 respectively.
| Characteristic | Number | Measure |
| Per Capita Income | 1,668 | $42,808 |
| Median Family Income | 396 | $117,000 |
| Mean Family Income | 396 | $125,236 |
| Median Household Income | 626 | $93,824 |
| Mean Household Income | 626 | $105,436 |
| Income Deficit | 396 | $18,310 |
| Wage / Income Gap (%) | 1,668 | 46.46% |
| Wage / Income Gap ($) | 1,668 | 53.54¢ per $1 |
| Gini / Inequality Index | 1,668 | 0.41 |
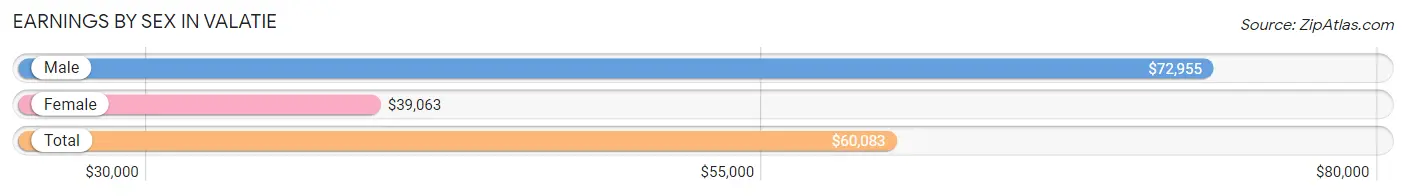
Earnings by Sex in Valatie
Average Earnings in Valatie are $60,083, $72,955 for men and $39,063 for women, a difference of 46.5%.
| Sex | Number | Average Earnings |
| Male | 486 (59.3%) | $72,955 |
| Female | 333 (40.7%) | $39,063 |
| Total | 819 (100.0%) | $60,083 |
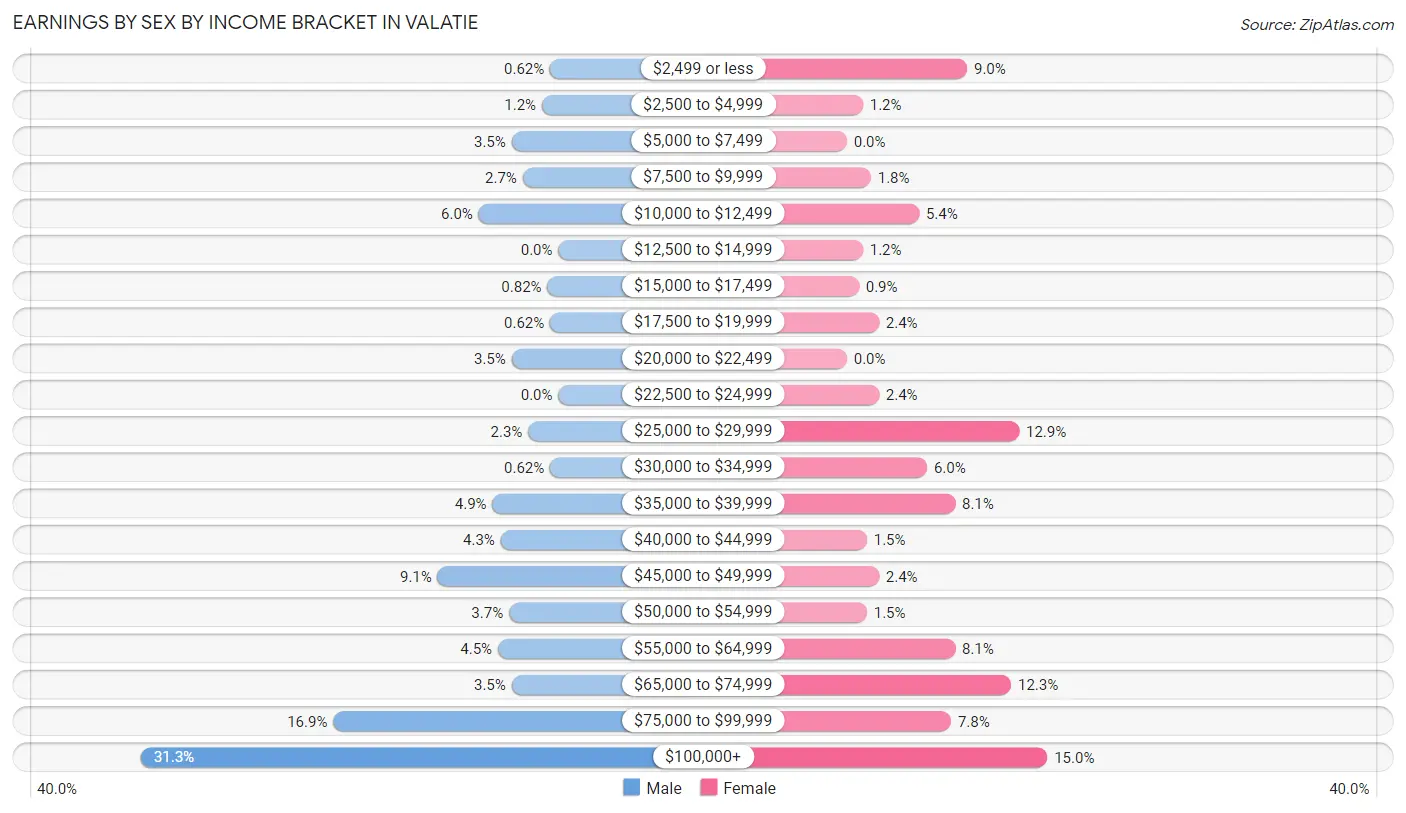
Earnings by Sex by Income Bracket in Valatie
The most common earnings brackets in Valatie are $100,000+ for men (152 | 31.3%) and $100,000+ for women (50 | 15.0%).
| Income | Male | Female |
| $2,499 or less | 3 (0.6%) | 30 (9.0%) |
| $2,500 to $4,999 | 6 (1.2%) | 4 (1.2%) |
| $5,000 to $7,499 | 17 (3.5%) | 0 (0.0%) |
| $7,500 to $9,999 | 13 (2.7%) | 6 (1.8%) |
| $10,000 to $12,499 | 29 (6.0%) | 18 (5.4%) |
| $12,500 to $14,999 | 0 (0.0%) | 4 (1.2%) |
| $15,000 to $17,499 | 4 (0.8%) | 3 (0.9%) |
| $17,500 to $19,999 | 3 (0.6%) | 8 (2.4%) |
| $20,000 to $22,499 | 17 (3.5%) | 0 (0.0%) |
| $22,500 to $24,999 | 0 (0.0%) | 8 (2.4%) |
| $25,000 to $29,999 | 11 (2.3%) | 43 (12.9%) |
| $30,000 to $34,999 | 3 (0.6%) | 20 (6.0%) |
| $35,000 to $39,999 | 24 (4.9%) | 27 (8.1%) |
| $40,000 to $44,999 | 21 (4.3%) | 5 (1.5%) |
| $45,000 to $49,999 | 44 (9.0%) | 8 (2.4%) |
| $50,000 to $54,999 | 18 (3.7%) | 5 (1.5%) |
| $55,000 to $64,999 | 22 (4.5%) | 27 (8.1%) |
| $65,000 to $74,999 | 17 (3.5%) | 41 (12.3%) |
| $75,000 to $99,999 | 82 (16.9%) | 26 (7.8%) |
| $100,000+ | 152 (31.3%) | 50 (15.0%) |
| Total | 486 (100.0%) | 333 (100.0%) |
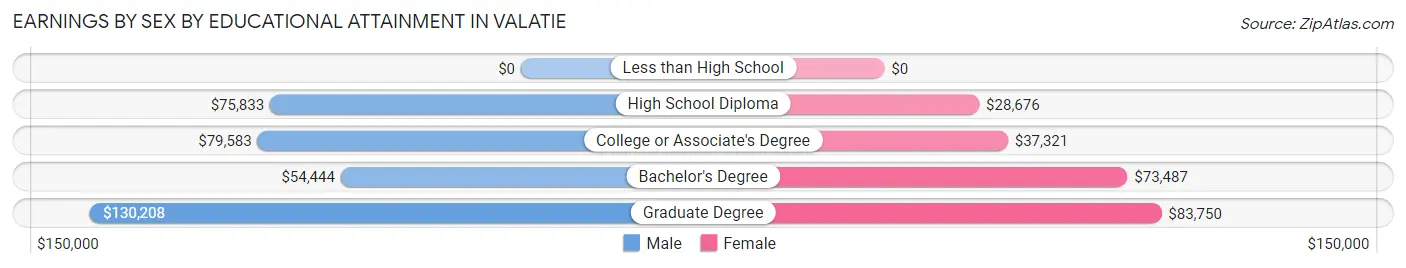
Earnings by Sex by Educational Attainment in Valatie
Average earnings in Valatie are $77,578 for men and $48,542 for women, a difference of 37.4%. Men with an educational attainment of graduate degree enjoy the highest average annual earnings of $130,208, while those with bachelor's degree education earn the least with $54,444. Women with an educational attainment of graduate degree earn the most with the average annual earnings of $83,750, while those with high school diploma education have the smallest earnings of $28,676.
| Educational Attainment | Male Income | Female Income |
| Less than High School | - | - |
| High School Diploma | $75,833 | $28,676 |
| College or Associate's Degree | $79,583 | $37,321 |
| Bachelor's Degree | $54,444 | $73,487 |
| Graduate Degree | $130,208 | $83,750 |
| Total | $77,578 | $48,542 |
Family Income in Valatie
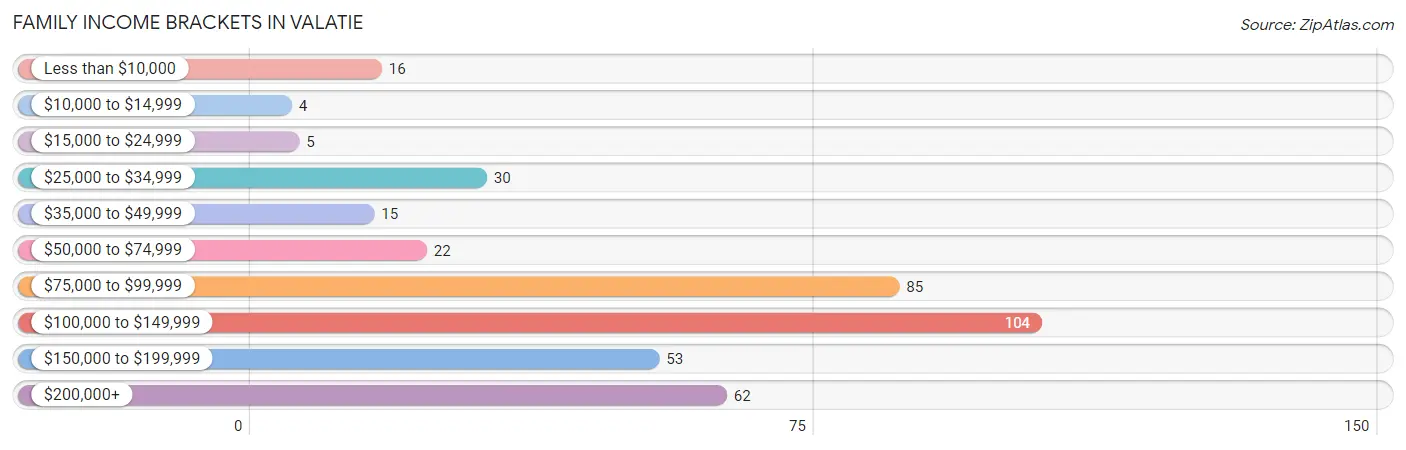
Family Income Brackets in Valatie
According to the Valatie family income data, there are 104 families falling into the $100,000 to $149,999 income range, which is the most common income bracket and makes up 26.3% of all families. Conversely, the $10,000 to $14,999 income bracket is the least frequent group with only 4 families (1.0%) belonging to this category.
| Income Bracket | # Families | % Families |
| Less than $10,000 | 16 | 4.0% |
| $10,000 to $14,999 | 4 | 1.0% |
| $15,000 to $24,999 | 5 | 1.3% |
| $25,000 to $34,999 | 30 | 7.6% |
| $35,000 to $49,999 | 15 | 3.8% |
| $50,000 to $74,999 | 22 | 5.6% |
| $75,000 to $99,999 | 85 | 21.5% |
| $100,000 to $149,999 | 104 | 26.3% |
| $150,000 to $199,999 | 53 | 13.4% |
| $200,000+ | 62 | 15.7% |
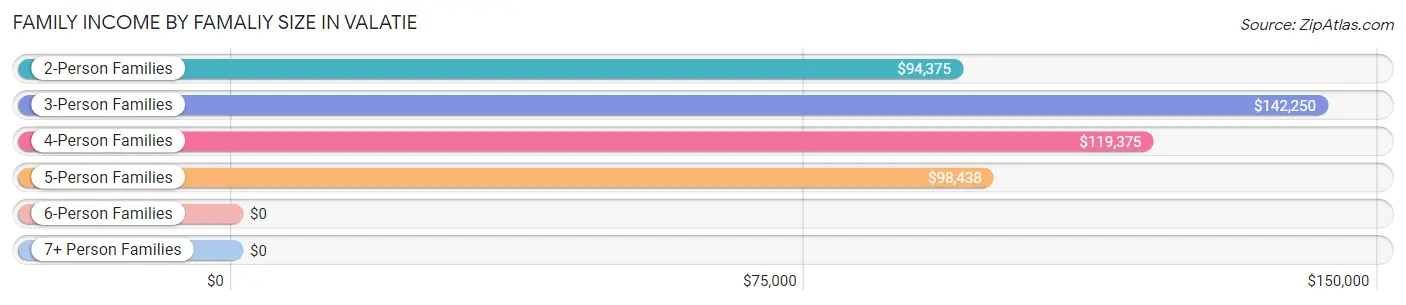
Family Income by Famaliy Size in Valatie
3-person families (134 | 33.8%) account for the highest median family income in Valatie with $142,250 per family, while 3-person families (134 | 33.8%) have the highest median income of $47,417 per family member.
| Income Bracket | # Families | Median Income |
| 2-Person Families | 155 (39.1%) | $94,375 |
| 3-Person Families | 134 (33.8%) | $142,250 |
| 4-Person Families | 73 (18.4%) | $119,375 |
| 5-Person Families | 25 (6.3%) | $98,438 |
| 6-Person Families | 0 (0.0%) | $0 |
| 7+ Person Families | 9 (2.3%) | $0 |
| Total | 396 (100.0%) | $117,000 |
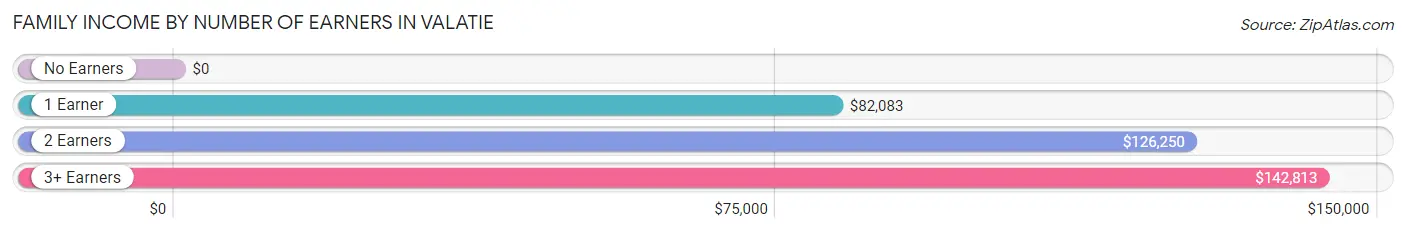
Family Income by Number of Earners in Valatie
| Number of Earners | # Families | Median Income |
| No Earners | 61 (15.4%) | $0 |
| 1 Earner | 87 (22.0%) | $82,083 |
| 2 Earners | 187 (47.2%) | $126,250 |
| 3+ Earners | 61 (15.4%) | $142,813 |
| Total | 396 (100.0%) | $117,000 |
Household Income in Valatie
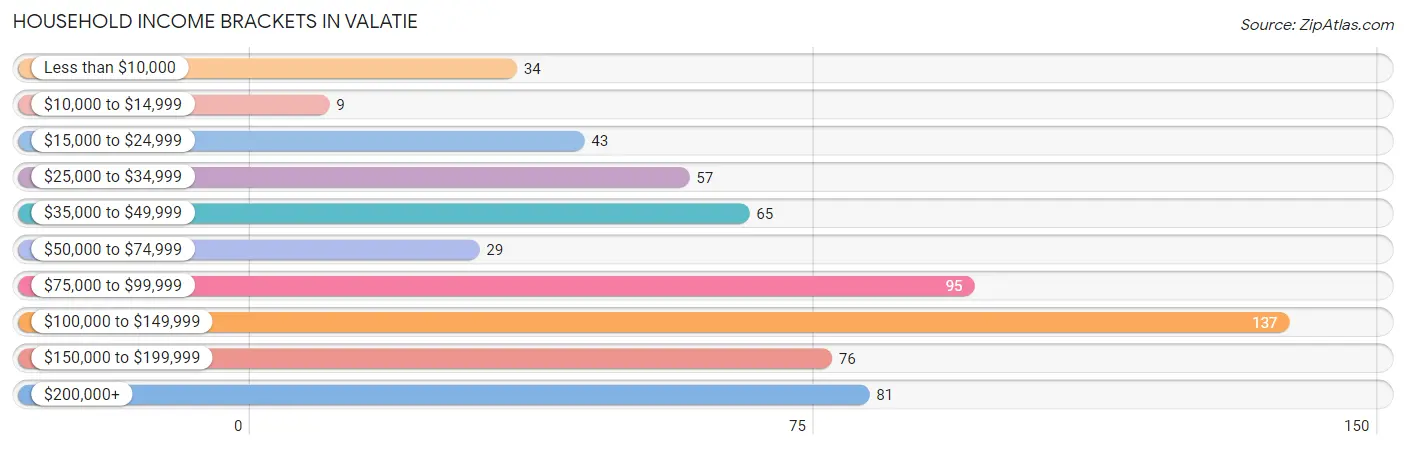
Household Income Brackets in Valatie
With 137 households falling in the category, the $100,000 to $149,999 income range is the most frequent in Valatie, accounting for 21.9% of all households. In contrast, only 9 households (1.4%) fall into the $10,000 to $14,999 income bracket, making it the least populous group.
| Income Bracket | # Households | % Households |
| Less than $10,000 | 34 | 5.4% |
| $10,000 to $14,999 | 9 | 1.4% |
| $15,000 to $24,999 | 43 | 6.9% |
| $25,000 to $34,999 | 57 | 9.1% |
| $35,000 to $49,999 | 65 | 10.4% |
| $50,000 to $74,999 | 29 | 4.6% |
| $75,000 to $99,999 | 95 | 15.2% |
| $100,000 to $149,999 | 137 | 21.9% |
| $150,000 to $199,999 | 76 | 12.1% |
| $200,000+ | 81 | 12.9% |
Household Income by Householder Age in Valatie
The median household income in Valatie is $93,824, with the highest median household income of $127,813 found in the 45 to 64 years age bracket for the primary householder. A total of 234 households (37.4%) fall into this category. Meanwhile, the 15 to 24 years age bracket for the primary householder has the lowest median household income of $0, with 3 households (0.5%) in this group.
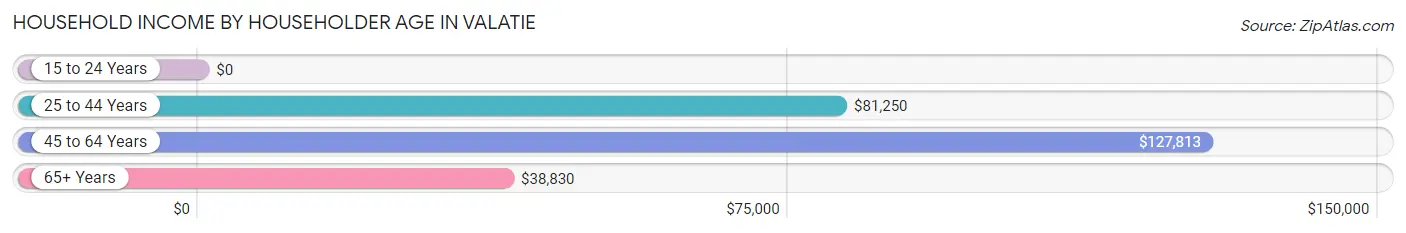
| Income Bracket | # Households | Median Income |
| 15 to 24 Years | 3 (0.5%) | $0 |
| 25 to 44 Years | 149 (23.8%) | $81,250 |
| 45 to 64 Years | 234 (37.4%) | $127,813 |
| 65+ Years | 240 (38.3%) | $38,830 |
| Total | 626 (100.0%) | $93,824 |
Poverty in Valatie
Income Below Poverty by Sex and Age in Valatie
With 7.6% poverty level for males and 6.9% for females among the residents of Valatie, under 5 year old males and under 5 year old females are the most vulnerable to poverty, with 22 males (73.3%) and 6 females (20.7%) in their respective age groups living below the poverty level.
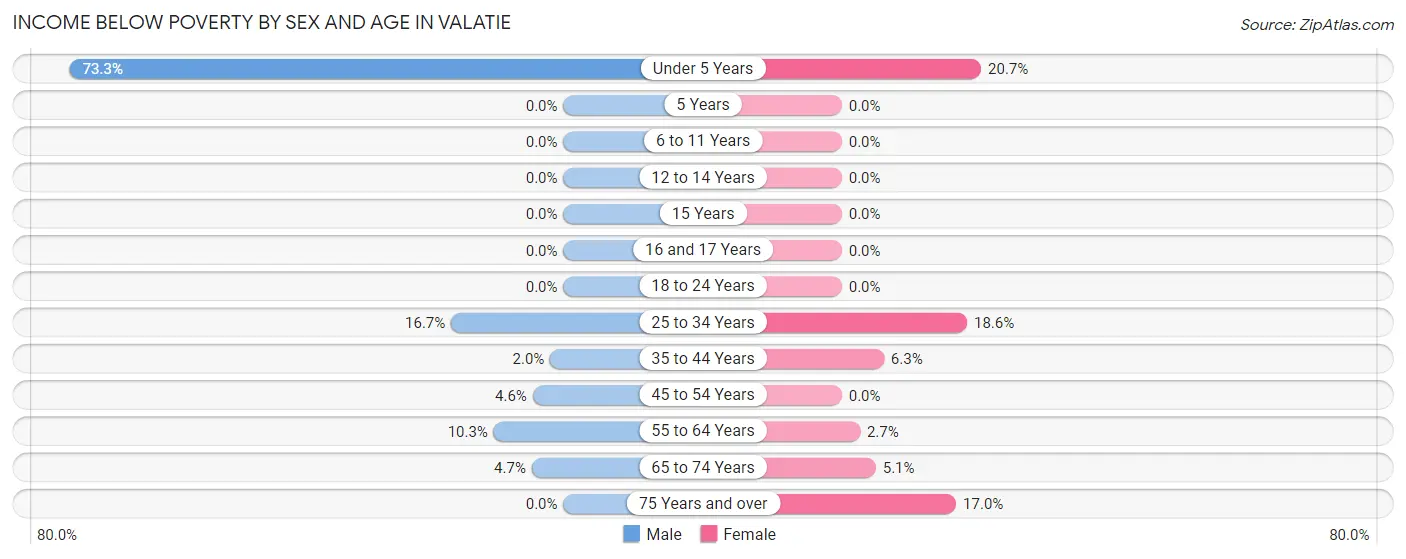
| Age Bracket | Male | Female |
| Under 5 Years | 22 (73.3%) | 6 (20.7%) |
| 5 Years | 0 (0.0%) | 0 (0.0%) |
| 6 to 11 Years | 0 (0.0%) | 0 (0.0%) |
| 12 to 14 Years | 0 (0.0%) | 0 (0.0%) |
| 15 Years | 0 (0.0%) | 0 (0.0%) |
| 16 and 17 Years | 0 (0.0%) | 0 (0.0%) |
| 18 to 24 Years | 0 (0.0%) | 0 (0.0%) |
| 25 to 34 Years | 16 (16.7%) | 16 (18.6%) |
| 35 to 44 Years | 2 (2.0%) | 3 (6.2%) |
| 45 to 54 Years | 7 (4.5%) | 0 (0.0%) |
| 55 to 64 Years | 9 (10.3%) | 2 (2.7%) |
| 65 to 74 Years | 3 (4.7%) | 5 (5.1%) |
| 75 Years and over | 0 (0.0%) | 18 (17.0%) |
| Total | 59 (7.6%) | 50 (6.9%) |
Income Above Poverty by Sex and Age in Valatie
According to the poverty statistics in Valatie, males aged 5 years and females aged 5 years are the age groups that are most secure financially, with 100.0% of males and 100.0% of females in these age groups living above the poverty line.
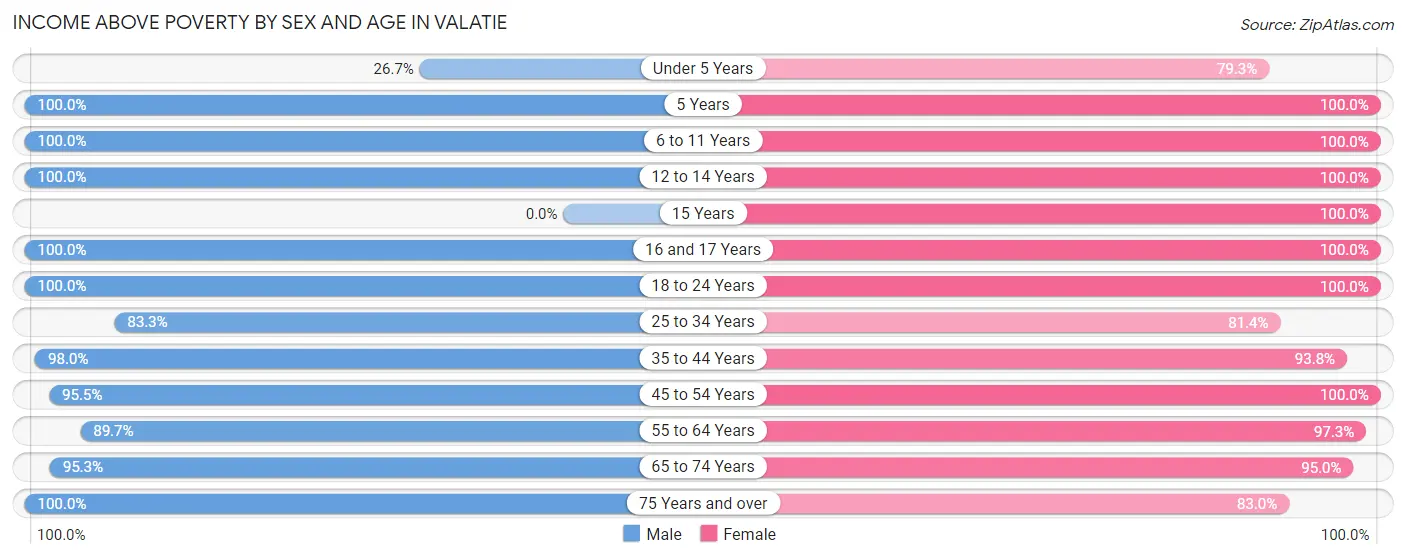
| Age Bracket | Male | Female |
| Under 5 Years | 8 (26.7%) | 23 (79.3%) |
| 5 Years | 9 (100.0%) | 23 (100.0%) |
| 6 to 11 Years | 39 (100.0%) | 68 (100.0%) |
| 12 to 14 Years | 60 (100.0%) | 9 (100.0%) |
| 15 Years | 0 (0.0%) | 19 (100.0%) |
| 16 and 17 Years | 30 (100.0%) | 29 (100.0%) |
| 18 to 24 Years | 44 (100.0%) | 24 (100.0%) |
| 25 to 34 Years | 80 (83.3%) | 70 (81.4%) |
| 35 to 44 Years | 100 (98.0%) | 45 (93.8%) |
| 45 to 54 Years | 147 (95.5%) | 107 (100.0%) |
| 55 to 64 Years | 78 (89.7%) | 72 (97.3%) |
| 65 to 74 Years | 61 (95.3%) | 94 (95.0%) |
| 75 Years and over | 62 (100.0%) | 88 (83.0%) |
| Total | 718 (92.4%) | 671 (93.1%) |
Income Below Poverty Among Married-Couple Families in Valatie
The poverty statistics for married-couple families in Valatie show that 6.6% or 20 of the total 303 families live below the poverty line. Families with 1 or 2 children have the highest poverty rate of 16.1%, comprising of 18 families. On the other hand, families with 3 or 4 children have the lowest poverty rate of 0.0%, which includes 0 families.
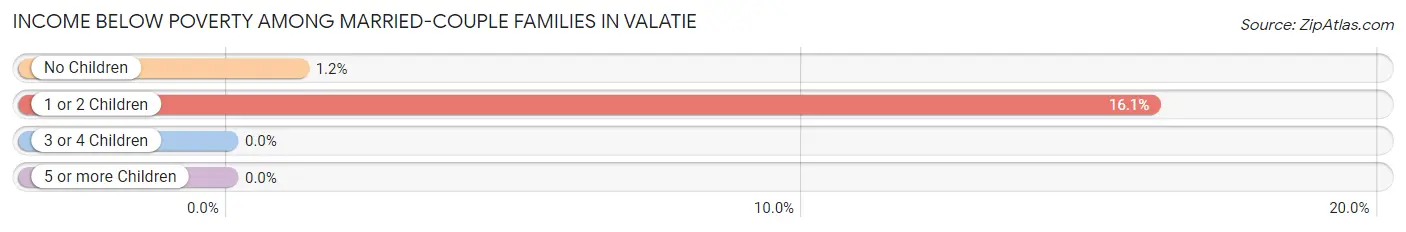
| Children | Above Poverty | Below Poverty |
| No Children | 160 (98.8%) | 2 (1.2%) |
| 1 or 2 Children | 94 (83.9%) | 18 (16.1%) |
| 3 or 4 Children | 29 (100.0%) | 0 (0.0%) |
| 5 or more Children | 0 (0.0%) | 0 (0.0%) |
| Total | 283 (93.4%) | 20 (6.6%) |
Income Below Poverty Among Single-Parent Households in Valatie
| Children | Single Father | Single Mother |
| No Children | 0 (0.0%) | 0 (0.0%) |
| 1 or 2 Children | 0 (0.0%) | 0 (0.0%) |
| 3 or 4 Children | 0 (0.0%) | 0 (0.0%) |
| 5 or more Children | 0 (0.0%) | 0 (0.0%) |
| Total | 0 (0.0%) | 0 (0.0%) |
Income Below Poverty Among Married-Couple vs Single-Parent Households in Valatie
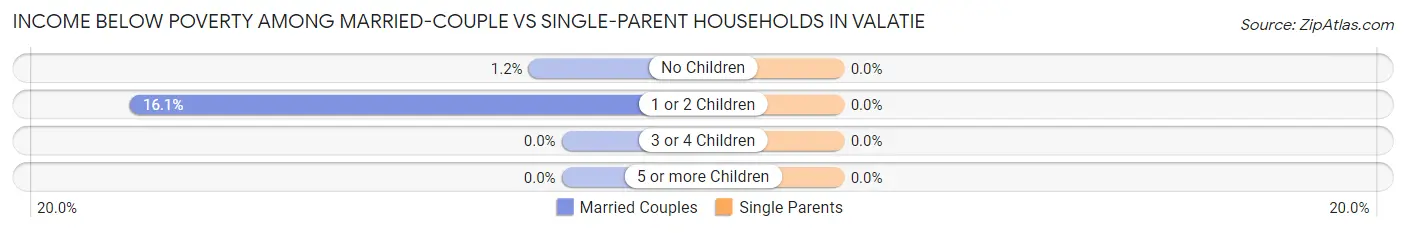
| Children | Married-Couple Families | Single-Parent Households |
| No Children | 2 (1.2%) | 0 (0.0%) |
| 1 or 2 Children | 18 (16.1%) | 0 (0.0%) |
| 3 or 4 Children | 0 (0.0%) | 0 (0.0%) |
| 5 or more Children | 0 (0.0%) | 0 (0.0%) |
| Total | 20 (6.6%) | 0 (0.0%) |
Race in Valatie
The most populous races in Valatie are White / Caucasian (1,407 | 84.4%), Hispanic or Latino (159 | 9.5%), and Some other Race (131 | 7.9%).
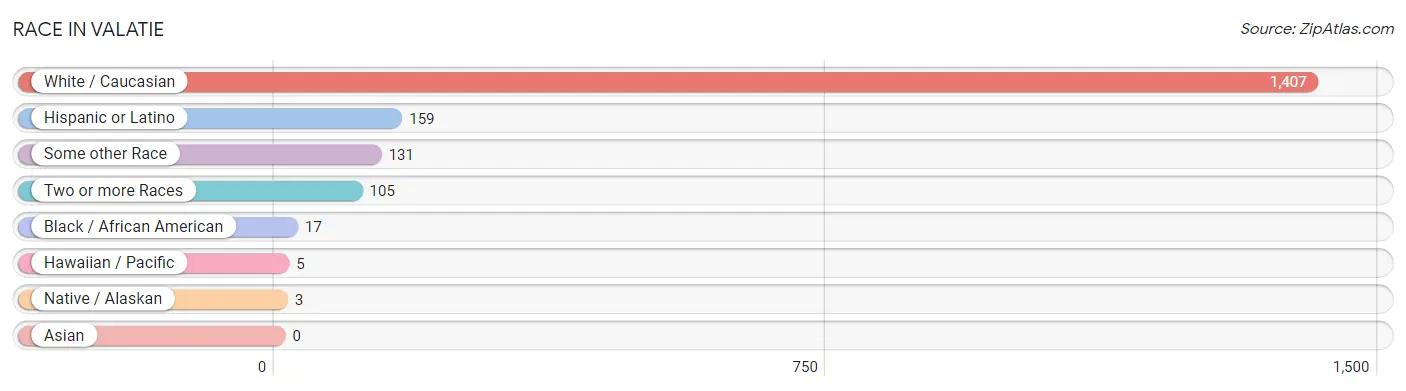
| Race | # Population | % Population |
| Asian | 0 | 0.0% |
| Black / African American | 17 | 1.0% |
| Hawaiian / Pacific | 5 | 0.3% |
| Hispanic or Latino | 159 | 9.5% |
| Native / Alaskan | 3 | 0.2% |
| White / Caucasian | 1,407 | 84.4% |
| Two or more Races | 105 | 6.3% |
| Some other Race | 131 | 7.9% |
| Total | 1,668 | 100.0% |
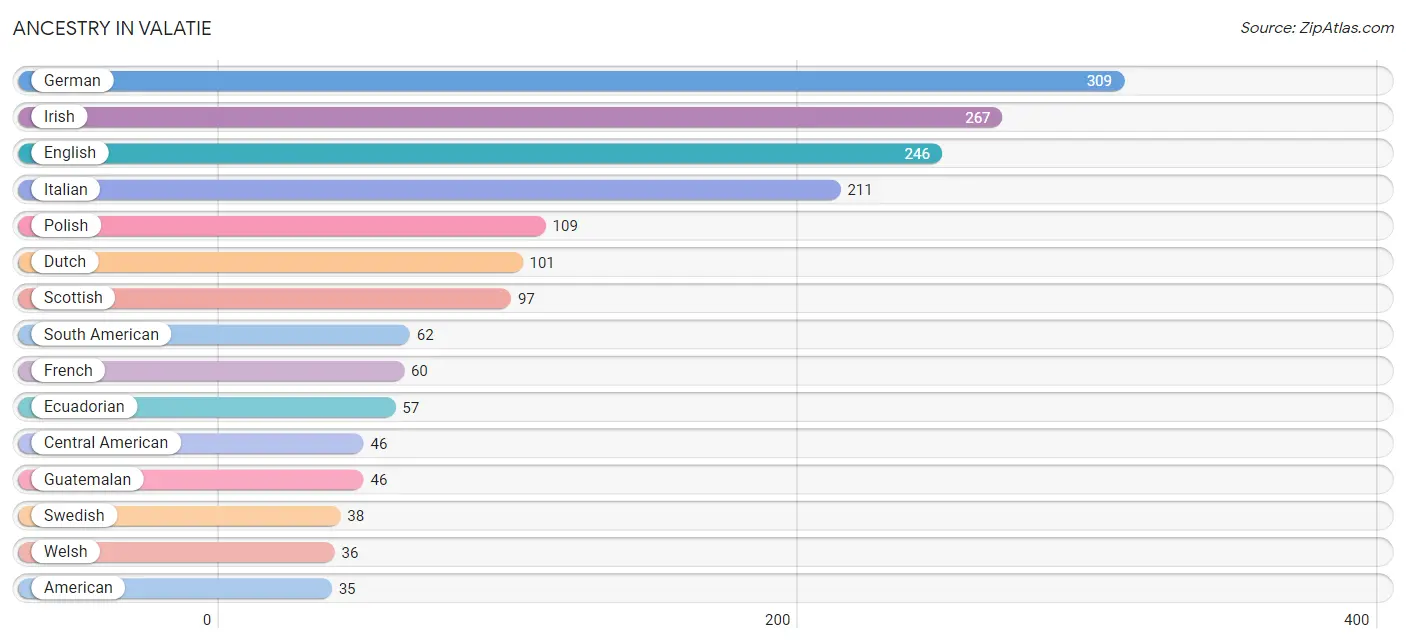
Ancestry in Valatie
The most populous ancestries reported in Valatie are German (309 | 18.5%), Irish (267 | 16.0%), English (246 | 14.7%), Italian (211 | 12.7%), and Polish (109 | 6.5%), together accounting for 68.5% of all Valatie residents.
| Ancestry | # Population | % Population |
| American | 35 | 2.1% |
| Argentinean | 5 | 0.3% |
| Austrian | 11 | 0.7% |
| British | 3 | 0.2% |
| Burmese | 22 | 1.3% |
| Central American | 46 | 2.8% |
| Cherokee | 1 | 0.1% |
| Danish | 6 | 0.4% |
| Dominican | 9 | 0.5% |
| Dutch | 101 | 6.1% |
| Eastern European | 3 | 0.2% |
| Ecuadorian | 57 | 3.4% |
| English | 246 | 14.7% |
| European | 33 | 2.0% |
| French | 60 | 3.6% |
| French Canadian | 8 | 0.5% |
| German | 309 | 18.5% |
| Guatemalan | 46 | 2.8% |
| Hungarian | 3 | 0.2% |
| Irish | 267 | 16.0% |
| Italian | 211 | 12.7% |
| Mexican | 26 | 1.6% |
| Native Hawaiian | 5 | 0.3% |
| Northern European | 4 | 0.2% |
| Norwegian | 5 | 0.3% |
| Polish | 109 | 6.5% |
| Puerto Rican | 2 | 0.1% |
| Russian | 7 | 0.4% |
| Scotch-Irish | 1 | 0.1% |
| Scottish | 97 | 5.8% |
| South African | 12 | 0.7% |
| South American | 62 | 3.7% |
| Subsaharan African | 24 | 1.4% |
| Swedish | 38 | 2.3% |
| Welsh | 36 | 2.2% | View All 35 Rows |
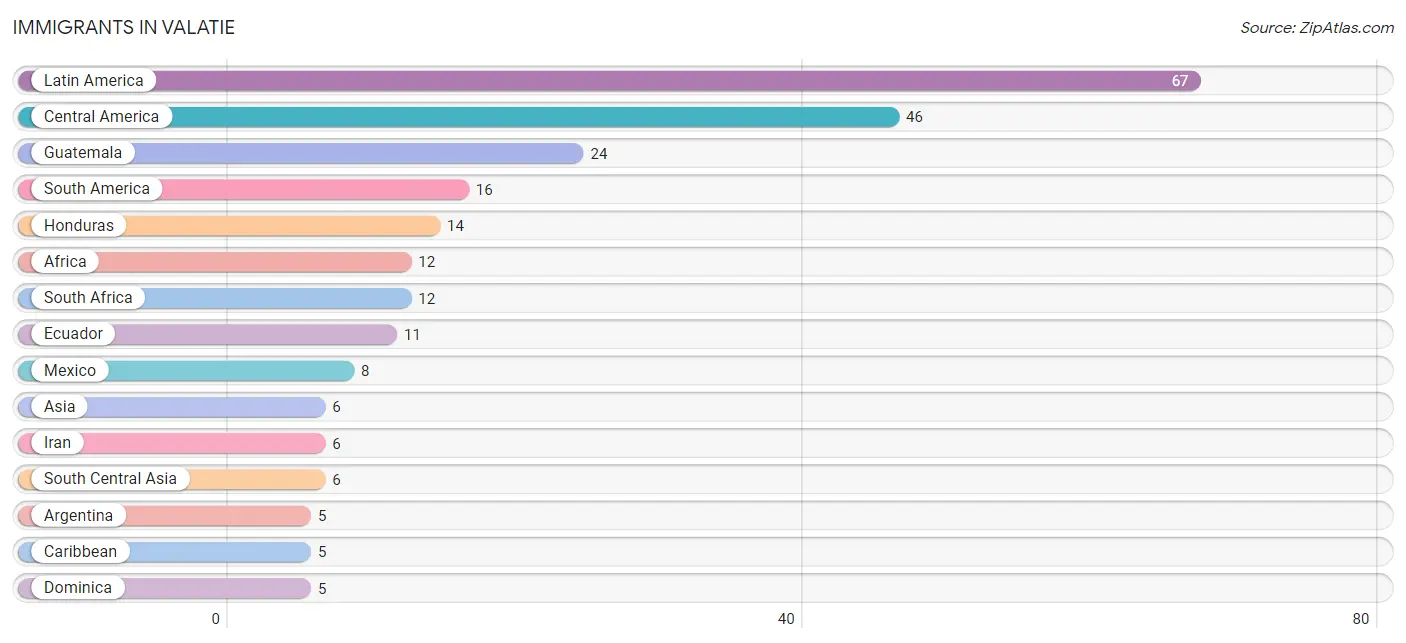
Immigrants in Valatie
The most numerous immigrant groups reported in Valatie came from Latin America (67 | 4.0%), Central America (46 | 2.8%), Guatemala (24 | 1.4%), South America (16 | 1.0%), and Honduras (14 | 0.8%), together accounting for 10.0% of all Valatie residents.
| Immigration Origin | # Population | % Population |
| Africa | 12 | 0.7% |
| Argentina | 5 | 0.3% |
| Asia | 6 | 0.4% |
| Caribbean | 5 | 0.3% |
| Central America | 46 | 2.8% |
| Dominica | 5 | 0.3% |
| Ecuador | 11 | 0.7% |
| Europe | 3 | 0.2% |
| Guatemala | 24 | 1.4% |
| Honduras | 14 | 0.8% |
| Iran | 6 | 0.4% |
| Latin America | 67 | 4.0% |
| Mexico | 8 | 0.5% |
| Northern Europe | 3 | 0.2% |
| South Africa | 12 | 0.7% |
| South America | 16 | 1.0% |
| South Central Asia | 6 | 0.4% | View All 17 Rows |
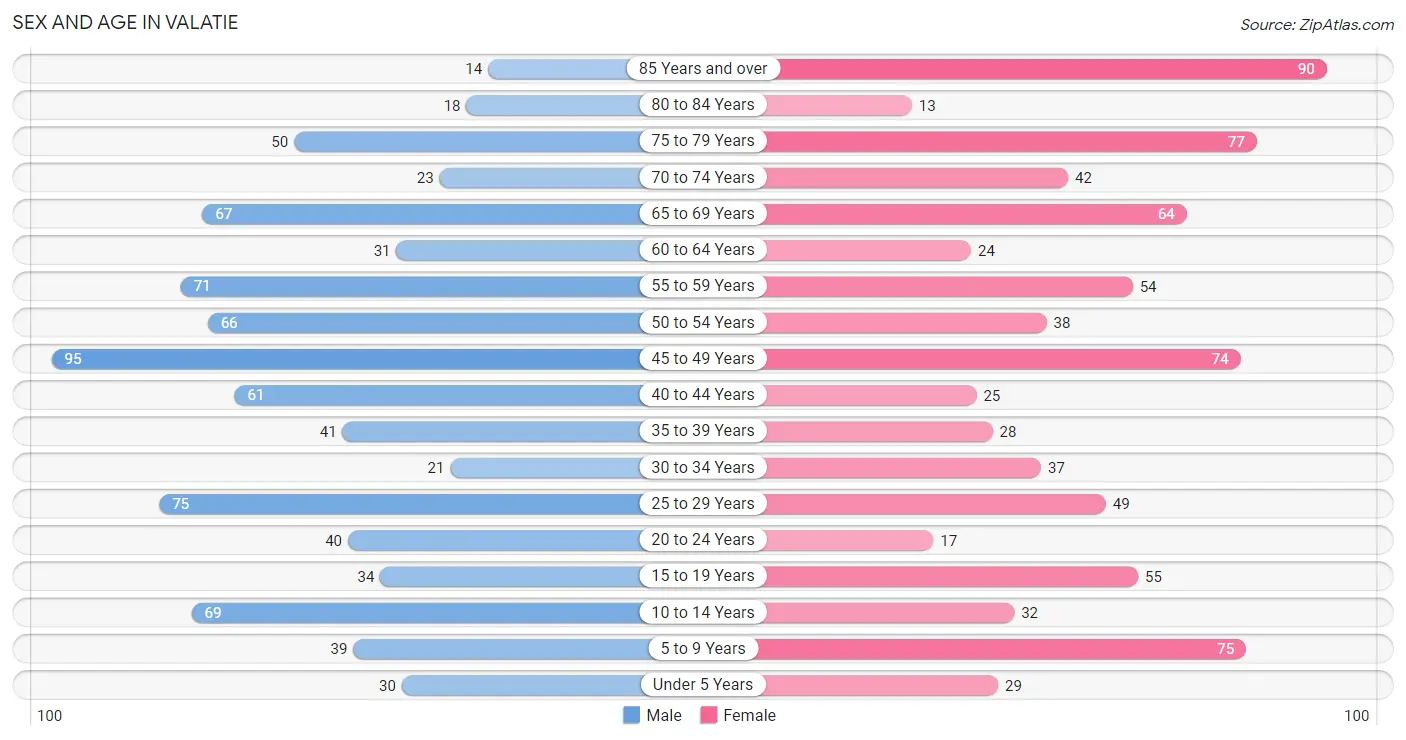
Sex and Age in Valatie
Sex and Age in Valatie
The most populous age groups in Valatie are 45 to 49 Years (95 | 11.2%) for men and 85 Years and over (90 | 10.9%) for women.
| Age Bracket | Male | Female |
| Under 5 Years | 30 (3.5%) | 29 (3.5%) |
| 5 to 9 Years | 39 (4.6%) | 75 (9.1%) |
| 10 to 14 Years | 69 (8.2%) | 32 (3.9%) |
| 15 to 19 Years | 34 (4.0%) | 55 (6.7%) |
| 20 to 24 Years | 40 (4.7%) | 17 (2.1%) |
| 25 to 29 Years | 75 (8.9%) | 49 (5.9%) |
| 30 to 34 Years | 21 (2.5%) | 37 (4.5%) |
| 35 to 39 Years | 41 (4.9%) | 28 (3.4%) |
| 40 to 44 Years | 61 (7.2%) | 25 (3.0%) |
| 45 to 49 Years | 95 (11.2%) | 74 (9.0%) |
| 50 to 54 Years | 66 (7.8%) | 38 (4.6%) |
| 55 to 59 Years | 71 (8.4%) | 54 (6.6%) |
| 60 to 64 Years | 31 (3.7%) | 24 (2.9%) |
| 65 to 69 Years | 67 (7.9%) | 64 (7.8%) |
| 70 to 74 Years | 23 (2.7%) | 42 (5.1%) |
| 75 to 79 Years | 50 (5.9%) | 77 (9.4%) |
| 80 to 84 Years | 18 (2.1%) | 13 (1.6%) |
| 85 Years and over | 14 (1.7%) | 90 (10.9%) |
| Total | 845 (100.0%) | 823 (100.0%) |
Families and Households in Valatie
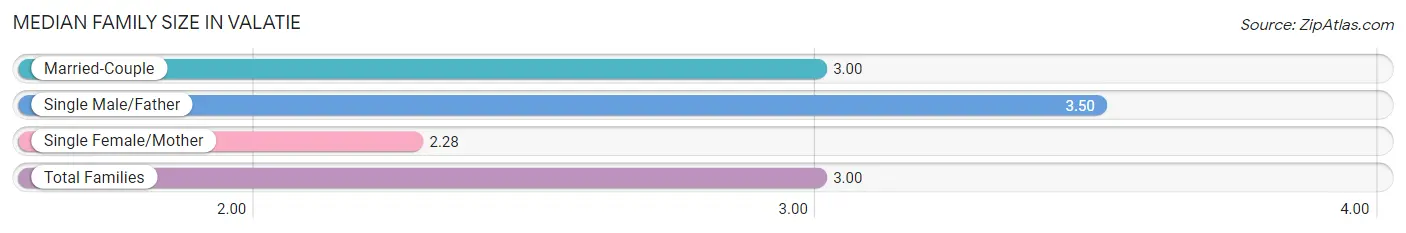
Median Family Size in Valatie
The median family size in Valatie is 3.00 persons per family, with single male/father families (54 | 13.6%) accounting for the largest median family size of 3.5 persons per family. On the other hand, single female/mother families (39 | 9.9%) represent the smallest median family size with 2.28 persons per family.
| Family Type | # Families | Family Size |
| Married-Couple | 303 (76.5%) | 3.00 |
| Single Male/Father | 54 (13.6%) | 3.50 |
| Single Female/Mother | 39 (9.9%) | 2.28 |
| Total Families | 396 (100.0%) | 3.00 |
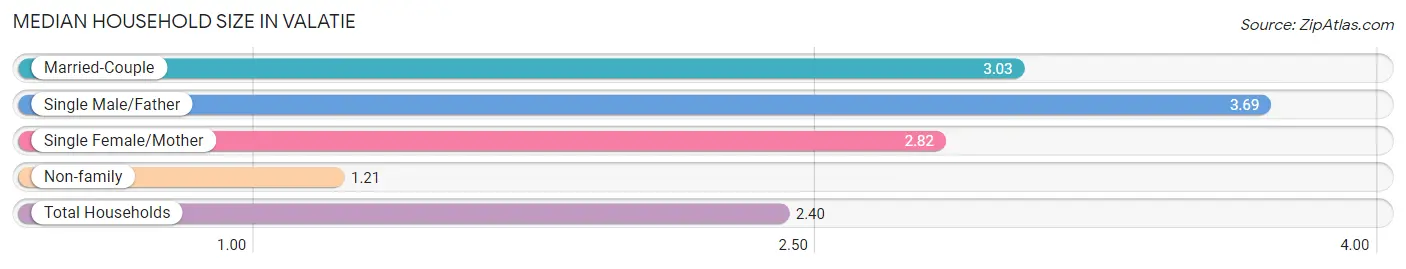
Median Household Size in Valatie
The median household size in Valatie is 2.40 persons per household, with single male/father households (54 | 8.6%) accounting for the largest median household size of 3.69 persons per household. non-family households (230 | 36.7%) represent the smallest median household size with 1.21 persons per household.
| Household Type | # Households | Household Size |
| Married-Couple | 303 (48.4%) | 3.03 |
| Single Male/Father | 54 (8.6%) | 3.69 |
| Single Female/Mother | 39 (6.2%) | 2.82 |
| Non-family | 230 (36.7%) | 1.21 |
| Total Households | 626 (100.0%) | 2.40 |
Household Size by Marriage Status in Valatie
Out of a total of 626 households in Valatie, 396 (63.3%) are family households, while 230 (36.7%) are nonfamily households. The most numerous type of family households are 3-person households, comprising 142, and the most common type of nonfamily households are 1-person households, comprising 197.
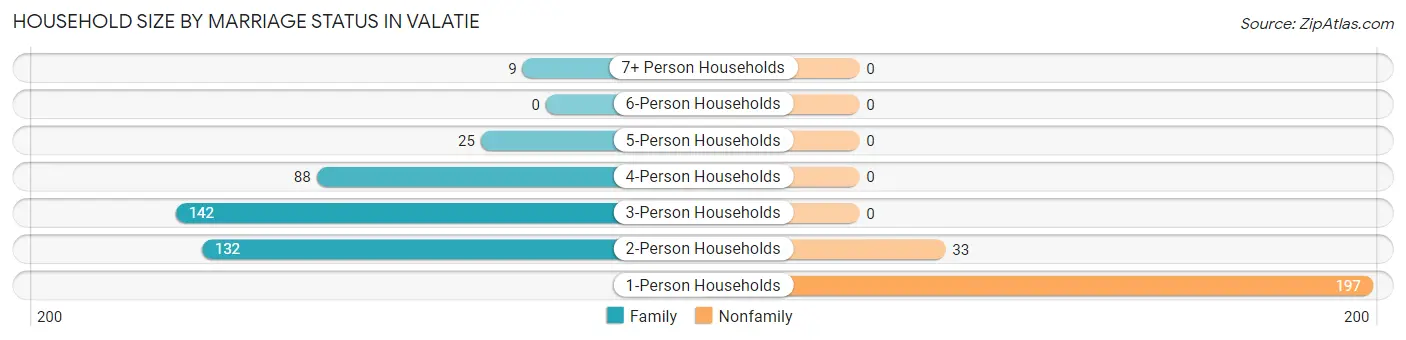
| Household Size | Family Households | Nonfamily Households |
| 1-Person Households | - | 197 (31.5%) |
| 2-Person Households | 132 (21.1%) | 33 (5.3%) |
| 3-Person Households | 142 (22.7%) | 0 (0.0%) |
| 4-Person Households | 88 (14.1%) | 0 (0.0%) |
| 5-Person Households | 25 (4.0%) | 0 (0.0%) |
| 6-Person Households | 0 (0.0%) | 0 (0.0%) |
| 7+ Person Households | 9 (1.4%) | 0 (0.0%) |
| Total | 396 (63.3%) | 230 (36.7%) |
Female Fertility in Valatie
Fertility by Age in Valatie
Average fertility rate in Valatie is 44.0 births per 1,000 women. Women in the age bracket of 20 to 34 years have the highest fertility rate with 126.0 births per 1,000 women. Women in the age bracket of 20 to 34 years acount for 100.0% of all women with births.
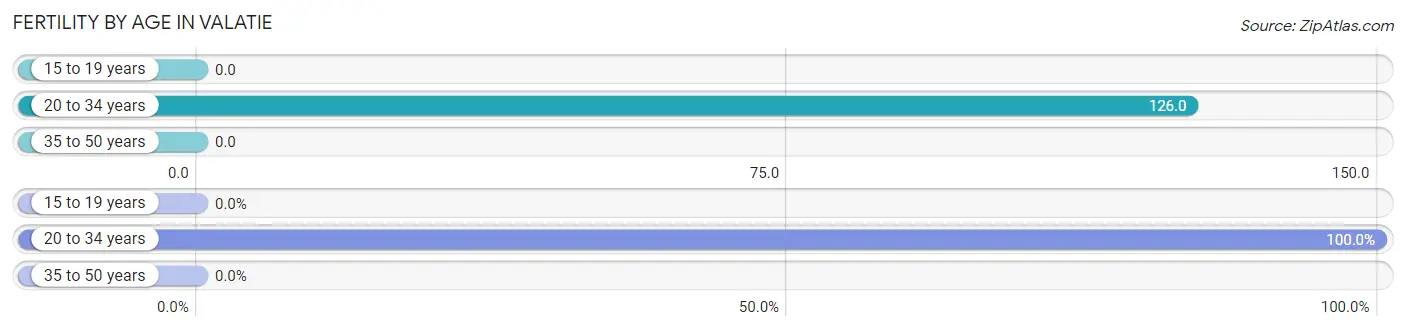
| Age Bracket | Women with Births | Births / 1,000 Women |
| 15 to 19 years | 0 (0.0%) | 0.0 |
| 20 to 34 years | 13 (100.0%) | 126.0 |
| 35 to 50 years | 0 (0.0%) | 0.0 |
| Total | 13 (100.0%) | 44.0 |
Fertility by Age by Marriage Status in Valatie
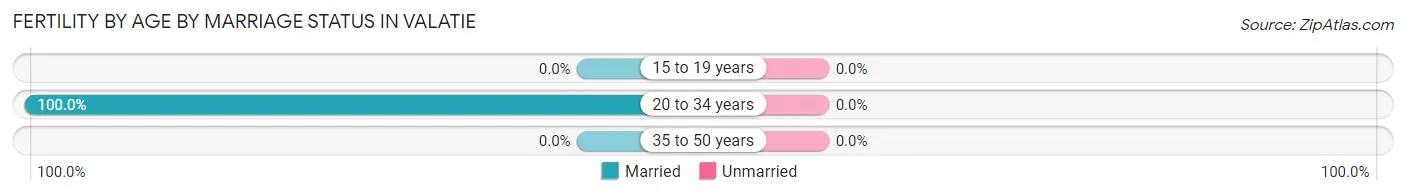
| Age Bracket | Married | Unmarried |
| 15 to 19 years | 0 (0.0%) | 0 (0.0%) |
| 20 to 34 years | 13 (100.0%) | 0 (0.0%) |
| 35 to 50 years | 0 (0.0%) | 0 (0.0%) |
| Total | 13 (100.0%) | 0 (0.0%) |
Fertility by Education in Valatie
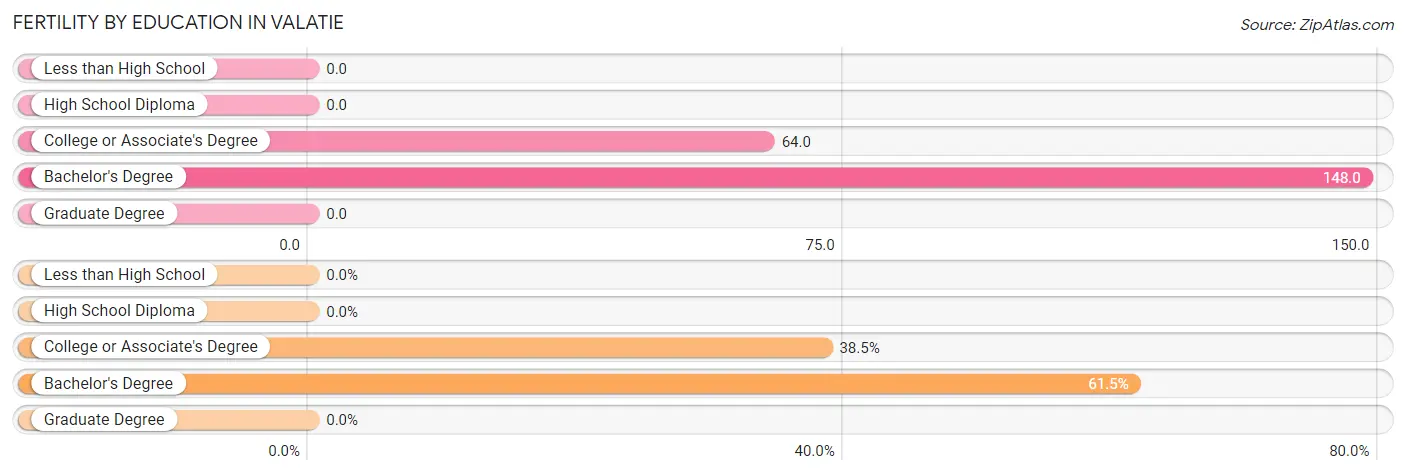
| Educational Attainment | Women with Births | Births / 1,000 Women |
| Less than High School | 0 (0.0%) | 0.0 |
| High School Diploma | 0 (0.0%) | 0.0 |
| College or Associate's Degree | 5 (38.5%) | 64.0 |
| Bachelor's Degree | 8 (61.5%) | 148.0 |
| Graduate Degree | 0 (0.0%) | 0.0 |
| Total | 13 (100.0%) | 44.0 |
Fertility by Education by Marriage Status in Valatie
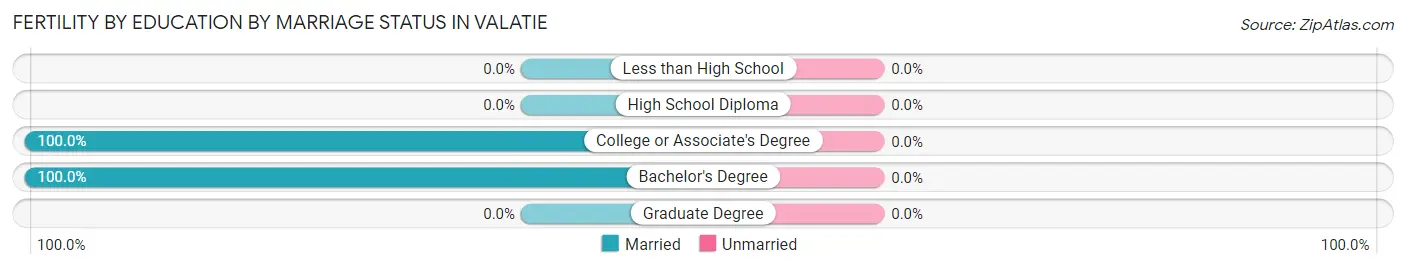
| Educational Attainment | Married | Unmarried |
| Less than High School | 0 (0.0%) | 0 (0.0%) |
| High School Diploma | 0 (0.0%) | 0 (0.0%) |
| College or Associate's Degree | 5 (100.0%) | 0 (0.0%) |
| Bachelor's Degree | 8 (100.0%) | 0 (0.0%) |
| Graduate Degree | 0 (0.0%) | 0 (0.0%) |
| Total | 13 (100.0%) | 0 (0.0%) |
Employment Characteristics in Valatie
Employment by Class of Employer in Valatie
Among the 715 employed individuals in Valatie, private company employees (353 | 49.4%), state government employees (128 | 17.9%), and local government employees (87 | 12.2%) make up the most common classes of employment.
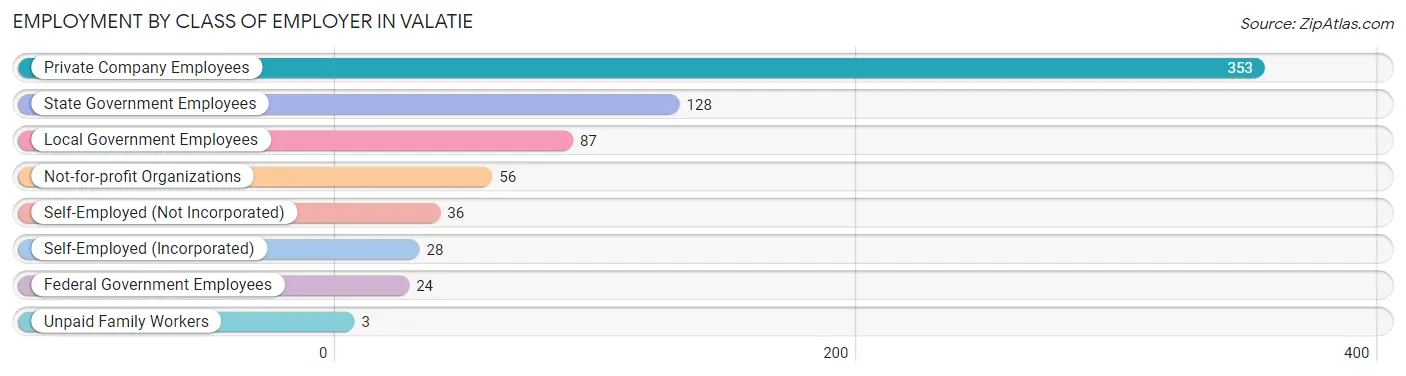
| Employer Class | # Employees | % Employees |
| Private Company Employees | 353 | 49.4% |
| Self-Employed (Incorporated) | 28 | 3.9% |
| Self-Employed (Not Incorporated) | 36 | 5.0% |
| Not-for-profit Organizations | 56 | 7.8% |
| Local Government Employees | 87 | 12.2% |
| State Government Employees | 128 | 17.9% |
| Federal Government Employees | 24 | 3.4% |
| Unpaid Family Workers | 3 | 0.4% |
| Total | 715 | 100.0% |
Employment Status by Age in Valatie
According to the labor force statistics for Valatie, out of the total population over 16 years of age (1,375), 56.3% or 774 individuals are in the labor force, with 7.1% or 55 of them unemployed. The age group with the highest labor force participation rate is 20 to 24 years, with 100.0% or 57 individuals in the labor force. Within the labor force, the 75 years and over age range has the highest percentage of unemployed individuals, with 50.0% or 4 of them being unemployed.
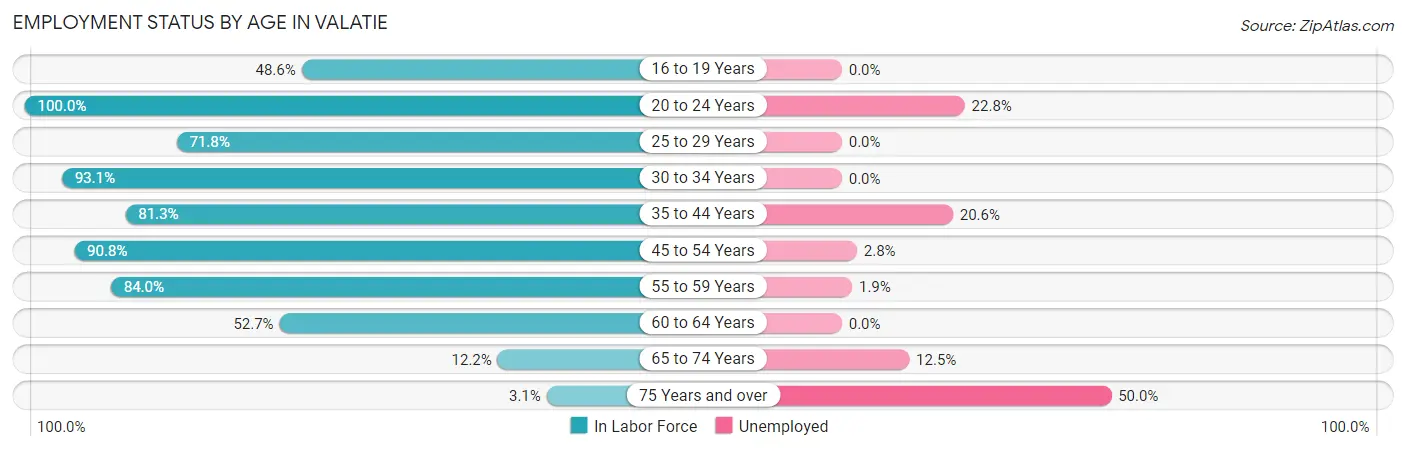
| Age Bracket | In Labor Force | Unemployed |
| 16 to 19 Years | 34 (48.6%) | 0 (0.0%) |
| 20 to 24 Years | 57 (100.0%) | 13 (22.8%) |
| 25 to 29 Years | 89 (71.8%) | 0 (0.0%) |
| 30 to 34 Years | 54 (93.1%) | 0 (0.0%) |
| 35 to 44 Years | 126 (81.3%) | 26 (20.6%) |
| 45 to 54 Years | 248 (90.8%) | 7 (2.8%) |
| 55 to 59 Years | 105 (84.0%) | 2 (1.9%) |
| 60 to 64 Years | 29 (52.7%) | 0 (0.0%) |
| 65 to 74 Years | 24 (12.2%) | 3 (12.5%) |
| 75 Years and over | 8 (3.1%) | 4 (50.0%) |
| Total | 774 (56.3%) | 55 (7.1%) |
Employment Status by Educational Attainment in Valatie
According to labor force statistics for Valatie, 82.4% of individuals (651) out of the total population between 25 and 64 years of age (790) are in the labor force, with 5.4% or 35 of them being unemployed. The group with the highest labor force participation rate are those with the educational attainment of bachelor's degree or higher, with 91.8% or 258 individuals in the labor force. Within the labor force, individuals with high school diploma education have the highest percentage of unemployment, with 13.9% or 30 of them being unemployed.
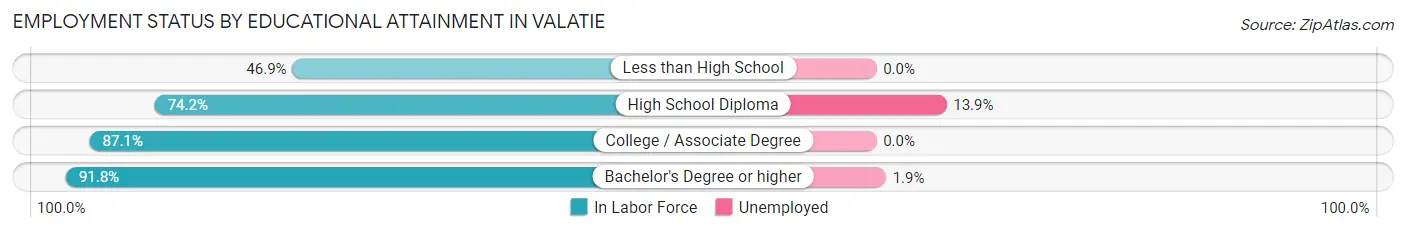
| Educational Attainment | In Labor Force | Unemployed |
| Less than High School | 15 (46.9%) | 0 (0.0%) |
| High School Diploma | 216 (74.2%) | 40 (13.9%) |
| College / Associate Degree | 162 (87.1%) | 0 (0.0%) |
| Bachelor's Degree or higher | 258 (91.8%) | 5 (1.9%) |
| Total | 651 (82.4%) | 43 (5.4%) |
Employment Occupations by Sex in Valatie
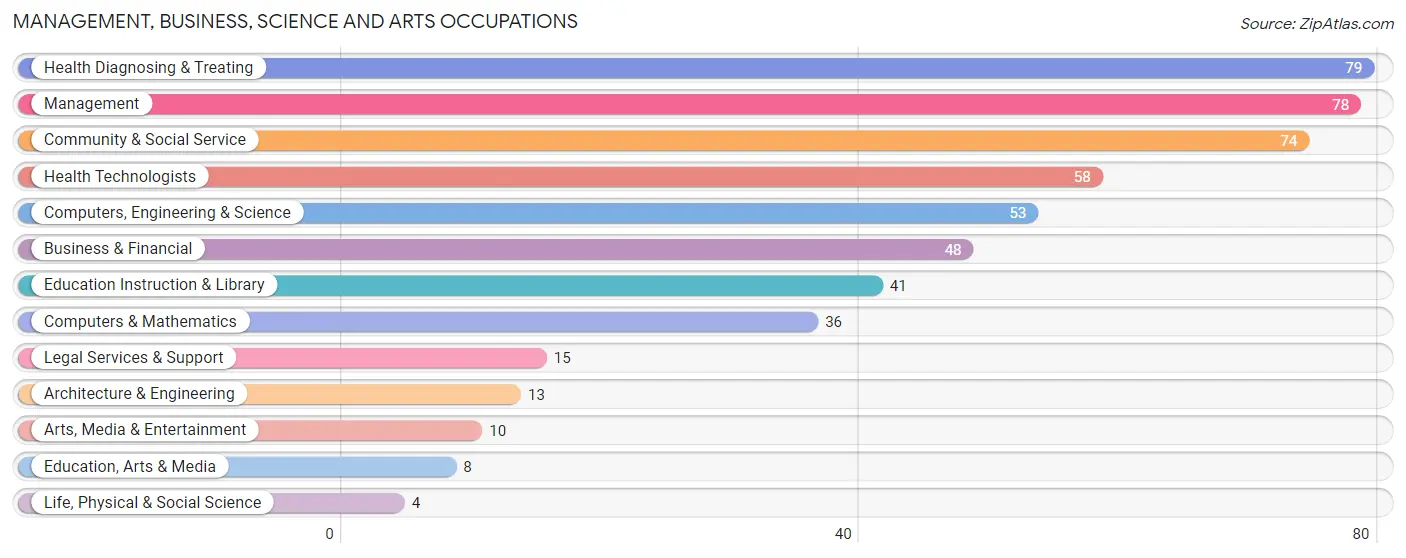
Management, Business, Science and Arts Occupations
The most common Management, Business, Science and Arts occupations in Valatie are Health Diagnosing & Treating (79 | 11.0%), Management (78 | 10.8%), Community & Social Service (74 | 10.3%), Health Technologists (58 | 8.1%), and Computers, Engineering & Science (53 | 7.4%).
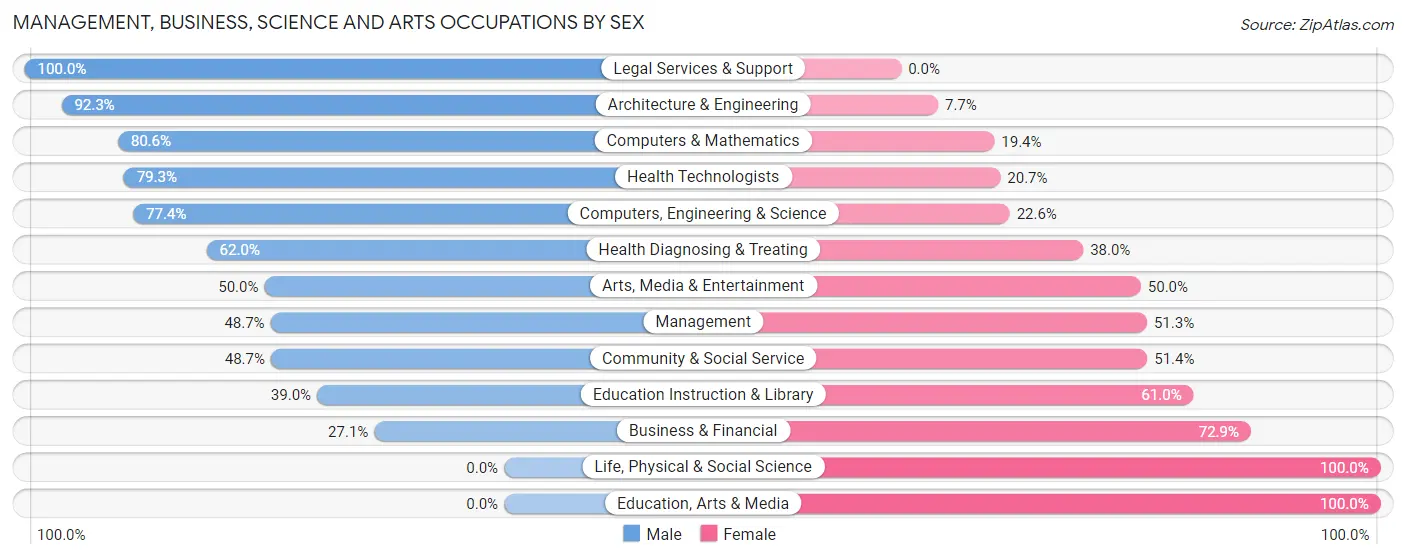
Management, Business, Science and Arts Occupations by Sex
Within the Management, Business, Science and Arts occupations in Valatie, the most male-oriented occupations are Legal Services & Support (100.0%), Architecture & Engineering (92.3%), and Computers & Mathematics (80.6%), while the most female-oriented occupations are Life, Physical & Social Science (100.0%), Education, Arts & Media (100.0%), and Business & Financial (72.9%).
| Occupation | Male | Female |
| Management | 38 (48.7%) | 40 (51.3%) |
| Business & Financial | 13 (27.1%) | 35 (72.9%) |
| Computers, Engineering & Science | 41 (77.4%) | 12 (22.6%) |
| Computers & Mathematics | 29 (80.6%) | 7 (19.4%) |
| Architecture & Engineering | 12 (92.3%) | 1 (7.7%) |
| Life, Physical & Social Science | 0 (0.0%) | 4 (100.0%) |
| Community & Social Service | 36 (48.6%) | 38 (51.3%) |
| Education, Arts & Media | 0 (0.0%) | 8 (100.0%) |
| Legal Services & Support | 15 (100.0%) | 0 (0.0%) |
| Education Instruction & Library | 16 (39.0%) | 25 (61.0%) |
| Arts, Media & Entertainment | 5 (50.0%) | 5 (50.0%) |
| Health Diagnosing & Treating | 49 (62.0%) | 30 (38.0%) |
| Health Technologists | 46 (79.3%) | 12 (20.7%) |
| Total (Category) | 177 (53.3%) | 155 (46.7%) |
| Total (Overall) | 428 (59.5%) | 291 (40.5%) |
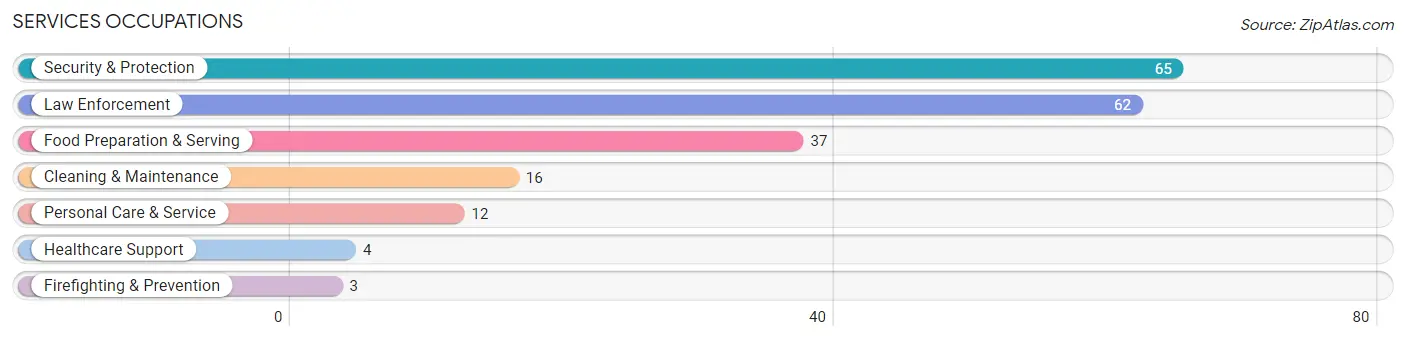
Services Occupations
The most common Services occupations in Valatie are Security & Protection (65 | 9.0%), Law Enforcement (62 | 8.6%), Food Preparation & Serving (37 | 5.1%), Cleaning & Maintenance (16 | 2.2%), and Personal Care & Service (12 | 1.7%).
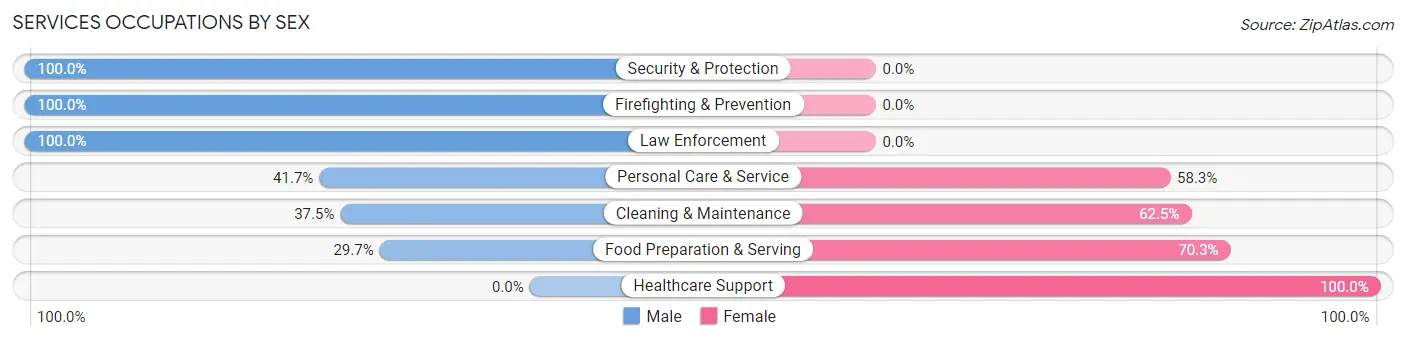
Services Occupations by Sex
Within the Services occupations in Valatie, the most male-oriented occupations are Security & Protection (100.0%), Firefighting & Prevention (100.0%), and Law Enforcement (100.0%), while the most female-oriented occupations are Healthcare Support (100.0%), Food Preparation & Serving (70.3%), and Cleaning & Maintenance (62.5%).
| Occupation | Male | Female |
| Healthcare Support | 0 (0.0%) | 4 (100.0%) |
| Security & Protection | 65 (100.0%) | 0 (0.0%) |
| Firefighting & Prevention | 3 (100.0%) | 0 (0.0%) |
| Law Enforcement | 62 (100.0%) | 0 (0.0%) |
| Food Preparation & Serving | 11 (29.7%) | 26 (70.3%) |
| Cleaning & Maintenance | 6 (37.5%) | 10 (62.5%) |
| Personal Care & Service | 5 (41.7%) | 7 (58.3%) |
| Total (Category) | 87 (64.9%) | 47 (35.1%) |
| Total (Overall) | 428 (59.5%) | 291 (40.5%) |
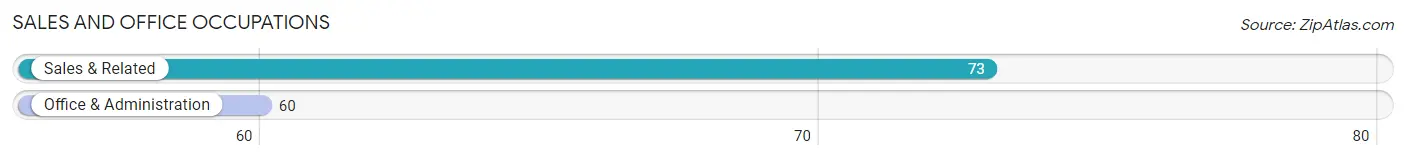
Sales and Office Occupations
The most common Sales and Office occupations in Valatie are Sales & Related (73 | 10.2%), and Office & Administration (60 | 8.3%).
Sales and Office Occupations by Sex
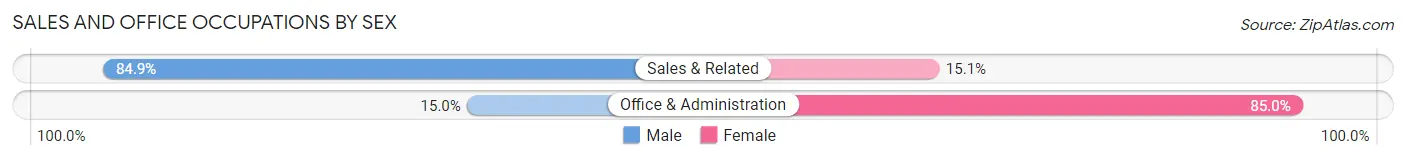
| Occupation | Male | Female |
| Sales & Related | 62 (84.9%) | 11 (15.1%) |
| Office & Administration | 9 (15.0%) | 51 (85.0%) |
| Total (Category) | 71 (53.4%) | 62 (46.6%) |
| Total (Overall) | 428 (59.5%) | 291 (40.5%) |
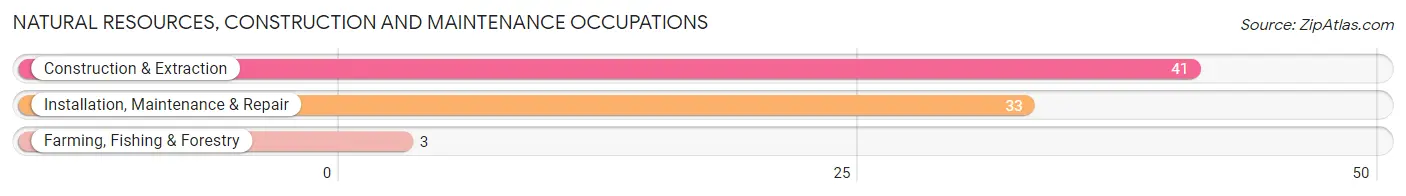
Natural Resources, Construction and Maintenance Occupations
The most common Natural Resources, Construction and Maintenance occupations in Valatie are Construction & Extraction (41 | 5.7%), Installation, Maintenance & Repair (33 | 4.6%), and Farming, Fishing & Forestry (3 | 0.4%).
Natural Resources, Construction and Maintenance Occupations by Sex
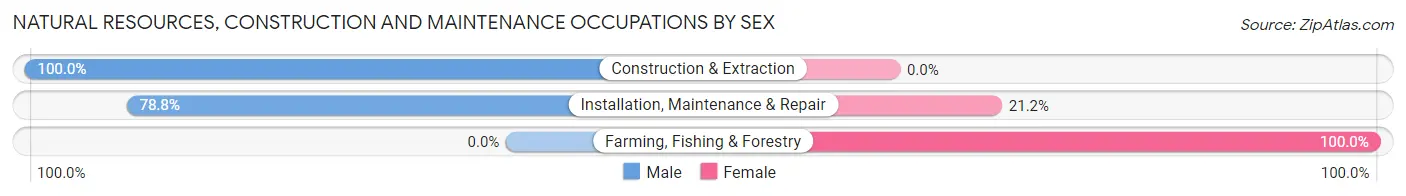
| Occupation | Male | Female |
| Farming, Fishing & Forestry | 0 (0.0%) | 3 (100.0%) |
| Construction & Extraction | 41 (100.0%) | 0 (0.0%) |
| Installation, Maintenance & Repair | 26 (78.8%) | 7 (21.2%) |
| Total (Category) | 67 (87.0%) | 10 (13.0%) |
| Total (Overall) | 428 (59.5%) | 291 (40.5%) |
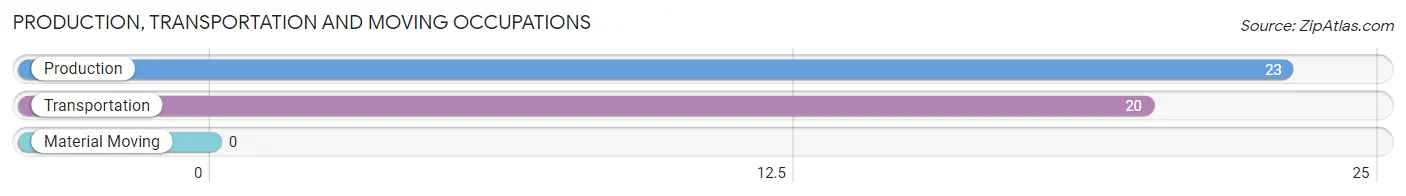
Production, Transportation and Moving Occupations
The most common Production, Transportation and Moving occupations in Valatie are Production (23 | 3.2%), and Transportation (20 | 2.8%).
Production, Transportation and Moving Occupations by Sex
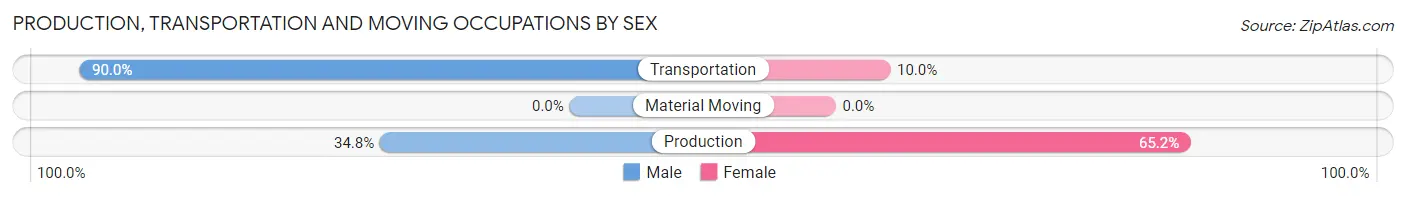
| Occupation | Male | Female |
| Production | 8 (34.8%) | 15 (65.2%) |
| Transportation | 18 (90.0%) | 2 (10.0%) |
| Material Moving | 0 (0.0%) | 0 (0.0%) |
| Total (Category) | 26 (60.5%) | 17 (39.5%) |
| Total (Overall) | 428 (59.5%) | 291 (40.5%) |
Employment Industries by Sex in Valatie
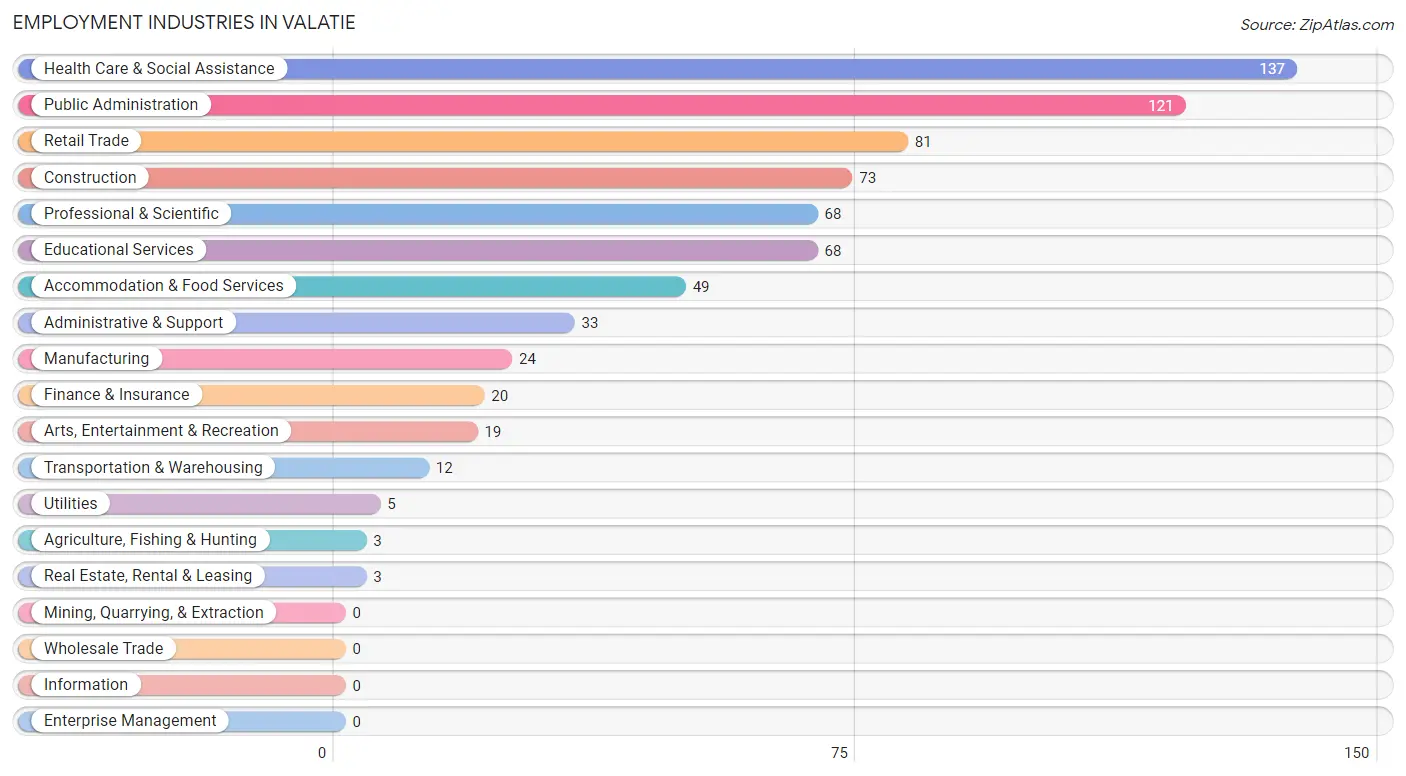
Employment Industries in Valatie
The major employment industries in Valatie include Health Care & Social Assistance (137 | 19.1%), Public Administration (121 | 16.8%), Retail Trade (81 | 11.3%), Construction (73 | 10.2%), and Professional & Scientific (68 | 9.5%).
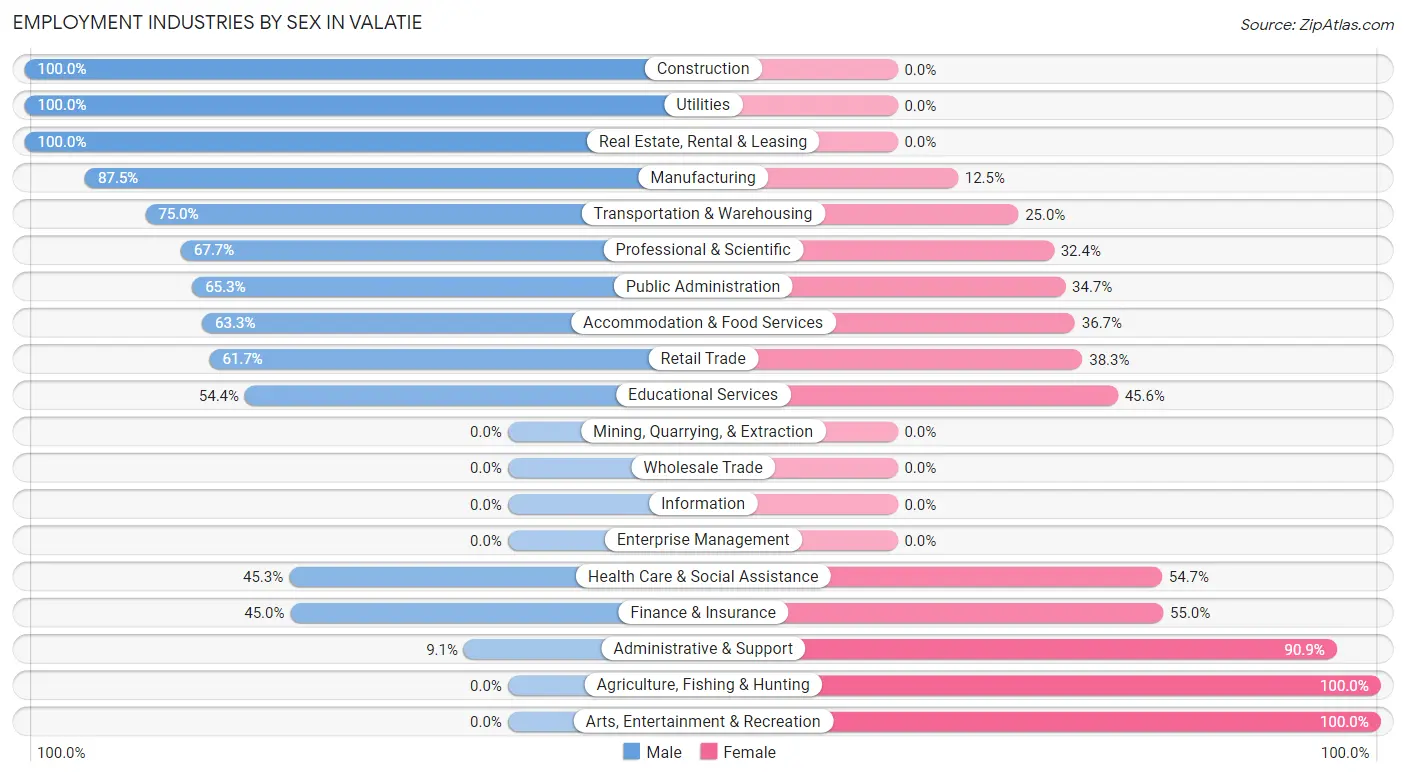
Employment Industries by Sex in Valatie
The Valatie industries that see more men than women are Construction (100.0%), Utilities (100.0%), and Real Estate, Rental & Leasing (100.0%), whereas the industries that tend to have a higher number of women are Agriculture, Fishing & Hunting (100.0%), Arts, Entertainment & Recreation (100.0%), and Administrative & Support (90.9%).
| Industry | Male | Female |
| Agriculture, Fishing & Hunting | 0 (0.0%) | 3 (100.0%) |
| Mining, Quarrying, & Extraction | 0 (0.0%) | 0 (0.0%) |
| Construction | 73 (100.0%) | 0 (0.0%) |
| Manufacturing | 21 (87.5%) | 3 (12.5%) |
| Wholesale Trade | 0 (0.0%) | 0 (0.0%) |
| Retail Trade | 50 (61.7%) | 31 (38.3%) |
| Transportation & Warehousing | 9 (75.0%) | 3 (25.0%) |
| Utilities | 5 (100.0%) | 0 (0.0%) |
| Information | 0 (0.0%) | 0 (0.0%) |
| Finance & Insurance | 9 (45.0%) | 11 (55.0%) |
| Real Estate, Rental & Leasing | 3 (100.0%) | 0 (0.0%) |
| Professional & Scientific | 46 (67.6%) | 22 (32.4%) |
| Enterprise Management | 0 (0.0%) | 0 (0.0%) |
| Administrative & Support | 3 (9.1%) | 30 (90.9%) |
| Educational Services | 37 (54.4%) | 31 (45.6%) |
| Health Care & Social Assistance | 62 (45.3%) | 75 (54.7%) |
| Arts, Entertainment & Recreation | 0 (0.0%) | 19 (100.0%) |
| Accommodation & Food Services | 31 (63.3%) | 18 (36.7%) |
| Public Administration | 79 (65.3%) | 42 (34.7%) |
| Total | 428 (59.5%) | 291 (40.5%) |
Education in Valatie
School Enrollment in Valatie
The most common levels of schooling among the 339 students in Valatie are high school (107 | 31.6%), elementary school (85 | 25.1%), and middle school (69 | 20.3%).
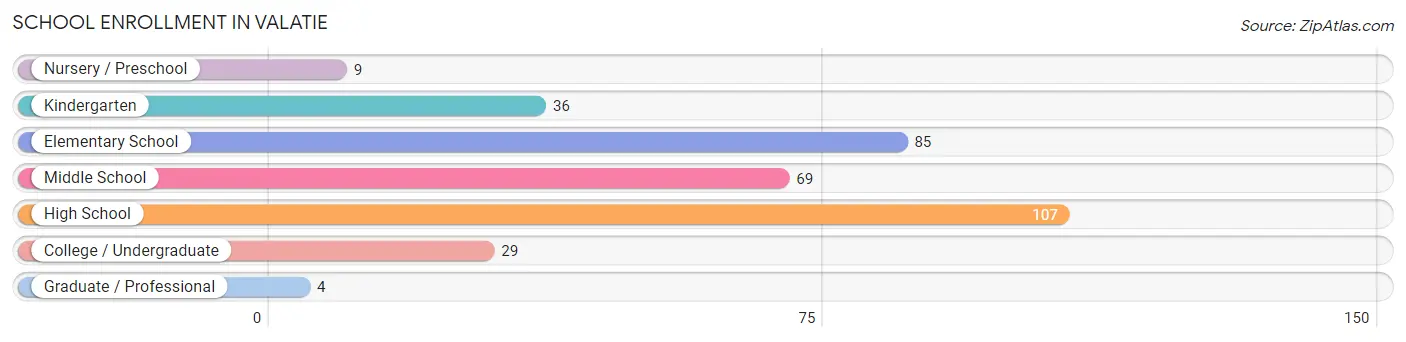
| School Level | # Students | % Students |
| Nursery / Preschool | 9 | 2.6% |
| Kindergarten | 36 | 10.6% |
| Elementary School | 85 | 25.1% |
| Middle School | 69 | 20.3% |
| High School | 107 | 31.6% |
| College / Undergraduate | 29 | 8.6% |
| Graduate / Professional | 4 | 1.2% |
| Total | 339 | 100.0% |
School Enrollment by Age by Funding Source in Valatie
Out of a total of 339 students who are enrolled in schools in Valatie, 19 (5.6%) attend a private institution, while the remaining 320 (94.4%) are enrolled in public schools. The age group of 3 to 4 year olds has the highest likelihood of being enrolled in private schools, with 9 (100.0% in the age bracket) enrolled. Conversely, the age group of 10 to 14 year olds has the lowest likelihood of being enrolled in a private school, with 101 (100.0% in the age bracket) attending a public institution.
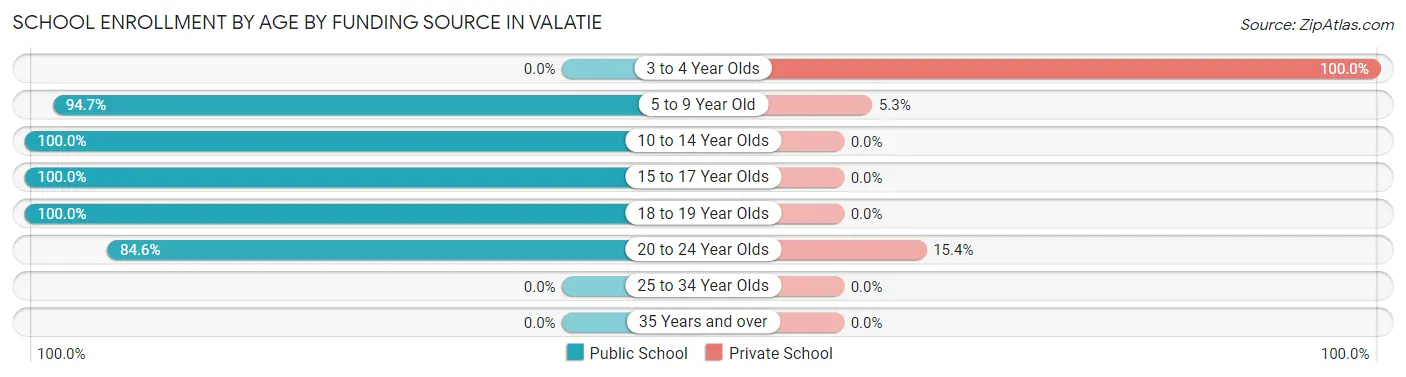
| Age Bracket | Public School | Private School |
| 3 to 4 Year Olds | 0 (0.0%) | 9 (100.0%) |
| 5 to 9 Year Old | 108 (94.7%) | 6 (5.3%) |
| 10 to 14 Year Olds | 101 (100.0%) | 0 (0.0%) |
| 15 to 17 Year Olds | 78 (100.0%) | 0 (0.0%) |
| 18 to 19 Year Olds | 11 (100.0%) | 0 (0.0%) |
| 20 to 24 Year Olds | 22 (84.6%) | 4 (15.4%) |
| 25 to 34 Year Olds | 0 (0.0%) | 0 (0.0%) |
| 35 Years and over | 0 (0.0%) | 0 (0.0%) |
| Total | 320 (94.4%) | 19 (5.6%) |
Educational Attainment by Field of Study in Valatie
Business (92 | 24.5%), science & technology (61 | 16.3%), education (44 | 11.7%), computers & mathematics (34 | 9.1%), and social sciences (29 | 7.7%) are the most common fields of study among 375 individuals in Valatie who have obtained a bachelor's degree or higher.
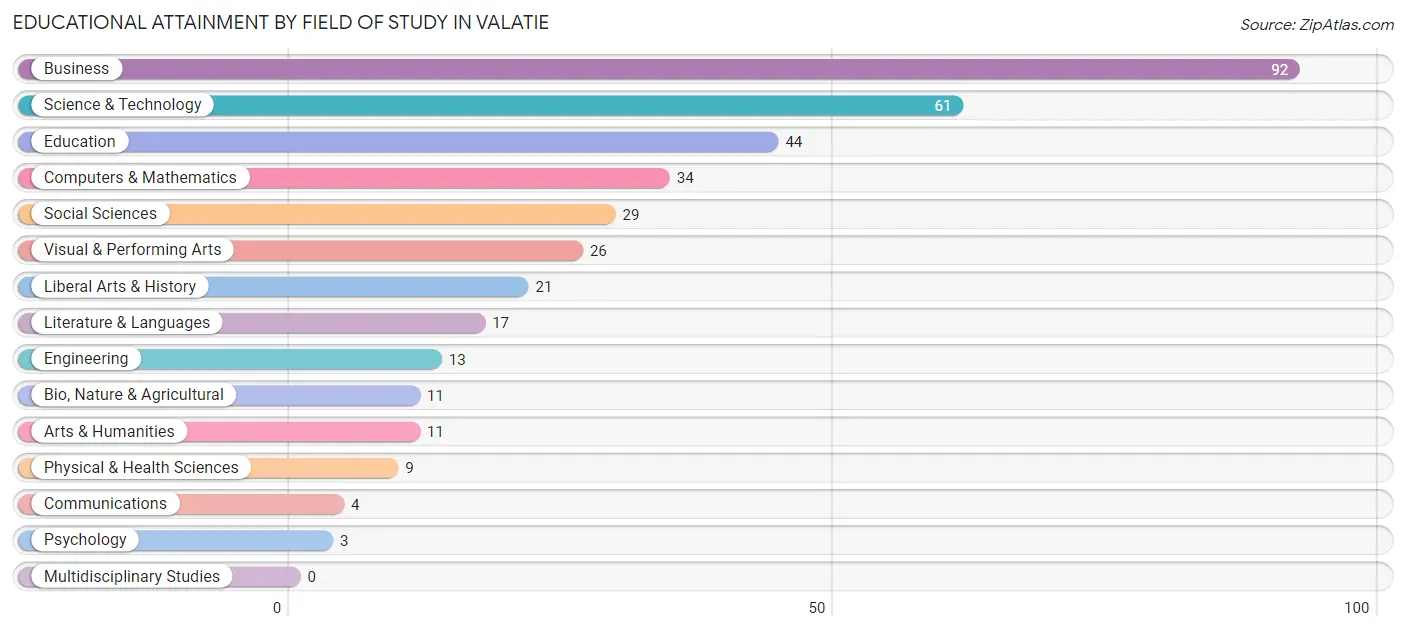
| Field of Study | # Graduates | % Graduates |
| Computers & Mathematics | 34 | 9.1% |
| Bio, Nature & Agricultural | 11 | 2.9% |
| Physical & Health Sciences | 9 | 2.4% |
| Psychology | 3 | 0.8% |
| Social Sciences | 29 | 7.7% |
| Engineering | 13 | 3.5% |
| Multidisciplinary Studies | 0 | 0.0% |
| Science & Technology | 61 | 16.3% |
| Business | 92 | 24.5% |
| Education | 44 | 11.7% |
| Literature & Languages | 17 | 4.5% |
| Liberal Arts & History | 21 | 5.6% |
| Visual & Performing Arts | 26 | 6.9% |
| Communications | 4 | 1.1% |
| Arts & Humanities | 11 | 2.9% |
| Total | 375 | 100.0% |
Transportation & Commute in Valatie
Vehicle Availability by Sex in Valatie
The most prevalent vehicle ownership categories in Valatie are males with 2 vehicles (147, accounting for 34.4%) and females with 2 vehicles (138, making up 51.2%).
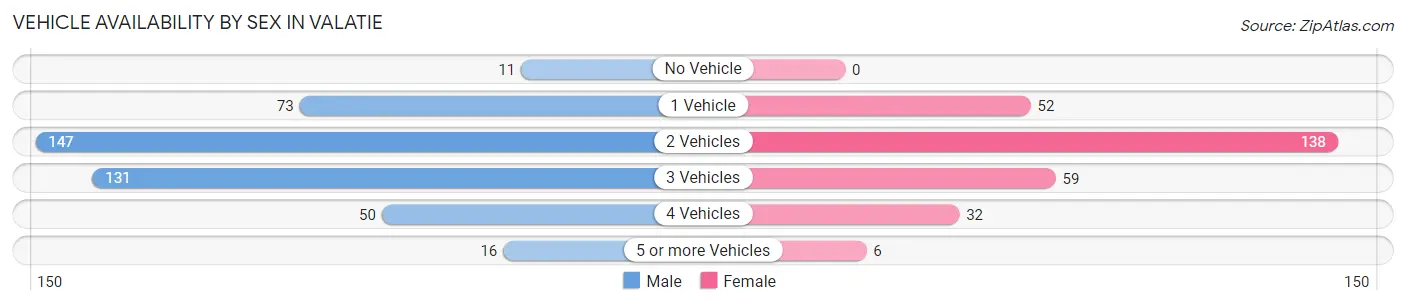
| Vehicles Available | Male | Female |
| No Vehicle | 11 (2.6%) | 0 (0.0%) |
| 1 Vehicle | 73 (17.1%) | 52 (18.1%) |
| 2 Vehicles | 147 (34.4%) | 138 (48.1%) |
| 3 Vehicles | 131 (30.6%) | 59 (20.6%) |
| 4 Vehicles | 50 (11.7%) | 32 (11.2%) |
| 5 or more Vehicles | 16 (3.7%) | 6 (2.1%) |
| Total | 428 (100.0%) | 287 (100.0%) |
Commute Time in Valatie
The most frequently occuring commute durations in Valatie are 30 to 34 minutes (180 commuters, 27.1%), 5 to 9 minutes (97 commuters, 14.6%), and less than 5 minutes (73 commuters, 11.0%).
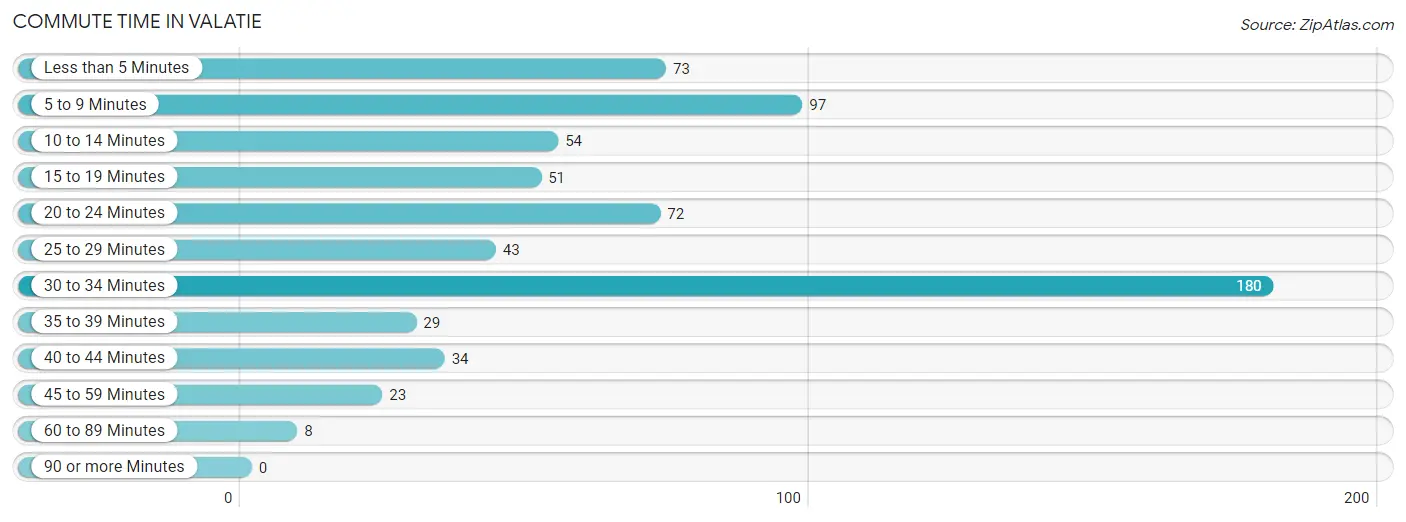
| Commute Time | # Commuters | % Commuters |
| Less than 5 Minutes | 73 | 11.0% |
| 5 to 9 Minutes | 97 | 14.6% |
| 10 to 14 Minutes | 54 | 8.1% |
| 15 to 19 Minutes | 51 | 7.7% |
| 20 to 24 Minutes | 72 | 10.8% |
| 25 to 29 Minutes | 43 | 6.5% |
| 30 to 34 Minutes | 180 | 27.1% |
| 35 to 39 Minutes | 29 | 4.4% |
| 40 to 44 Minutes | 34 | 5.1% |
| 45 to 59 Minutes | 23 | 3.5% |
| 60 to 89 Minutes | 8 | 1.2% |
| 90 or more Minutes | 0 | 0.0% |
Commute Time by Sex in Valatie
The most common commute times in Valatie are 30 to 34 minutes (101 commuters, 25.7%) for males and 30 to 34 minutes (79 commuters, 29.1%) for females.
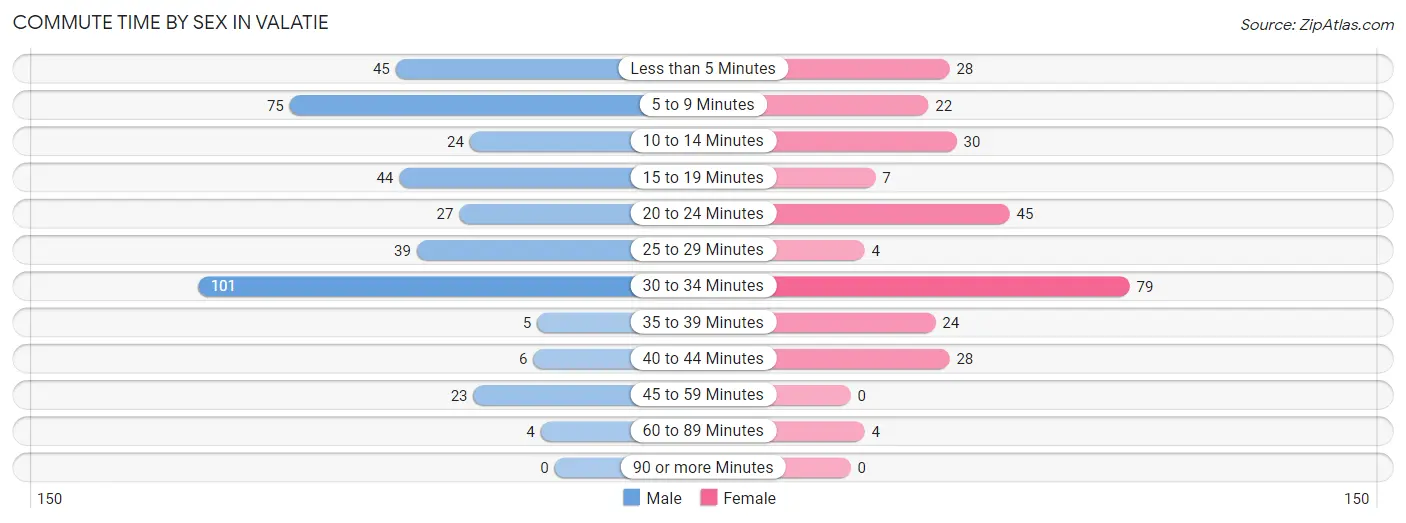
| Commute Time | Male | Female |
| Less than 5 Minutes | 45 (11.5%) | 28 (10.3%) |
| 5 to 9 Minutes | 75 (19.1%) | 22 (8.1%) |
| 10 to 14 Minutes | 24 (6.1%) | 30 (11.1%) |
| 15 to 19 Minutes | 44 (11.2%) | 7 (2.6%) |
| 20 to 24 Minutes | 27 (6.9%) | 45 (16.6%) |
| 25 to 29 Minutes | 39 (9.9%) | 4 (1.5%) |
| 30 to 34 Minutes | 101 (25.7%) | 79 (29.1%) |
| 35 to 39 Minutes | 5 (1.3%) | 24 (8.9%) |
| 40 to 44 Minutes | 6 (1.5%) | 28 (10.3%) |
| 45 to 59 Minutes | 23 (5.9%) | 0 (0.0%) |
| 60 to 89 Minutes | 4 (1.0%) | 4 (1.5%) |
| 90 or more Minutes | 0 (0.0%) | 0 (0.0%) |
Time of Departure to Work by Sex in Valatie
The most frequent times of departure to work in Valatie are 7:00 AM to 7:29 AM (103, 26.2%) for males and 7:00 AM to 7:29 AM (61, 22.5%) for females.
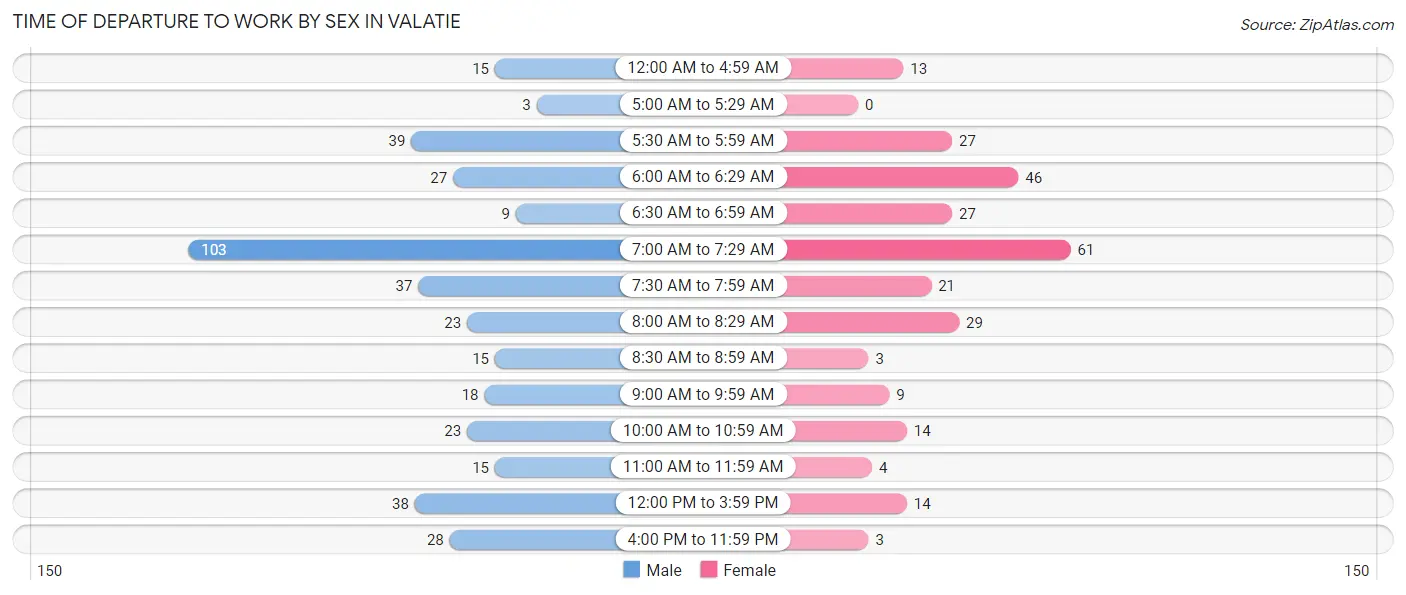
| Time of Departure | Male | Female |
| 12:00 AM to 4:59 AM | 15 (3.8%) | 13 (4.8%) |
| 5:00 AM to 5:29 AM | 3 (0.8%) | 0 (0.0%) |
| 5:30 AM to 5:59 AM | 39 (9.9%) | 27 (10.0%) |
| 6:00 AM to 6:29 AM | 27 (6.9%) | 46 (17.0%) |
| 6:30 AM to 6:59 AM | 9 (2.3%) | 27 (10.0%) |
| 7:00 AM to 7:29 AM | 103 (26.2%) | 61 (22.5%) |
| 7:30 AM to 7:59 AM | 37 (9.4%) | 21 (7.7%) |
| 8:00 AM to 8:29 AM | 23 (5.9%) | 29 (10.7%) |
| 8:30 AM to 8:59 AM | 15 (3.8%) | 3 (1.1%) |
| 9:00 AM to 9:59 AM | 18 (4.6%) | 9 (3.3%) |
| 10:00 AM to 10:59 AM | 23 (5.9%) | 14 (5.2%) |
| 11:00 AM to 11:59 AM | 15 (3.8%) | 4 (1.5%) |
| 12:00 PM to 3:59 PM | 38 (9.7%) | 14 (5.2%) |
| 4:00 PM to 11:59 PM | 28 (7.1%) | 3 (1.1%) |
| Total | 393 (100.0%) | 271 (100.0%) |
Housing Occupancy in Valatie
Occupancy by Ownership in Valatie
Of the total 626 dwellings in Valatie, owner-occupied units account for 476 (76.0%), while renter-occupied units make up 150 (24.0%).
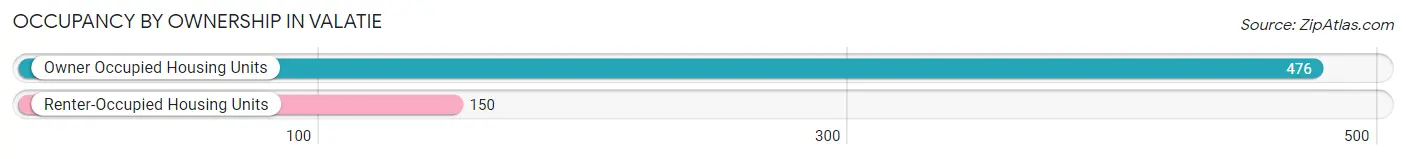
| Occupancy | # Housing Units | % Housing Units |
| Owner Occupied Housing Units | 476 | 76.0% |
| Renter-Occupied Housing Units | 150 | 24.0% |
| Total Occupied Housing Units | 626 | 100.0% |
Occupancy by Household Size in Valatie
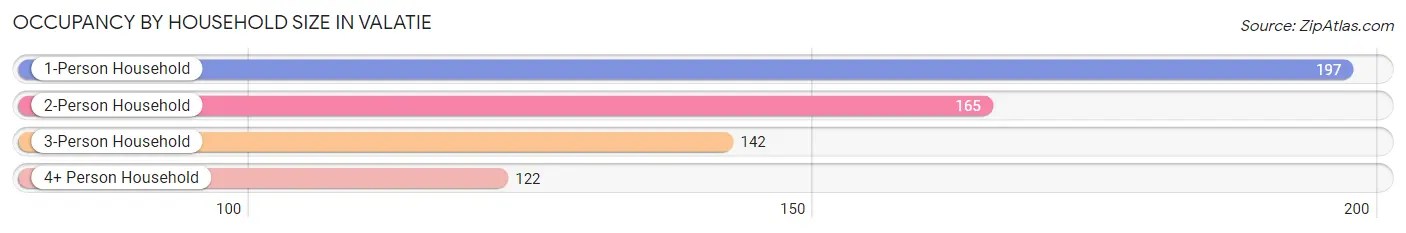
| Household Size | # Housing Units | % Housing Units |
| 1-Person Household | 197 | 31.5% |
| 2-Person Household | 165 | 26.4% |
| 3-Person Household | 142 | 22.7% |
| 4+ Person Household | 122 | 19.5% |
| Total Housing Units | 626 | 100.0% |
Occupancy by Ownership by Household Size in Valatie
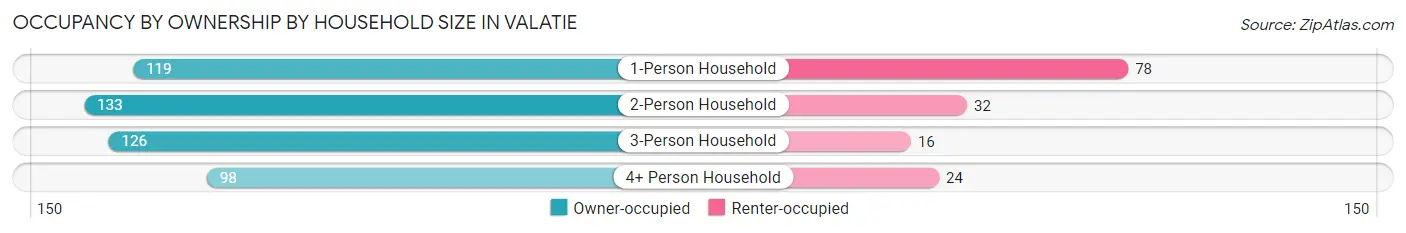
| Household Size | Owner-occupied | Renter-occupied |
| 1-Person Household | 119 (60.4%) | 78 (39.6%) |
| 2-Person Household | 133 (80.6%) | 32 (19.4%) |
| 3-Person Household | 126 (88.7%) | 16 (11.3%) |
| 4+ Person Household | 98 (80.3%) | 24 (19.7%) |
| Total Housing Units | 476 (76.0%) | 150 (24.0%) |
Occupancy by Educational Attainment in Valatie
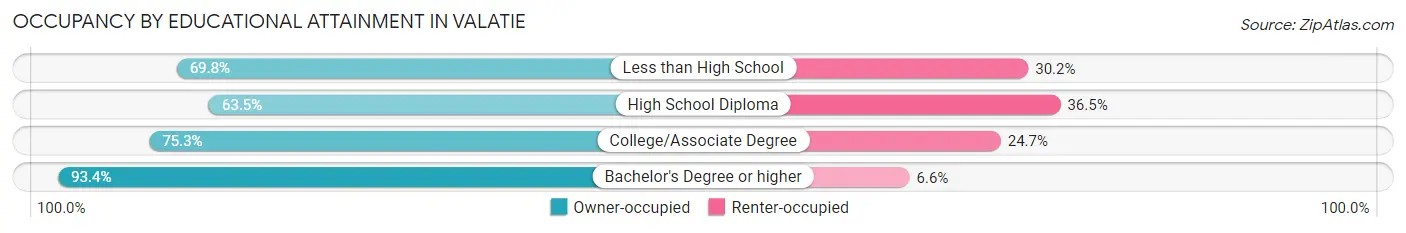
| Household Size | Owner-occupied | Renter-occupied |
| Less than High School | 44 (69.8%) | 19 (30.2%) |
| High School Diploma | 132 (63.5%) | 76 (36.5%) |
| College/Associate Degree | 131 (75.3%) | 43 (24.7%) |
| Bachelor's Degree or higher | 169 (93.4%) | 12 (6.6%) |
Occupancy by Age of Householder in Valatie
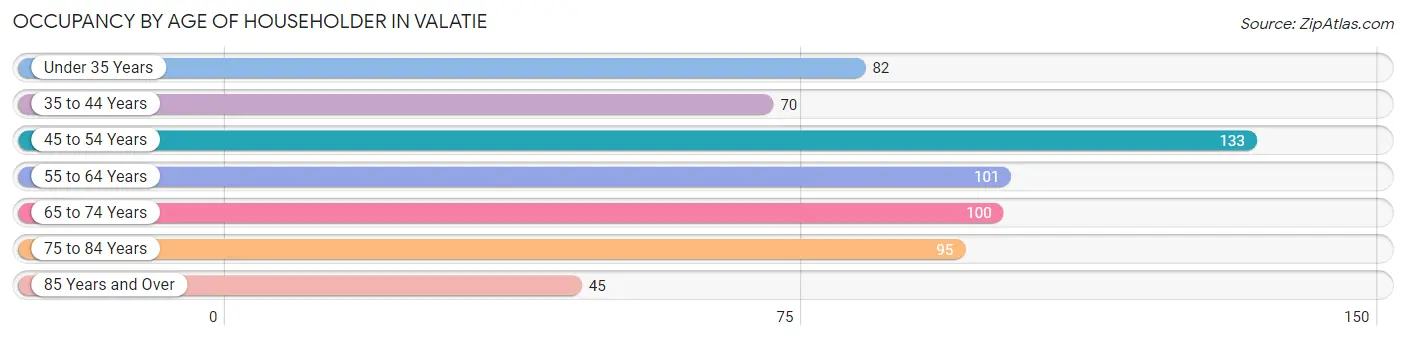
| Age Bracket | # Households | % Households |
| Under 35 Years | 82 | 13.1% |
| 35 to 44 Years | 70 | 11.2% |
| 45 to 54 Years | 133 | 21.2% |
| 55 to 64 Years | 101 | 16.1% |
| 65 to 74 Years | 100 | 16.0% |
| 75 to 84 Years | 95 | 15.2% |
| 85 Years and Over | 45 | 7.2% |
| Total | 626 | 100.0% |
Housing Finances in Valatie
Median Income by Occupancy in Valatie
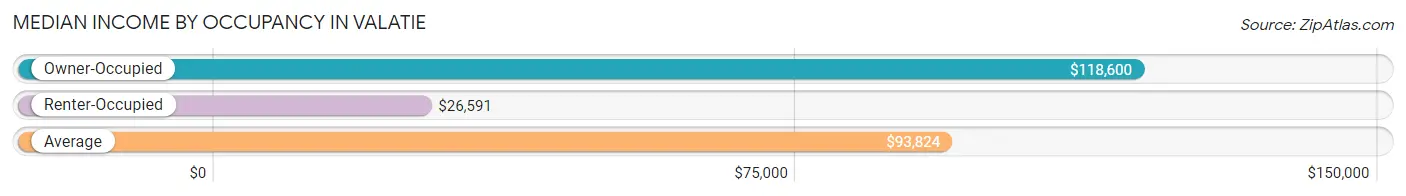
| Occupancy Type | # Households | Median Income |
| Owner-Occupied | 476 (76.0%) | $118,600 |
| Renter-Occupied | 150 (24.0%) | $26,591 |
| Average | 626 (100.0%) | $93,824 |
Occupancy by Householder Income Bracket in Valatie
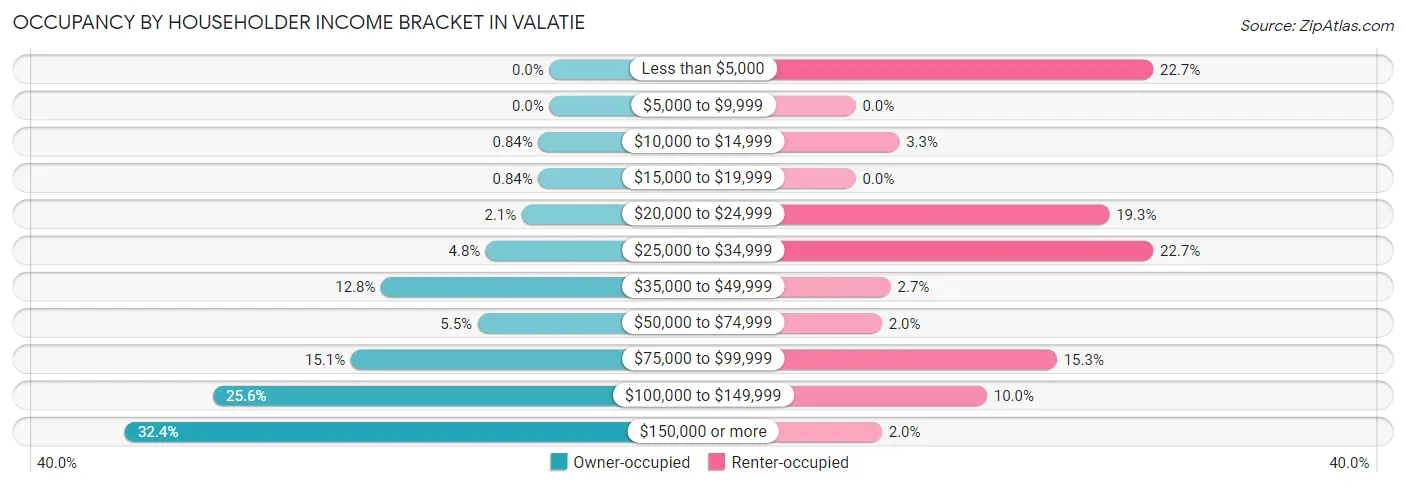
| Income Bracket | Owner-occupied | Renter-occupied |
| Less than $5,000 | 0 (0.0%) | 34 (22.7%) |
| $5,000 to $9,999 | 0 (0.0%) | 0 (0.0%) |
| $10,000 to $14,999 | 4 (0.8%) | 5 (3.3%) |
| $15,000 to $19,999 | 4 (0.8%) | 0 (0.0%) |
| $20,000 to $24,999 | 10 (2.1%) | 29 (19.3%) |
| $25,000 to $34,999 | 23 (4.8%) | 34 (22.7%) |
| $35,000 to $49,999 | 61 (12.8%) | 4 (2.7%) |
| $50,000 to $74,999 | 26 (5.5%) | 3 (2.0%) |
| $75,000 to $99,999 | 72 (15.1%) | 23 (15.3%) |
| $100,000 to $149,999 | 122 (25.6%) | 15 (10.0%) |
| $150,000 or more | 154 (32.4%) | 3 (2.0%) |
| Total | 476 (100.0%) | 150 (100.0%) |
Monthly Housing Cost Tiers in Valatie
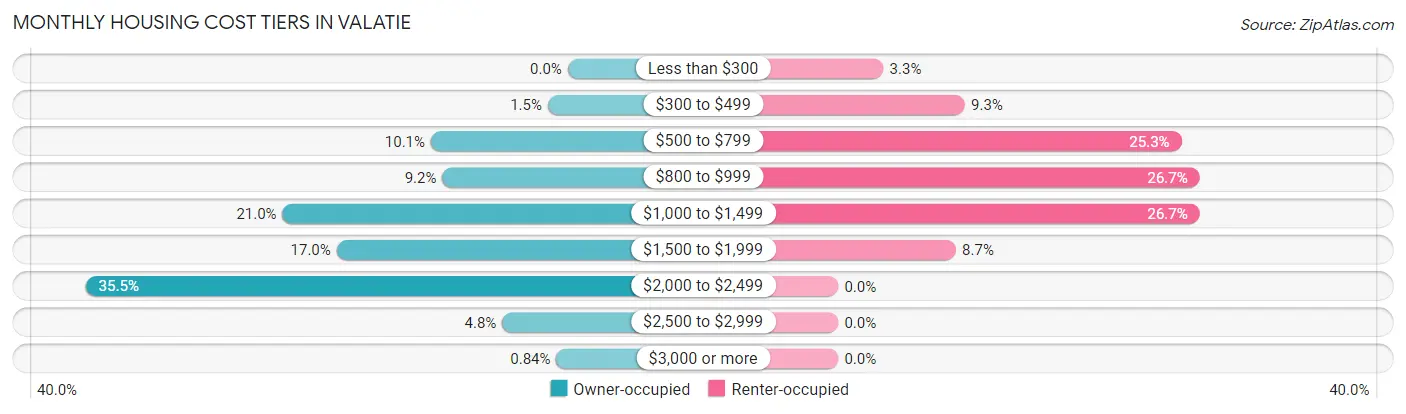
| Monthly Cost | Owner-occupied | Renter-occupied |
| Less than $300 | 0 (0.0%) | 5 (3.3%) |
| $300 to $499 | 7 (1.5%) | 14 (9.3%) |
| $500 to $799 | 48 (10.1%) | 38 (25.3%) |
| $800 to $999 | 44 (9.2%) | 40 (26.7%) |
| $1,000 to $1,499 | 100 (21.0%) | 40 (26.7%) |
| $1,500 to $1,999 | 81 (17.0%) | 13 (8.7%) |
| $2,000 to $2,499 | 169 (35.5%) | 0 (0.0%) |
| $2,500 to $2,999 | 23 (4.8%) | 0 (0.0%) |
| $3,000 or more | 4 (0.8%) | 0 (0.0%) |
| Total | 476 (100.0%) | 150 (100.0%) |
Physical Housing Characteristics in Valatie
Housing Structures in Valatie
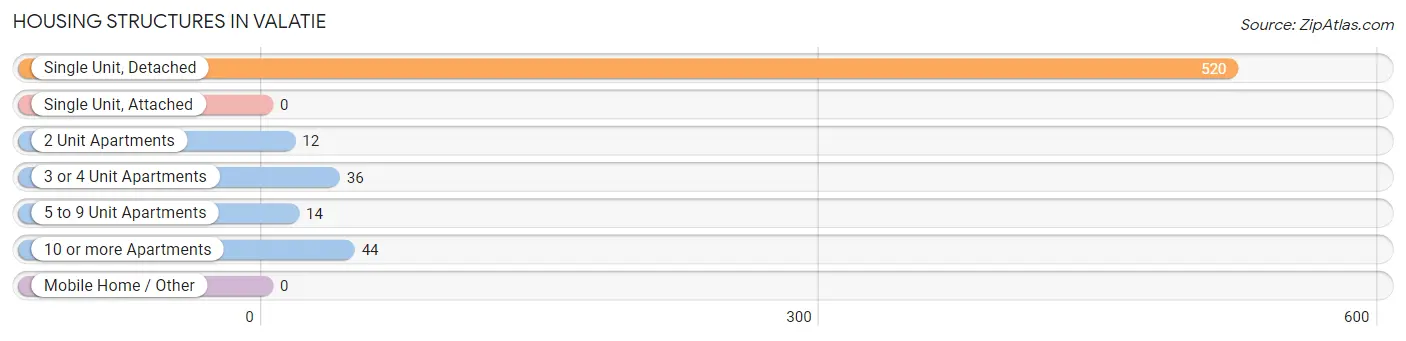
| Structure Type | # Housing Units | % Housing Units |
| Single Unit, Detached | 520 | 83.1% |
| Single Unit, Attached | 0 | 0.0% |
| 2 Unit Apartments | 12 | 1.9% |
| 3 or 4 Unit Apartments | 36 | 5.8% |
| 5 to 9 Unit Apartments | 14 | 2.2% |
| 10 or more Apartments | 44 | 7.0% |
| Mobile Home / Other | 0 | 0.0% |
| Total | 626 | 100.0% |
Housing Structures by Occupancy in Valatie
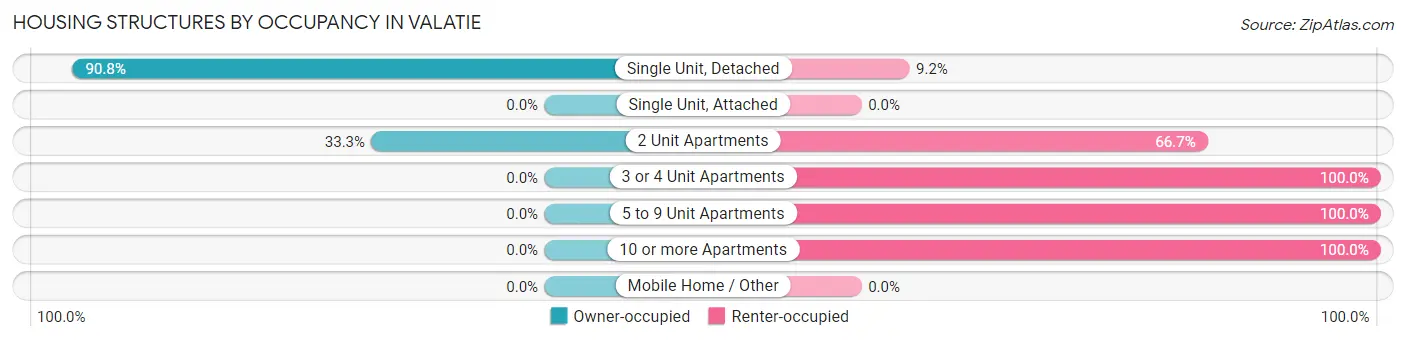
| Structure Type | Owner-occupied | Renter-occupied |
| Single Unit, Detached | 472 (90.8%) | 48 (9.2%) |
| Single Unit, Attached | 0 (0.0%) | 0 (0.0%) |
| 2 Unit Apartments | 4 (33.3%) | 8 (66.7%) |
| 3 or 4 Unit Apartments | 0 (0.0%) | 36 (100.0%) |
| 5 to 9 Unit Apartments | 0 (0.0%) | 14 (100.0%) |
| 10 or more Apartments | 0 (0.0%) | 44 (100.0%) |
| Mobile Home / Other | 0 (0.0%) | 0 (0.0%) |
| Total | 476 (76.0%) | 150 (24.0%) |
Housing Structures by Number of Rooms in Valatie
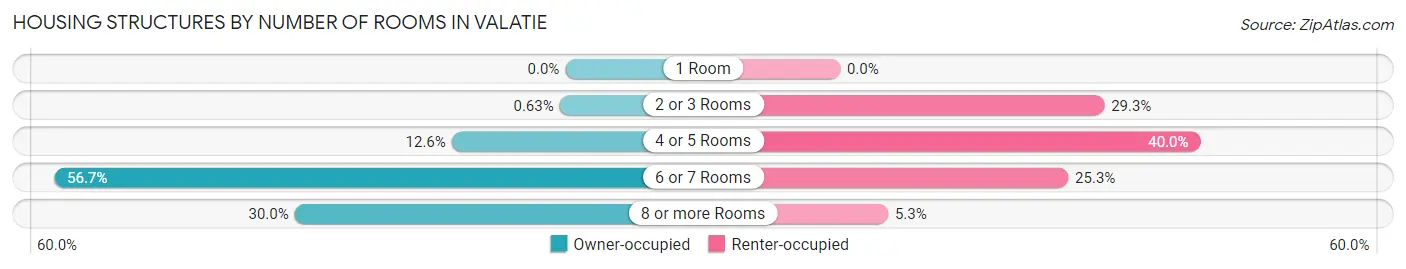
| Number of Rooms | Owner-occupied | Renter-occupied |
| 1 Room | 0 (0.0%) | 0 (0.0%) |
| 2 or 3 Rooms | 3 (0.6%) | 44 (29.3%) |
| 4 or 5 Rooms | 60 (12.6%) | 60 (40.0%) |
| 6 or 7 Rooms | 270 (56.7%) | 38 (25.3%) |
| 8 or more Rooms | 143 (30.0%) | 8 (5.3%) |
| Total | 476 (100.0%) | 150 (100.0%) |
Housing Structure by Heating Type in Valatie
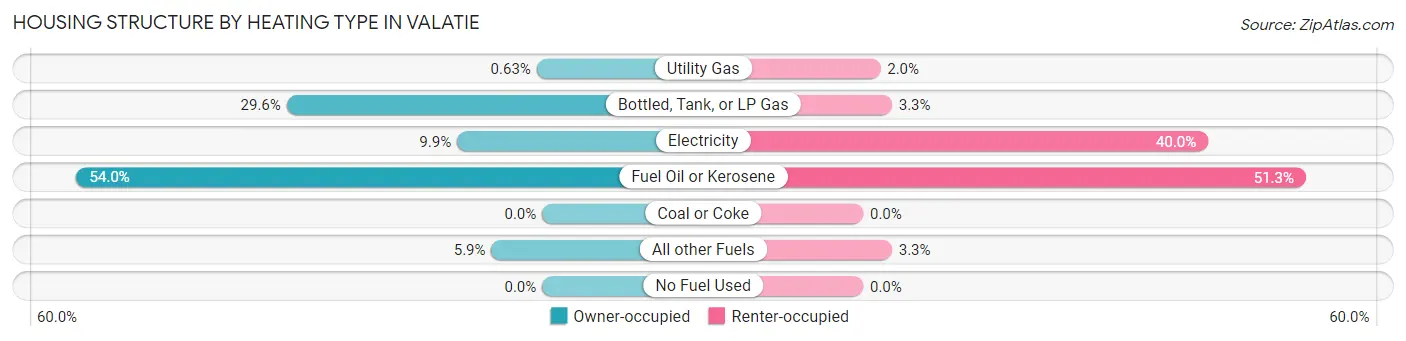
| Heating Type | Owner-occupied | Renter-occupied |
| Utility Gas | 3 (0.6%) | 3 (2.0%) |
| Bottled, Tank, or LP Gas | 141 (29.6%) | 5 (3.3%) |
| Electricity | 47 (9.9%) | 60 (40.0%) |
| Fuel Oil or Kerosene | 257 (54.0%) | 77 (51.3%) |
| Coal or Coke | 0 (0.0%) | 0 (0.0%) |
| All other Fuels | 28 (5.9%) | 5 (3.3%) |
| No Fuel Used | 0 (0.0%) | 0 (0.0%) |
| Total | 476 (100.0%) | 150 (100.0%) |
Household Vehicle Usage in Valatie
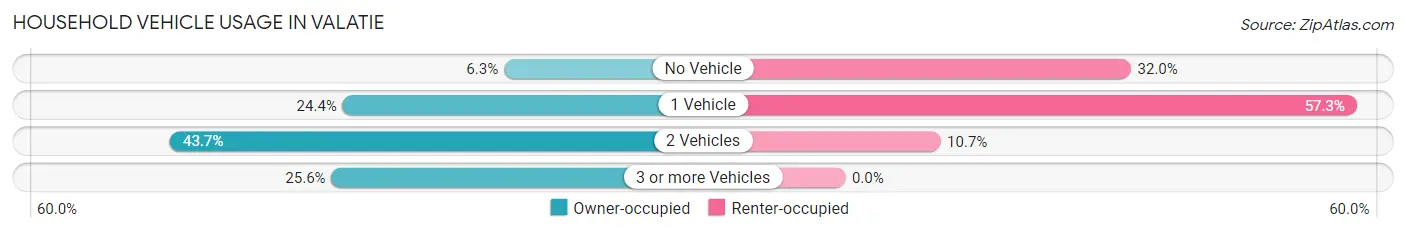
| Vehicles per Household | Owner-occupied | Renter-occupied |
| No Vehicle | 30 (6.3%) | 48 (32.0%) |
| 1 Vehicle | 116 (24.4%) | 86 (57.3%) |
| 2 Vehicles | 208 (43.7%) | 16 (10.7%) |
| 3 or more Vehicles | 122 (25.6%) | 0 (0.0%) |
| Total | 476 (100.0%) | 150 (100.0%) |
Real Estate & Mortgages in Valatie
Real Estate and Mortgage Overview in Valatie
| Characteristic | Without Mortgage | With Mortgage |
| Housing Units | 122 | 354 |
| Median Property Value | $258,300 | $274,400 |
| Median Household Income | $83,750 | $139 |
| Monthly Housing Costs | $867 | $4 |
| Real Estate Taxes | $5,650 | $0 |
Property Value by Mortgage Status in Valatie
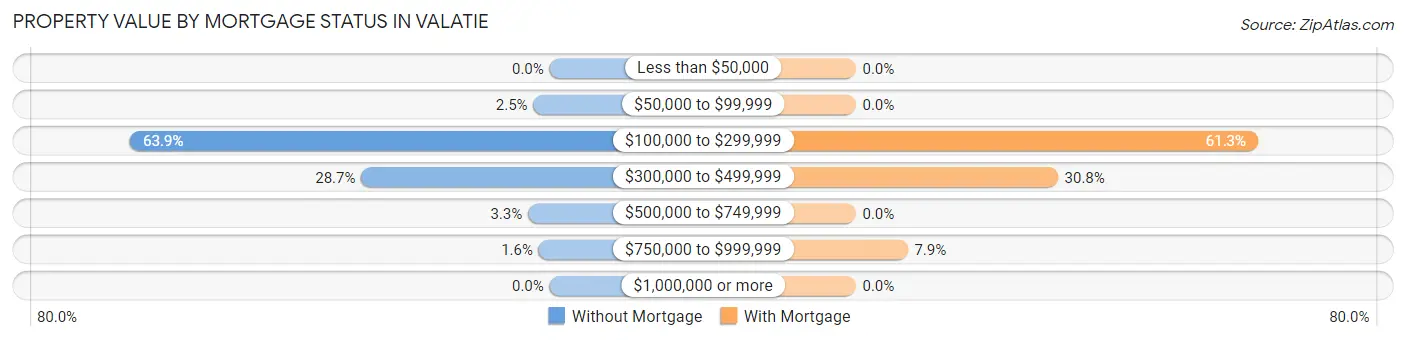
| Property Value | Without Mortgage | With Mortgage |
| Less than $50,000 | 0 (0.0%) | 0 (0.0%) |
| $50,000 to $99,999 | 3 (2.5%) | 0 (0.0%) |
| $100,000 to $299,999 | 78 (63.9%) | 217 (61.3%) |
| $300,000 to $499,999 | 35 (28.7%) | 109 (30.8%) |
| $500,000 to $749,999 | 4 (3.3%) | 0 (0.0%) |
| $750,000 to $999,999 | 2 (1.6%) | 28 (7.9%) |
| $1,000,000 or more | 0 (0.0%) | 0 (0.0%) |
| Total | 122 (100.0%) | 354 (100.0%) |
Household Income by Mortgage Status in Valatie
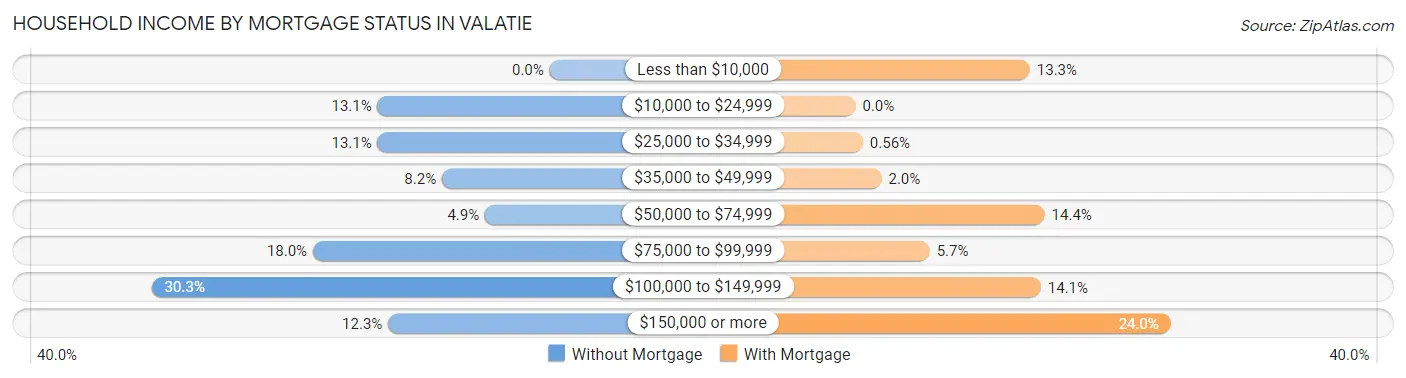
| Household Income | Without Mortgage | With Mortgage |
| Less than $10,000 | 0 (0.0%) | 47 (13.3%) |
| $10,000 to $24,999 | 16 (13.1%) | 0 (0.0%) |
| $25,000 to $34,999 | 16 (13.1%) | 2 (0.6%) |
| $35,000 to $49,999 | 10 (8.2%) | 7 (2.0%) |
| $50,000 to $74,999 | 6 (4.9%) | 51 (14.4%) |
| $75,000 to $99,999 | 22 (18.0%) | 20 (5.7%) |
| $100,000 to $149,999 | 37 (30.3%) | 50 (14.1%) |
| $150,000 or more | 15 (12.3%) | 85 (24.0%) |
| Total | 122 (100.0%) | 354 (100.0%) |
Property Value to Household Income Ratio in Valatie
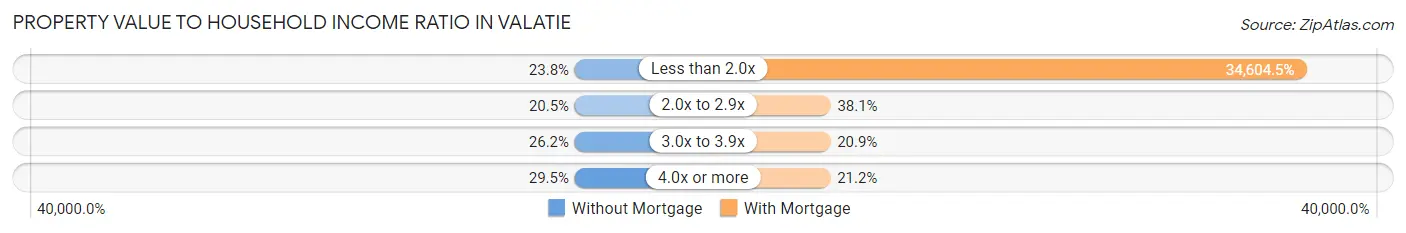
| Value-to-Income Ratio | Without Mortgage | With Mortgage |
| Less than 2.0x | 29 (23.8%) | 122,500 (34,604.5%) |
| 2.0x to 2.9x | 25 (20.5%) | 135 (38.1%) |
| 3.0x to 3.9x | 32 (26.2%) | 74 (20.9%) |
| 4.0x or more | 36 (29.5%) | 75 (21.2%) |
| Total | 122 (100.0%) | 354 (100.0%) |
Real Estate Taxes by Mortgage Status in Valatie
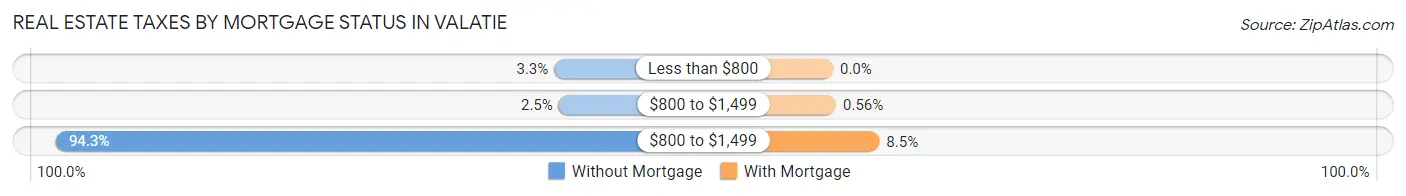
| Property Taxes | Without Mortgage | With Mortgage |
| Less than $800 | 4 (3.3%) | 0 (0.0%) |
| $800 to $1,499 | 3 (2.5%) | 2 (0.6%) |
| $800 to $1,499 | 115 (94.3%) | 30 (8.5%) |
| Total | 122 (100.0%) | 354 (100.0%) |
Health & Disability in Valatie
Health Insurance Coverage by Age in Valatie
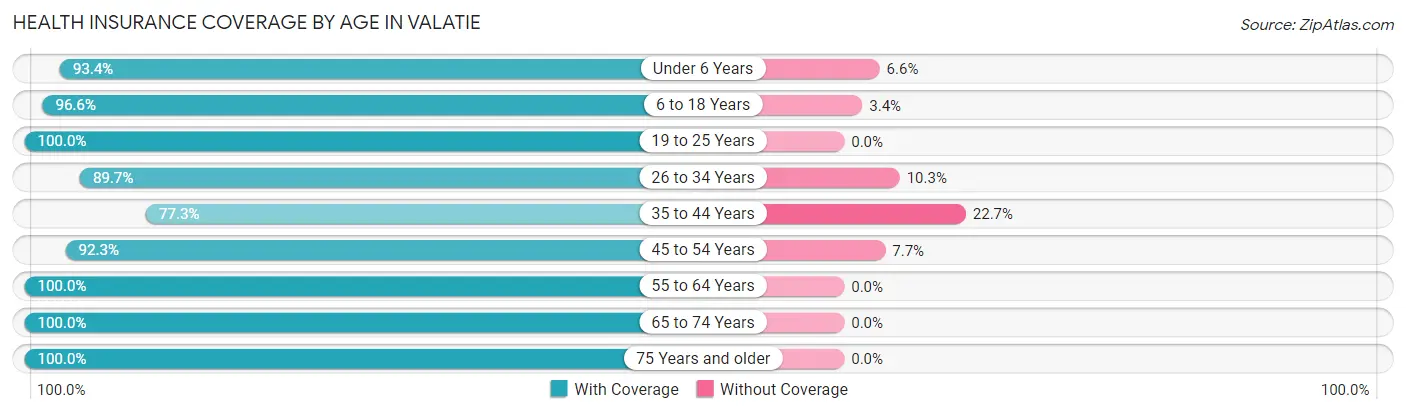
| Age Bracket | With Coverage | Without Coverage |
| Under 6 Years | 85 (93.4%) | 6 (6.6%) |
| 6 to 18 Years | 259 (96.6%) | 9 (3.4%) |
| 19 to 25 Years | 98 (100.0%) | 0 (0.0%) |
| 26 to 34 Years | 130 (89.7%) | 15 (10.3%) |
| 35 to 44 Years | 116 (77.3%) | 34 (22.7%) |
| 45 to 54 Years | 241 (92.3%) | 20 (7.7%) |
| 55 to 64 Years | 161 (100.0%) | 0 (0.0%) |
| 65 to 74 Years | 163 (100.0%) | 0 (0.0%) |
| 75 Years and older | 168 (100.0%) | 0 (0.0%) |
| Total | 1,421 (94.4%) | 84 (5.6%) |
Health Insurance Coverage by Citizenship Status in Valatie
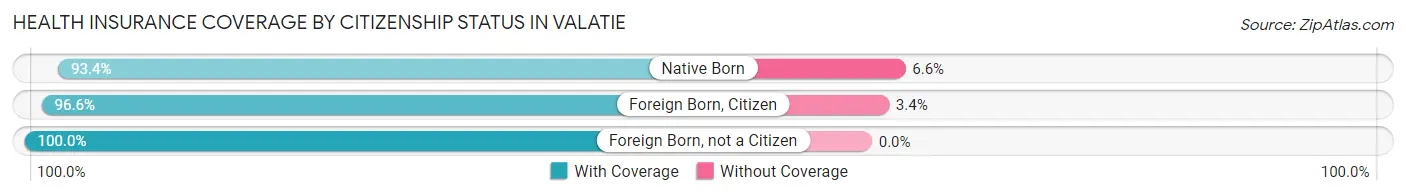
| Citizenship Status | With Coverage | Without Coverage |
| Native Born | 85 (93.4%) | 6 (6.6%) |
| Foreign Born, Citizen | 259 (96.6%) | 9 (3.4%) |
| Foreign Born, not a Citizen | 98 (100.0%) | 0 (0.0%) |
Health Insurance Coverage by Household Income in Valatie
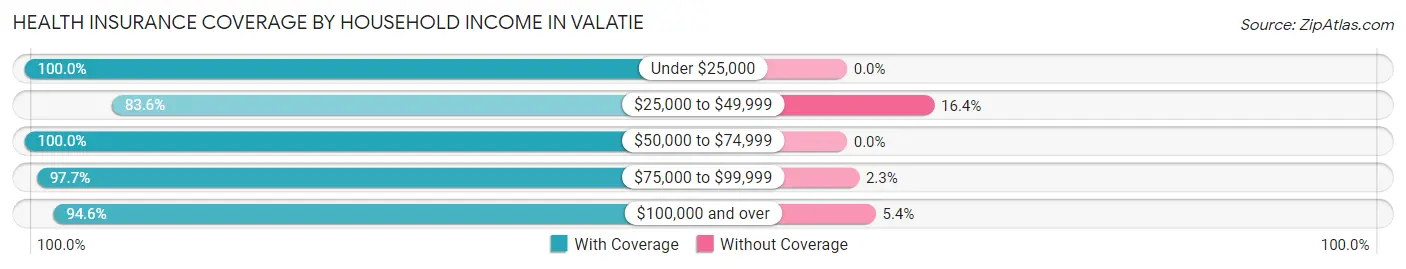
| Household Income | With Coverage | Without Coverage |
| Under $25,000 | 132 (100.0%) | 0 (0.0%) |
| $25,000 to $49,999 | 179 (83.6%) | 35 (16.4%) |
| $50,000 to $74,999 | 97 (100.0%) | 0 (0.0%) |
| $75,000 to $99,999 | 257 (97.7%) | 6 (2.3%) |
| $100,000 and over | 756 (94.6%) | 43 (5.4%) |
Public vs Private Health Insurance Coverage by Age in Valatie
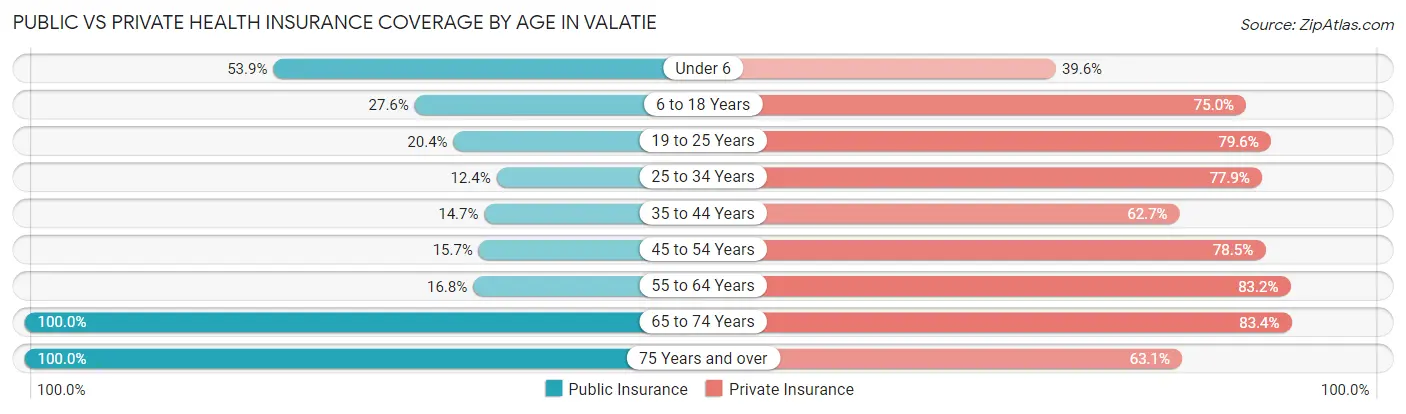
| Age Bracket | Public Insurance | Private Insurance |
| Under 6 | 49 (53.8%) | 36 (39.6%) |
| 6 to 18 Years | 74 (27.6%) | 201 (75.0%) |
| 19 to 25 Years | 20 (20.4%) | 78 (79.6%) |
| 25 to 34 Years | 18 (12.4%) | 113 (77.9%) |
| 35 to 44 Years | 22 (14.7%) | 94 (62.7%) |
| 45 to 54 Years | 41 (15.7%) | 205 (78.5%) |
| 55 to 64 Years | 27 (16.8%) | 134 (83.2%) |
| 65 to 74 Years | 163 (100.0%) | 136 (83.4%) |
| 75 Years and over | 168 (100.0%) | 106 (63.1%) |
| Total | 582 (38.7%) | 1,103 (73.3%) |
Disability Status by Sex by Age in Valatie
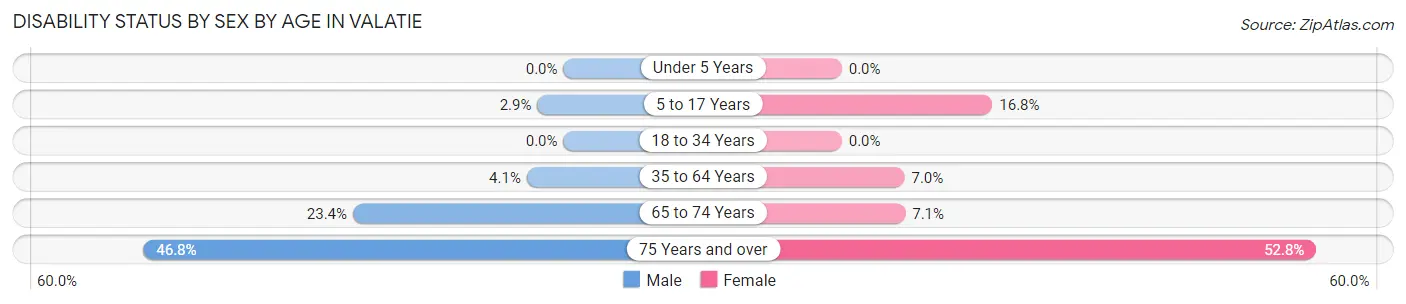
| Age Bracket | Male | Female |
| Under 5 Years | 0 (0.0%) | 0 (0.0%) |
| 5 to 17 Years | 4 (2.9%) | 26 (16.8%) |
| 18 to 34 Years | 0 (0.0%) | 0 (0.0%) |
| 35 to 64 Years | 14 (4.1%) | 16 (7.0%) |
| 65 to 74 Years | 15 (23.4%) | 7 (7.1%) |
| 75 Years and over | 29 (46.8%) | 56 (52.8%) |
Disability Class by Sex by Age in Valatie
Disability Class: Hearing Difficulty
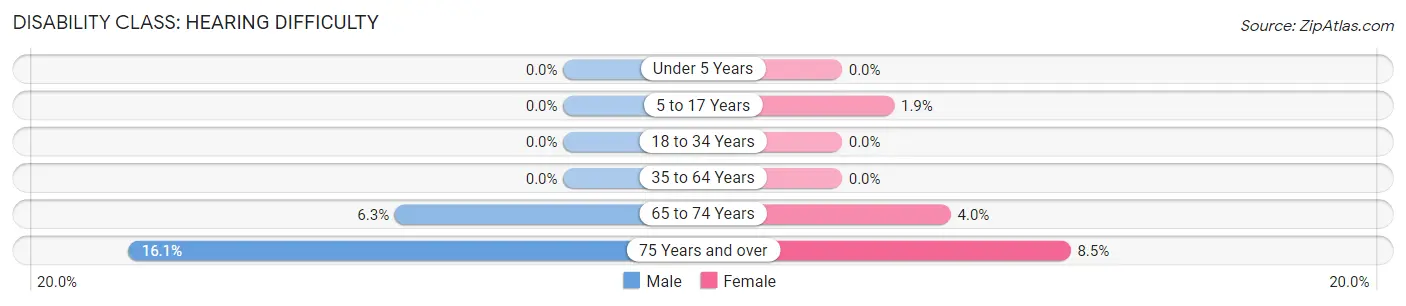
| Age Bracket | Male | Female |
| Under 5 Years | 0 (0.0%) | 0 (0.0%) |
| 5 to 17 Years | 0 (0.0%) | 3 (1.9%) |
| 18 to 34 Years | 0 (0.0%) | 0 (0.0%) |
| 35 to 64 Years | 0 (0.0%) | 0 (0.0%) |
| 65 to 74 Years | 4 (6.2%) | 4 (4.0%) |
| 75 Years and over | 10 (16.1%) | 9 (8.5%) |
Disability Class: Vision Difficulty
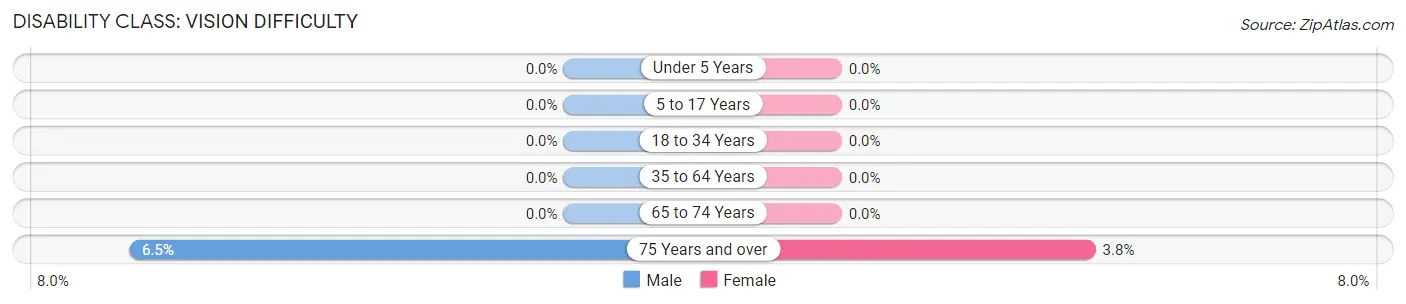
| Age Bracket | Male | Female |
| Under 5 Years | 0 (0.0%) | 0 (0.0%) |
| 5 to 17 Years | 0 (0.0%) | 0 (0.0%) |
| 18 to 34 Years | 0 (0.0%) | 0 (0.0%) |
| 35 to 64 Years | 0 (0.0%) | 0 (0.0%) |
| 65 to 74 Years | 0 (0.0%) | 0 (0.0%) |
| 75 Years and over | 4 (6.5%) | 4 (3.8%) |
Disability Class: Cognitive Difficulty
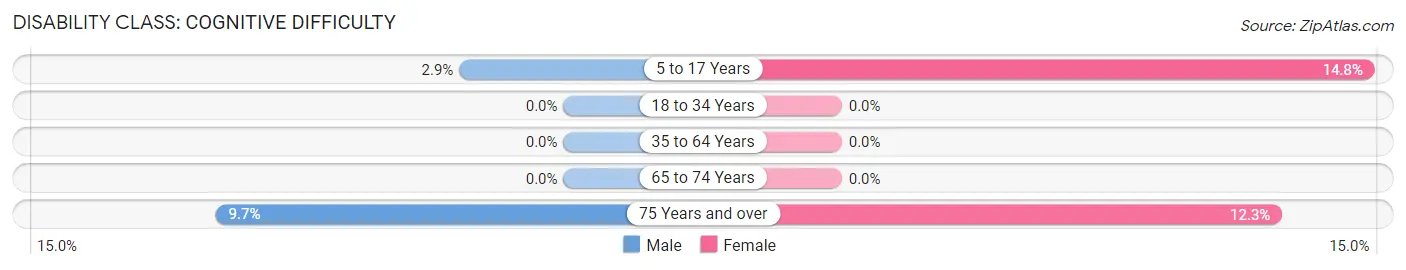
| Age Bracket | Male | Female |
| 5 to 17 Years | 4 (2.9%) | 23 (14.8%) |
| 18 to 34 Years | 0 (0.0%) | 0 (0.0%) |
| 35 to 64 Years | 0 (0.0%) | 0 (0.0%) |
| 65 to 74 Years | 0 (0.0%) | 0 (0.0%) |
| 75 Years and over | 6 (9.7%) | 13 (12.3%) |
Disability Class: Ambulatory Difficulty
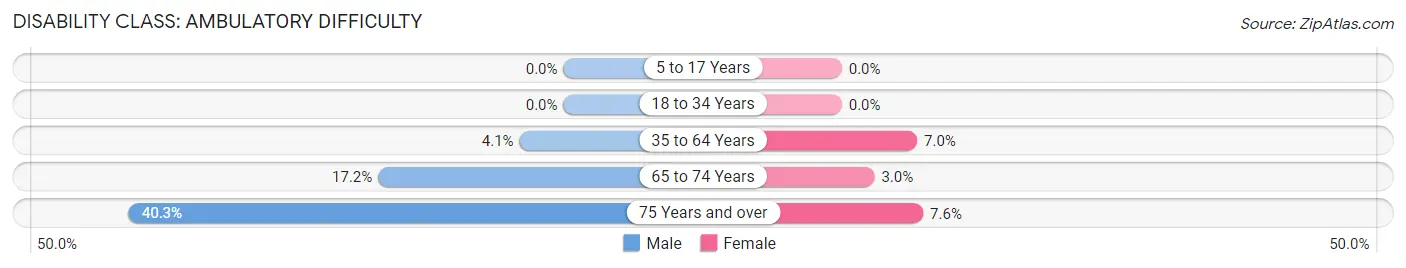
| Age Bracket | Male | Female |
| 5 to 17 Years | 0 (0.0%) | 0 (0.0%) |
| 18 to 34 Years | 0 (0.0%) | 0 (0.0%) |
| 35 to 64 Years | 14 (4.1%) | 16 (7.0%) |
| 65 to 74 Years | 11 (17.2%) | 3 (3.0%) |
| 75 Years and over | 25 (40.3%) | 8 (7.5%) |
Disability Class: Self-Care Difficulty
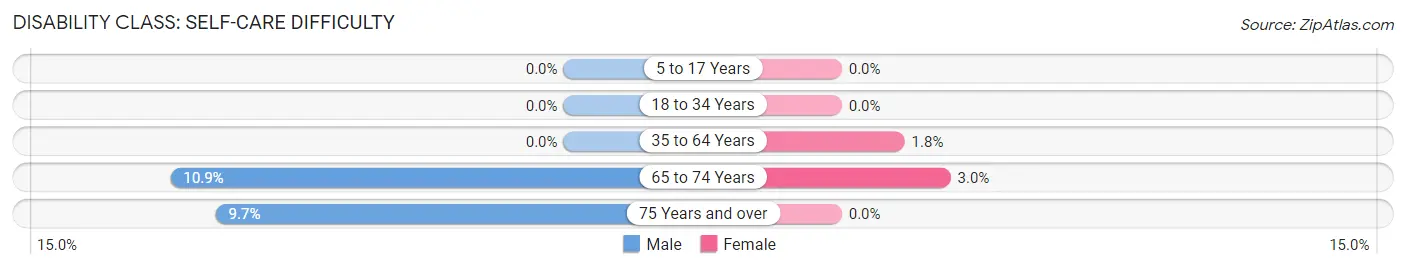
| Age Bracket | Male | Female |
| 5 to 17 Years | 0 (0.0%) | 0 (0.0%) |
| 18 to 34 Years | 0 (0.0%) | 0 (0.0%) |
| 35 to 64 Years | 0 (0.0%) | 4 (1.8%) |
| 65 to 74 Years | 7 (10.9%) | 3 (3.0%) |
| 75 Years and over | 6 (9.7%) | 0 (0.0%) |
Technology Access in Valatie
Computing Device Access in Valatie
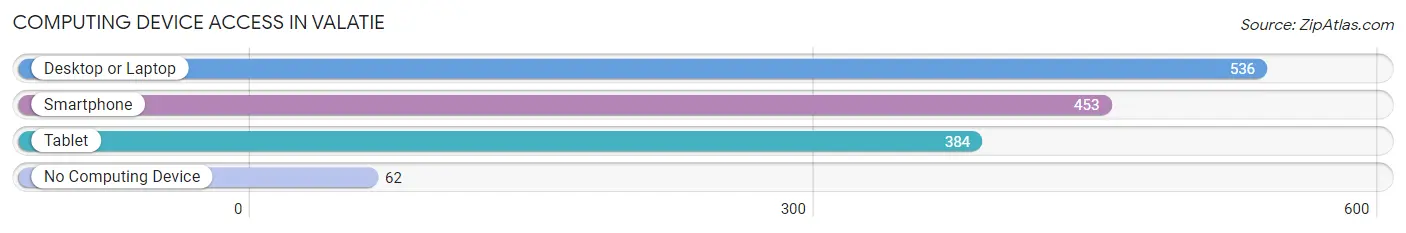
| Device Type | # Households | % Households |
| Desktop or Laptop | 536 | 85.6% |
| Smartphone | 453 | 72.4% |
| Tablet | 384 | 61.3% |
| No Computing Device | 62 | 9.9% |
| Total | 626 | 100.0% |
Internet Access in Valatie
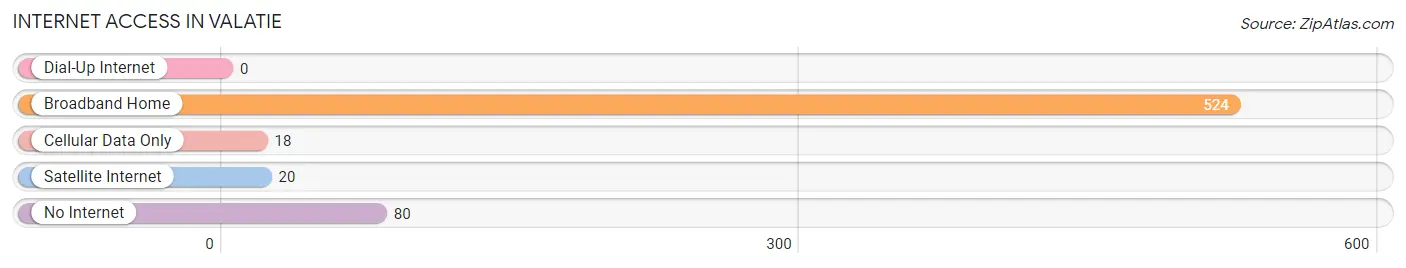
| Internet Type | # Households | % Households |
| Dial-Up Internet | 0 | 0.0% |
| Broadband Home | 524 | 83.7% |
| Cellular Data Only | 18 | 2.9% |
| Satellite Internet | 20 | 3.2% |
| No Internet | 80 | 12.8% |
| Total | 626 | 100.0% |
Valatie Summary
Valatie is a village located in Columbia County, New York, United States. It is situated on the east bank of the Hudson River, about 10 miles south of Albany. The population was 1,819 at the 2010 census.
History
Valatie was first settled in 1720 by Dutch settlers. The village was originally known as "Kinderhook Landing" and was part of the town of Kinderhook. In 1823, the village was incorporated as the village of Valatie. The name Valatie is derived from the Dutch word "vallei," which means "valley."
The village was an important port on the Hudson River in the 19th century. It was a major shipping point for agricultural products, including grain, hay, and apples. The village was also home to several mills, including a paper mill, a grist mill, and a saw mill.
Geography
Valatie is located at 42°20'25" North, 73°45'25" West (42.340278, -73.756944). According to the United States Census Bureau, the village has a total area of 1.2 square miles (3.1 km2), all of it land.
Economy
Valatie's economy is largely based on agriculture and tourism. The village is home to several farms, including dairy farms, apple orchards, and vegetable farms. The village is also home to several small businesses, including restaurants, shops, and galleries.
Demographics
As of the census of 2010, there were 1,819 people, 745 households, and 486 families residing in the village. The population density was 1,521.7 people per square mile (586.7/km2). There were 809 housing units at an average density of 672.5 per square mile (259.3/km2). The racial makeup of the village was 94.2% White, 1.2% African American, 0.2% Native American, 0.7% Asian, 0.1% Pacific Islander, 1.3% from other races, and 2.4% from two or more races. Hispanic or Latino of any race were 4.2% of the population.
There were 745 households, out of which 30.2% had children under the age of 18 living with them, 46.2% were married couples living together, 13.2% had a female householder with no husband present, and 35.2% were non-families. 29.2% of all households were made up of individuals, and 11.7% had someone living alone who was 65 years of age or older. The average household size was 2.44 and the average family size was 3.02.
In the village, the population was spread out, with 24.7% under the age of 18, 7.2% from 18 to 24, 28.2% from 25 to 44, 25.2% from 45 to 64, and 14.7% who were 65 years of age or older. The median age was 38 years. For every 100 females, there were 92.2 males. For every 100 females age 18 and over, there were 88.3 males.
The median income for a household in the village was $41,250, and the median income for a family was $50,000. Males had a median income of $35,000 versus $27,500 for females. The per capita income for the village was $20,945. About 8.2% of families and 10.2% of the population were below the poverty line, including 14.2% of those under age 18 and 8.2% of those age 65 or over.
Common Questions
What is Per Capita Income in Valatie?
Per Capita income in Valatie is $42,808.
What is the Median Family Income in Valatie?
Median Family Income in Valatie is $117,000.
What is the Median Household income in Valatie?
Median Household Income in Valatie is $93,824.
What is Income or Wage Gap in Valatie?
Income or Wage Gap in Valatie is 46.5%.
Women in Valatie earn 53.5 cents for every dollar earned by a man.
What is Family Income Deficit in Valatie?
Family Income Deficit in Valatie is $18,310.
Families that are below poverty line in Valatie earn $18,310 less on average than the poverty threshold level.
What is Inequality or Gini Index in Valatie?
Inequality or Gini Index in Valatie is 0.41.
What is the Total Population of Valatie?
Total Population of Valatie is 1,668.
What is the Total Male Population of Valatie?
Total Male Population of Valatie is 845.
What is the Total Female Population of Valatie?
Total Female Population of Valatie is 823.
What is the Ratio of Males per 100 Females in Valatie?
There are 102.67 Males per 100 Females in Valatie.
What is the Ratio of Females per 100 Males in Valatie?
There are 97.40 Females per 100 Males in Valatie.
What is the Median Population Age in Valatie?
Median Population Age in Valatie is 46.7 Years.
What is the Average Family Size in Valatie
Average Family Size in Valatie is 3.0 People.
What is the Average Household Size in Valatie
Average Household Size in Valatie is 2.4 People.
How Large is the Labor Force in Valatie?
There are 774 People in the Labor Forcein in Valatie.
What is the Percentage of People in the Labor Force in Valatie?
56.3% of People are in the Labor Force in Valatie.
What is the Unemployment Rate in Valatie?
Unemployment Rate in Valatie is 7.1%.