Turin, NY Map & Demographics
Turin Map
Turin Overview
$29,089
PER CAPITA INCOME
$65,977
AVG FAMILY INCOME
$97,818
AVG HOUSEHOLD INCOME
47.6%
WAGE / INCOME GAP [ % ]
52.4¢/ $1
WAGE / INCOME GAP [ $ ]
0.25
INEQUALITY / GINI INDEX
370
TOTAL POPULATION
228
MALE POPULATION
142
FEMALE POPULATION
160.56
MALES / 100 FEMALES
62.28
FEMALES / 100 MALES
37.2
MEDIAN AGE
2.5
AVG FAMILY SIZE
2.4
AVG HOUSEHOLD SIZE
156
LABOR FORCE [ PEOPLE ]
56.5%
PERCENT IN LABOR FORCE
5.8%
UNEMPLOYMENT RATE
Turin Zip Codes
Turin Area Codes
Income in Turin
Income Overview in Turin
Per Capita Income in Turin is $29,089, while median incomes of families and households are $65,977 and $97,818 respectively.
| Characteristic | Number | Measure |
| Per Capita Income | 370 | $29,089 |
| Median Family Income | 121 | $65,977 |
| Mean Family Income | 121 | $70,847 |
| Median Household Income | 152 | $97,818 |
| Mean Household Income | 152 | $85,293 |
| Income Deficit | 121 | $0 |
| Wage / Income Gap (%) | 370 | 47.59% |
| Wage / Income Gap ($) | 370 | 52.41¢ per $1 |
| Gini / Inequality Index | 370 | 0.25 |
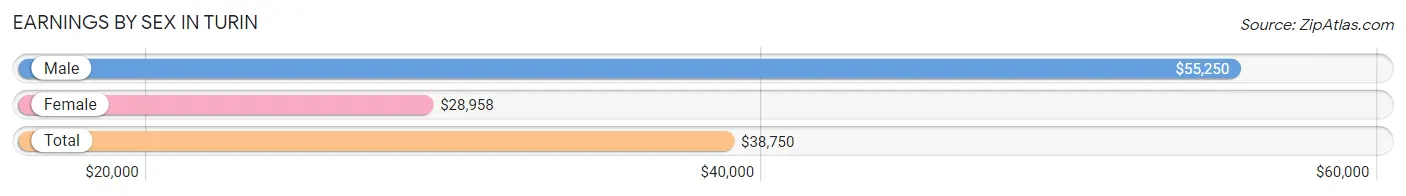
Earnings by Sex in Turin
Average Earnings in Turin are $38,750, $55,250 for men and $28,958 for women, a difference of 47.6%.
| Sex | Number | Average Earnings |
| Male | 79 (50.0%) | $55,250 |
| Female | 79 (50.0%) | $28,958 |
| Total | 158 (100.0%) | $38,750 |
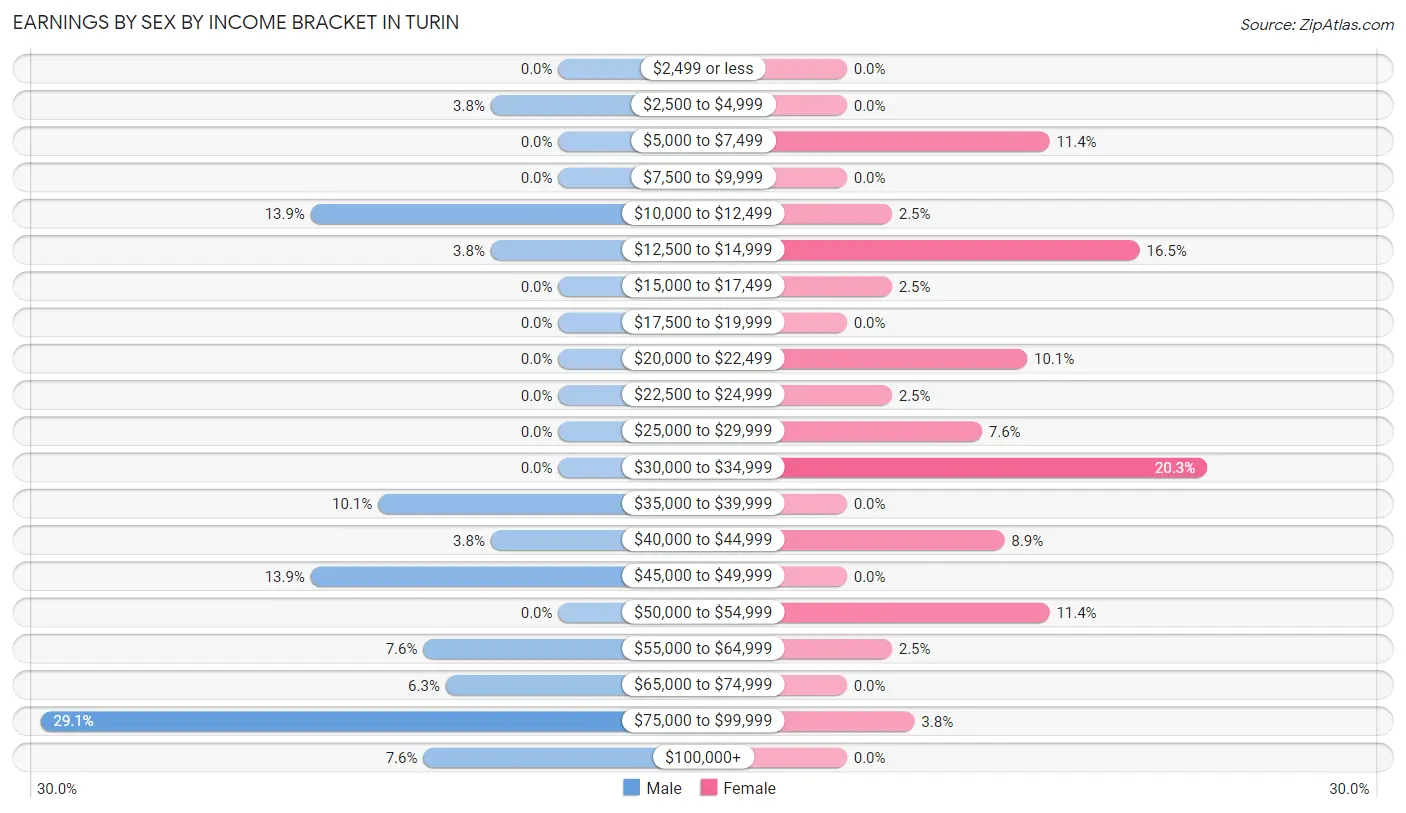
Earnings by Sex by Income Bracket in Turin
The most common earnings brackets in Turin are $75,000 to $99,999 for men (23 | 29.1%) and $30,000 to $34,999 for women (16 | 20.3%).
| Income | Male | Female |
| $2,499 or less | 0 (0.0%) | 0 (0.0%) |
| $2,500 to $4,999 | 3 (3.8%) | 0 (0.0%) |
| $5,000 to $7,499 | 0 (0.0%) | 9 (11.4%) |
| $7,500 to $9,999 | 0 (0.0%) | 0 (0.0%) |
| $10,000 to $12,499 | 11 (13.9%) | 2 (2.5%) |
| $12,500 to $14,999 | 3 (3.8%) | 13 (16.5%) |
| $15,000 to $17,499 | 0 (0.0%) | 2 (2.5%) |
| $17,500 to $19,999 | 0 (0.0%) | 0 (0.0%) |
| $20,000 to $22,499 | 0 (0.0%) | 8 (10.1%) |
| $22,500 to $24,999 | 0 (0.0%) | 2 (2.5%) |
| $25,000 to $29,999 | 0 (0.0%) | 6 (7.6%) |
| $30,000 to $34,999 | 0 (0.0%) | 16 (20.3%) |
| $35,000 to $39,999 | 8 (10.1%) | 0 (0.0%) |
| $40,000 to $44,999 | 3 (3.8%) | 7 (8.9%) |
| $45,000 to $49,999 | 11 (13.9%) | 0 (0.0%) |
| $50,000 to $54,999 | 0 (0.0%) | 9 (11.4%) |
| $55,000 to $64,999 | 6 (7.6%) | 2 (2.5%) |
| $65,000 to $74,999 | 5 (6.3%) | 0 (0.0%) |
| $75,000 to $99,999 | 23 (29.1%) | 3 (3.8%) |
| $100,000+ | 6 (7.6%) | 0 (0.0%) |
| Total | 79 (100.0%) | 79 (100.0%) |
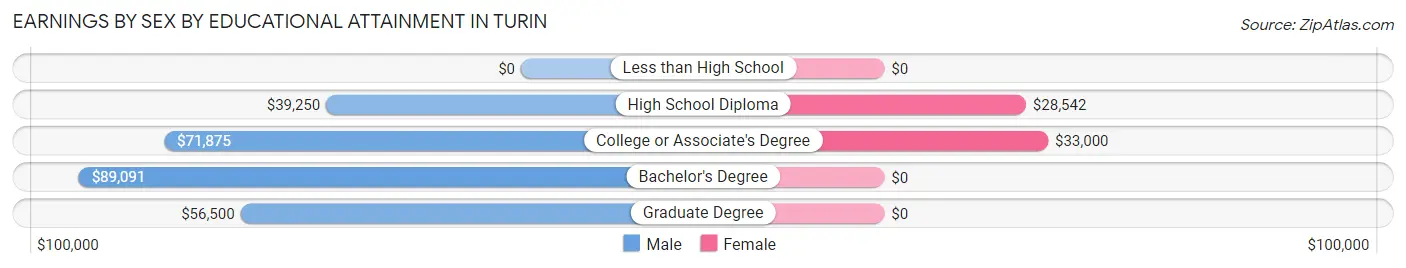
Earnings by Sex by Educational Attainment in Turin
Average earnings in Turin are $57,000 for men and $31,563 for women, a difference of 44.6%. Men with an educational attainment of bachelor's degree enjoy the highest average annual earnings of $89,091, while those with high school diploma education earn the least with $39,250. Women with an educational attainment of college or associate's degree earn the most with the average annual earnings of $33,000, while those with high school diploma education have the smallest earnings of $28,542.
| Educational Attainment | Male Income | Female Income |
| Less than High School | - | - |
| High School Diploma | $39,250 | $28,542 |
| College or Associate's Degree | $71,875 | $33,000 |
| Bachelor's Degree | $89,091 | $0 |
| Graduate Degree | $56,500 | $0 |
| Total | $57,000 | $31,563 |
Family Income in Turin
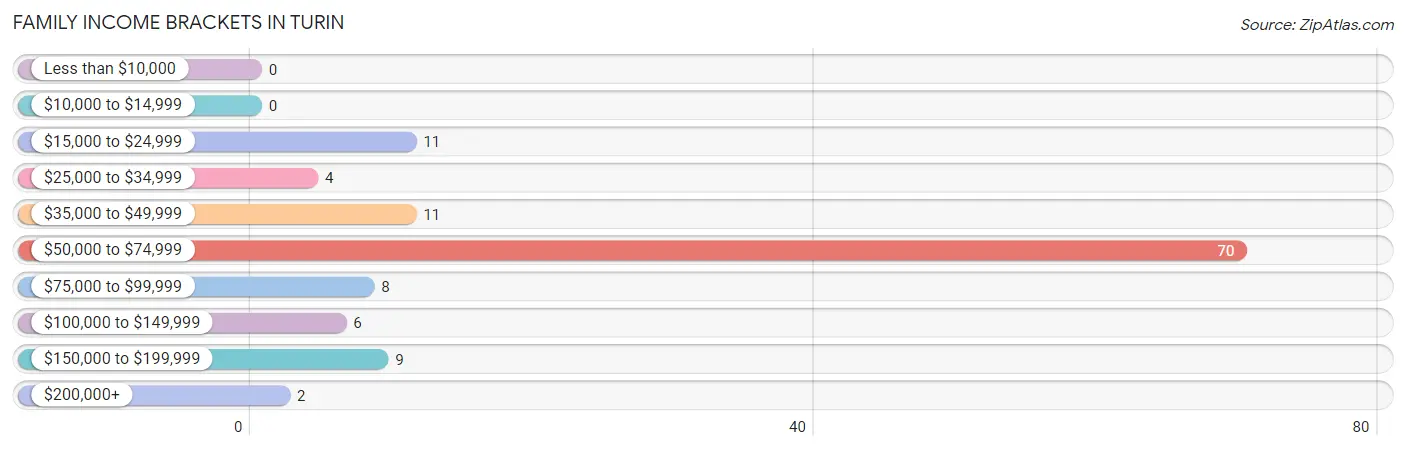
Family Income Brackets in Turin
According to the Turin family income data, there are 70 families falling into the $50,000 to $74,999 income range, which is the most common income bracket and makes up 57.9% of all families.
| Income Bracket | # Families | % Families |
| Less than $10,000 | 0 | 0.0% |
| $10,000 to $14,999 | 0 | 0.0% |
| $15,000 to $24,999 | 11 | 9.1% |
| $25,000 to $34,999 | 4 | 3.3% |
| $35,000 to $49,999 | 11 | 9.1% |
| $50,000 to $74,999 | 70 | 57.9% |
| $75,000 to $99,999 | 8 | 6.6% |
| $100,000 to $149,999 | 6 | 5.0% |
| $150,000 to $199,999 | 9 | 7.4% |
| $200,000+ | 2 | 1.7% |
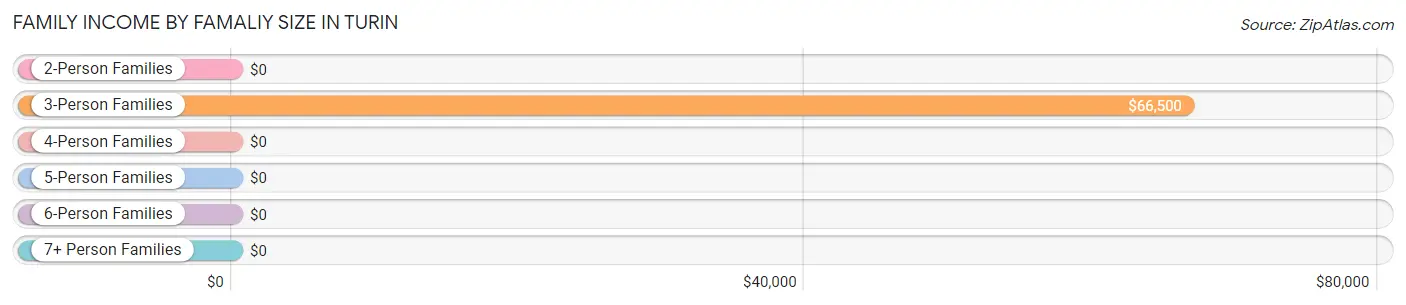
Family Income by Famaliy Size in Turin
3-person families (66 | 54.5%) account for the highest median family income in Turin with $66,500 per family, while 3-person families (66 | 54.5%) have the highest median income of $22,167 per family member.
| Income Bracket | # Families | Median Income |
| 2-Person Families | 19 (15.7%) | $0 |
| 3-Person Families | 66 (54.5%) | $66,500 |
| 4-Person Families | 23 (19.0%) | $0 |
| 5-Person Families | 13 (10.7%) | $0 |
| 6-Person Families | 0 (0.0%) | $0 |
| 7+ Person Families | 0 (0.0%) | $0 |
| Total | 121 (100.0%) | $65,977 |
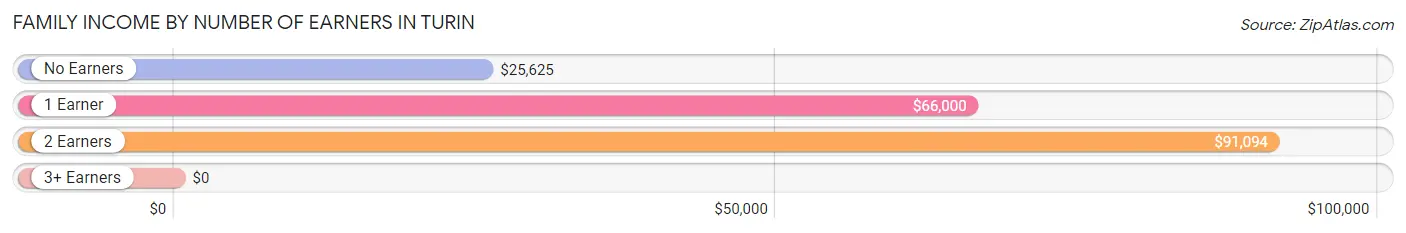
Family Income by Number of Earners in Turin
| Number of Earners | # Families | Median Income |
| No Earners | 9 (7.4%) | $25,625 |
| 1 Earner | 72 (59.5%) | $66,000 |
| 2 Earners | 39 (32.2%) | $91,094 |
| 3+ Earners | 1 (0.8%) | $0 |
| Total | 121 (100.0%) | $65,977 |
Household Income in Turin
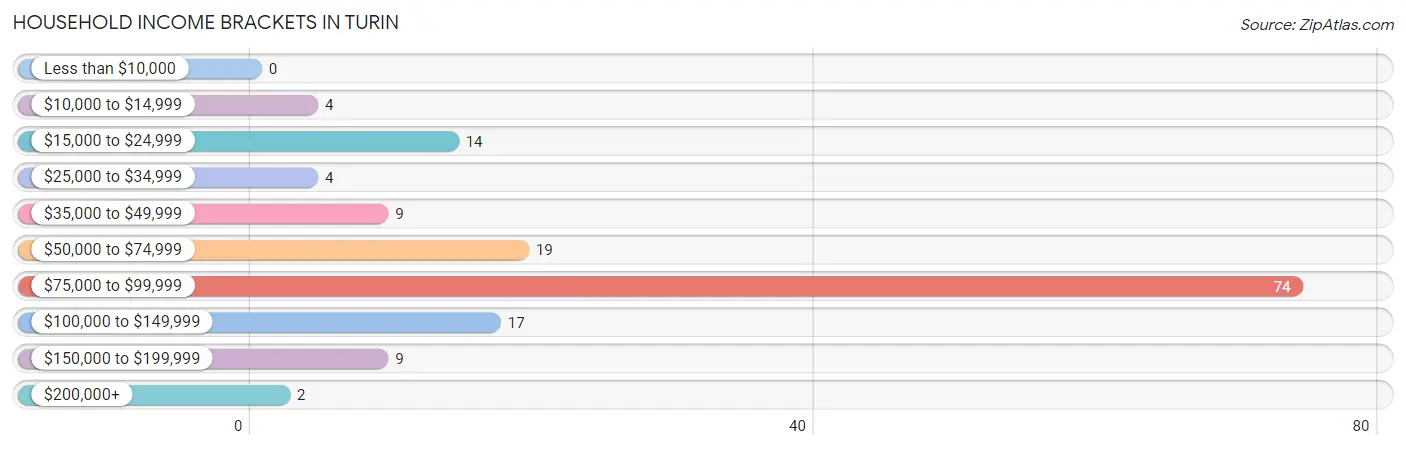
Household Income Brackets in Turin
With 74 households falling in the category, the $75,000 to $99,999 income range is the most frequent in Turin, accounting for 48.7% of all households.
| Income Bracket | # Households | % Households |
| Less than $10,000 | 0 | 0.0% |
| $10,000 to $14,999 | 4 | 2.6% |
| $15,000 to $24,999 | 14 | 9.2% |
| $25,000 to $34,999 | 4 | 2.6% |
| $35,000 to $49,999 | 9 | 5.9% |
| $50,000 to $74,999 | 19 | 12.5% |
| $75,000 to $99,999 | 74 | 48.7% |
| $100,000 to $149,999 | 17 | 11.2% |
| $150,000 to $199,999 | 9 | 5.9% |
| $200,000+ | 2 | 1.3% |
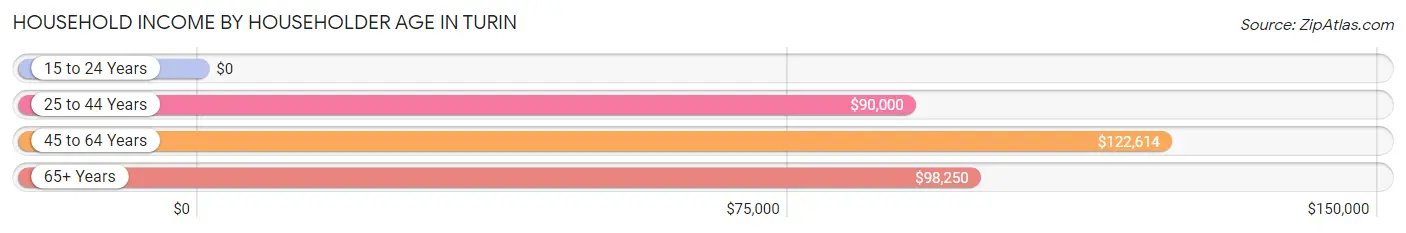
Household Income by Householder Age in Turin
The median household income in Turin is $97,818, with the highest median household income of $122,614 found in the 45 to 64 years age bracket for the primary householder. A total of 29 households (19.1%) fall into this category.
| Income Bracket | # Households | Median Income |
| 15 to 24 Years | 0 (0.0%) | $0 |
| 25 to 44 Years | 46 (30.3%) | $90,000 |
| 45 to 64 Years | 29 (19.1%) | $122,614 |
| 65+ Years | 77 (50.7%) | $98,250 |
| Total | 152 (100.0%) | $97,818 |
Poverty in Turin
Income Below Poverty by Sex and Age in Turin
With 17.9% poverty level for males and 12.7% for females among the residents of Turin, 6 to 11 year old males and 55 to 64 year old females are the most vulnerable to poverty, with 12 males (57.1%) and 6 females (46.2%) in their respective age groups living below the poverty level.
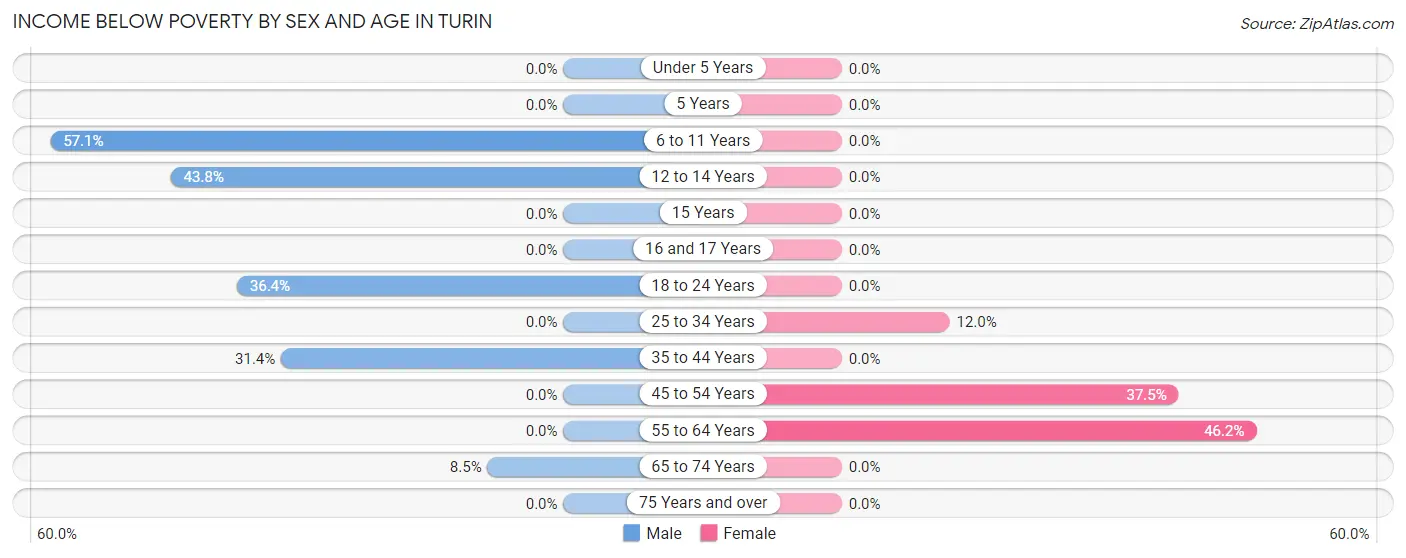
| Age Bracket | Male | Female |
| Under 5 Years | 0 (0.0%) | 0 (0.0%) |
| 5 Years | 0 (0.0%) | 0 (0.0%) |
| 6 to 11 Years | 12 (57.1%) | 0 (0.0%) |
| 12 to 14 Years | 7 (43.8%) | 0 (0.0%) |
| 15 Years | 0 (0.0%) | 0 (0.0%) |
| 16 and 17 Years | 0 (0.0%) | 0 (0.0%) |
| 18 to 24 Years | 4 (36.4%) | 0 (0.0%) |
| 25 to 34 Years | 0 (0.0%) | 3 (12.0%) |
| 35 to 44 Years | 11 (31.4%) | 0 (0.0%) |
| 45 to 54 Years | 0 (0.0%) | 9 (37.5%) |
| 55 to 64 Years | 0 (0.0%) | 6 (46.2%) |
| 65 to 74 Years | 6 (8.5%) | 0 (0.0%) |
| 75 Years and over | 0 (0.0%) | 0 (0.0%) |
| Total | 40 (17.9%) | 18 (12.7%) |
Income Above Poverty by Sex and Age in Turin
According to the poverty statistics in Turin, males aged under 5 years and females aged under 5 years are the age groups that are most secure financially, with 100.0% of males and 100.0% of females in these age groups living above the poverty line.
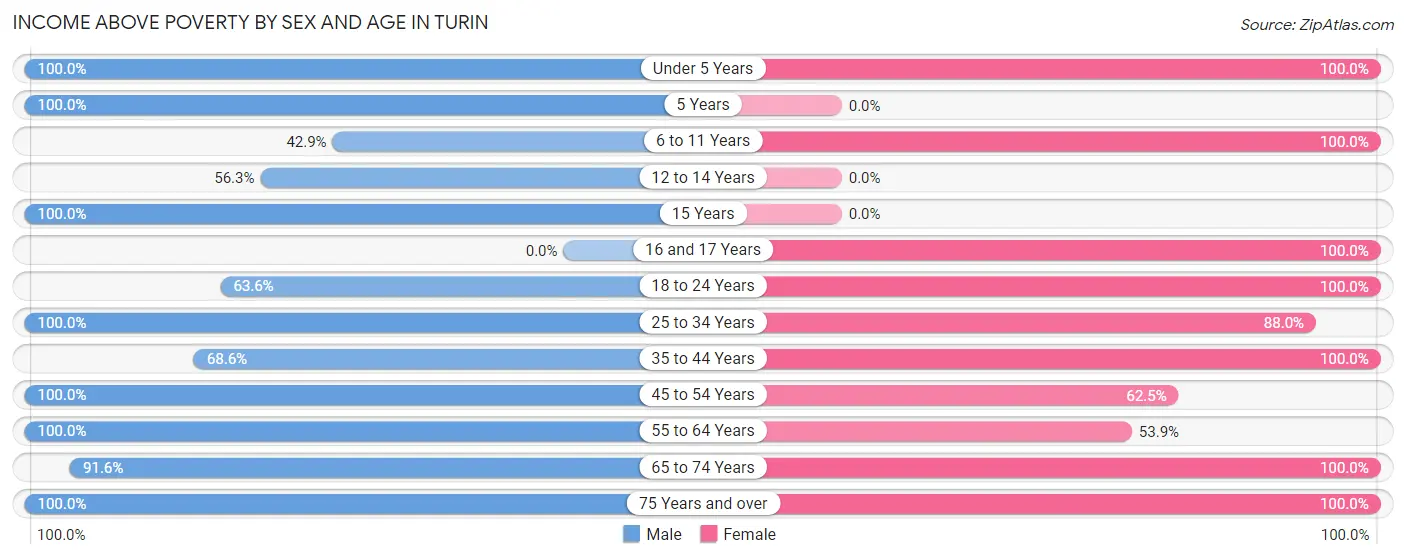
| Age Bracket | Male | Female |
| Under 5 Years | 20 (100.0%) | 12 (100.0%) |
| 5 Years | 7 (100.0%) | 0 (0.0%) |
| 6 to 11 Years | 9 (42.9%) | 11 (100.0%) |
| 12 to 14 Years | 9 (56.2%) | 0 (0.0%) |
| 15 Years | 2 (100.0%) | 0 (0.0%) |
| 16 and 17 Years | 0 (0.0%) | 3 (100.0%) |
| 18 to 24 Years | 7 (63.6%) | 16 (100.0%) |
| 25 to 34 Years | 16 (100.0%) | 22 (88.0%) |
| 35 to 44 Years | 24 (68.6%) | 24 (100.0%) |
| 45 to 54 Years | 18 (100.0%) | 15 (62.5%) |
| 55 to 64 Years | 2 (100.0%) | 7 (53.8%) |
| 65 to 74 Years | 65 (91.5%) | 8 (100.0%) |
| 75 Years and over | 4 (100.0%) | 6 (100.0%) |
| Total | 183 (82.1%) | 124 (87.3%) |
Income Below Poverty Among Married-Couple Families in Turin
The poverty statistics for married-couple families in Turin show that 19.3% or 11 of the total 57 families live below the poverty line. Families with 3 or 4 children have the highest poverty rate of 58.3%, comprising of 7 families. On the other hand, families with 1 or 2 children have the lowest poverty rate of 0.0%, which includes 0 families.
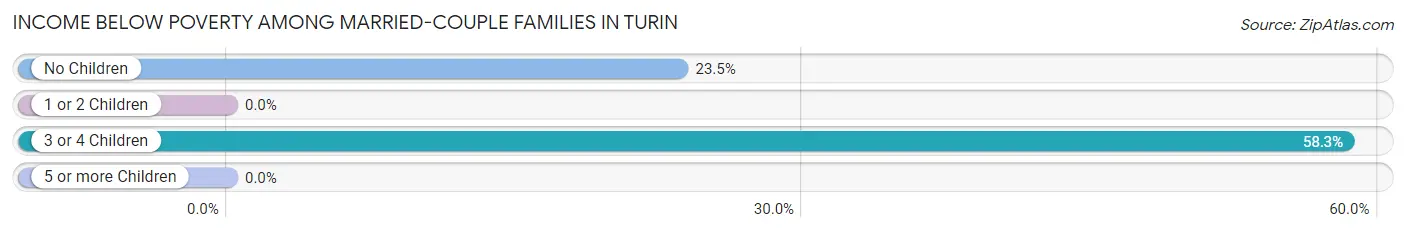
| Children | Above Poverty | Below Poverty |
| No Children | 13 (76.5%) | 4 (23.5%) |
| 1 or 2 Children | 28 (100.0%) | 0 (0.0%) |
| 3 or 4 Children | 5 (41.7%) | 7 (58.3%) |
| 5 or more Children | 0 (0.0%) | 0 (0.0%) |
| Total | 46 (80.7%) | 11 (19.3%) |
Income Below Poverty Among Single-Parent Households in Turin
| Children | Single Father | Single Mother |
| No Children | 0 (0.0%) | 0 (0.0%) |
| 1 or 2 Children | 0 (0.0%) | 0 (0.0%) |
| 3 or 4 Children | 0 (0.0%) | 0 (0.0%) |
| 5 or more Children | 0 (0.0%) | 0 (0.0%) |
| Total | 0 (0.0%) | 0 (0.0%) |
Income Below Poverty Among Married-Couple vs Single-Parent Households in Turin
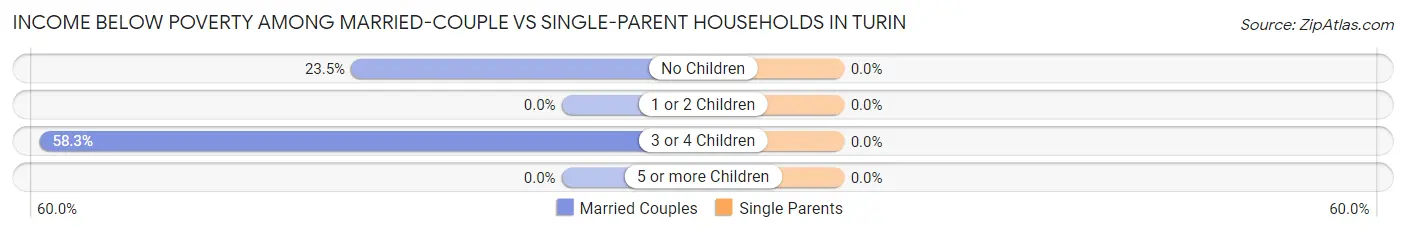
| Children | Married-Couple Families | Single-Parent Households |
| No Children | 4 (23.5%) | 0 (0.0%) |
| 1 or 2 Children | 0 (0.0%) | 0 (0.0%) |
| 3 or 4 Children | 7 (58.3%) | 0 (0.0%) |
| 5 or more Children | 0 (0.0%) | 0 (0.0%) |
| Total | 11 (19.3%) | 0 (0.0%) |
Race in Turin
The most populous races in Turin are White / Caucasian (283 | 76.5%), Some other Race (76 | 20.5%), and Two or more Races (6 | 1.6%).
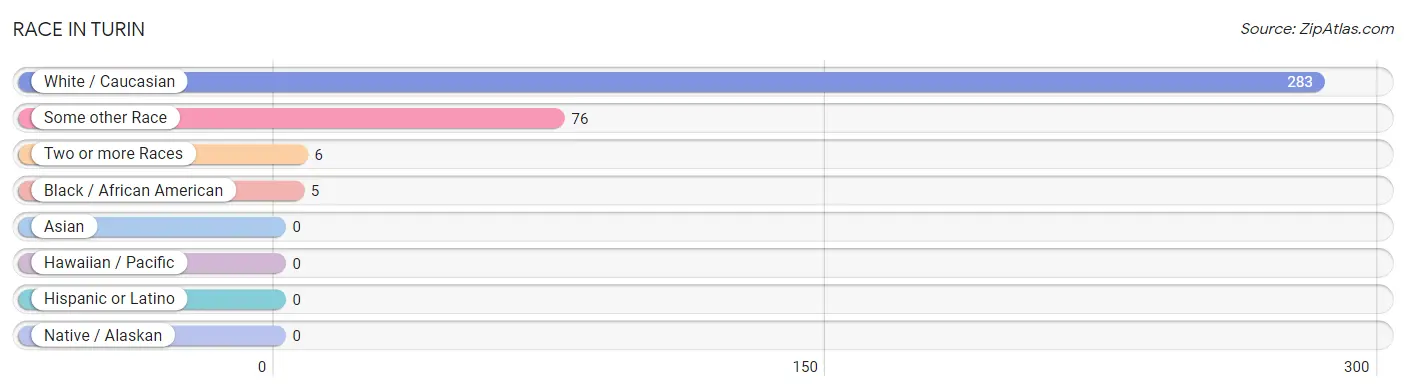
| Race | # Population | % Population |
| Asian | 0 | 0.0% |
| Black / African American | 5 | 1.3% |
| Hawaiian / Pacific | 0 | 0.0% |
| Hispanic or Latino | 0 | 0.0% |
| Native / Alaskan | 0 | 0.0% |
| White / Caucasian | 283 | 76.5% |
| Two or more Races | 6 | 1.6% |
| Some other Race | 76 | 20.5% |
| Total | 370 | 100.0% |
Ancestry in Turin
The most populous ancestries reported in Turin are German (62 | 16.8%), Polish (61 | 16.5%), English (40 | 10.8%), Irish (28 | 7.6%), and American (20 | 5.4%), together accounting for 57.0% of all Turin residents.
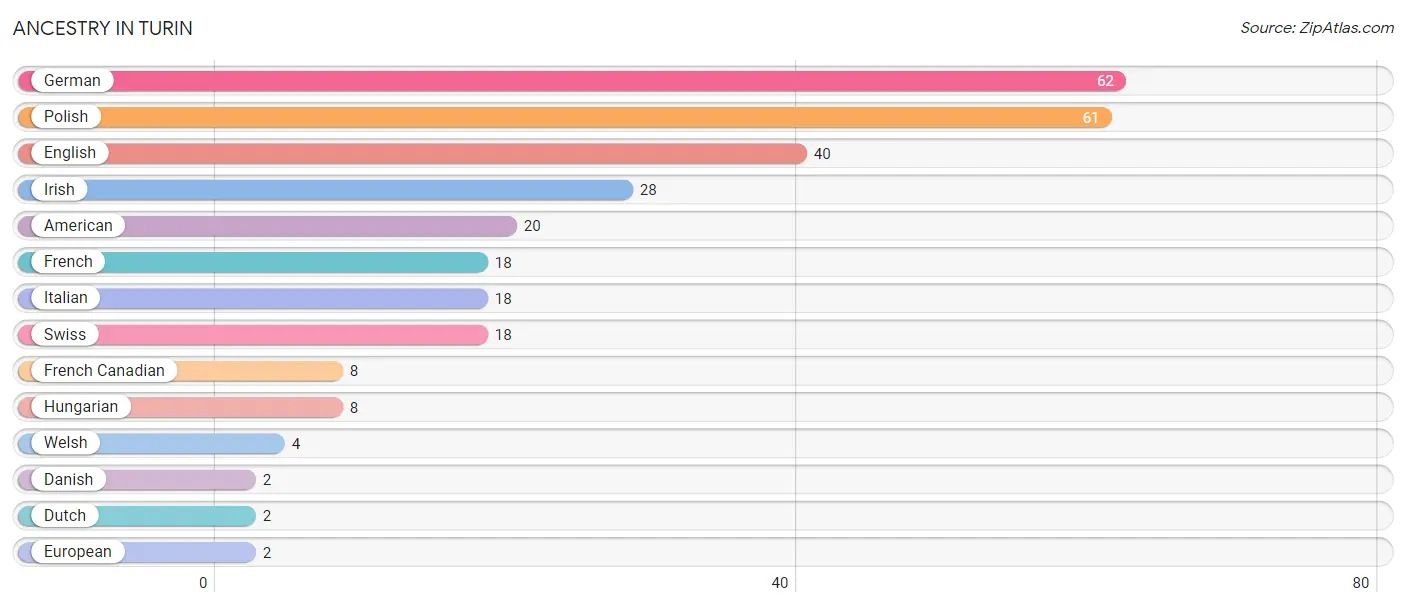
| Ancestry | # Population | % Population |
| American | 20 | 5.4% |
| Danish | 2 | 0.5% |
| Dutch | 2 | 0.5% |
| English | 40 | 10.8% |
| European | 2 | 0.5% |
| French | 18 | 4.9% |
| French Canadian | 8 | 2.2% |
| German | 62 | 16.8% |
| Hungarian | 8 | 2.2% |
| Irish | 28 | 7.6% |
| Italian | 18 | 4.9% |
| Polish | 61 | 16.5% |
| Swiss | 18 | 4.9% |
| Welsh | 4 | 1.1% | View All 14 Rows |
Immigrants in Turin

| Immigration Origin | # Population | % Population | View All 0 Rows |
Sex and Age in Turin
Sex and Age in Turin
The most populous age groups in Turin are 65 to 69 Years (69 | 30.3%) for men and 30 to 34 Years (18 | 12.7%) for women.
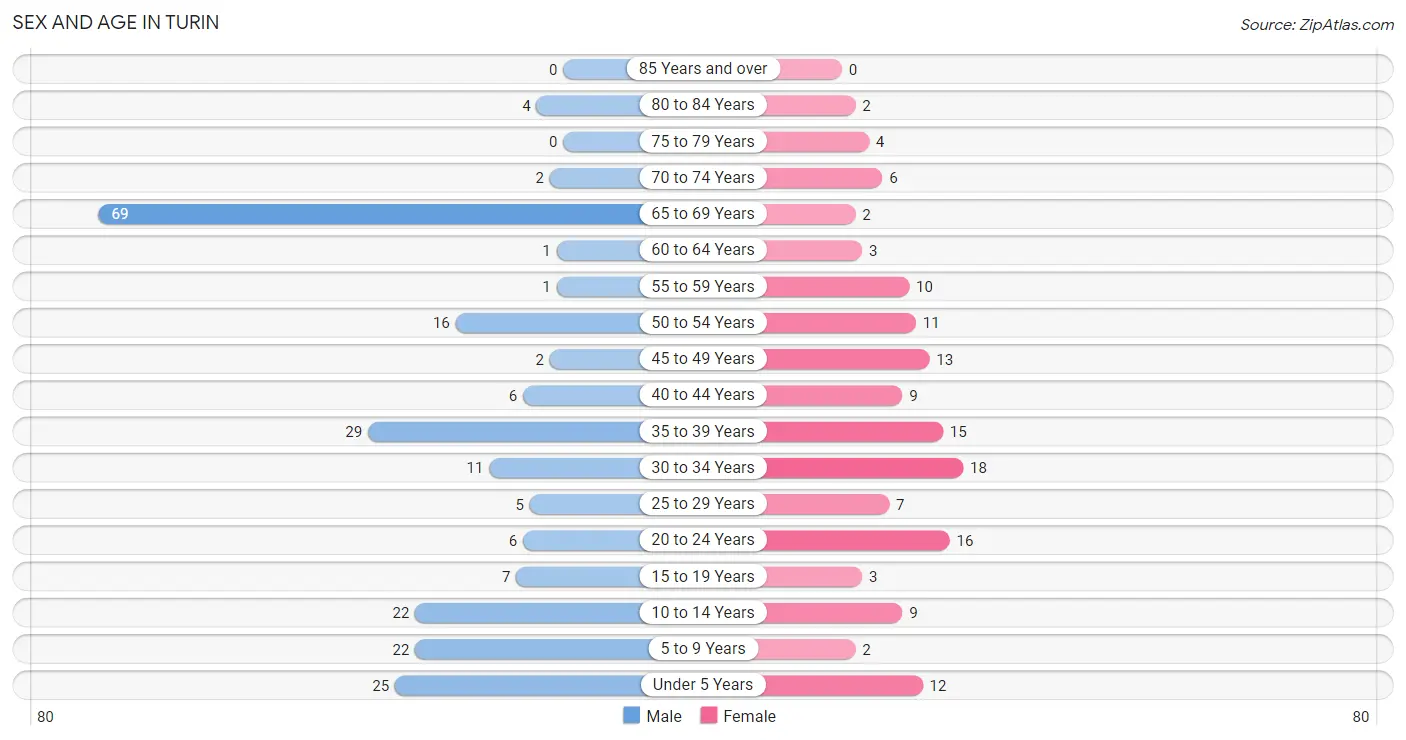
| Age Bracket | Male | Female |
| Under 5 Years | 25 (11.0%) | 12 (8.5%) |
| 5 to 9 Years | 22 (9.7%) | 2 (1.4%) |
| 10 to 14 Years | 22 (9.7%) | 9 (6.3%) |
| 15 to 19 Years | 7 (3.1%) | 3 (2.1%) |
| 20 to 24 Years | 6 (2.6%) | 16 (11.3%) |
| 25 to 29 Years | 5 (2.2%) | 7 (4.9%) |
| 30 to 34 Years | 11 (4.8%) | 18 (12.7%) |
| 35 to 39 Years | 29 (12.7%) | 15 (10.6%) |
| 40 to 44 Years | 6 (2.6%) | 9 (6.3%) |
| 45 to 49 Years | 2 (0.9%) | 13 (9.1%) |
| 50 to 54 Years | 16 (7.0%) | 11 (7.7%) |
| 55 to 59 Years | 1 (0.4%) | 10 (7.0%) |
| 60 to 64 Years | 1 (0.4%) | 3 (2.1%) |
| 65 to 69 Years | 69 (30.3%) | 2 (1.4%) |
| 70 to 74 Years | 2 (0.9%) | 6 (4.2%) |
| 75 to 79 Years | 0 (0.0%) | 4 (2.8%) |
| 80 to 84 Years | 4 (1.8%) | 2 (1.4%) |
| 85 Years and over | 0 (0.0%) | 0 (0.0%) |
| Total | 228 (100.0%) | 142 (100.0%) |
Families and Households in Turin
Median Family Size in Turin
The median family size in Turin is 2.45 persons per family, with married-couple families (57 | 47.1%) accounting for the largest median family size of 3.54 persons per family. On the other hand, single male/father families (62 | 51.2%) represent the smallest median family size with 1.45 persons per family.
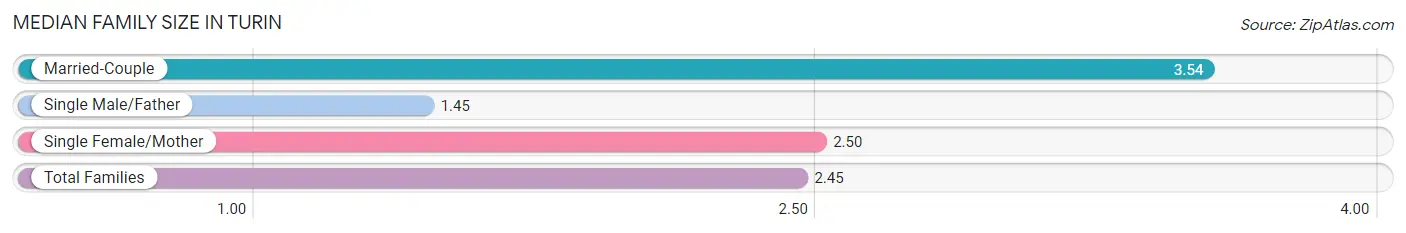
| Family Type | # Families | Family Size |
| Married-Couple | 57 (47.1%) | 3.54 |
| Single Male/Father | 62 (51.2%) | 1.45 |
| Single Female/Mother | 2 (1.7%) | 2.50 |
| Total Families | 121 (100.0%) | 2.45 |
Median Household Size in Turin
The median household size in Turin is 2.43 persons per household, with single female/mother households (2 | 1.3%) accounting for the largest median household size of 5.5 persons per household. non-family households (31 | 20.4%) represent the smallest median household size with 1.61 persons per household.
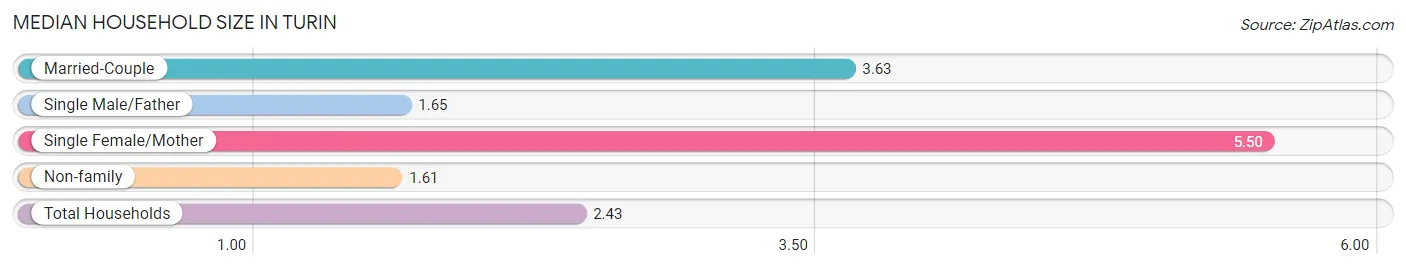
| Household Type | # Households | Household Size |
| Married-Couple | 57 (37.5%) | 3.63 |
| Single Male/Father | 62 (40.8%) | 1.65 |
| Single Female/Mother | 2 (1.3%) | 5.50 |
| Non-family | 31 (20.4%) | 1.61 |
| Total Households | 152 (100.0%) | 2.43 |
Household Size by Marriage Status in Turin
Out of a total of 152 households in Turin, 121 (79.6%) are family households, while 31 (20.4%) are nonfamily households. The most numerous type of family households are 4-person households, comprising 77, and the most common type of nonfamily households are 1-person households, comprising 12.
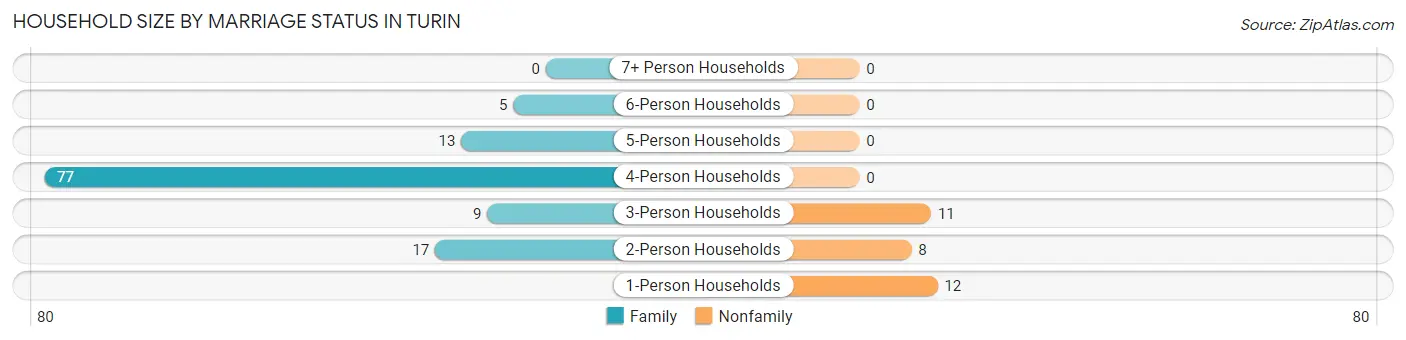
| Household Size | Family Households | Nonfamily Households |
| 1-Person Households | - | 12 (7.9%) |
| 2-Person Households | 17 (11.2%) | 8 (5.3%) |
| 3-Person Households | 9 (5.9%) | 11 (7.2%) |
| 4-Person Households | 77 (50.7%) | 0 (0.0%) |
| 5-Person Households | 13 (8.6%) | 0 (0.0%) |
| 6-Person Households | 5 (3.3%) | 0 (0.0%) |
| 7+ Person Households | 0 (0.0%) | 0 (0.0%) |
| Total | 121 (79.6%) | 31 (20.4%) |
Female Fertility in Turin
Fertility by Age in Turin
Average fertility rate in Turin is 102.0 births per 1,000 women. Women in the age bracket of 35 to 50 years have the highest fertility rate with 114.0 births per 1,000 women. Women in the age bracket of 35 to 50 years acount for 55.6% of all women with births.
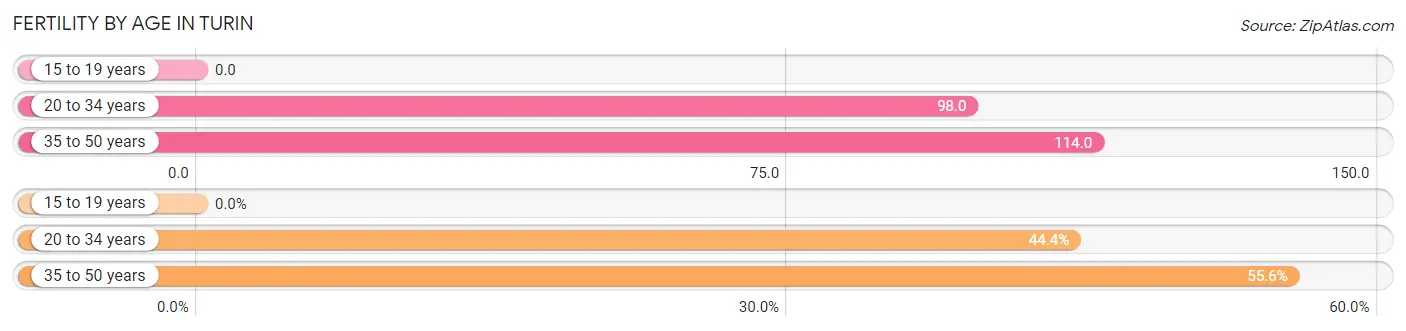
| Age Bracket | Women with Births | Births / 1,000 Women |
| 15 to 19 years | 0 (0.0%) | 0.0 |
| 20 to 34 years | 4 (44.4%) | 98.0 |
| 35 to 50 years | 5 (55.6%) | 114.0 |
| Total | 9 (100.0%) | 102.0 |
Fertility by Age by Marriage Status in Turin
55.6% of women with births (9) in Turin are married. The highest percentage of unmarried women with births falls into 20 to 34 years age bracket with 100.0% of them unmarried at the time of birth, while the lowest percentage of unmarried women with births belong to 35 to 50 years age bracket with 0.0% of them unmarried.
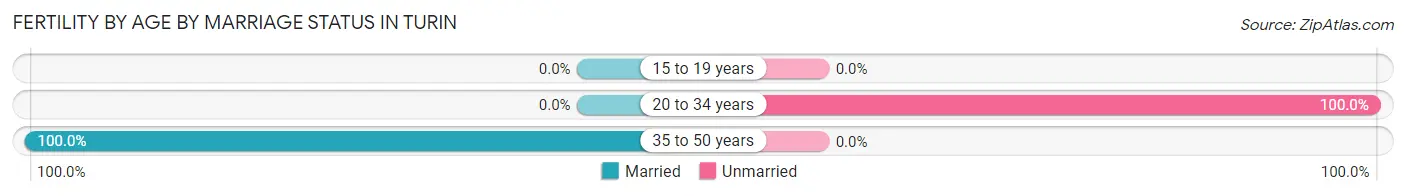
| Age Bracket | Married | Unmarried |
| 15 to 19 years | 0 (0.0%) | 0 (0.0%) |
| 20 to 34 years | 0 (0.0%) | 4 (100.0%) |
| 35 to 50 years | 5 (100.0%) | 0 (0.0%) |
| Total | 5 (55.6%) | 4 (44.4%) |
Fertility by Education in Turin
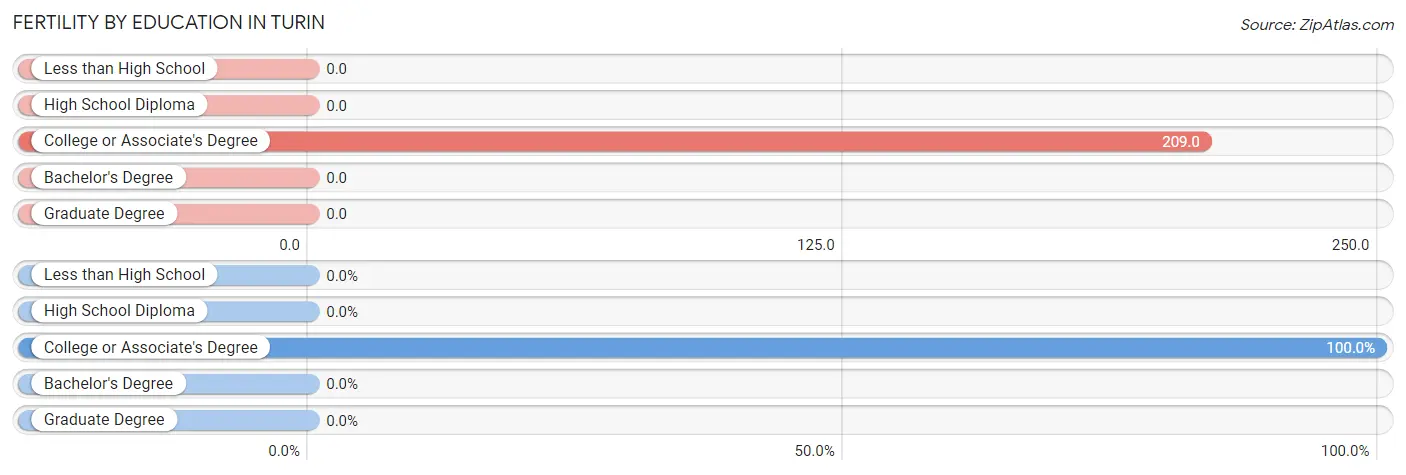
| Educational Attainment | Women with Births | Births / 1,000 Women |
| Less than High School | 0 (0.0%) | 0.0 |
| High School Diploma | 0 (0.0%) | 0.0 |
| College or Associate's Degree | 9 (100.0%) | 209.0 |
| Bachelor's Degree | 0 (0.0%) | 0.0 |
| Graduate Degree | 0 (0.0%) | 0.0 |
| Total | 9 (100.0%) | 102.0 |
Fertility by Education by Marriage Status in Turin
44.4% of women with births in Turin are unmarried. Women with the educational attainment of college or associate's degree are most likely to be married with 55.6% of them married at childbirth, while women with the educational attainment of college or associate's degree are least likely to be married with 44.4% of them unmarried at childbirth.
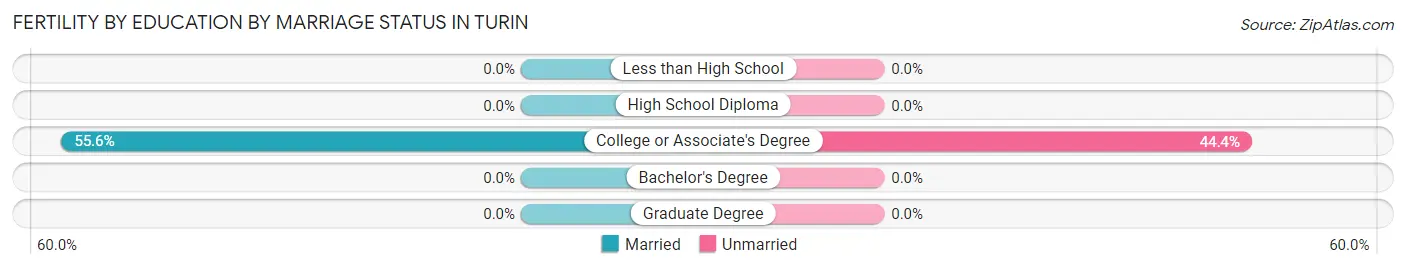
| Educational Attainment | Married | Unmarried |
| Less than High School | 0 (0.0%) | 0 (0.0%) |
| High School Diploma | 0 (0.0%) | 0 (0.0%) |
| College or Associate's Degree | 5 (55.6%) | 4 (44.4%) |
| Bachelor's Degree | 0 (0.0%) | 0 (0.0%) |
| Graduate Degree | 0 (0.0%) | 0 (0.0%) |
| Total | 5 (55.6%) | 4 (44.4%) |
Employment Characteristics in Turin
Employment by Class of Employer in Turin
Among the 143 employed individuals in Turin, private company employees (77 | 53.8%), local government employees (33 | 23.1%), and state government employees (13 | 9.1%) make up the most common classes of employment.
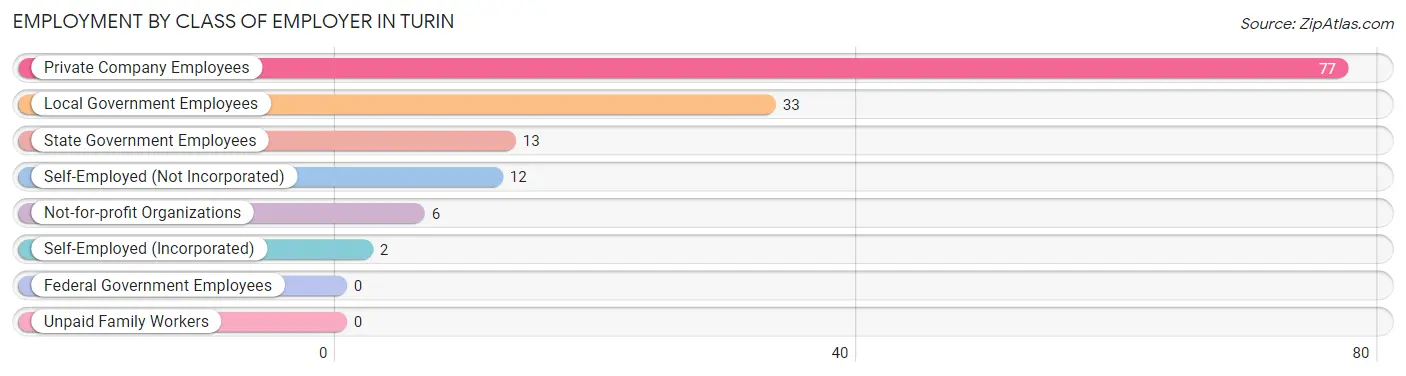
| Employer Class | # Employees | % Employees |
| Private Company Employees | 77 | 53.8% |
| Self-Employed (Incorporated) | 2 | 1.4% |
| Self-Employed (Not Incorporated) | 12 | 8.4% |
| Not-for-profit Organizations | 6 | 4.2% |
| Local Government Employees | 33 | 23.1% |
| State Government Employees | 13 | 9.1% |
| Federal Government Employees | 0 | 0.0% |
| Unpaid Family Workers | 0 | 0.0% |
| Total | 143 | 100.0% |
Employment Status by Age in Turin
According to the labor force statistics for Turin, out of the total population over 16 years of age (276), 56.5% or 156 individuals are in the labor force, with 5.8% or 9 of them unemployed. The age group with the highest labor force participation rate is 45 to 54 years, with 95.2% or 40 individuals in the labor force. Within the labor force, the 20 to 24 years age range has the highest percentage of unemployed individuals, with 57.1% or 8 of them being unemployed.
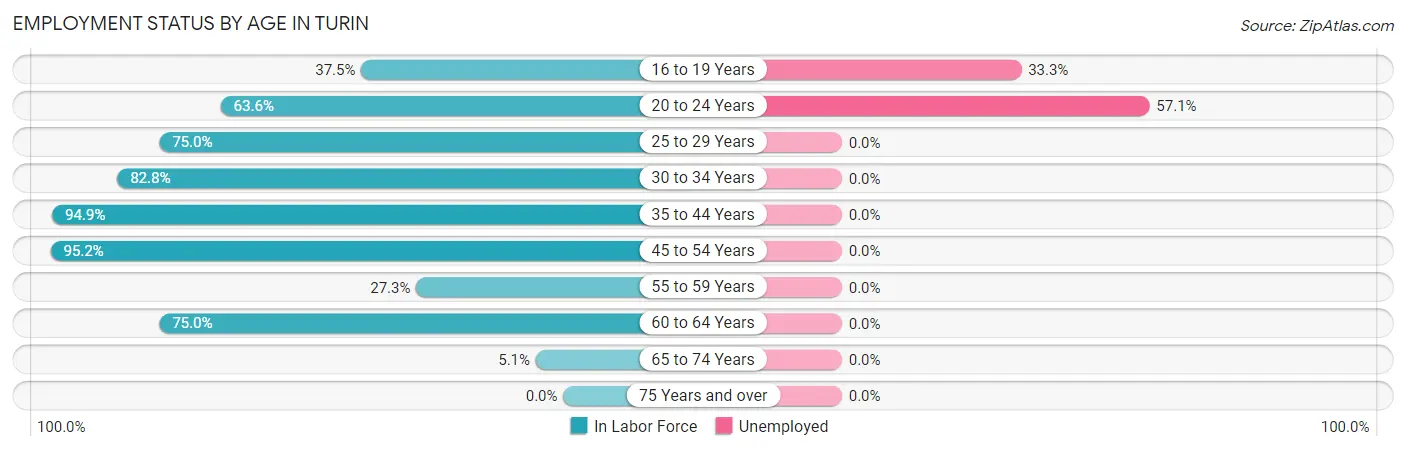
| Age Bracket | In Labor Force | Unemployed |
| 16 to 19 Years | 3 (37.5%) | 1 (33.3%) |
| 20 to 24 Years | 14 (63.6%) | 8 (57.1%) |
| 25 to 29 Years | 9 (75.0%) | 0 (0.0%) |
| 30 to 34 Years | 24 (82.8%) | 0 (0.0%) |
| 35 to 44 Years | 56 (94.9%) | 0 (0.0%) |
| 45 to 54 Years | 40 (95.2%) | 0 (0.0%) |
| 55 to 59 Years | 3 (27.3%) | 0 (0.0%) |
| 60 to 64 Years | 3 (75.0%) | 0 (0.0%) |
| 65 to 74 Years | 4 (5.1%) | 0 (0.0%) |
| 75 Years and over | 0 (0.0%) | 0 (0.0%) |
| Total | 156 (56.5%) | 9 (5.8%) |
Employment Status by Educational Attainment in Turin
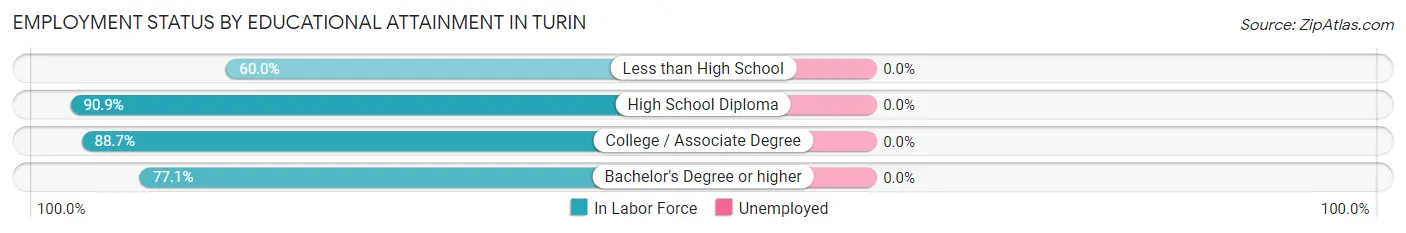
| Educational Attainment | In Labor Force | Unemployed |
| Less than High School | 3 (60.0%) | 0 (0.0%) |
| High School Diploma | 50 (90.9%) | 0 (0.0%) |
| College / Associate Degree | 55 (88.7%) | 0 (0.0%) |
| Bachelor's Degree or higher | 27 (77.1%) | 0 (0.0%) |
| Total | 135 (86.0%) | 0 (0.0%) |
Employment Occupations by Sex in Turin
Management, Business, Science and Arts Occupations
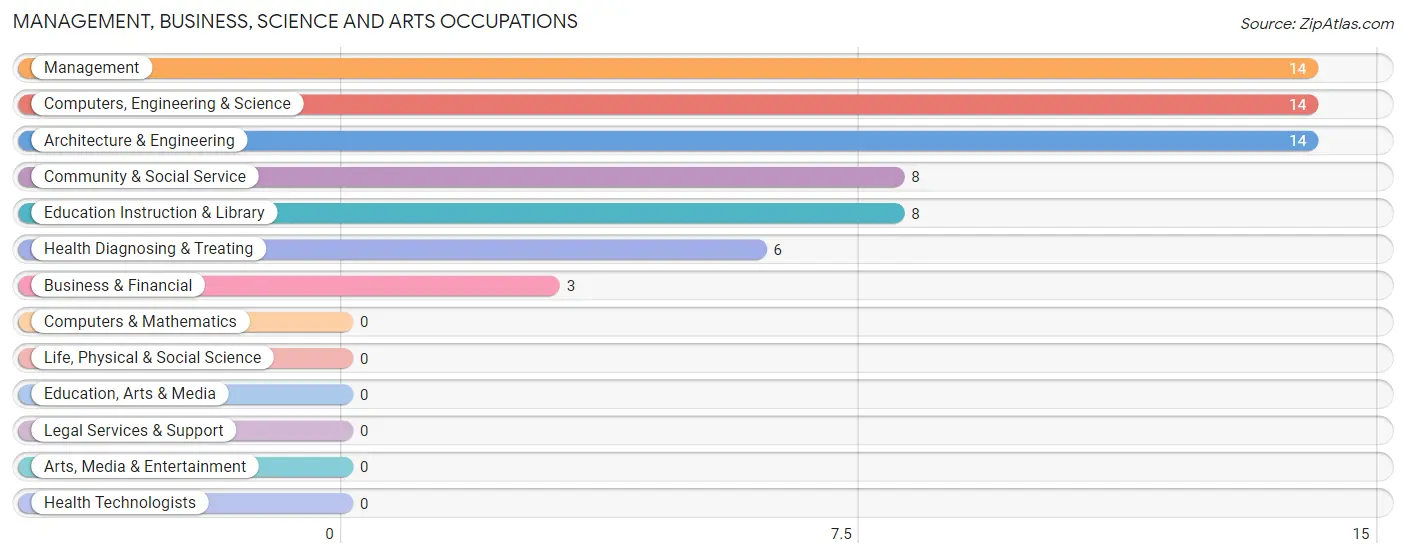
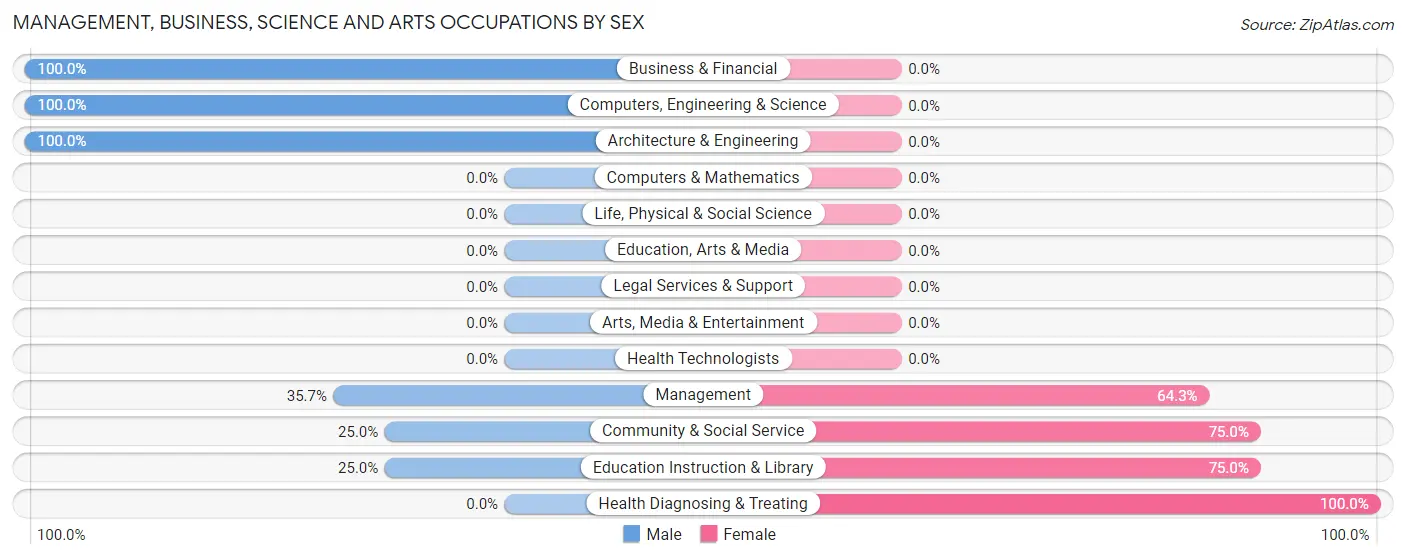
The most common Management, Business, Science and Arts occupations in Turin are Management (14 | 9.5%), Computers, Engineering & Science (14 | 9.5%), Architecture & Engineering (14 | 9.5%), Community & Social Service (8 | 5.4%), and Education Instruction & Library (8 | 5.4%).
Management, Business, Science and Arts Occupations by Sex
Within the Management, Business, Science and Arts occupations in Turin, the most male-oriented occupations are Business & Financial (100.0%), Computers, Engineering & Science (100.0%), and Architecture & Engineering (100.0%), while the most female-oriented occupations are Health Diagnosing & Treating (100.0%), Community & Social Service (75.0%), and Education Instruction & Library (75.0%).
| Occupation | Male | Female |
| Management | 5 (35.7%) | 9 (64.3%) |
| Business & Financial | 3 (100.0%) | 0 (0.0%) |
| Computers, Engineering & Science | 14 (100.0%) | 0 (0.0%) |
| Computers & Mathematics | 0 (0.0%) | 0 (0.0%) |
| Architecture & Engineering | 14 (100.0%) | 0 (0.0%) |
| Life, Physical & Social Science | 0 (0.0%) | 0 (0.0%) |
| Community & Social Service | 2 (25.0%) | 6 (75.0%) |
| Education, Arts & Media | 0 (0.0%) | 0 (0.0%) |
| Legal Services & Support | 0 (0.0%) | 0 (0.0%) |
| Education Instruction & Library | 2 (25.0%) | 6 (75.0%) |
| Arts, Media & Entertainment | 0 (0.0%) | 0 (0.0%) |
| Health Diagnosing & Treating | 0 (0.0%) | 6 (100.0%) |
| Health Technologists | 0 (0.0%) | 0 (0.0%) |
| Total (Category) | 24 (53.3%) | 21 (46.7%) |
| Total (Overall) | 76 (51.7%) | 71 (48.3%) |
Services Occupations
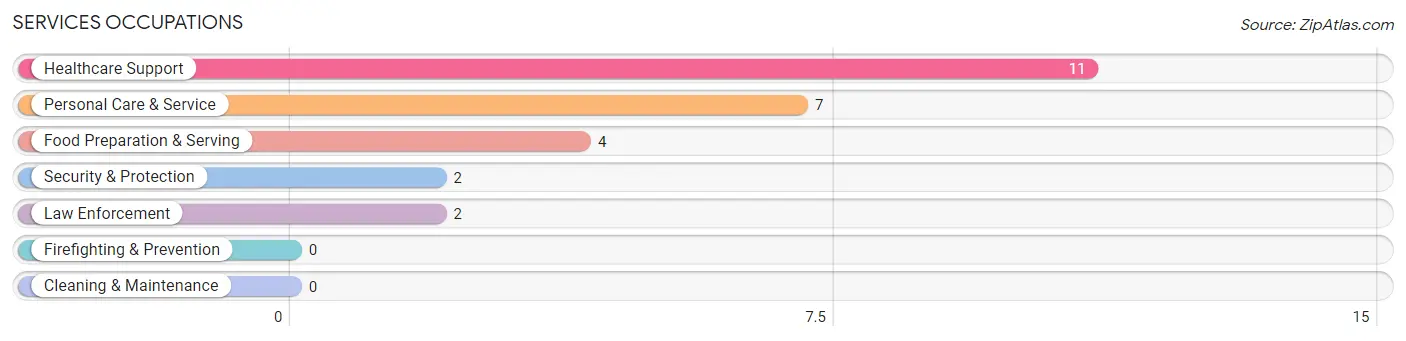
The most common Services occupations in Turin are Healthcare Support (11 | 7.5%), Personal Care & Service (7 | 4.8%), Food Preparation & Serving (4 | 2.7%), Security & Protection (2 | 1.4%), and Law Enforcement (2 | 1.4%).
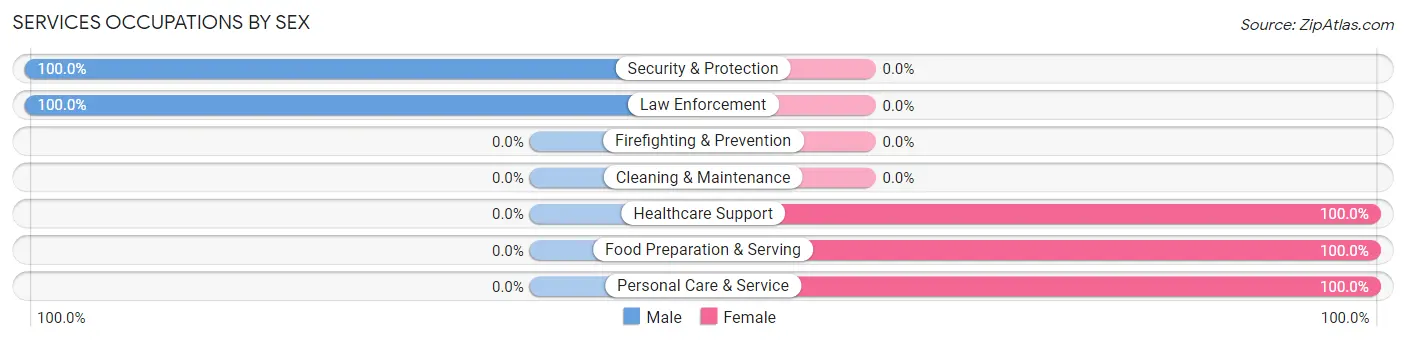
Services Occupations by Sex
Within the Services occupations in Turin, the most male-oriented occupations are Security & Protection (100.0%), and Law Enforcement (100.0%), while the most female-oriented occupations are Healthcare Support (100.0%), Food Preparation & Serving (100.0%), and Personal Care & Service (100.0%).
| Occupation | Male | Female |
| Healthcare Support | 0 (0.0%) | 11 (100.0%) |
| Security & Protection | 2 (100.0%) | 0 (0.0%) |
| Firefighting & Prevention | 0 (0.0%) | 0 (0.0%) |
| Law Enforcement | 2 (100.0%) | 0 (0.0%) |
| Food Preparation & Serving | 0 (0.0%) | 4 (100.0%) |
| Cleaning & Maintenance | 0 (0.0%) | 0 (0.0%) |
| Personal Care & Service | 0 (0.0%) | 7 (100.0%) |
| Total (Category) | 2 (8.3%) | 22 (91.7%) |
| Total (Overall) | 76 (51.7%) | 71 (48.3%) |
Sales and Office Occupations
The most common Sales and Office occupations in Turin are Sales & Related (25 | 17.0%), and Office & Administration (14 | 9.5%).
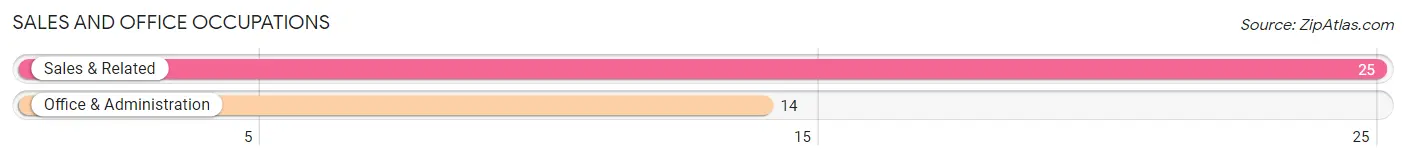
Sales and Office Occupations by Sex
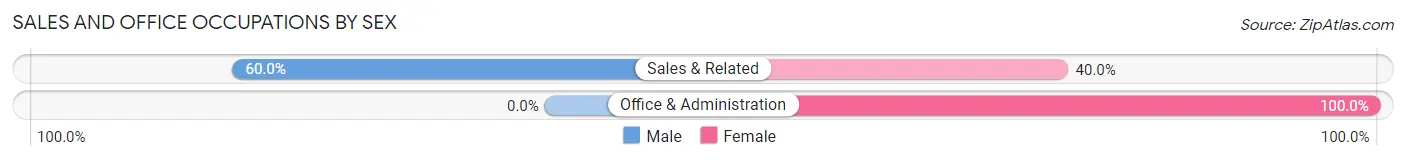
| Occupation | Male | Female |
| Sales & Related | 15 (60.0%) | 10 (40.0%) |
| Office & Administration | 0 (0.0%) | 14 (100.0%) |
| Total (Category) | 15 (38.5%) | 24 (61.5%) |
| Total (Overall) | 76 (51.7%) | 71 (48.3%) |
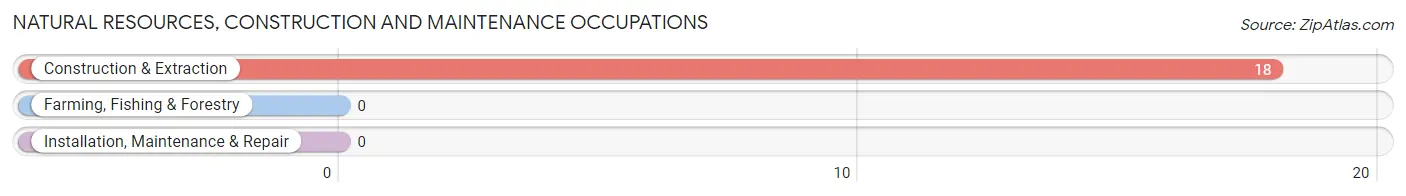
Natural Resources, Construction and Maintenance Occupations
The most common Natural Resources, Construction and Maintenance occupations in Turin are , and Construction & Extraction (18 | 12.2%).
Natural Resources, Construction and Maintenance Occupations by Sex
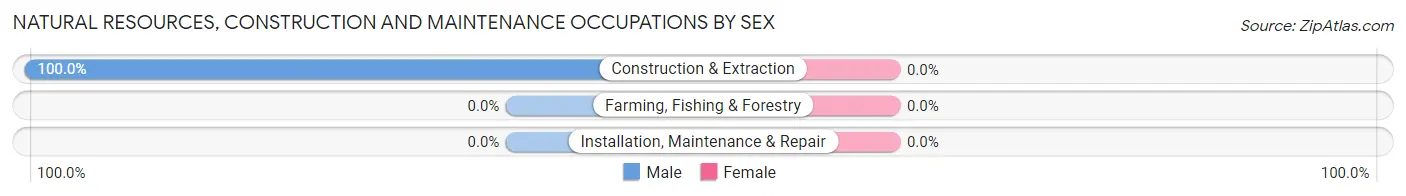
| Occupation | Male | Female |
| Farming, Fishing & Forestry | 0 (0.0%) | 0 (0.0%) |
| Construction & Extraction | 18 (100.0%) | 0 (0.0%) |
| Installation, Maintenance & Repair | 0 (0.0%) | 0 (0.0%) |
| Total (Category) | 18 (100.0%) | 0 (0.0%) |
| Total (Overall) | 76 (51.7%) | 71 (48.3%) |
Production, Transportation and Moving Occupations
The most common Production, Transportation and Moving occupations in Turin are Transportation (15 | 10.2%), Material Moving (5 | 3.4%), and Production (1 | 0.7%).
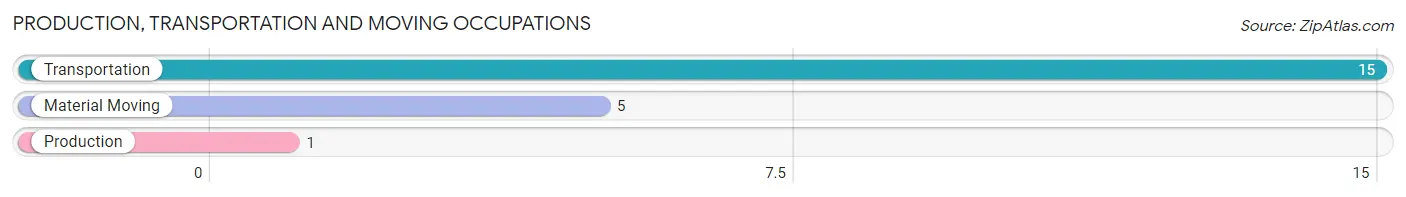
Production, Transportation and Moving Occupations by Sex
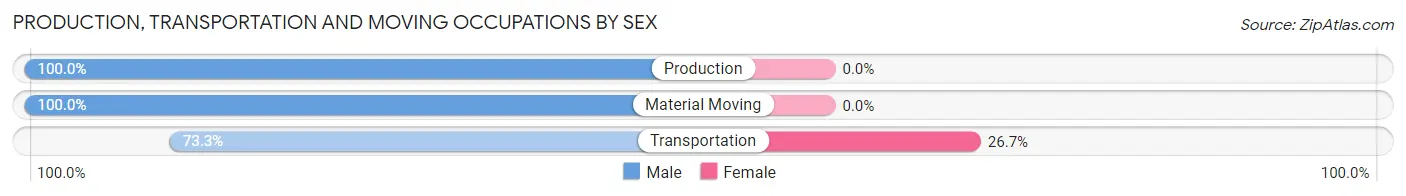
| Occupation | Male | Female |
| Production | 1 (100.0%) | 0 (0.0%) |
| Transportation | 11 (73.3%) | 4 (26.7%) |
| Material Moving | 5 (100.0%) | 0 (0.0%) |
| Total (Category) | 17 (80.9%) | 4 (19.1%) |
| Total (Overall) | 76 (51.7%) | 71 (48.3%) |
Employment Industries by Sex in Turin
Employment Industries in Turin
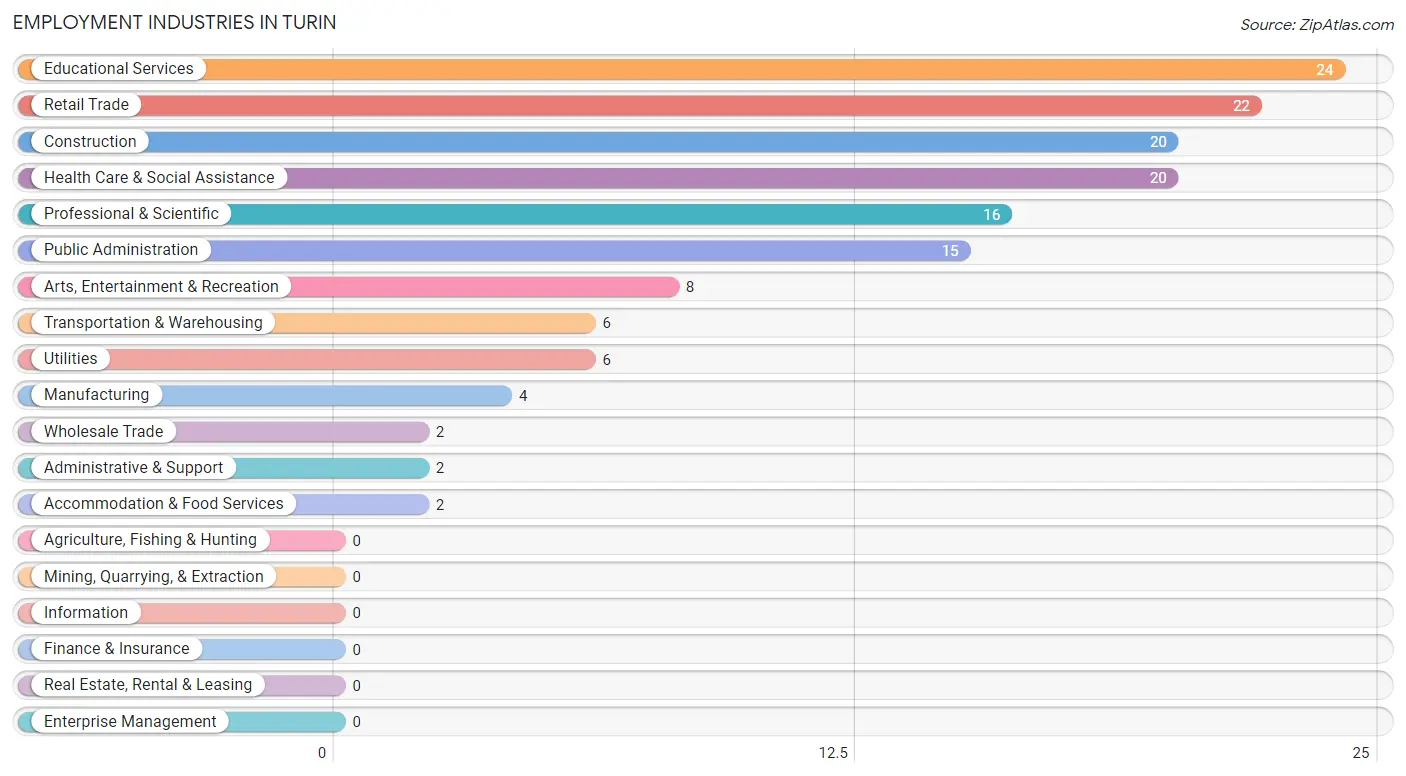
The major employment industries in Turin include Educational Services (24 | 16.3%), Retail Trade (22 | 15.0%), Construction (20 | 13.6%), Health Care & Social Assistance (20 | 13.6%), and Professional & Scientific (16 | 10.9%).
Employment Industries by Sex in Turin
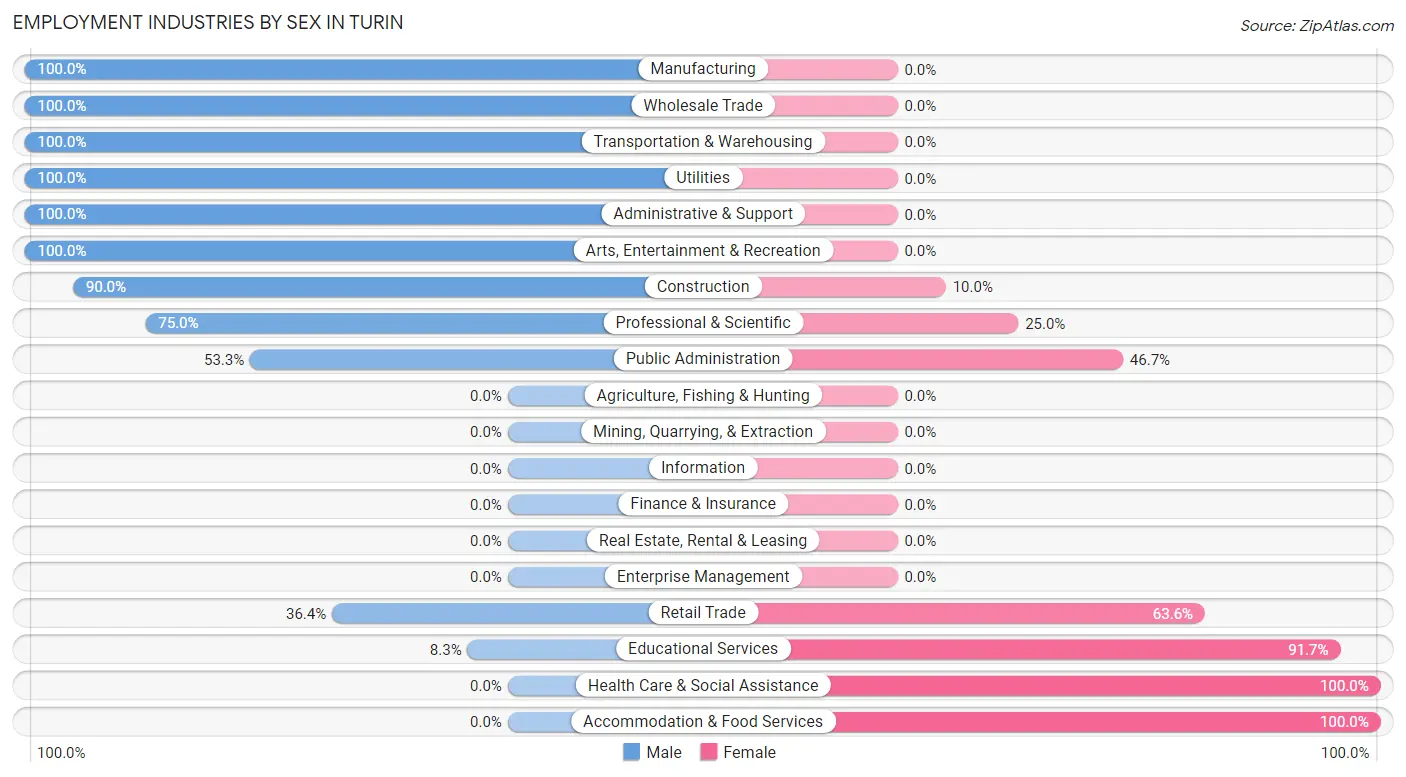
The Turin industries that see more men than women are Manufacturing (100.0%), Wholesale Trade (100.0%), and Transportation & Warehousing (100.0%), whereas the industries that tend to have a higher number of women are Health Care & Social Assistance (100.0%), Accommodation & Food Services (100.0%), and Educational Services (91.7%).
| Industry | Male | Female |
| Agriculture, Fishing & Hunting | 0 (0.0%) | 0 (0.0%) |
| Mining, Quarrying, & Extraction | 0 (0.0%) | 0 (0.0%) |
| Construction | 18 (90.0%) | 2 (10.0%) |
| Manufacturing | 4 (100.0%) | 0 (0.0%) |
| Wholesale Trade | 2 (100.0%) | 0 (0.0%) |
| Retail Trade | 8 (36.4%) | 14 (63.6%) |
| Transportation & Warehousing | 6 (100.0%) | 0 (0.0%) |
| Utilities | 6 (100.0%) | 0 (0.0%) |
| Information | 0 (0.0%) | 0 (0.0%) |
| Finance & Insurance | 0 (0.0%) | 0 (0.0%) |
| Real Estate, Rental & Leasing | 0 (0.0%) | 0 (0.0%) |
| Professional & Scientific | 12 (75.0%) | 4 (25.0%) |
| Enterprise Management | 0 (0.0%) | 0 (0.0%) |
| Administrative & Support | 2 (100.0%) | 0 (0.0%) |
| Educational Services | 2 (8.3%) | 22 (91.7%) |
| Health Care & Social Assistance | 0 (0.0%) | 20 (100.0%) |
| Arts, Entertainment & Recreation | 8 (100.0%) | 0 (0.0%) |
| Accommodation & Food Services | 0 (0.0%) | 2 (100.0%) |
| Public Administration | 8 (53.3%) | 7 (46.7%) |
| Total | 76 (51.7%) | 71 (48.3%) |
Education in Turin
School Enrollment in Turin
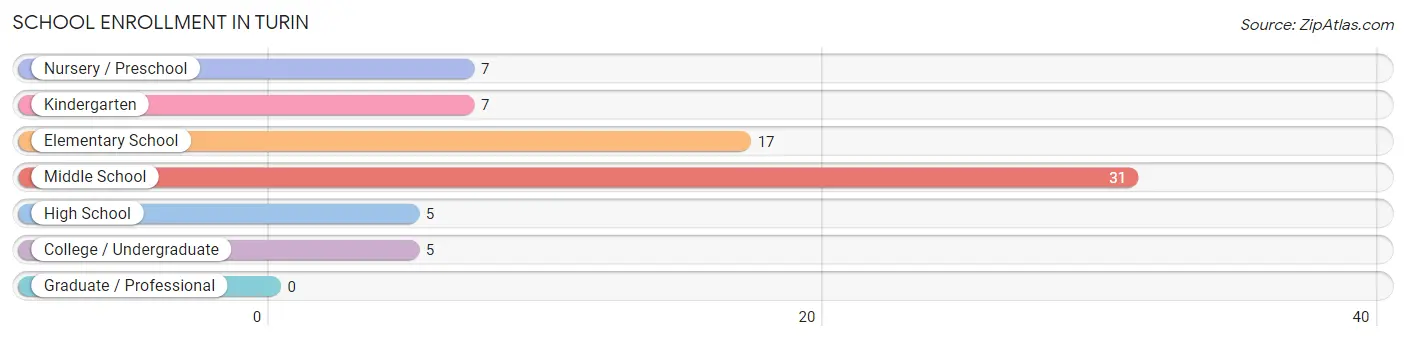
The most common levels of schooling among the 72 students in Turin are middle school (31 | 43.1%), elementary school (17 | 23.6%), and nursery / preschool (7 | 9.7%).
| School Level | # Students | % Students |
| Nursery / Preschool | 7 | 9.7% |
| Kindergarten | 7 | 9.7% |
| Elementary School | 17 | 23.6% |
| Middle School | 31 | 43.1% |
| High School | 5 | 6.9% |
| College / Undergraduate | 5 | 6.9% |
| Graduate / Professional | 0 | 0.0% |
| Total | 72 | 100.0% |
School Enrollment by Age by Funding Source in Turin
Out of a total of 72 students who are enrolled in schools in Turin, 19 (26.4%) attend a private institution, while the remaining 53 (73.6%) are enrolled in public schools. The age group of 25 to 34 year olds has the highest likelihood of being enrolled in private schools, with 5 (100.0% in the age bracket) enrolled. Conversely, the age group of 15 to 17 year olds has the lowest likelihood of being enrolled in a private school, with 5 (100.0% in the age bracket) attending a public institution.
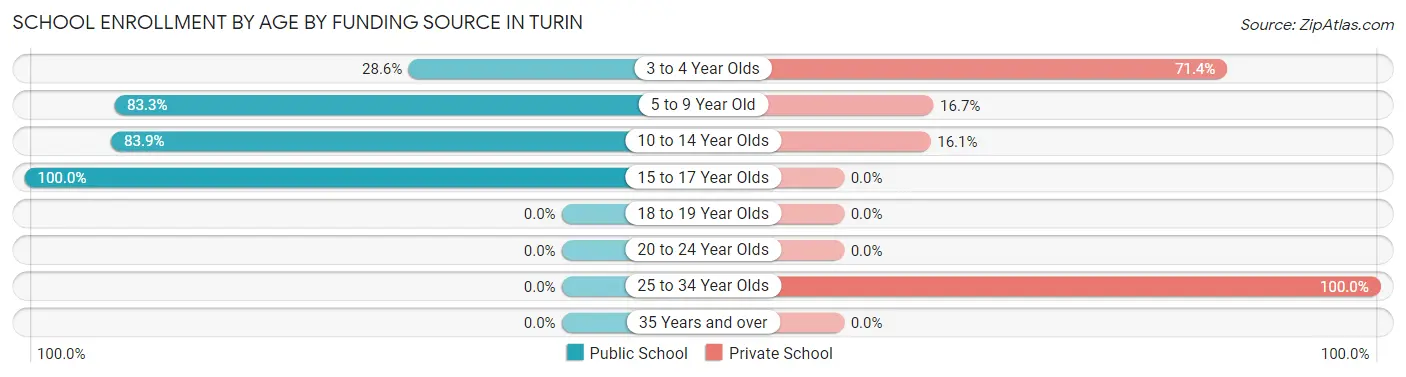
| Age Bracket | Public School | Private School |
| 3 to 4 Year Olds | 2 (28.6%) | 5 (71.4%) |
| 5 to 9 Year Old | 20 (83.3%) | 4 (16.7%) |
| 10 to 14 Year Olds | 26 (83.9%) | 5 (16.1%) |
| 15 to 17 Year Olds | 5 (100.0%) | 0 (0.0%) |
| 18 to 19 Year Olds | 0 (0.0%) | 0 (0.0%) |
| 20 to 24 Year Olds | 0 (0.0%) | 0 (0.0%) |
| 25 to 34 Year Olds | 0 (0.0%) | 5 (100.0%) |
| 35 Years and over | 0 (0.0%) | 0 (0.0%) |
| Total | 53 (73.6%) | 19 (26.4%) |
Educational Attainment by Field of Study in Turin
Education (13 | 31.7%), computers & mathematics (11 | 26.8%), visual & performing arts (5 | 12.2%), arts & humanities (4 | 9.8%), and business (3 | 7.3%) are the most common fields of study among 41 individuals in Turin who have obtained a bachelor's degree or higher.
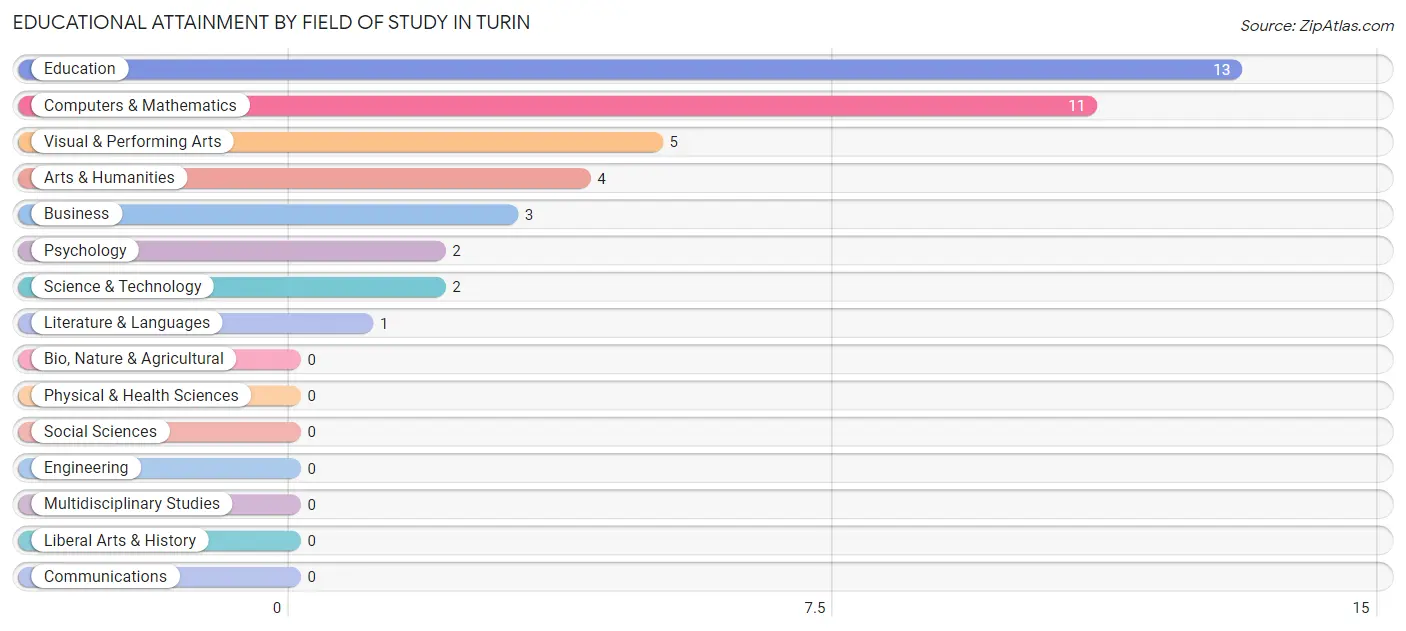
| Field of Study | # Graduates | % Graduates |
| Computers & Mathematics | 11 | 26.8% |
| Bio, Nature & Agricultural | 0 | 0.0% |
| Physical & Health Sciences | 0 | 0.0% |
| Psychology | 2 | 4.9% |
| Social Sciences | 0 | 0.0% |
| Engineering | 0 | 0.0% |
| Multidisciplinary Studies | 0 | 0.0% |
| Science & Technology | 2 | 4.9% |
| Business | 3 | 7.3% |
| Education | 13 | 31.7% |
| Literature & Languages | 1 | 2.4% |
| Liberal Arts & History | 0 | 0.0% |
| Visual & Performing Arts | 5 | 12.2% |
| Communications | 0 | 0.0% |
| Arts & Humanities | 4 | 9.8% |
| Total | 41 | 100.0% |
Transportation & Commute in Turin
Vehicle Availability by Sex in Turin
The most prevalent vehicle ownership categories in Turin are males with 2 vehicles (50, accounting for 65.8%) and females with 2 vehicles (39, making up 74.6%).
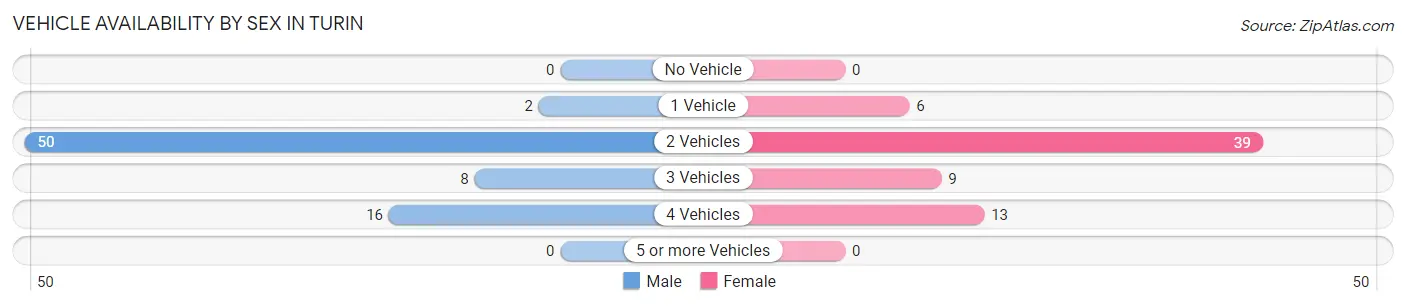
| Vehicles Available | Male | Female |
| No Vehicle | 0 (0.0%) | 0 (0.0%) |
| 1 Vehicle | 2 (2.6%) | 6 (9.0%) |
| 2 Vehicles | 50 (65.8%) | 39 (58.2%) |
| 3 Vehicles | 8 (10.5%) | 9 (13.4%) |
| 4 Vehicles | 16 (21.0%) | 13 (19.4%) |
| 5 or more Vehicles | 0 (0.0%) | 0 (0.0%) |
| Total | 76 (100.0%) | 67 (100.0%) |
Commute Time in Turin
The most frequently occuring commute durations in Turin are less than 5 minutes (30 commuters, 21.7%), 15 to 19 minutes (25 commuters, 18.1%), and 60 to 89 minutes (19 commuters, 13.8%).
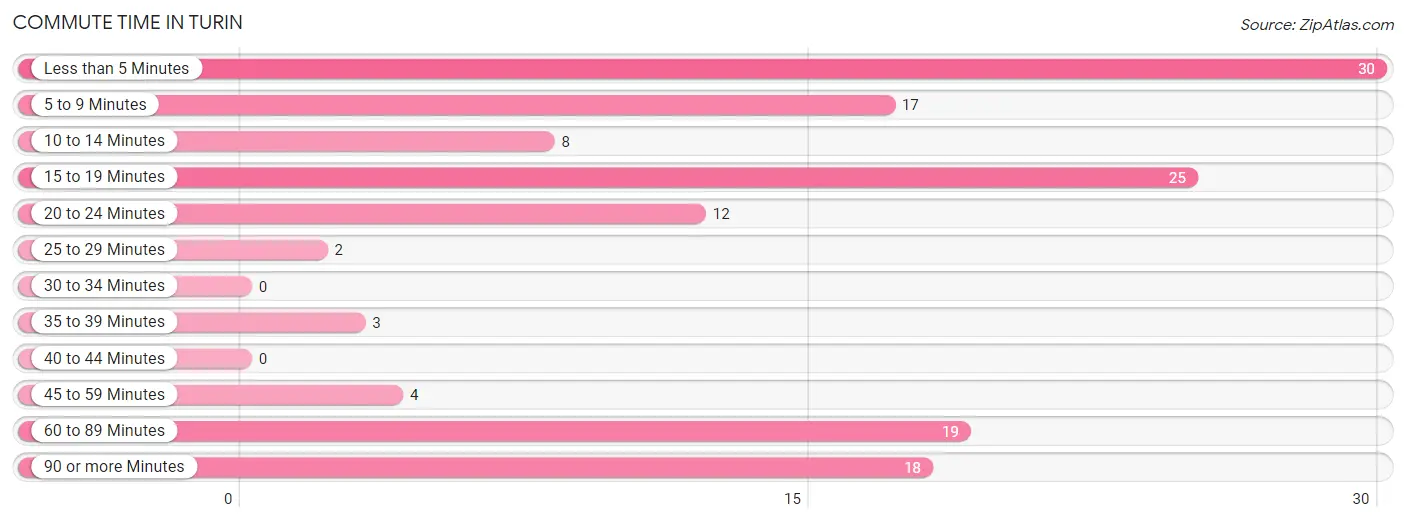
| Commute Time | # Commuters | % Commuters |
| Less than 5 Minutes | 30 | 21.7% |
| 5 to 9 Minutes | 17 | 12.3% |
| 10 to 14 Minutes | 8 | 5.8% |
| 15 to 19 Minutes | 25 | 18.1% |
| 20 to 24 Minutes | 12 | 8.7% |
| 25 to 29 Minutes | 2 | 1.5% |
| 30 to 34 Minutes | 0 | 0.0% |
| 35 to 39 Minutes | 3 | 2.2% |
| 40 to 44 Minutes | 0 | 0.0% |
| 45 to 59 Minutes | 4 | 2.9% |
| 60 to 89 Minutes | 19 | 13.8% |
| 90 or more Minutes | 18 | 13.0% |
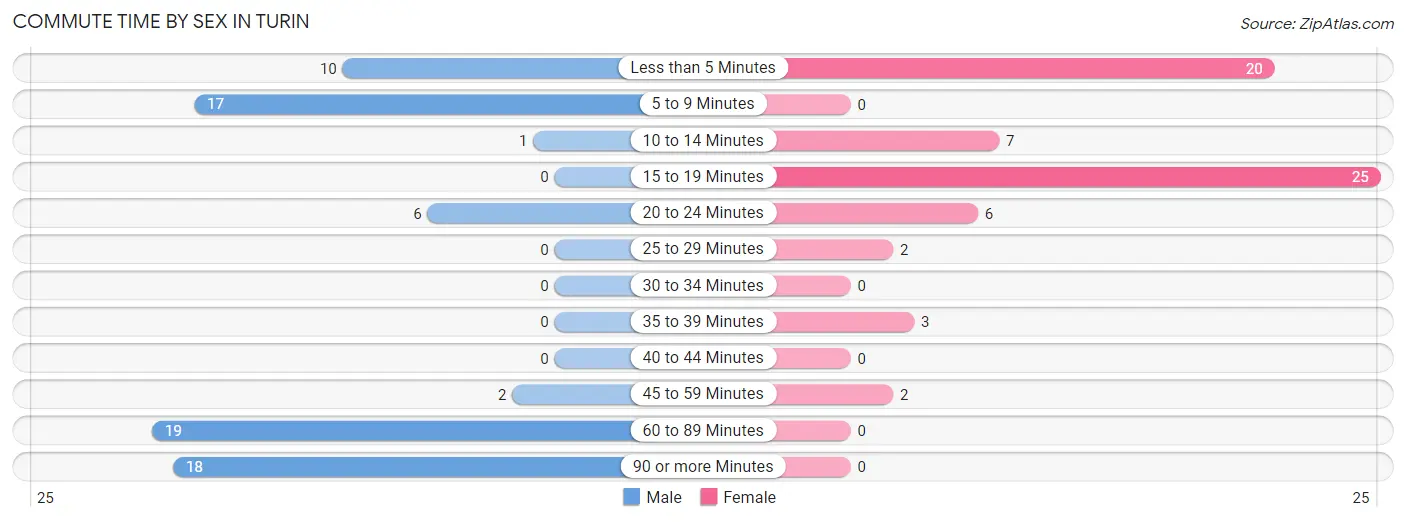
Commute Time by Sex in Turin
The most common commute times in Turin are 60 to 89 minutes (19 commuters, 26.0%) for males and 15 to 19 minutes (25 commuters, 38.5%) for females.
| Commute Time | Male | Female |
| Less than 5 Minutes | 10 (13.7%) | 20 (30.8%) |
| 5 to 9 Minutes | 17 (23.3%) | 0 (0.0%) |
| 10 to 14 Minutes | 1 (1.4%) | 7 (10.8%) |
| 15 to 19 Minutes | 0 (0.0%) | 25 (38.5%) |
| 20 to 24 Minutes | 6 (8.2%) | 6 (9.2%) |
| 25 to 29 Minutes | 0 (0.0%) | 2 (3.1%) |
| 30 to 34 Minutes | 0 (0.0%) | 0 (0.0%) |
| 35 to 39 Minutes | 0 (0.0%) | 3 (4.6%) |
| 40 to 44 Minutes | 0 (0.0%) | 0 (0.0%) |
| 45 to 59 Minutes | 2 (2.7%) | 2 (3.1%) |
| 60 to 89 Minutes | 19 (26.0%) | 0 (0.0%) |
| 90 or more Minutes | 18 (24.7%) | 0 (0.0%) |
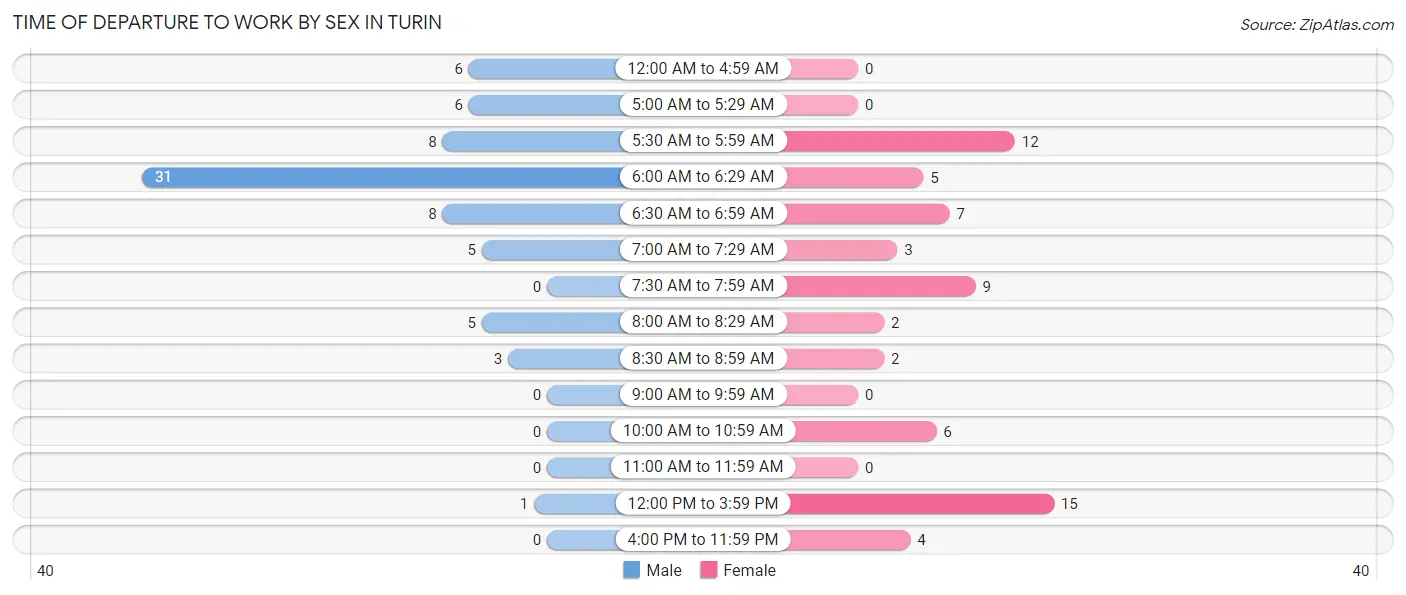
Time of Departure to Work by Sex in Turin
The most frequent times of departure to work in Turin are 6:00 AM to 6:29 AM (31, 42.5%) for males and 12:00 PM to 3:59 PM (15, 23.1%) for females.
| Time of Departure | Male | Female |
| 12:00 AM to 4:59 AM | 6 (8.2%) | 0 (0.0%) |
| 5:00 AM to 5:29 AM | 6 (8.2%) | 0 (0.0%) |
| 5:30 AM to 5:59 AM | 8 (11.0%) | 12 (18.5%) |
| 6:00 AM to 6:29 AM | 31 (42.5%) | 5 (7.7%) |
| 6:30 AM to 6:59 AM | 8 (11.0%) | 7 (10.8%) |
| 7:00 AM to 7:29 AM | 5 (6.9%) | 3 (4.6%) |
| 7:30 AM to 7:59 AM | 0 (0.0%) | 9 (13.9%) |
| 8:00 AM to 8:29 AM | 5 (6.9%) | 2 (3.1%) |
| 8:30 AM to 8:59 AM | 3 (4.1%) | 2 (3.1%) |
| 9:00 AM to 9:59 AM | 0 (0.0%) | 0 (0.0%) |
| 10:00 AM to 10:59 AM | 0 (0.0%) | 6 (9.2%) |
| 11:00 AM to 11:59 AM | 0 (0.0%) | 0 (0.0%) |
| 12:00 PM to 3:59 PM | 1 (1.4%) | 15 (23.1%) |
| 4:00 PM to 11:59 PM | 0 (0.0%) | 4 (6.1%) |
| Total | 73 (100.0%) | 65 (100.0%) |
Housing Occupancy in Turin
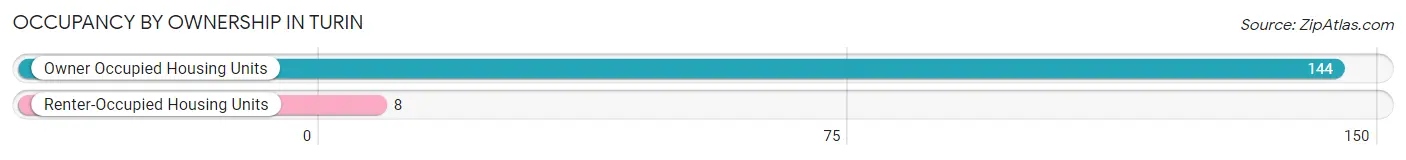
Occupancy by Ownership in Turin
Of the total 152 dwellings in Turin, owner-occupied units account for 144 (94.7%), while renter-occupied units make up 8 (5.3%).
| Occupancy | # Housing Units | % Housing Units |
| Owner Occupied Housing Units | 144 | 94.7% |
| Renter-Occupied Housing Units | 8 | 5.3% |
| Total Occupied Housing Units | 152 | 100.0% |
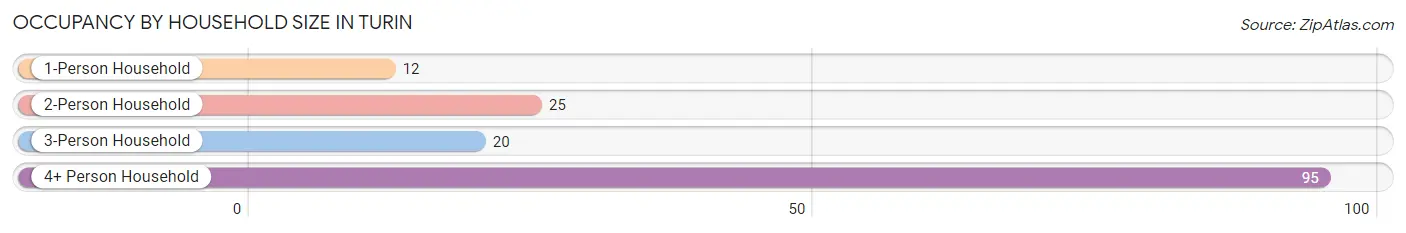
Occupancy by Household Size in Turin
| Household Size | # Housing Units | % Housing Units |
| 1-Person Household | 12 | 7.9% |
| 2-Person Household | 25 | 16.5% |
| 3-Person Household | 20 | 13.2% |
| 4+ Person Household | 95 | 62.5% |
| Total Housing Units | 152 | 100.0% |
Occupancy by Ownership by Household Size in Turin
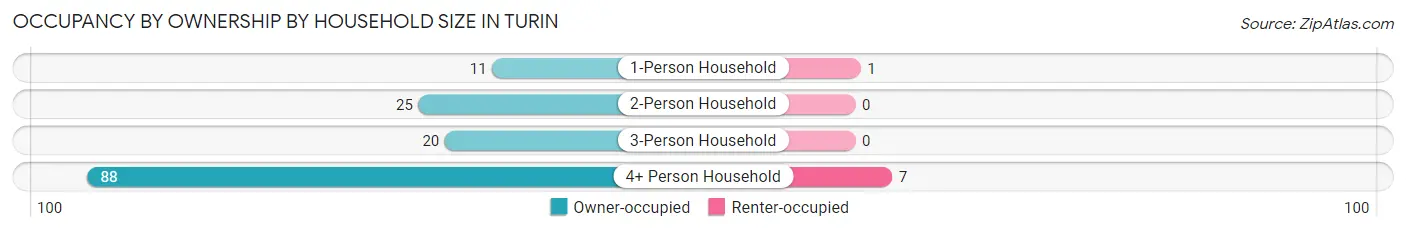
| Household Size | Owner-occupied | Renter-occupied |
| 1-Person Household | 11 (91.7%) | 1 (8.3%) |
| 2-Person Household | 25 (100.0%) | 0 (0.0%) |
| 3-Person Household | 20 (100.0%) | 0 (0.0%) |
| 4+ Person Household | 88 (92.6%) | 7 (7.4%) |
| Total Housing Units | 144 (94.7%) | 8 (5.3%) |
Occupancy by Educational Attainment in Turin
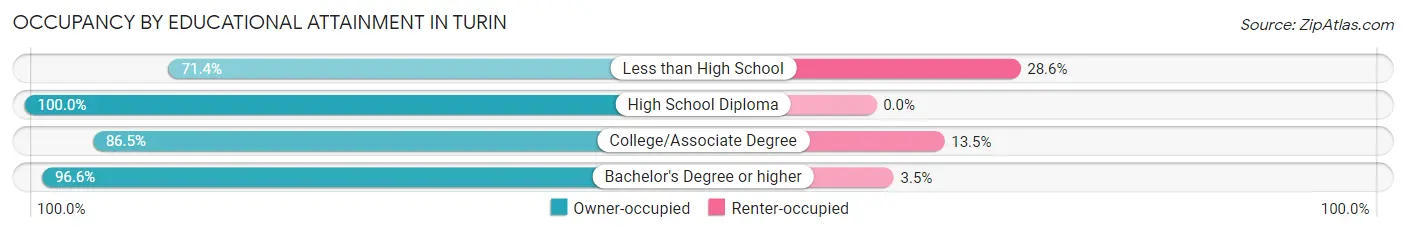
| Household Size | Owner-occupied | Renter-occupied |
| Less than High School | 5 (71.4%) | 2 (28.6%) |
| High School Diploma | 79 (100.0%) | 0 (0.0%) |
| College/Associate Degree | 32 (86.5%) | 5 (13.5%) |
| Bachelor's Degree or higher | 28 (96.6%) | 1 (3.5%) |
Occupancy by Age of Householder in Turin
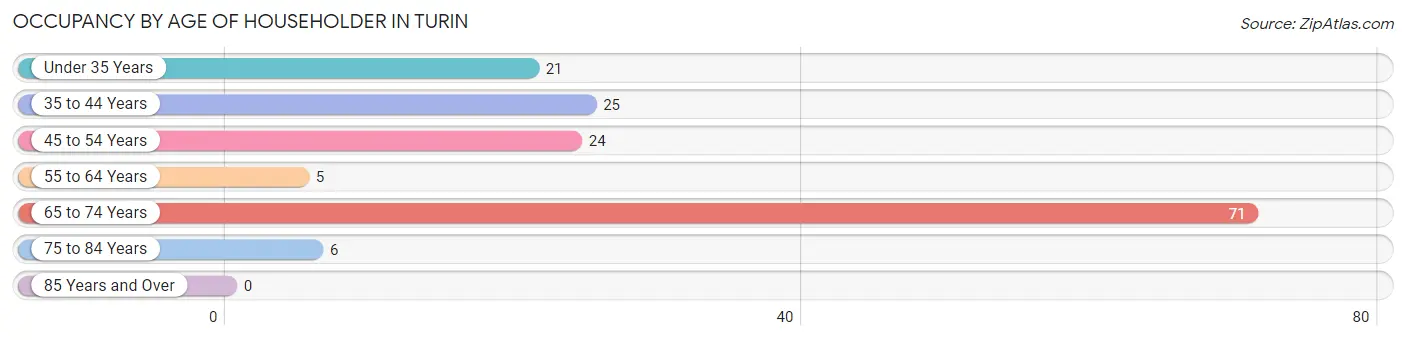
| Age Bracket | # Households | % Households |
| Under 35 Years | 21 | 13.8% |
| 35 to 44 Years | 25 | 16.5% |
| 45 to 54 Years | 24 | 15.8% |
| 55 to 64 Years | 5 | 3.3% |
| 65 to 74 Years | 71 | 46.7% |
| 75 to 84 Years | 6 | 4.0% |
| 85 Years and Over | 0 | 0.0% |
| Total | 152 | 100.0% |
Housing Finances in Turin
Median Income by Occupancy in Turin
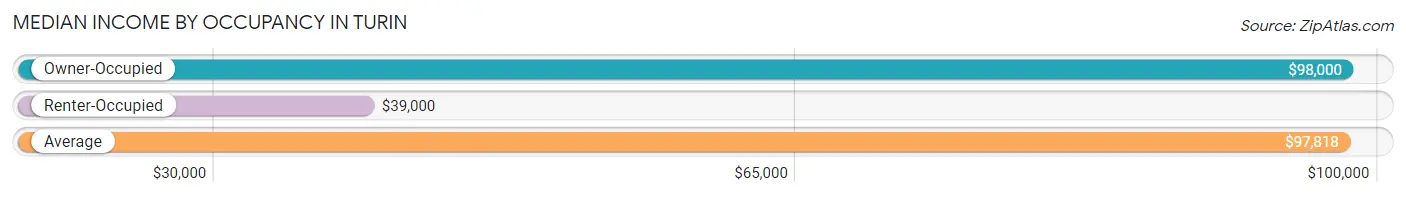
| Occupancy Type | # Households | Median Income |
| Owner-Occupied | 144 (94.7%) | $98,000 |
| Renter-Occupied | 8 (5.3%) | $39,000 |
| Average | 152 (100.0%) | $97,818 |
Occupancy by Householder Income Bracket in Turin
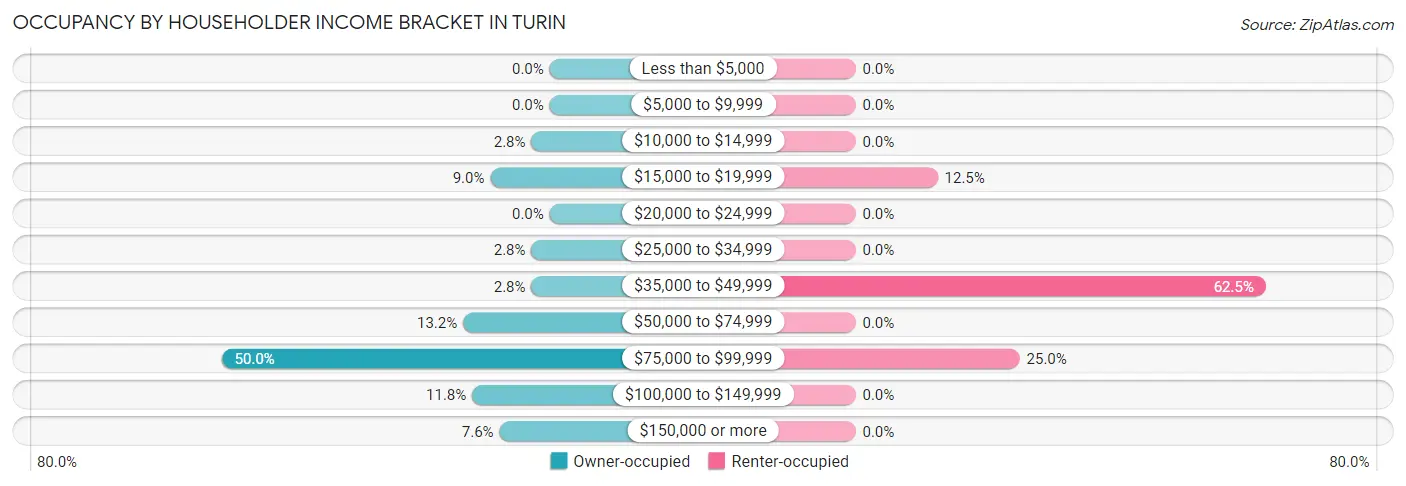
| Income Bracket | Owner-occupied | Renter-occupied |
| Less than $5,000 | 0 (0.0%) | 0 (0.0%) |
| $5,000 to $9,999 | 0 (0.0%) | 0 (0.0%) |
| $10,000 to $14,999 | 4 (2.8%) | 0 (0.0%) |
| $15,000 to $19,999 | 13 (9.0%) | 1 (12.5%) |
| $20,000 to $24,999 | 0 (0.0%) | 0 (0.0%) |
| $25,000 to $34,999 | 4 (2.8%) | 0 (0.0%) |
| $35,000 to $49,999 | 4 (2.8%) | 5 (62.5%) |
| $50,000 to $74,999 | 19 (13.2%) | 0 (0.0%) |
| $75,000 to $99,999 | 72 (50.0%) | 2 (25.0%) |
| $100,000 to $149,999 | 17 (11.8%) | 0 (0.0%) |
| $150,000 or more | 11 (7.6%) | 0 (0.0%) |
| Total | 144 (100.0%) | 8 (100.0%) |
Monthly Housing Cost Tiers in Turin
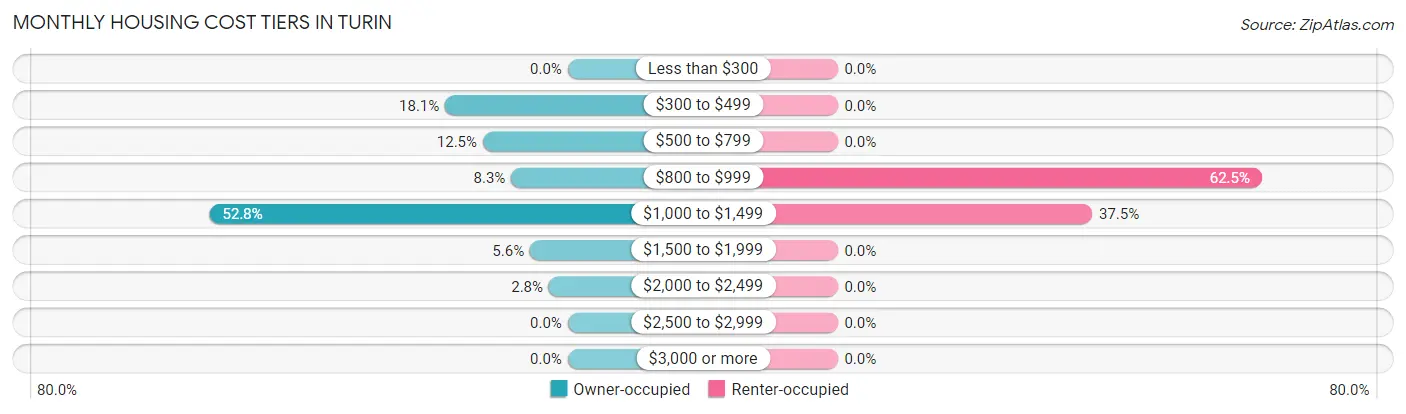
| Monthly Cost | Owner-occupied | Renter-occupied |
| Less than $300 | 0 (0.0%) | 0 (0.0%) |
| $300 to $499 | 26 (18.1%) | 0 (0.0%) |
| $500 to $799 | 18 (12.5%) | 0 (0.0%) |
| $800 to $999 | 12 (8.3%) | 5 (62.5%) |
| $1,000 to $1,499 | 76 (52.8%) | 3 (37.5%) |
| $1,500 to $1,999 | 8 (5.6%) | 0 (0.0%) |
| $2,000 to $2,499 | 4 (2.8%) | 0 (0.0%) |
| $2,500 to $2,999 | 0 (0.0%) | 0 (0.0%) |
| $3,000 or more | 0 (0.0%) | 0 (0.0%) |
| Total | 144 (100.0%) | 8 (100.0%) |
Physical Housing Characteristics in Turin
Housing Structures in Turin
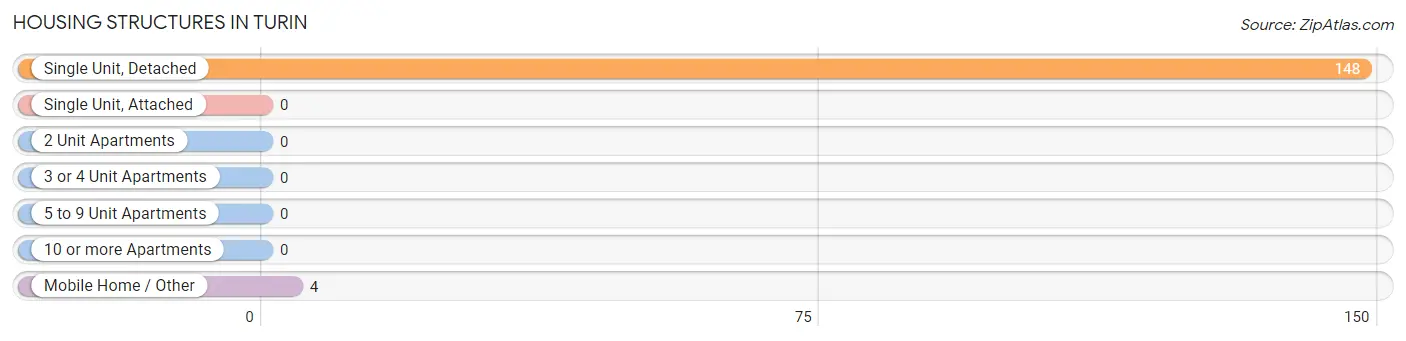
| Structure Type | # Housing Units | % Housing Units |
| Single Unit, Detached | 148 | 97.4% |
| Single Unit, Attached | 0 | 0.0% |
| 2 Unit Apartments | 0 | 0.0% |
| 3 or 4 Unit Apartments | 0 | 0.0% |
| 5 to 9 Unit Apartments | 0 | 0.0% |
| 10 or more Apartments | 0 | 0.0% |
| Mobile Home / Other | 4 | 2.6% |
| Total | 152 | 100.0% |
Housing Structures by Occupancy in Turin
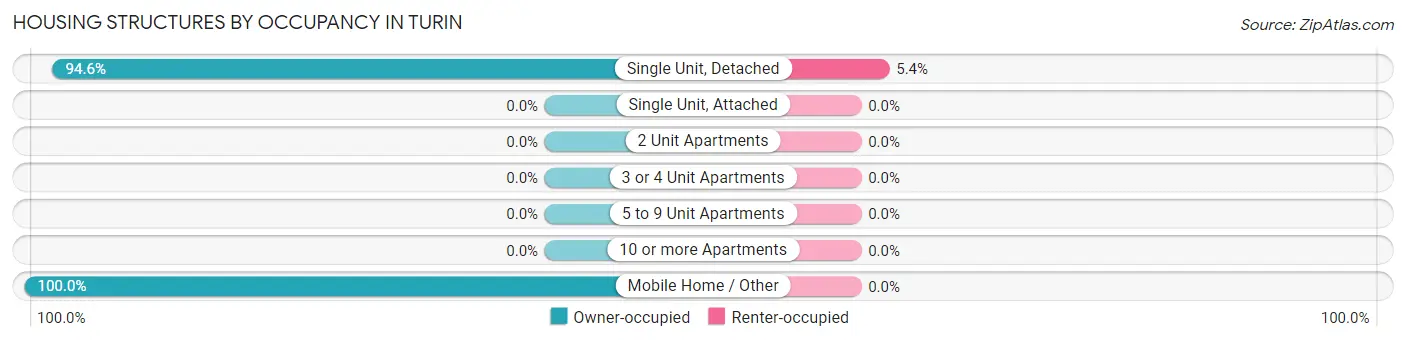
| Structure Type | Owner-occupied | Renter-occupied |
| Single Unit, Detached | 140 (94.6%) | 8 (5.4%) |
| Single Unit, Attached | 0 (0.0%) | 0 (0.0%) |
| 2 Unit Apartments | 0 (0.0%) | 0 (0.0%) |
| 3 or 4 Unit Apartments | 0 (0.0%) | 0 (0.0%) |
| 5 to 9 Unit Apartments | 0 (0.0%) | 0 (0.0%) |
| 10 or more Apartments | 0 (0.0%) | 0 (0.0%) |
| Mobile Home / Other | 4 (100.0%) | 0 (0.0%) |
| Total | 144 (94.7%) | 8 (5.3%) |
Housing Structures by Number of Rooms in Turin
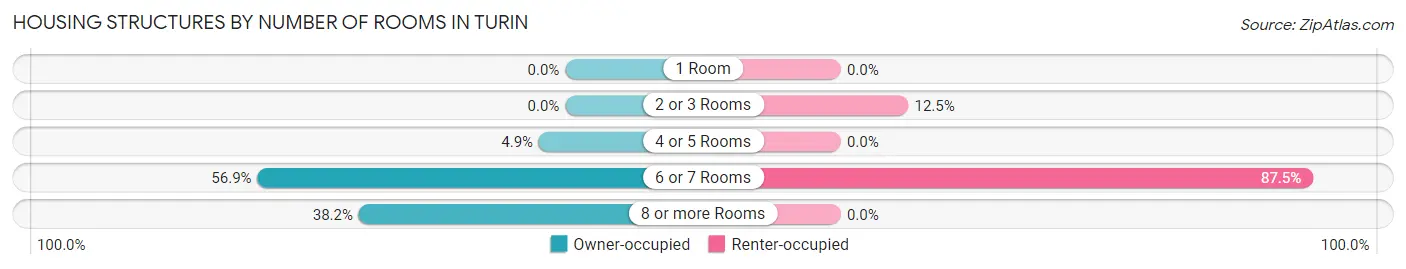
| Number of Rooms | Owner-occupied | Renter-occupied |
| 1 Room | 0 (0.0%) | 0 (0.0%) |
| 2 or 3 Rooms | 0 (0.0%) | 1 (12.5%) |
| 4 or 5 Rooms | 7 (4.9%) | 0 (0.0%) |
| 6 or 7 Rooms | 82 (56.9%) | 7 (87.5%) |
| 8 or more Rooms | 55 (38.2%) | 0 (0.0%) |
| Total | 144 (100.0%) | 8 (100.0%) |
Housing Structure by Heating Type in Turin
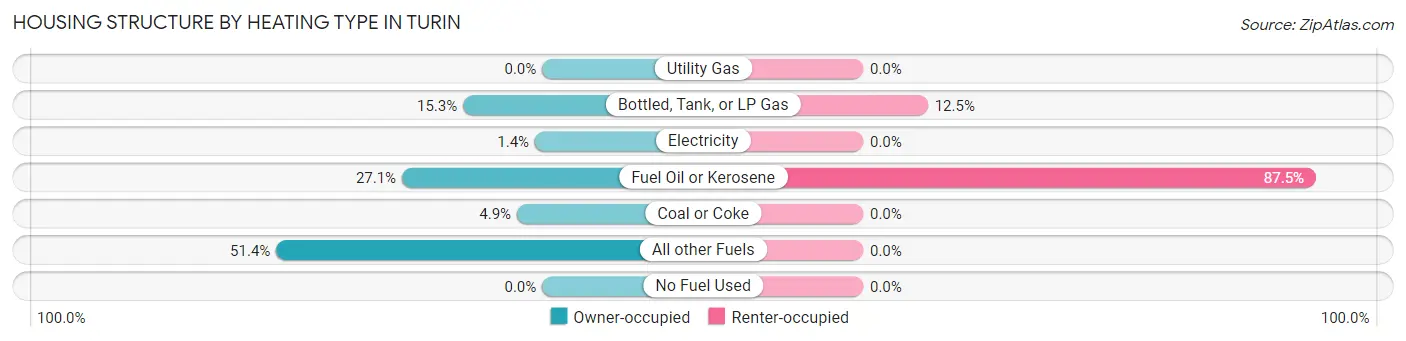
| Heating Type | Owner-occupied | Renter-occupied |
| Utility Gas | 0 (0.0%) | 0 (0.0%) |
| Bottled, Tank, or LP Gas | 22 (15.3%) | 1 (12.5%) |
| Electricity | 2 (1.4%) | 0 (0.0%) |
| Fuel Oil or Kerosene | 39 (27.1%) | 7 (87.5%) |
| Coal or Coke | 7 (4.9%) | 0 (0.0%) |
| All other Fuels | 74 (51.4%) | 0 (0.0%) |
| No Fuel Used | 0 (0.0%) | 0 (0.0%) |
| Total | 144 (100.0%) | 8 (100.0%) |
Household Vehicle Usage in Turin
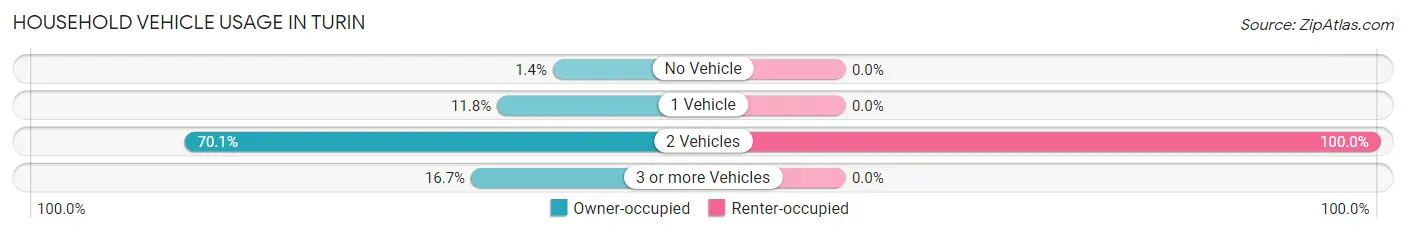
| Vehicles per Household | Owner-occupied | Renter-occupied |
| No Vehicle | 2 (1.4%) | 0 (0.0%) |
| 1 Vehicle | 17 (11.8%) | 0 (0.0%) |
| 2 Vehicles | 101 (70.1%) | 8 (100.0%) |
| 3 or more Vehicles | 24 (16.7%) | 0 (0.0%) |
| Total | 144 (100.0%) | 8 (100.0%) |
Real Estate & Mortgages in Turin
Real Estate and Mortgage Overview in Turin
| Characteristic | Without Mortgage | With Mortgage |
| Housing Units | 33 | 111 |
| Median Property Value | $104,700 | $96,300 |
| Median Household Income | - | - |
| Monthly Housing Costs | $384 | $0 |
| Real Estate Taxes | $1,438 | $0 |
Property Value by Mortgage Status in Turin
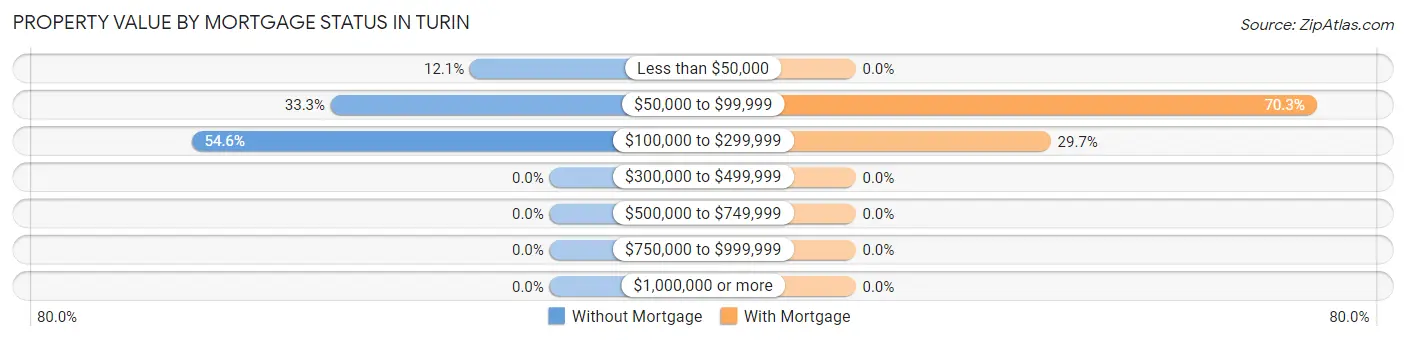
| Property Value | Without Mortgage | With Mortgage |
| Less than $50,000 | 4 (12.1%) | 0 (0.0%) |
| $50,000 to $99,999 | 11 (33.3%) | 78 (70.3%) |
| $100,000 to $299,999 | 18 (54.5%) | 33 (29.7%) |
| $300,000 to $499,999 | 0 (0.0%) | 0 (0.0%) |
| $500,000 to $749,999 | 0 (0.0%) | 0 (0.0%) |
| $750,000 to $999,999 | 0 (0.0%) | 0 (0.0%) |
| $1,000,000 or more | 0 (0.0%) | 0 (0.0%) |
| Total | 33 (100.0%) | 111 (100.0%) |
Household Income by Mortgage Status in Turin
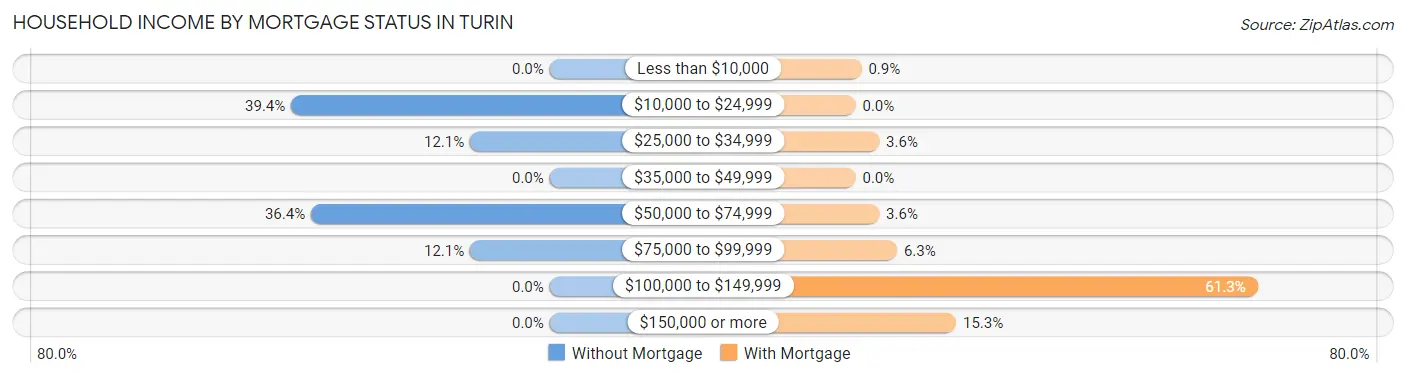
| Household Income | Without Mortgage | With Mortgage |
| Less than $10,000 | 0 (0.0%) | 1 (0.9%) |
| $10,000 to $24,999 | 13 (39.4%) | 0 (0.0%) |
| $25,000 to $34,999 | 4 (12.1%) | 4 (3.6%) |
| $35,000 to $49,999 | 0 (0.0%) | 0 (0.0%) |
| $50,000 to $74,999 | 12 (36.4%) | 4 (3.6%) |
| $75,000 to $99,999 | 4 (12.1%) | 7 (6.3%) |
| $100,000 to $149,999 | 0 (0.0%) | 68 (61.3%) |
| $150,000 or more | 0 (0.0%) | 17 (15.3%) |
| Total | 33 (100.0%) | 111 (100.0%) |
Property Value to Household Income Ratio in Turin
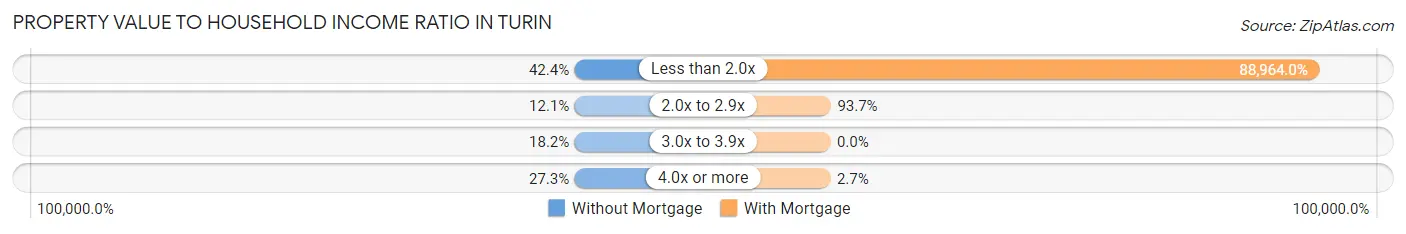
| Value-to-Income Ratio | Without Mortgage | With Mortgage |
| Less than 2.0x | 14 (42.4%) | 98,750 (88,964.0%) |
| 2.0x to 2.9x | 4 (12.1%) | 104 (93.7%) |
| 3.0x to 3.9x | 6 (18.2%) | 0 (0.0%) |
| 4.0x or more | 9 (27.3%) | 3 (2.7%) |
| Total | 33 (100.0%) | 111 (100.0%) |
Real Estate Taxes by Mortgage Status in Turin
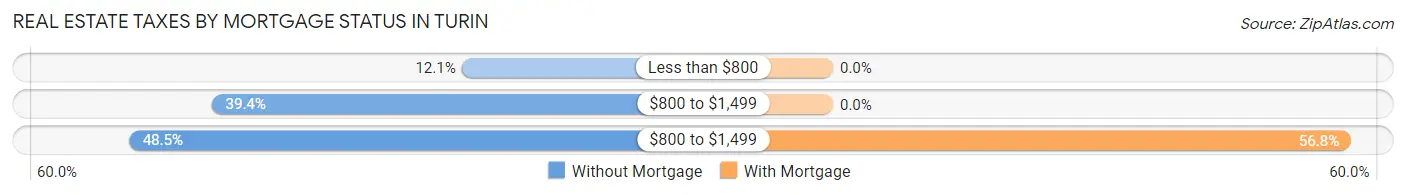
| Property Taxes | Without Mortgage | With Mortgage |
| Less than $800 | 4 (12.1%) | 0 (0.0%) |
| $800 to $1,499 | 13 (39.4%) | 0 (0.0%) |
| $800 to $1,499 | 16 (48.5%) | 63 (56.8%) |
| Total | 33 (100.0%) | 111 (100.0%) |
Health & Disability in Turin
Health Insurance Coverage by Age in Turin
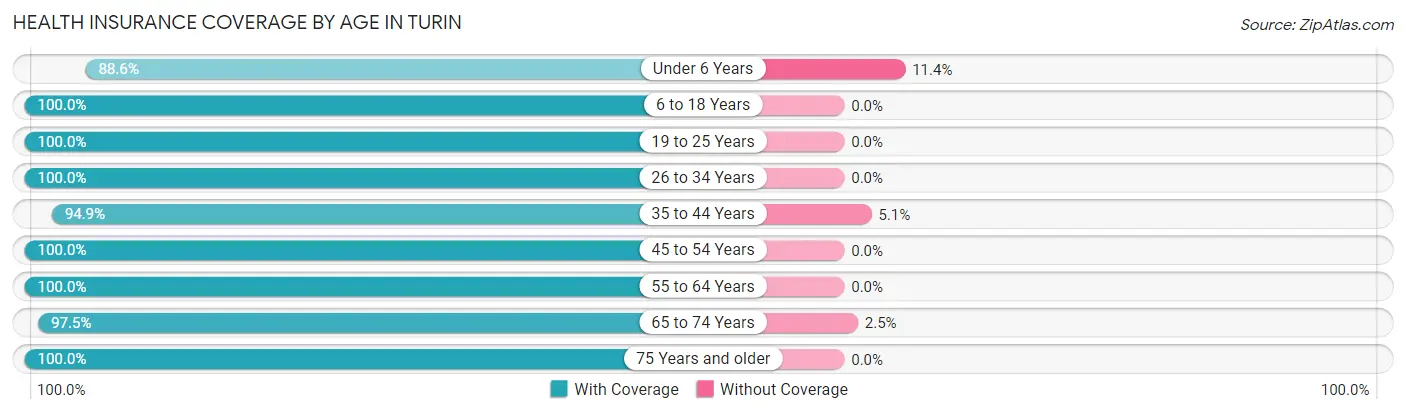
| Age Bracket | With Coverage | Without Coverage |
| Under 6 Years | 39 (88.6%) | 5 (11.4%) |
| 6 to 18 Years | 54 (100.0%) | 0 (0.0%) |
| 19 to 25 Years | 26 (100.0%) | 0 (0.0%) |
| 26 to 34 Years | 41 (100.0%) | 0 (0.0%) |
| 35 to 44 Years | 56 (94.9%) | 3 (5.1%) |
| 45 to 54 Years | 42 (100.0%) | 0 (0.0%) |
| 55 to 64 Years | 15 (100.0%) | 0 (0.0%) |
| 65 to 74 Years | 77 (97.5%) | 2 (2.5%) |
| 75 Years and older | 10 (100.0%) | 0 (0.0%) |
| Total | 360 (97.3%) | 10 (2.7%) |
Health Insurance Coverage by Citizenship Status in Turin
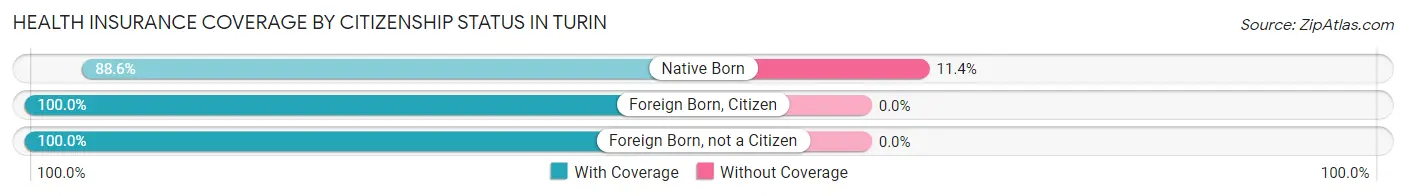
| Citizenship Status | With Coverage | Without Coverage |
| Native Born | 39 (88.6%) | 5 (11.4%) |
| Foreign Born, Citizen | 54 (100.0%) | 0 (0.0%) |
| Foreign Born, not a Citizen | 26 (100.0%) | 0 (0.0%) |
Health Insurance Coverage by Household Income in Turin
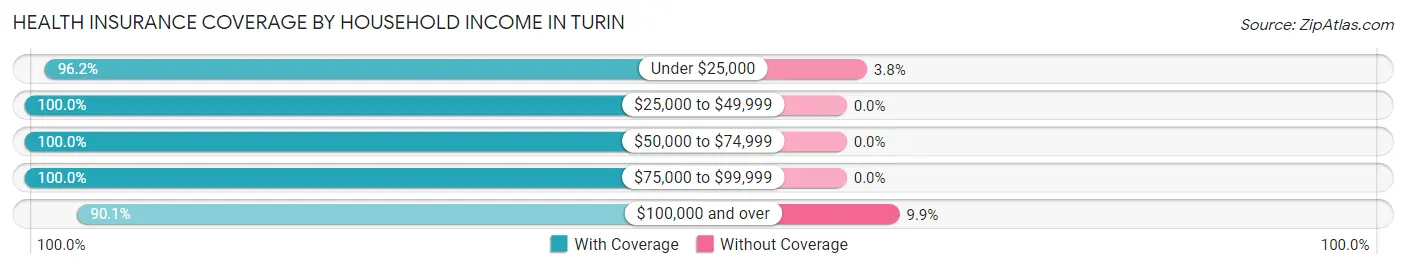
| Household Income | With Coverage | Without Coverage |
| Under $25,000 | 51 (96.2%) | 2 (3.8%) |
| $25,000 to $49,999 | 56 (100.0%) | 0 (0.0%) |
| $50,000 to $74,999 | 48 (100.0%) | 0 (0.0%) |
| $75,000 to $99,999 | 132 (100.0%) | 0 (0.0%) |
| $100,000 and over | 73 (90.1%) | 8 (9.9%) |
Public vs Private Health Insurance Coverage by Age in Turin
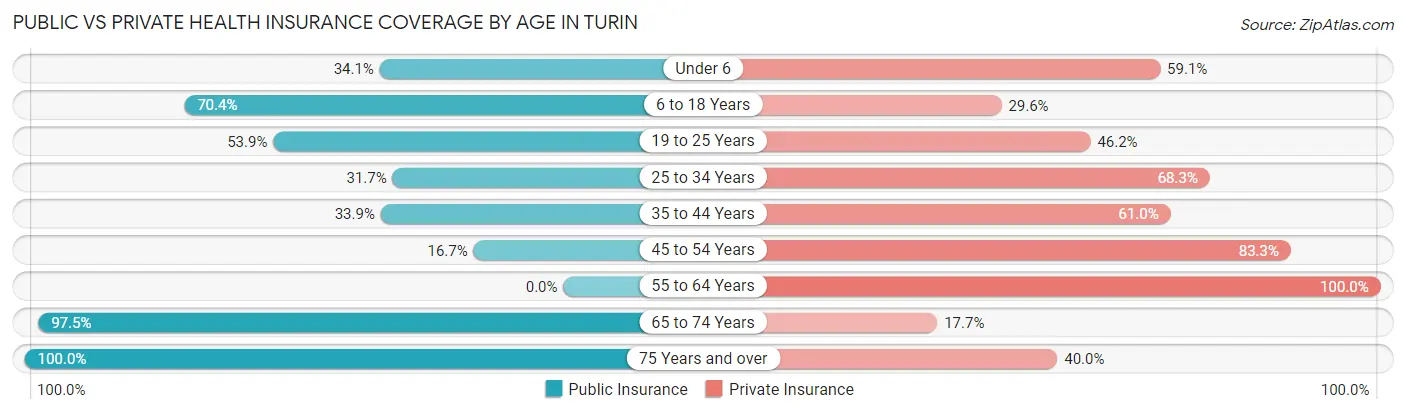
| Age Bracket | Public Insurance | Private Insurance |
| Under 6 | 15 (34.1%) | 26 (59.1%) |
| 6 to 18 Years | 38 (70.4%) | 16 (29.6%) |
| 19 to 25 Years | 14 (53.8%) | 12 (46.2%) |
| 25 to 34 Years | 13 (31.7%) | 28 (68.3%) |
| 35 to 44 Years | 20 (33.9%) | 36 (61.0%) |
| 45 to 54 Years | 7 (16.7%) | 35 (83.3%) |
| 55 to 64 Years | 0 (0.0%) | 15 (100.0%) |
| 65 to 74 Years | 77 (97.5%) | 14 (17.7%) |
| 75 Years and over | 10 (100.0%) | 4 (40.0%) |
| Total | 194 (52.4%) | 186 (50.3%) |
Disability Status by Sex by Age in Turin
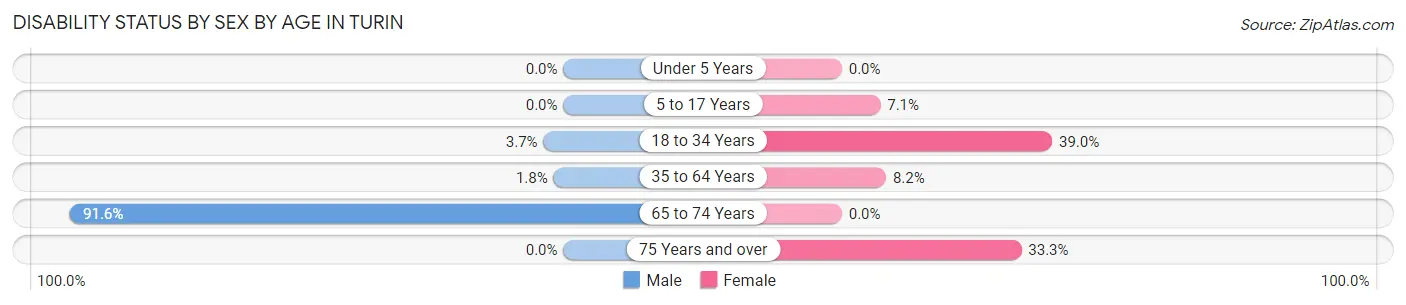
| Age Bracket | Male | Female |
| Under 5 Years | 0 (0.0%) | 0 (0.0%) |
| 5 to 17 Years | 0 (0.0%) | 1 (7.1%) |
| 18 to 34 Years | 1 (3.7%) | 16 (39.0%) |
| 35 to 64 Years | 1 (1.8%) | 5 (8.2%) |
| 65 to 74 Years | 65 (91.5%) | 0 (0.0%) |
| 75 Years and over | 0 (0.0%) | 2 (33.3%) |
Disability Class by Sex by Age in Turin
Disability Class: Hearing Difficulty
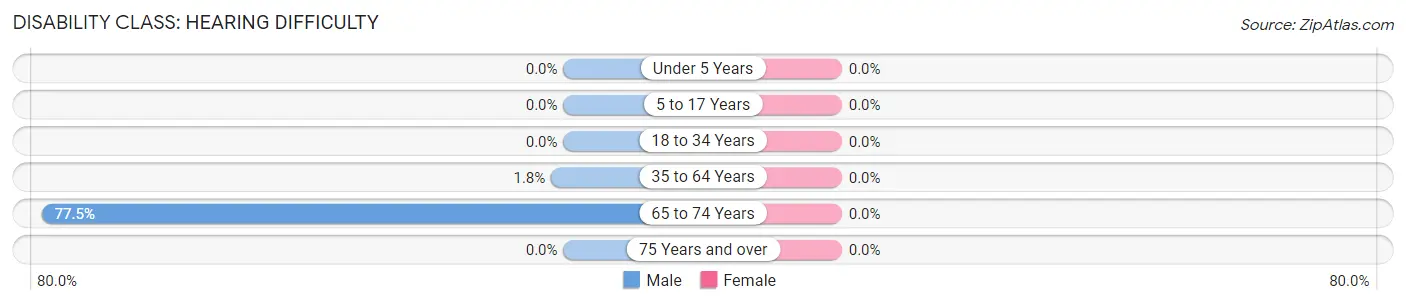
| Age Bracket | Male | Female |
| Under 5 Years | 0 (0.0%) | 0 (0.0%) |
| 5 to 17 Years | 0 (0.0%) | 0 (0.0%) |
| 18 to 34 Years | 0 (0.0%) | 0 (0.0%) |
| 35 to 64 Years | 1 (1.8%) | 0 (0.0%) |
| 65 to 74 Years | 55 (77.5%) | 0 (0.0%) |
| 75 Years and over | 0 (0.0%) | 0 (0.0%) |
Disability Class: Vision Difficulty
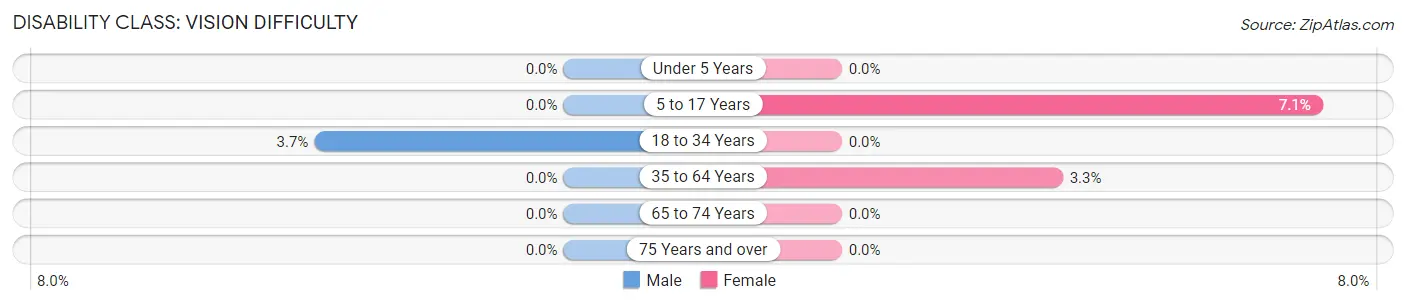
| Age Bracket | Male | Female |
| Under 5 Years | 0 (0.0%) | 0 (0.0%) |
| 5 to 17 Years | 0 (0.0%) | 1 (7.1%) |
| 18 to 34 Years | 1 (3.7%) | 0 (0.0%) |
| 35 to 64 Years | 0 (0.0%) | 2 (3.3%) |
| 65 to 74 Years | 0 (0.0%) | 0 (0.0%) |
| 75 Years and over | 0 (0.0%) | 0 (0.0%) |
Disability Class: Cognitive Difficulty
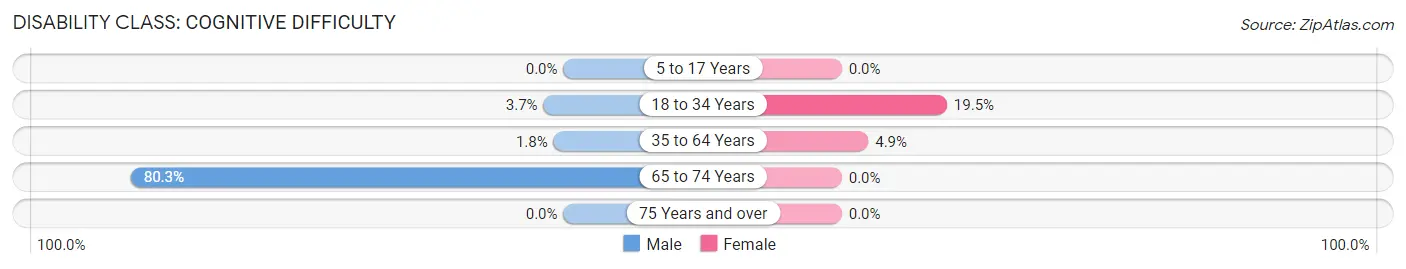
| Age Bracket | Male | Female |
| 5 to 17 Years | 0 (0.0%) | 0 (0.0%) |
| 18 to 34 Years | 1 (3.7%) | 8 (19.5%) |
| 35 to 64 Years | 1 (1.8%) | 3 (4.9%) |
| 65 to 74 Years | 57 (80.3%) | 0 (0.0%) |
| 75 Years and over | 0 (0.0%) | 0 (0.0%) |
Disability Class: Ambulatory Difficulty
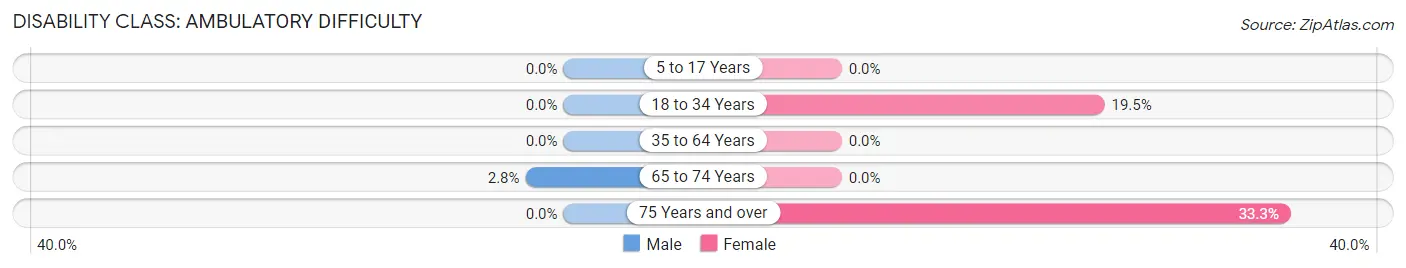
| Age Bracket | Male | Female |
| 5 to 17 Years | 0 (0.0%) | 0 (0.0%) |
| 18 to 34 Years | 0 (0.0%) | 8 (19.5%) |
| 35 to 64 Years | 0 (0.0%) | 0 (0.0%) |
| 65 to 74 Years | 2 (2.8%) | 0 (0.0%) |
| 75 Years and over | 0 (0.0%) | 2 (33.3%) |
Disability Class: Self-Care Difficulty
| Age Bracket | Male | Female |
| 5 to 17 Years | 0 (0.0%) | 0 (0.0%) |
| 18 to 34 Years | 0 (0.0%) | 0 (0.0%) |
| 35 to 64 Years | 0 (0.0%) | 0 (0.0%) |
| 65 to 74 Years | 0 (0.0%) | 0 (0.0%) |
| 75 Years and over | 0 (0.0%) | 0 (0.0%) |
Technology Access in Turin
Computing Device Access in Turin
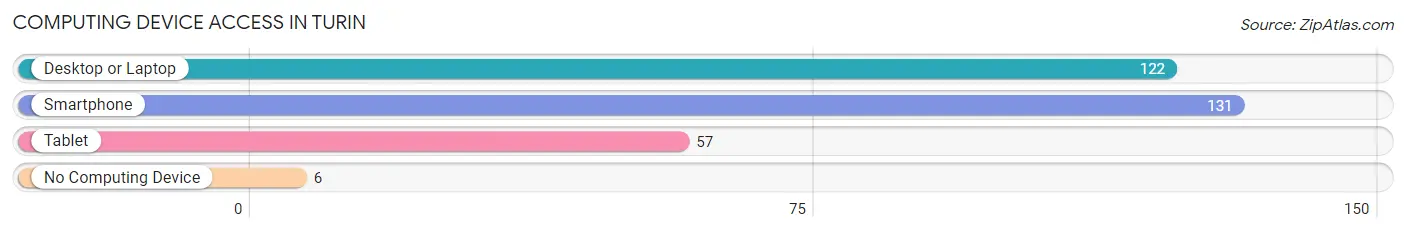
| Device Type | # Households | % Households |
| Desktop or Laptop | 122 | 80.3% |
| Smartphone | 131 | 86.2% |
| Tablet | 57 | 37.5% |
| No Computing Device | 6 | 4.0% |
| Total | 152 | 100.0% |
Internet Access in Turin
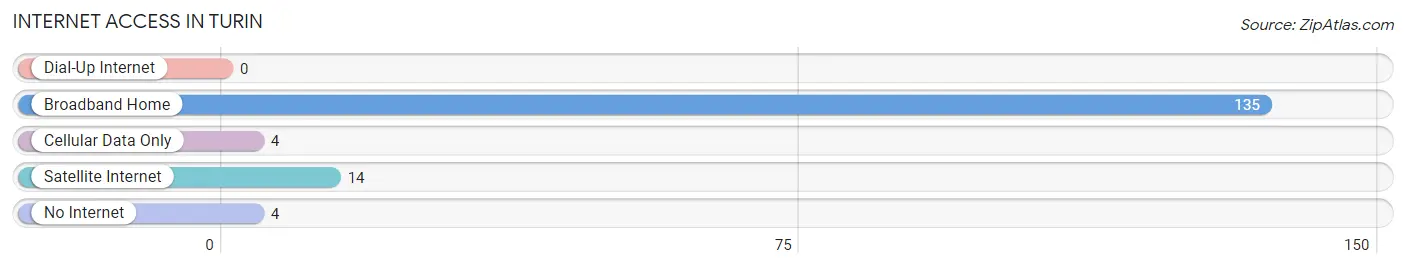
| Internet Type | # Households | % Households |
| Dial-Up Internet | 0 | 0.0% |
| Broadband Home | 135 | 88.8% |
| Cellular Data Only | 4 | 2.6% |
| Satellite Internet | 14 | 9.2% |
| No Internet | 4 | 2.6% |
| Total | 152 | 100.0% |
Turin Summary
Turin, New York is a small town located in the foothills of the Adirondack Mountains in Lewis County. It is situated on the Black River, which is a tributary of the Oswegatchie River. The town was first settled in 1797 and was incorporated in 1802. The town is named after Turin, Italy, which was the birthplace of the first settler, John Turin.
History
The first settlers of Turin, New York were John Turin and his family, who arrived in 1797. They were originally from Turin, Italy and were looking for a new home in the United States. They found the area to be ideal for farming and settled in the area. The town was officially incorporated in 1802 and was named after the Turin family.
The town grew slowly over the years, but it was not until the mid-1800s that it began to experience significant growth. This was due to the construction of the Black River Canal, which connected the town to the Erie Canal. This allowed for the transportation of goods and people to and from the town.
The town continued to grow throughout the 19th century and into the 20th century. In the early 1900s, the town was home to several factories, including a paper mill, a sawmill, and a gristmill. These factories provided employment for many of the town’s residents.
Geography
Turin, New York is located in the foothills of the Adirondack Mountains in Lewis County. The town is situated on the Black River, which is a tributary of the Oswegatchie River. The town is bordered by the towns of Denmark, Harrisburg, and Lowville.
The town has a total area of 24.2 square miles, of which 24.1 square miles is land and 0.1 square miles is water. The town is located in a hilly region and is mostly forested. The highest point in the town is an unnamed hill, which has an elevation of 1,890 feet.
Economy
The economy of Turin, New York is largely based on agriculture and tourism. The town is home to several farms, which produce a variety of crops, including corn, soybeans, hay, and apples. The town is also home to several wineries, which produce a variety of wines.
The town is also a popular tourist destination. The town is home to several attractions, including the Black River Canal Museum, the Turin Historical Society, and the Turin Town Hall. The town is also home to several outdoor recreation areas, including the Black River Wildlife Management Area and the Turin State Forest.
Demographics
As of the 2010 census, the town of Turin, New York had a population of 1,845. The racial makeup of the town was 97.3% White, 0.7% African American, 0.2% Native American, 0.2% Asian, 0.1% from other races, and 1.5% from two or more races. Hispanic or Latino of any race were 0.7% of the population.
The median household income in the town was $41,250 and the median family income was $50,000. The per capita income for the town was $20,845. About 10.3% of families and 13.2% of the population were below the poverty line, including 17.2% of those under age 18 and 8.3% of those age 65 or over.
Common Questions
What is Per Capita Income in Turin?
Per Capita income in Turin is $29,089.
What is the Median Family Income in Turin?
Median Family Income in Turin is $65,977.
What is the Median Household income in Turin?
Median Household Income in Turin is $97,818.
What is Income or Wage Gap in Turin?
Income or Wage Gap in Turin is 47.6%.
Women in Turin earn 52.4 cents for every dollar earned by a man.
What is Inequality or Gini Index in Turin?
Inequality or Gini Index in Turin is 0.25.
What is the Total Population of Turin?
Total Population of Turin is 370.
What is the Total Male Population of Turin?
Total Male Population of Turin is 228.
What is the Total Female Population of Turin?
Total Female Population of Turin is 142.
What is the Ratio of Males per 100 Females in Turin?
There are 160.56 Males per 100 Females in Turin.
What is the Ratio of Females per 100 Males in Turin?
There are 62.28 Females per 100 Males in Turin.
What is the Median Population Age in Turin?
Median Population Age in Turin is 37.2 Years.
What is the Average Family Size in Turin
Average Family Size in Turin is 2.5 People.
What is the Average Household Size in Turin
Average Household Size in Turin is 2.4 People.
How Large is the Labor Force in Turin?
There are 156 People in the Labor Forcein in Turin.
What is the Percentage of People in the Labor Force in Turin?
56.5% of People are in the Labor Force in Turin.
What is the Unemployment Rate in Turin?
Unemployment Rate in Turin is 5.8%.