Tupper Lake, NY Map & Demographics
Tupper Lake Map
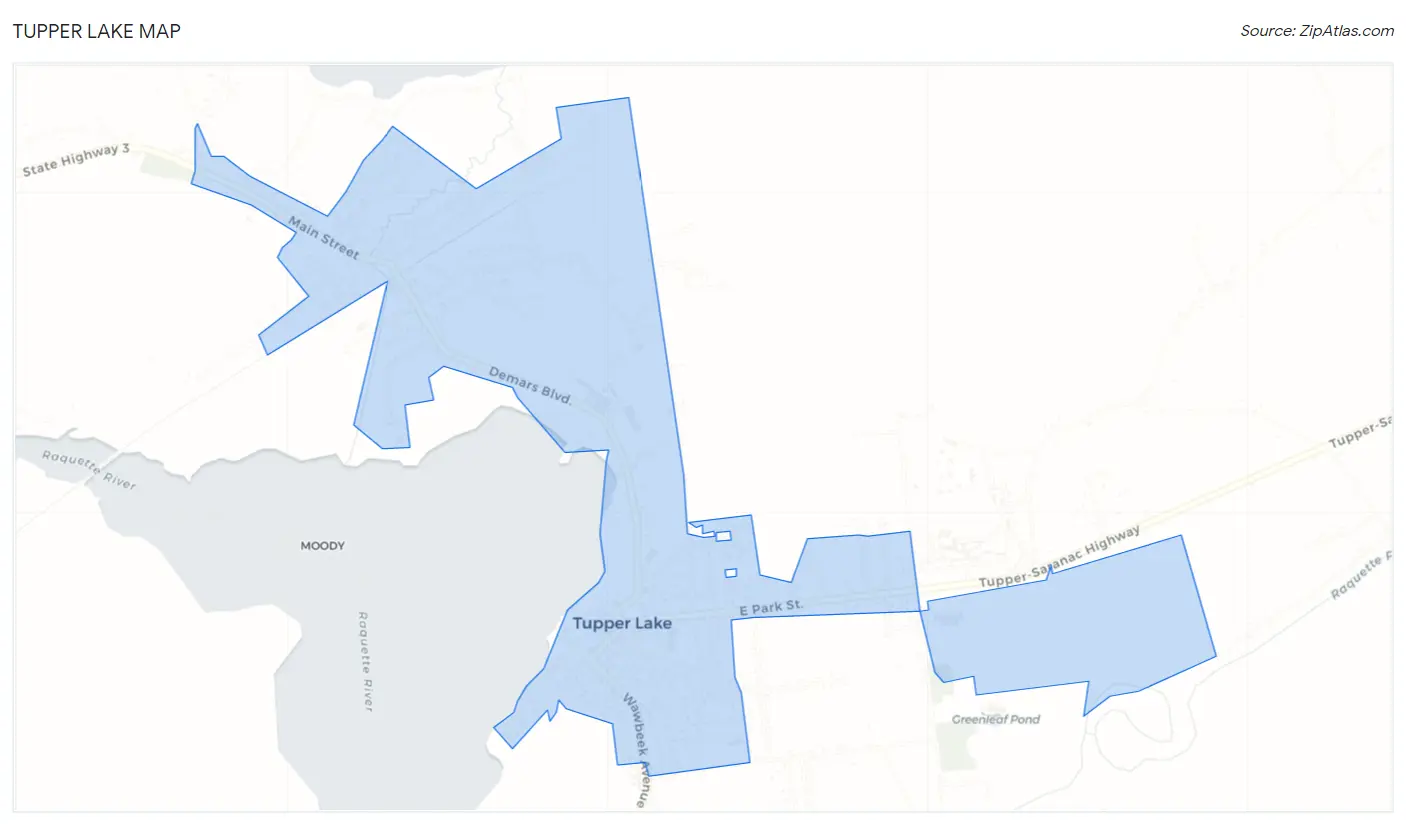
Tupper Lake Overview
$34,223
PER CAPITA INCOME
$78,819
AVG FAMILY INCOME
$52,779
AVG HOUSEHOLD INCOME
50.3%
WAGE / INCOME GAP [ % ]
49.7¢/ $1
WAGE / INCOME GAP [ $ ]
0.43
INEQUALITY / GINI INDEX
2,804
TOTAL POPULATION
1,250
MALE POPULATION
1,554
FEMALE POPULATION
80.44
MALES / 100 FEMALES
124.32
FEMALES / 100 MALES
47.4
MEDIAN AGE
2.6
AVG FAMILY SIZE
1.9
AVG HOUSEHOLD SIZE
1,384
LABOR FORCE [ PEOPLE ]
56.9%
PERCENT IN LABOR FORCE
4.8%
UNEMPLOYMENT RATE
Tupper Lake Zip Codes
Tupper Lake Area Codes
Income in Tupper Lake
Income Overview in Tupper Lake
Per Capita Income in Tupper Lake is $34,223, while median incomes of families and households are $78,819 and $52,779 respectively.
| Characteristic | Number | Measure |
| Per Capita Income | 2,804 | $34,223 |
| Median Family Income | 635 | $78,819 |
| Mean Family Income | 635 | $89,140 |
| Median Household Income | 1,499 | $52,779 |
| Mean Household Income | 1,499 | $64,658 |
| Income Deficit | 635 | $0 |
| Wage / Income Gap (%) | 2,804 | 50.33% |
| Wage / Income Gap ($) | 2,804 | 49.67¢ per $1 |
| Gini / Inequality Index | 2,804 | 0.43 |
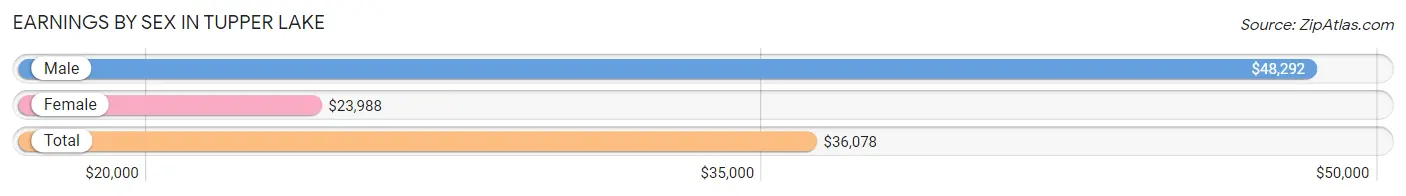
Earnings by Sex in Tupper Lake
Average Earnings in Tupper Lake are $36,078, $48,292 for men and $23,988 for women, a difference of 50.3%.
| Sex | Number | Average Earnings |
| Male | 770 (52.6%) | $48,292 |
| Female | 693 (47.4%) | $23,988 |
| Total | 1,463 (100.0%) | $36,078 |
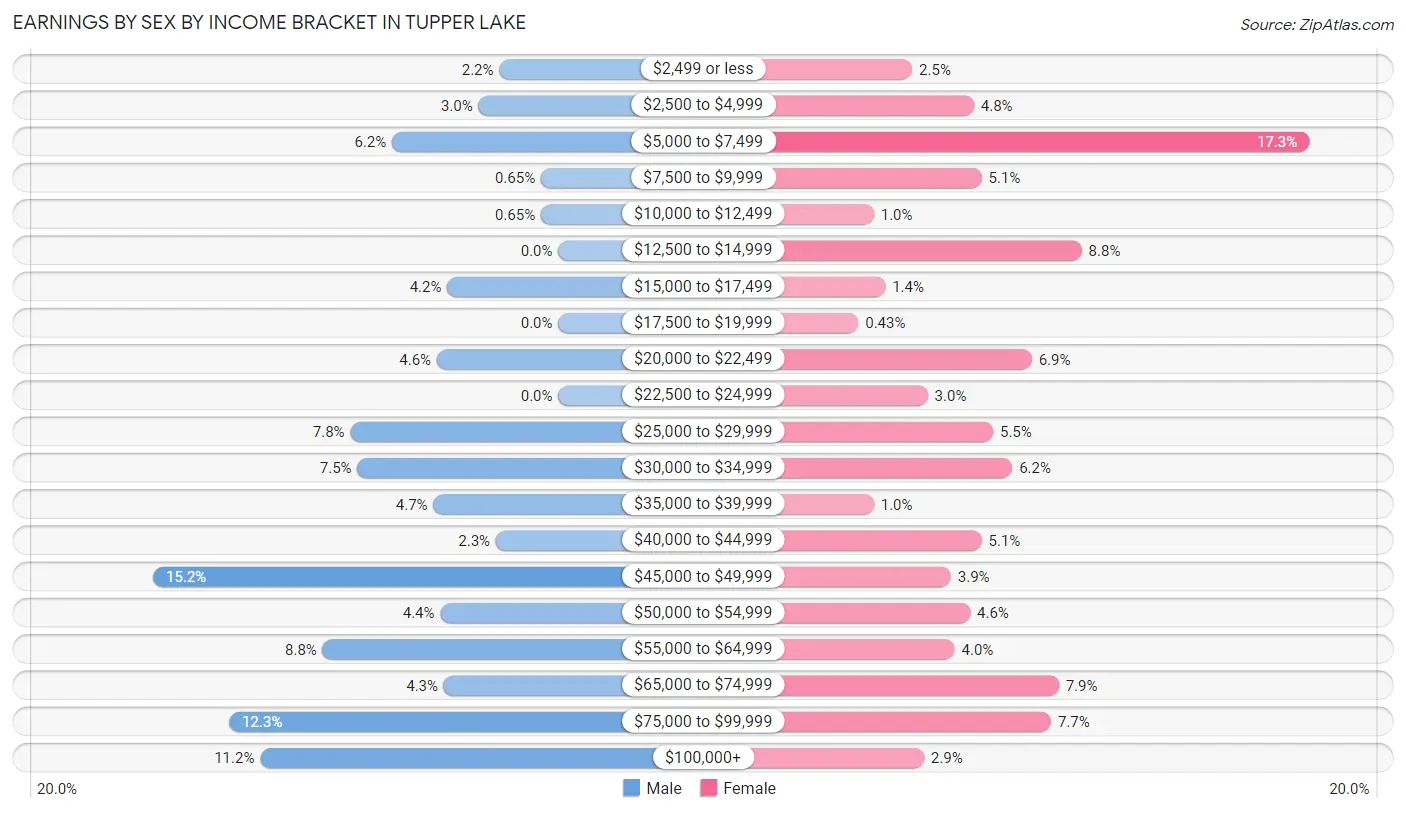
Earnings by Sex by Income Bracket in Tupper Lake
The most common earnings brackets in Tupper Lake are $45,000 to $49,999 for men (117 | 15.2%) and $5,000 to $7,499 for women (120 | 17.3%).
| Income | Male | Female |
| $2,499 or less | 17 (2.2%) | 17 (2.5%) |
| $2,500 to $4,999 | 23 (3.0%) | 33 (4.8%) |
| $5,000 to $7,499 | 48 (6.2%) | 120 (17.3%) |
| $7,500 to $9,999 | 5 (0.6%) | 35 (5.1%) |
| $10,000 to $12,499 | 5 (0.6%) | 7 (1.0%) |
| $12,500 to $14,999 | 0 (0.0%) | 61 (8.8%) |
| $15,000 to $17,499 | 32 (4.2%) | 10 (1.4%) |
| $17,500 to $19,999 | 0 (0.0%) | 3 (0.4%) |
| $20,000 to $22,499 | 35 (4.5%) | 48 (6.9%) |
| $22,500 to $24,999 | 0 (0.0%) | 21 (3.0%) |
| $25,000 to $29,999 | 60 (7.8%) | 38 (5.5%) |
| $30,000 to $34,999 | 58 (7.5%) | 43 (6.2%) |
| $35,000 to $39,999 | 36 (4.7%) | 7 (1.0%) |
| $40,000 to $44,999 | 18 (2.3%) | 35 (5.1%) |
| $45,000 to $49,999 | 117 (15.2%) | 27 (3.9%) |
| $50,000 to $54,999 | 34 (4.4%) | 32 (4.6%) |
| $55,000 to $64,999 | 68 (8.8%) | 28 (4.0%) |
| $65,000 to $74,999 | 33 (4.3%) | 55 (7.9%) |
| $75,000 to $99,999 | 95 (12.3%) | 53 (7.6%) |
| $100,000+ | 86 (11.2%) | 20 (2.9%) |
| Total | 770 (100.0%) | 693 (100.0%) |
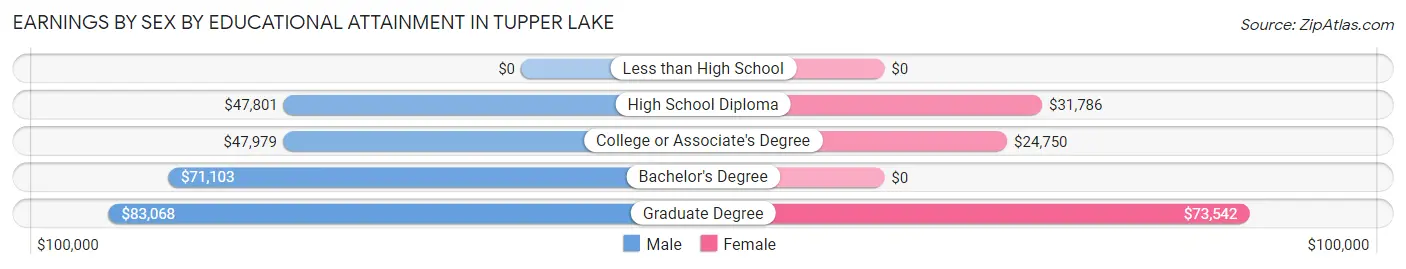
Earnings by Sex by Educational Attainment in Tupper Lake
Average earnings in Tupper Lake are $48,564 for men and $27,578 for women, a difference of 43.2%. Men with an educational attainment of graduate degree enjoy the highest average annual earnings of $83,068, while those with high school diploma education earn the least with $47,801. Women with an educational attainment of graduate degree earn the most with the average annual earnings of $73,542, while those with college or associate's degree education have the smallest earnings of $24,750.
| Educational Attainment | Male Income | Female Income |
| Less than High School | - | - |
| High School Diploma | $47,801 | $31,786 |
| College or Associate's Degree | $47,979 | $24,750 |
| Bachelor's Degree | $71,103 | $0 |
| Graduate Degree | $83,068 | $73,542 |
| Total | $48,564 | $27,578 |
Family Income in Tupper Lake
Family Income Brackets in Tupper Lake
According to the Tupper Lake family income data, there are 169 families falling into the $100,000 to $149,999 income range, which is the most common income bracket and makes up 26.6% of all families.
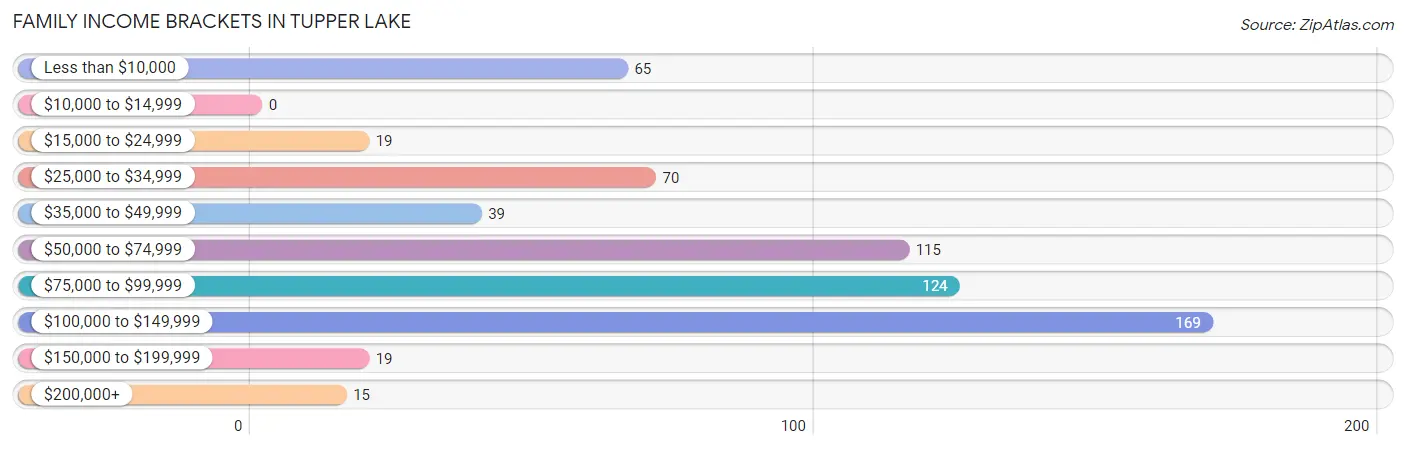
| Income Bracket | # Families | % Families |
| Less than $10,000 | 65 | 10.2% |
| $10,000 to $14,999 | 0 | 0.0% |
| $15,000 to $24,999 | 19 | 3.0% |
| $25,000 to $34,999 | 70 | 11.0% |
| $35,000 to $49,999 | 39 | 6.1% |
| $50,000 to $74,999 | 115 | 18.1% |
| $75,000 to $99,999 | 124 | 19.5% |
| $100,000 to $149,999 | 169 | 26.6% |
| $150,000 to $199,999 | 19 | 3.0% |
| $200,000+ | 15 | 2.4% |
Family Income by Famaliy Size in Tupper Lake
3-person families (136 | 21.4%) account for the highest median family income in Tupper Lake with $91,111 per family, while 2-person families (354 | 55.7%) have the highest median income of $42,916 per family member.
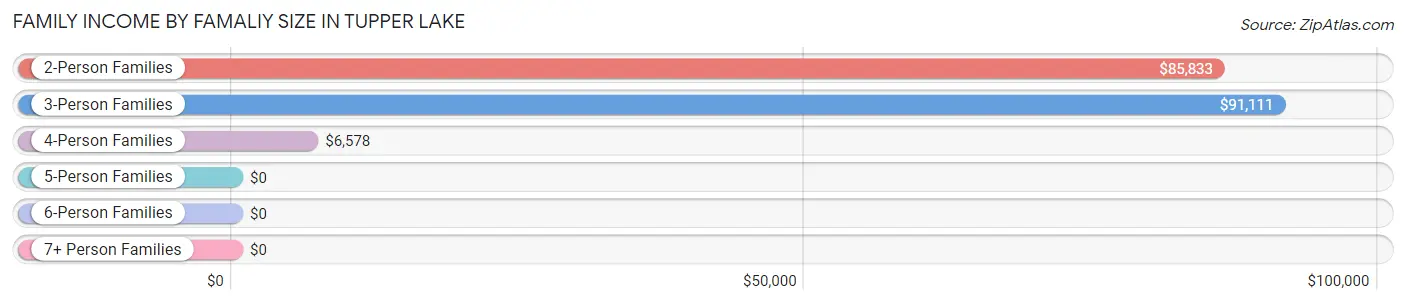
| Income Bracket | # Families | Median Income |
| 2-Person Families | 354 (55.7%) | $85,833 |
| 3-Person Families | 136 (21.4%) | $91,111 |
| 4-Person Families | 77 (12.1%) | $6,578 |
| 5-Person Families | 27 (4.3%) | $0 |
| 6-Person Families | 41 (6.5%) | $0 |
| 7+ Person Families | 0 (0.0%) | $0 |
| Total | 635 (100.0%) | $78,819 |
Family Income by Number of Earners in Tupper Lake
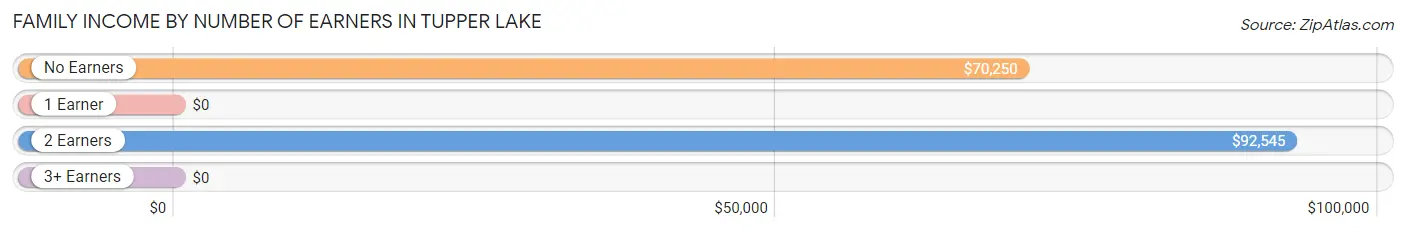
| Number of Earners | # Families | Median Income |
| No Earners | 81 (12.8%) | $70,250 |
| 1 Earner | 252 (39.7%) | $0 |
| 2 Earners | 293 (46.1%) | $92,545 |
| 3+ Earners | 9 (1.4%) | $0 |
| Total | 635 (100.0%) | $78,819 |
Household Income in Tupper Lake
Household Income Brackets in Tupper Lake
With 378 households falling in the category, the $50,000 to $74,999 income range is the most frequent in Tupper Lake, accounting for 25.2% of all households. In contrast, only 15 households (1.0%) fall into the $200,000+ income bracket, making it the least populous group.
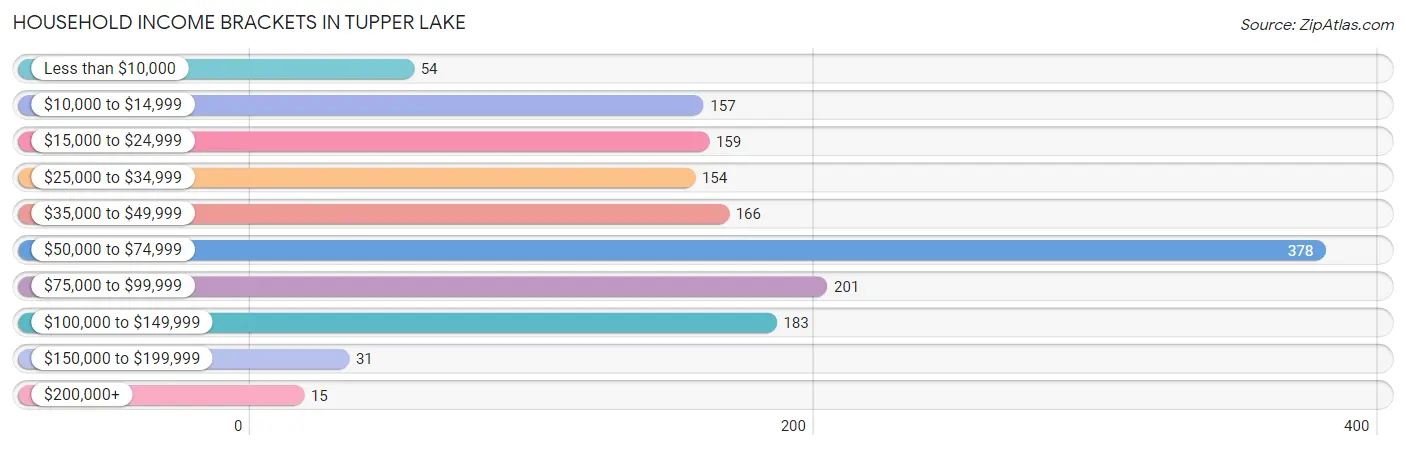
| Income Bracket | # Households | % Households |
| Less than $10,000 | 54 | 3.6% |
| $10,000 to $14,999 | 157 | 10.5% |
| $15,000 to $24,999 | 159 | 10.6% |
| $25,000 to $34,999 | 154 | 10.3% |
| $35,000 to $49,999 | 166 | 11.1% |
| $50,000 to $74,999 | 378 | 25.2% |
| $75,000 to $99,999 | 201 | 13.4% |
| $100,000 to $149,999 | 183 | 12.2% |
| $150,000 to $199,999 | 31 | 2.1% |
| $200,000+ | 15 | 1.0% |
Household Income by Householder Age in Tupper Lake
The median household income in Tupper Lake is $52,779, with the highest median household income of $78,750 found in the 45 to 64 years age bracket for the primary householder. A total of 442 households (29.5%) fall into this category.
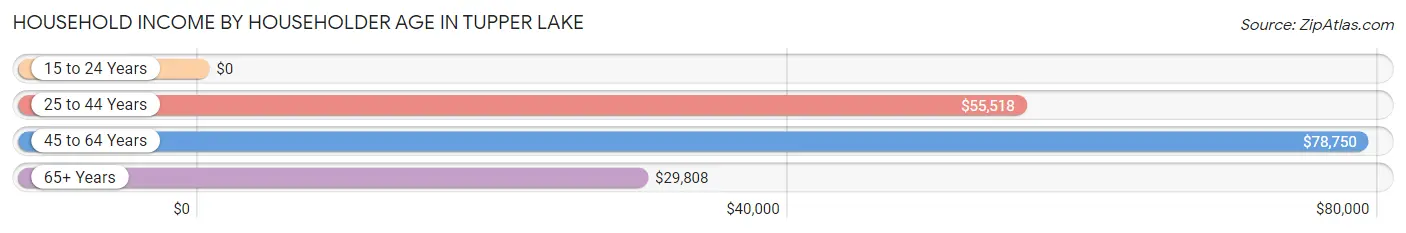
| Income Bracket | # Households | Median Income |
| 15 to 24 Years | 0 (0.0%) | $0 |
| 25 to 44 Years | 445 (29.7%) | $55,518 |
| 45 to 64 Years | 442 (29.5%) | $78,750 |
| 65+ Years | 612 (40.8%) | $29,808 |
| Total | 1,499 (100.0%) | $52,779 |
Poverty in Tupper Lake
Income Below Poverty by Sex and Age in Tupper Lake
With 16.1% poverty level for males and 22.8% for females among the residents of Tupper Lake, 6 to 11 year old males and under 5 year old females are the most vulnerable to poverty, with 79 males (83.2%) and 50 females (82.0%) in their respective age groups living below the poverty level.
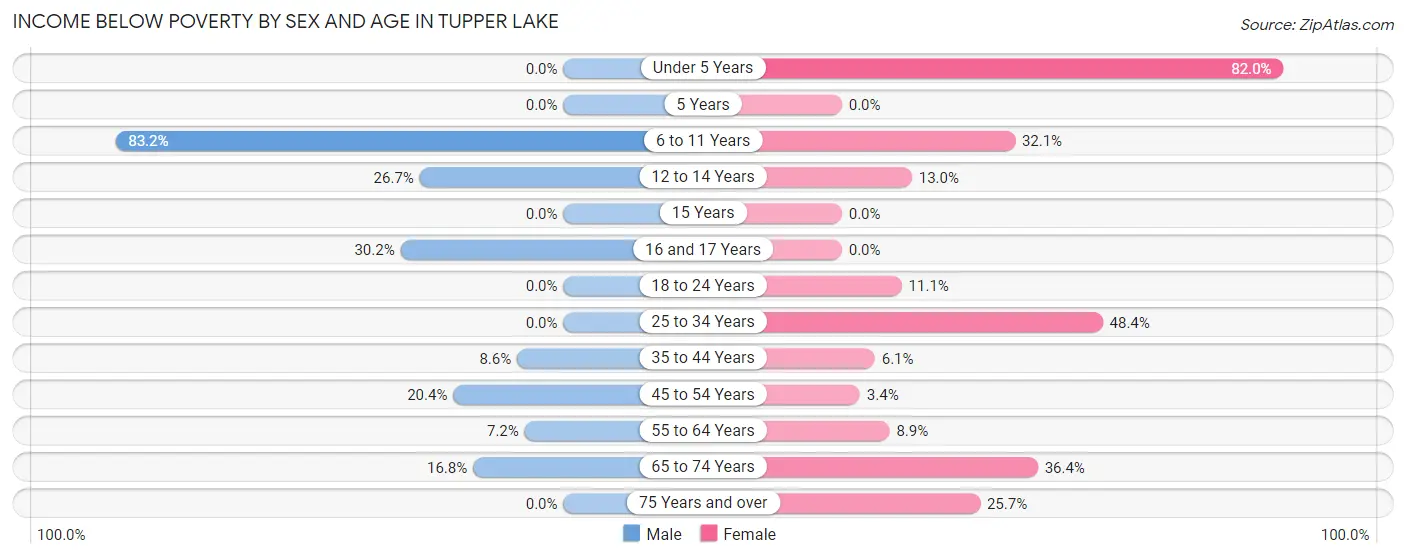
| Age Bracket | Male | Female |
| Under 5 Years | 0 (0.0%) | 50 (82.0%) |
| 5 Years | 0 (0.0%) | 0 (0.0%) |
| 6 to 11 Years | 79 (83.2%) | 18 (32.1%) |
| 12 to 14 Years | 12 (26.7%) | 13 (13.0%) |
| 15 Years | 0 (0.0%) | 0 (0.0%) |
| 16 and 17 Years | 13 (30.2%) | 0 (0.0%) |
| 18 to 24 Years | 0 (0.0%) | 10 (11.1%) |
| 25 to 34 Years | 0 (0.0%) | 76 (48.4%) |
| 35 to 44 Years | 17 (8.6%) | 12 (6.1%) |
| 45 to 54 Years | 37 (20.4%) | 5 (3.4%) |
| 55 to 64 Years | 12 (7.2%) | 20 (8.8%) |
| 65 to 74 Years | 31 (16.8%) | 92 (36.4%) |
| 75 Years and over | 0 (0.0%) | 59 (25.7%) |
| Total | 201 (16.1%) | 355 (22.8%) |
Income Above Poverty by Sex and Age in Tupper Lake
According to the poverty statistics in Tupper Lake, males aged under 5 years and females aged 16 and 17 years are the age groups that are most secure financially, with 100.0% of males and 100.0% of females in these age groups living above the poverty line.
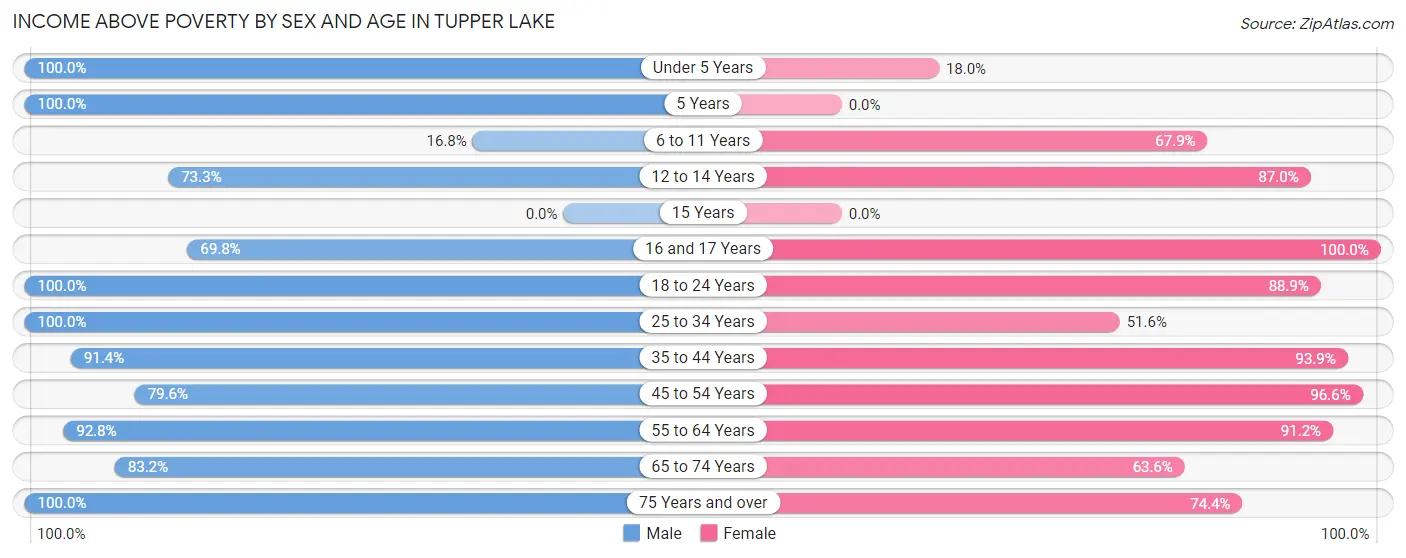
| Age Bracket | Male | Female |
| Under 5 Years | 10 (100.0%) | 11 (18.0%) |
| 5 Years | 5 (100.0%) | 0 (0.0%) |
| 6 to 11 Years | 16 (16.8%) | 38 (67.9%) |
| 12 to 14 Years | 33 (73.3%) | 87 (87.0%) |
| 15 Years | 0 (0.0%) | 0 (0.0%) |
| 16 and 17 Years | 30 (69.8%) | 36 (100.0%) |
| 18 to 24 Years | 11 (100.0%) | 80 (88.9%) |
| 25 to 34 Years | 253 (100.0%) | 81 (51.6%) |
| 35 to 44 Years | 181 (91.4%) | 184 (93.9%) |
| 45 to 54 Years | 144 (79.6%) | 144 (96.6%) |
| 55 to 64 Years | 155 (92.8%) | 206 (91.1%) |
| 65 to 74 Years | 154 (83.2%) | 161 (63.6%) |
| 75 Years and over | 57 (100.0%) | 171 (74.4%) |
| Total | 1,049 (83.9%) | 1,199 (77.2%) |
Income Below Poverty Among Married-Couple Families in Tupper Lake
The poverty statistics for married-couple families in Tupper Lake show that 4.0% or 17 of the total 429 families live below the poverty line. Families with 3 or 4 children have the highest poverty rate of 25.0%, comprising of 17 families. On the other hand, families with no children have the lowest poverty rate of 0.0%, which includes 0 families.
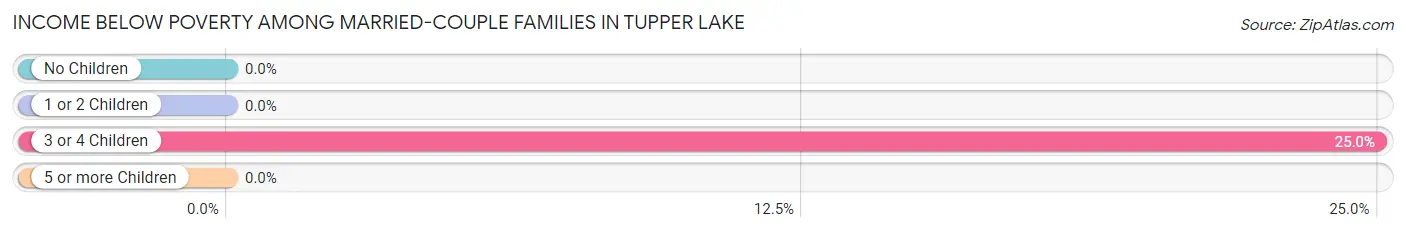
| Children | Above Poverty | Below Poverty |
| No Children | 295 (100.0%) | 0 (0.0%) |
| 1 or 2 Children | 66 (100.0%) | 0 (0.0%) |
| 3 or 4 Children | 51 (75.0%) | 17 (25.0%) |
| 5 or more Children | 0 (0.0%) | 0 (0.0%) |
| Total | 412 (96.0%) | 17 (4.0%) |
Income Below Poverty Among Single-Parent Households in Tupper Lake
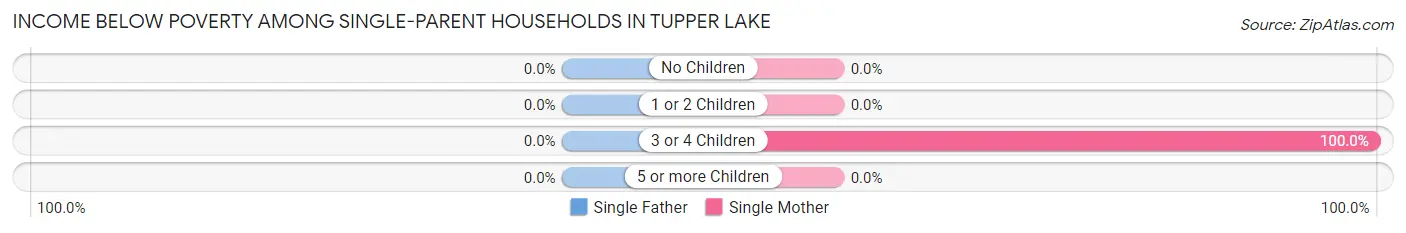
| Children | Single Father | Single Mother |
| No Children | 0 (0.0%) | 0 (0.0%) |
| 1 or 2 Children | 0 (0.0%) | 0 (0.0%) |
| 3 or 4 Children | 0 (0.0%) | 65 (100.0%) |
| 5 or more Children | 0 (0.0%) | 0 (0.0%) |
| Total | 0 (0.0%) | 65 (34.6%) |
Income Below Poverty Among Married-Couple vs Single-Parent Households in Tupper Lake
The poverty data for Tupper Lake shows that 17 of the married-couple family households (4.0%) and 65 of the single-parent households (31.6%) are living below the poverty level. Within the married-couple family households, those with 3 or 4 children have the highest poverty rate, with 17 households (25.0%) falling below the poverty line. Among the single-parent households, those with 3 or 4 children have the highest poverty rate, with 65 household (100.0%) living below poverty.
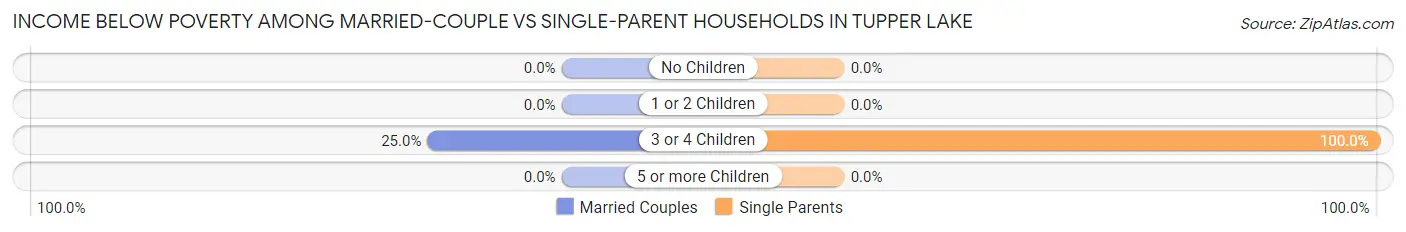
| Children | Married-Couple Families | Single-Parent Households |
| No Children | 0 (0.0%) | 0 (0.0%) |
| 1 or 2 Children | 0 (0.0%) | 0 (0.0%) |
| 3 or 4 Children | 17 (25.0%) | 65 (100.0%) |
| 5 or more Children | 0 (0.0%) | 0 (0.0%) |
| Total | 17 (4.0%) | 65 (31.6%) |
Race in Tupper Lake
The most populous races in Tupper Lake are White / Caucasian (2,618 | 93.4%), Two or more Races (99 | 3.5%), and Black / African American (76 | 2.7%).
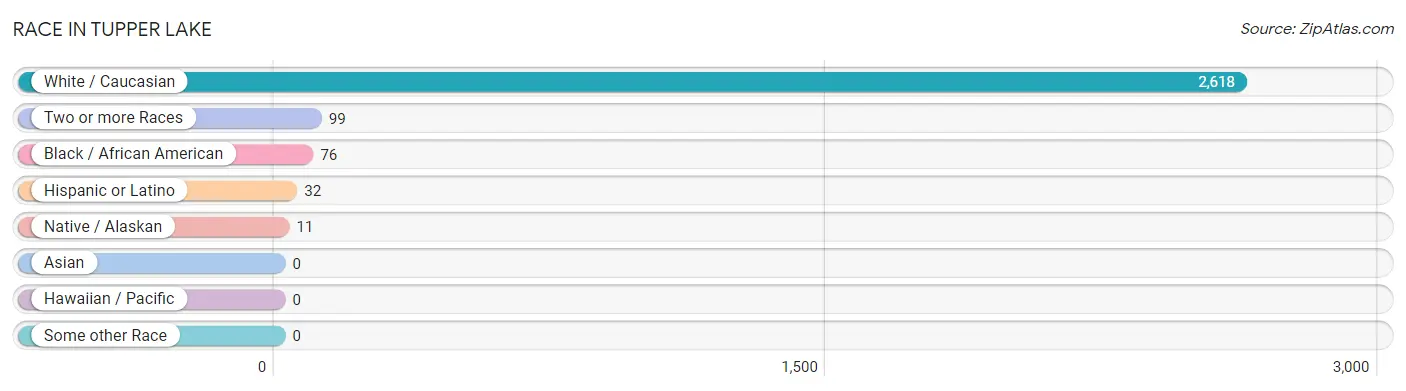
| Race | # Population | % Population |
| Asian | 0 | 0.0% |
| Black / African American | 76 | 2.7% |
| Hawaiian / Pacific | 0 | 0.0% |
| Hispanic or Latino | 32 | 1.1% |
| Native / Alaskan | 11 | 0.4% |
| White / Caucasian | 2,618 | 93.4% |
| Two or more Races | 99 | 3.5% |
| Some other Race | 0 | 0.0% |
| Total | 2,804 | 100.0% |
Ancestry in Tupper Lake
The most populous ancestries reported in Tupper Lake are Irish (602 | 21.5%), French (503 | 17.9%), French Canadian (458 | 16.3%), German (298 | 10.6%), and English (294 | 10.5%), together accounting for 76.9% of all Tupper Lake residents.
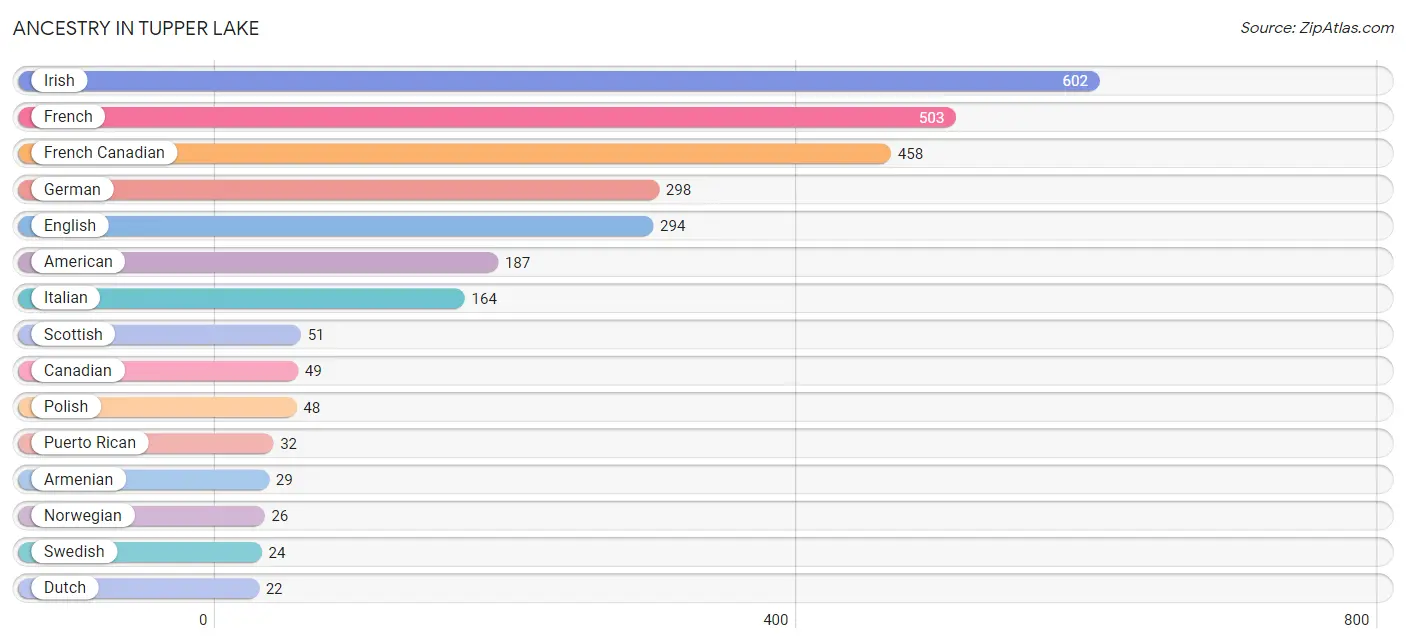
| Ancestry | # Population | % Population |
| American | 187 | 6.7% |
| Arab | 19 | 0.7% |
| Armenian | 29 | 1.0% |
| Belgian | 6 | 0.2% |
| British | 6 | 0.2% |
| Canadian | 49 | 1.8% |
| Dutch | 22 | 0.8% |
| Eastern European | 21 | 0.7% |
| English | 294 | 10.5% |
| French | 503 | 17.9% |
| French Canadian | 458 | 16.3% |
| German | 298 | 10.6% |
| Guyanese | 10 | 0.4% |
| Irish | 602 | 21.5% |
| Italian | 164 | 5.9% |
| Lebanese | 19 | 0.7% |
| Navajo | 6 | 0.2% |
| Norwegian | 26 | 0.9% |
| Pennsylvania German | 5 | 0.2% |
| Polish | 48 | 1.7% |
| Puerto Rican | 32 | 1.1% |
| Russian | 5 | 0.2% |
| Scotch-Irish | 7 | 0.3% |
| Scottish | 51 | 1.8% |
| Swedish | 24 | 0.9% |
| Swiss | 7 | 0.3% | View All 26 Rows |
Immigrants in Tupper Lake
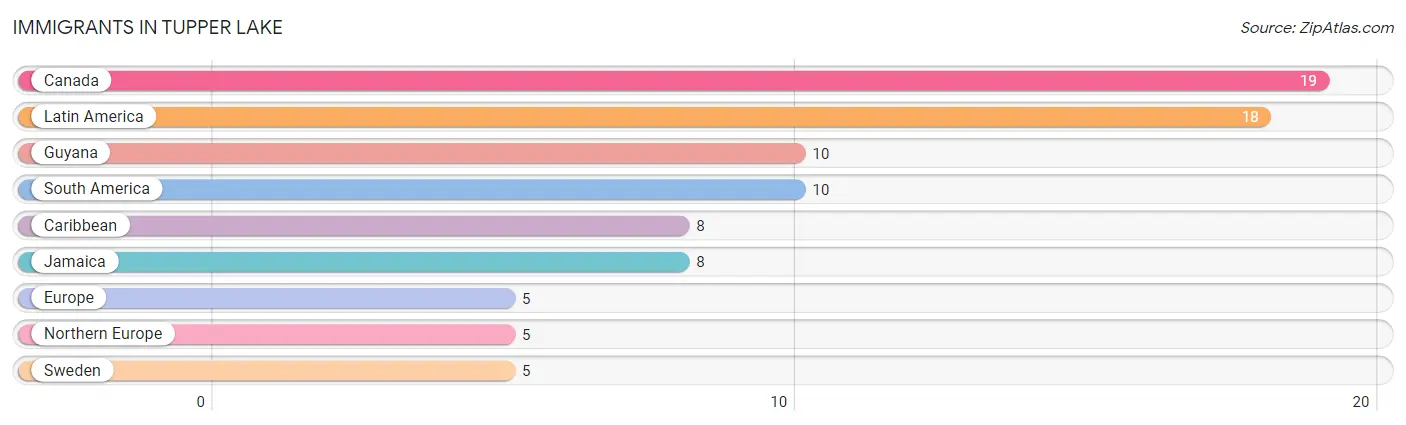
The most numerous immigrant groups reported in Tupper Lake came from Canada (19 | 0.7%), Latin America (18 | 0.6%), Guyana (10 | 0.4%), South America (10 | 0.4%), and Caribbean (8 | 0.3%), together accounting for 2.3% of all Tupper Lake residents.
| Immigration Origin | # Population | % Population |
| Canada | 19 | 0.7% |
| Caribbean | 8 | 0.3% |
| Europe | 5 | 0.2% |
| Guyana | 10 | 0.4% |
| Jamaica | 8 | 0.3% |
| Latin America | 18 | 0.6% |
| Northern Europe | 5 | 0.2% |
| South America | 10 | 0.4% |
| Sweden | 5 | 0.2% | View All 9 Rows |
Sex and Age in Tupper Lake
Sex and Age in Tupper Lake
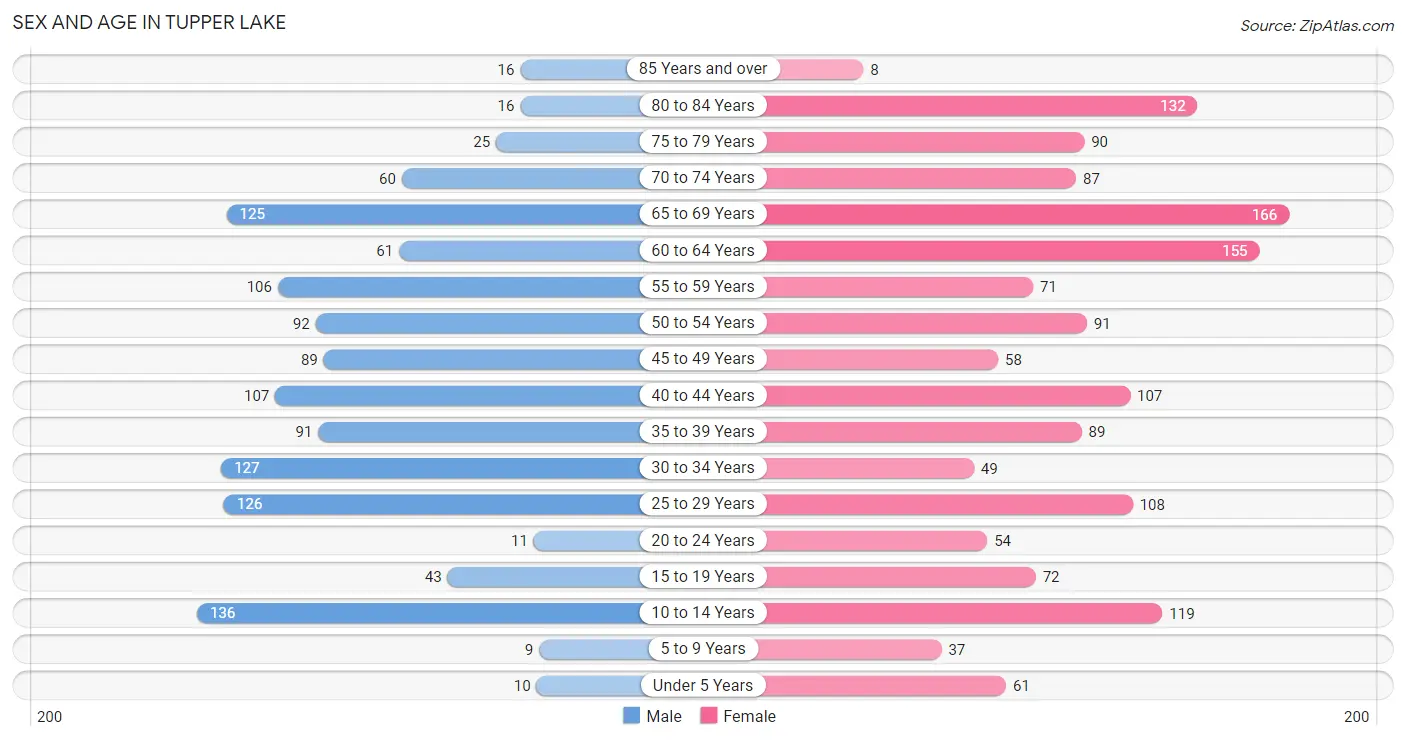
The most populous age groups in Tupper Lake are 10 to 14 Years (136 | 10.9%) for men and 65 to 69 Years (166 | 10.7%) for women.
| Age Bracket | Male | Female |
| Under 5 Years | 10 (0.8%) | 61 (3.9%) |
| 5 to 9 Years | 9 (0.7%) | 37 (2.4%) |
| 10 to 14 Years | 136 (10.9%) | 119 (7.7%) |
| 15 to 19 Years | 43 (3.4%) | 72 (4.6%) |
| 20 to 24 Years | 11 (0.9%) | 54 (3.5%) |
| 25 to 29 Years | 126 (10.1%) | 108 (7.0%) |
| 30 to 34 Years | 127 (10.2%) | 49 (3.2%) |
| 35 to 39 Years | 91 (7.3%) | 89 (5.7%) |
| 40 to 44 Years | 107 (8.6%) | 107 (6.9%) |
| 45 to 49 Years | 89 (7.1%) | 58 (3.7%) |
| 50 to 54 Years | 92 (7.4%) | 91 (5.9%) |
| 55 to 59 Years | 106 (8.5%) | 71 (4.6%) |
| 60 to 64 Years | 61 (4.9%) | 155 (10.0%) |
| 65 to 69 Years | 125 (10.0%) | 166 (10.7%) |
| 70 to 74 Years | 60 (4.8%) | 87 (5.6%) |
| 75 to 79 Years | 25 (2.0%) | 90 (5.8%) |
| 80 to 84 Years | 16 (1.3%) | 132 (8.5%) |
| 85 Years and over | 16 (1.3%) | 8 (0.5%) |
| Total | 1,250 (100.0%) | 1,554 (100.0%) |
Families and Households in Tupper Lake
Median Family Size in Tupper Lake
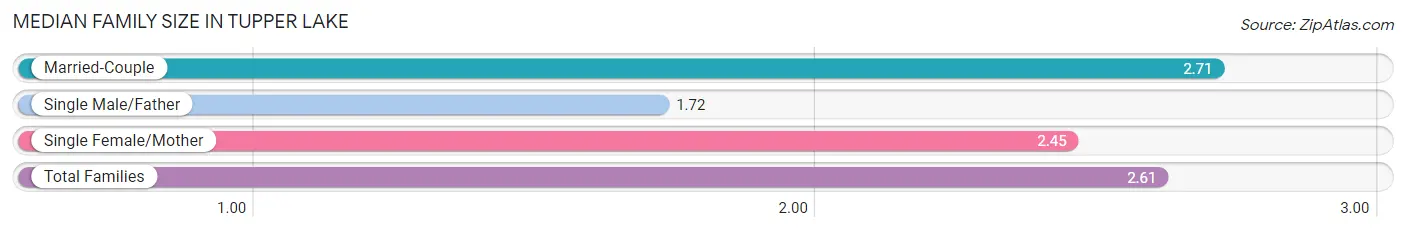
The median family size in Tupper Lake is 2.61 persons per family, with married-couple families (429 | 67.6%) accounting for the largest median family size of 2.71 persons per family. On the other hand, single male/father families (18 | 2.8%) represent the smallest median family size with 1.72 persons per family.
| Family Type | # Families | Family Size |
| Married-Couple | 429 (67.6%) | 2.71 |
| Single Male/Father | 18 (2.8%) | 1.72 |
| Single Female/Mother | 188 (29.6%) | 2.45 |
| Total Families | 635 (100.0%) | 2.61 |
Median Household Size in Tupper Lake
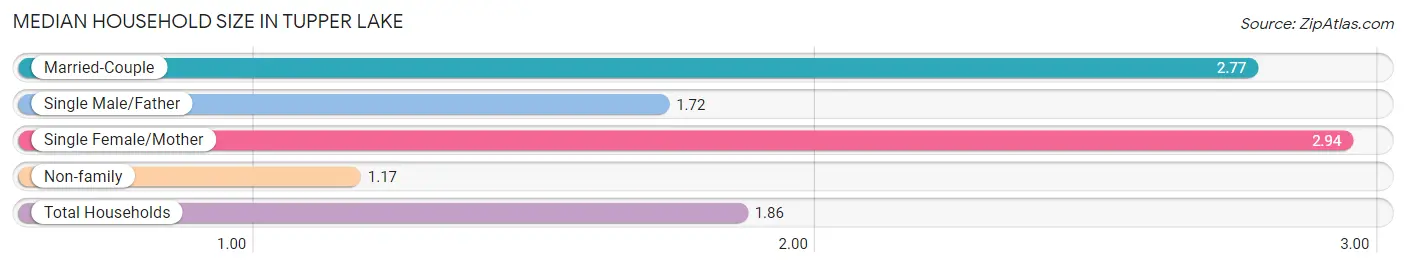
The median household size in Tupper Lake is 1.86 persons per household, with single female/mother households (188 | 12.5%) accounting for the largest median household size of 2.94 persons per household. non-family households (864 | 57.6%) represent the smallest median household size with 1.17 persons per household.
| Household Type | # Households | Household Size |
| Married-Couple | 429 (28.6%) | 2.77 |
| Single Male/Father | 18 (1.2%) | 1.72 |
| Single Female/Mother | 188 (12.5%) | 2.94 |
| Non-family | 864 (57.6%) | 1.17 |
| Total Households | 1,499 (100.0%) | 1.86 |
Household Size by Marriage Status in Tupper Lake
Out of a total of 1,499 households in Tupper Lake, 635 (42.4%) are family households, while 864 (57.6%) are nonfamily households. The most numerous type of family households are 2-person households, comprising 278, and the most common type of nonfamily households are 1-person households, comprising 755.
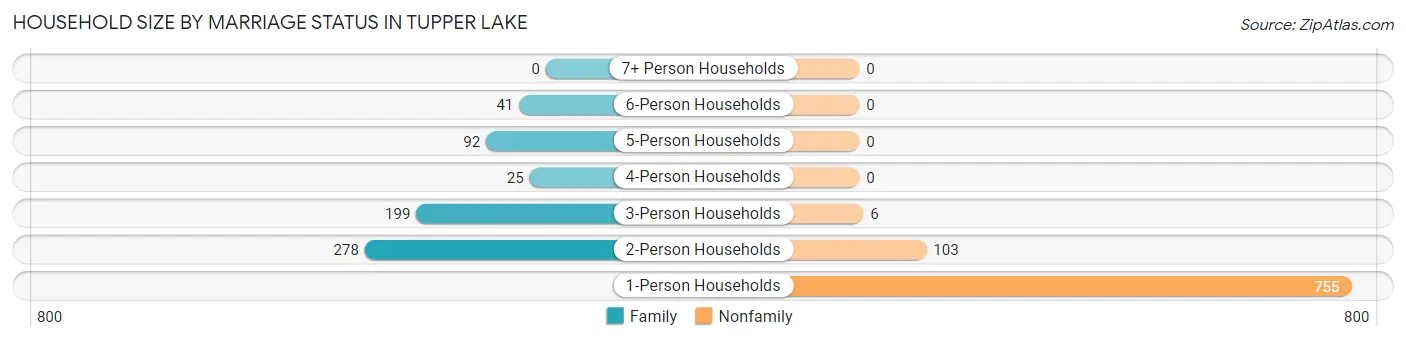
| Household Size | Family Households | Nonfamily Households |
| 1-Person Households | - | 755 (50.4%) |
| 2-Person Households | 278 (18.5%) | 103 (6.9%) |
| 3-Person Households | 199 (13.3%) | 6 (0.4%) |
| 4-Person Households | 25 (1.7%) | 0 (0.0%) |
| 5-Person Households | 92 (6.1%) | 0 (0.0%) |
| 6-Person Households | 41 (2.7%) | 0 (0.0%) |
| 7+ Person Households | 0 (0.0%) | 0 (0.0%) |
| Total | 635 (42.4%) | 864 (57.6%) |
Female Fertility in Tupper Lake
Fertility by Age in Tupper Lake
Average fertility rate in Tupper Lake is 9.0 births per 1,000 women. Women in the age bracket of 20 to 34 years have the highest fertility rate with 24.0 births per 1,000 women. Women in the age bracket of 20 to 34 years acount for 100.0% of all women with births.
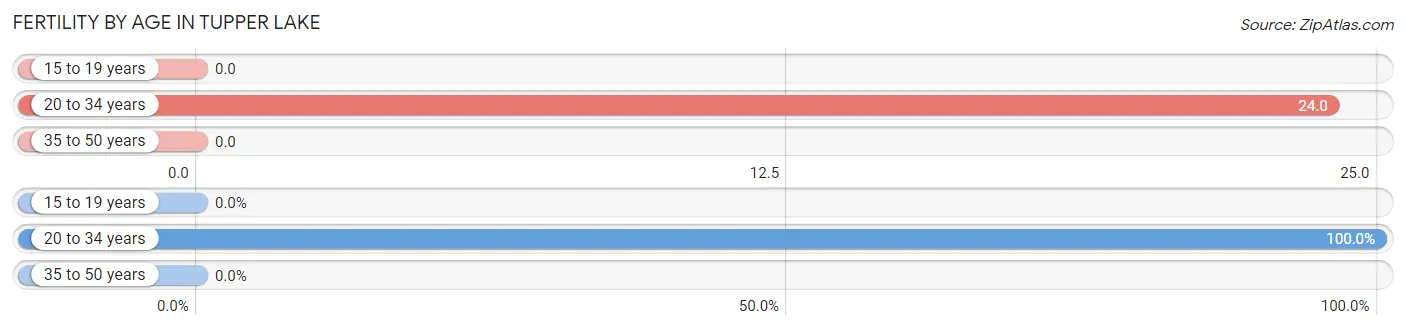
| Age Bracket | Women with Births | Births / 1,000 Women |
| 15 to 19 years | 0 (0.0%) | 0.0 |
| 20 to 34 years | 5 (100.0%) | 24.0 |
| 35 to 50 years | 0 (0.0%) | 0.0 |
| Total | 5 (100.0%) | 9.0 |
Fertility by Age by Marriage Status in Tupper Lake
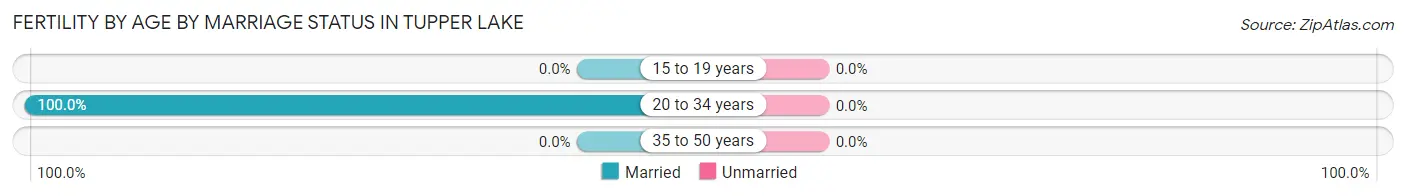
| Age Bracket | Married | Unmarried |
| 15 to 19 years | 0 (0.0%) | 0 (0.0%) |
| 20 to 34 years | 5 (100.0%) | 0 (0.0%) |
| 35 to 50 years | 0 (0.0%) | 0 (0.0%) |
| Total | 5 (100.0%) | 0 (0.0%) |
Fertility by Education in Tupper Lake
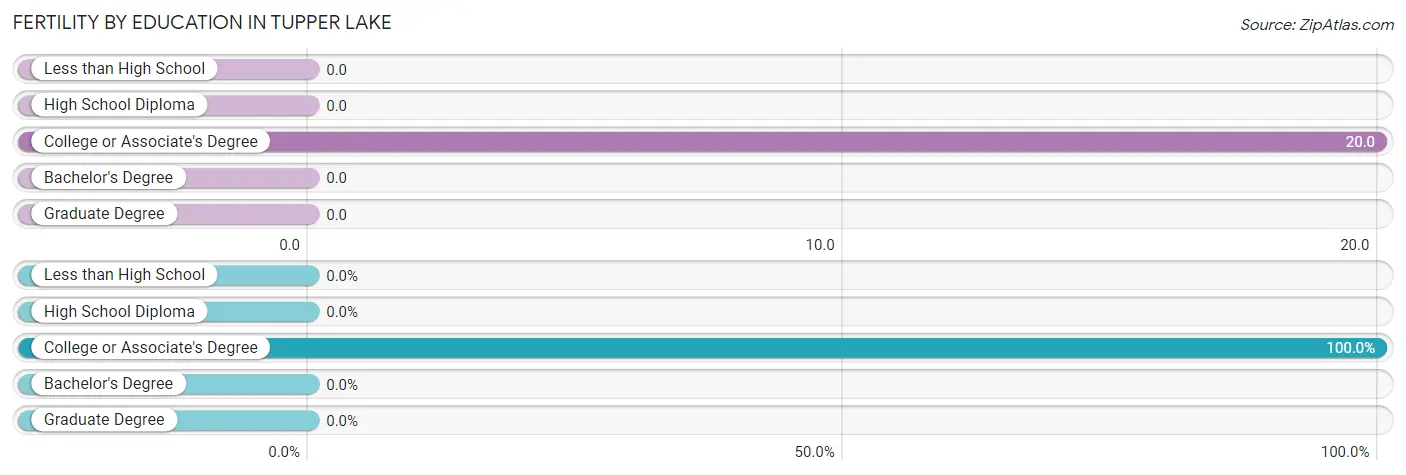
| Educational Attainment | Women with Births | Births / 1,000 Women |
| Less than High School | 0 (0.0%) | 0.0 |
| High School Diploma | 0 (0.0%) | 0.0 |
| College or Associate's Degree | 5 (100.0%) | 20.0 |
| Bachelor's Degree | 0 (0.0%) | 0.0 |
| Graduate Degree | 0 (0.0%) | 0.0 |
| Total | 5 (100.0%) | 9.0 |
Fertility by Education by Marriage Status in Tupper Lake
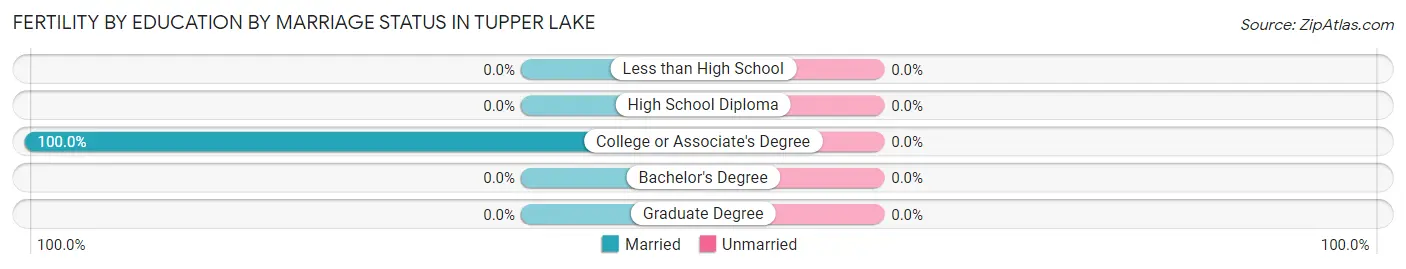
| Educational Attainment | Married | Unmarried |
| Less than High School | 0 (0.0%) | 0 (0.0%) |
| High School Diploma | 0 (0.0%) | 0 (0.0%) |
| College or Associate's Degree | 5 (100.0%) | 0 (0.0%) |
| Bachelor's Degree | 0 (0.0%) | 0 (0.0%) |
| Graduate Degree | 0 (0.0%) | 0 (0.0%) |
| Total | 5 (100.0%) | 0 (0.0%) |
Employment Characteristics in Tupper Lake
Employment by Class of Employer in Tupper Lake
Among the 1,279 employed individuals in Tupper Lake, private company employees (576 | 45.0%), state government employees (309 | 24.2%), and not-for-profit organizations (199 | 15.6%) make up the most common classes of employment.
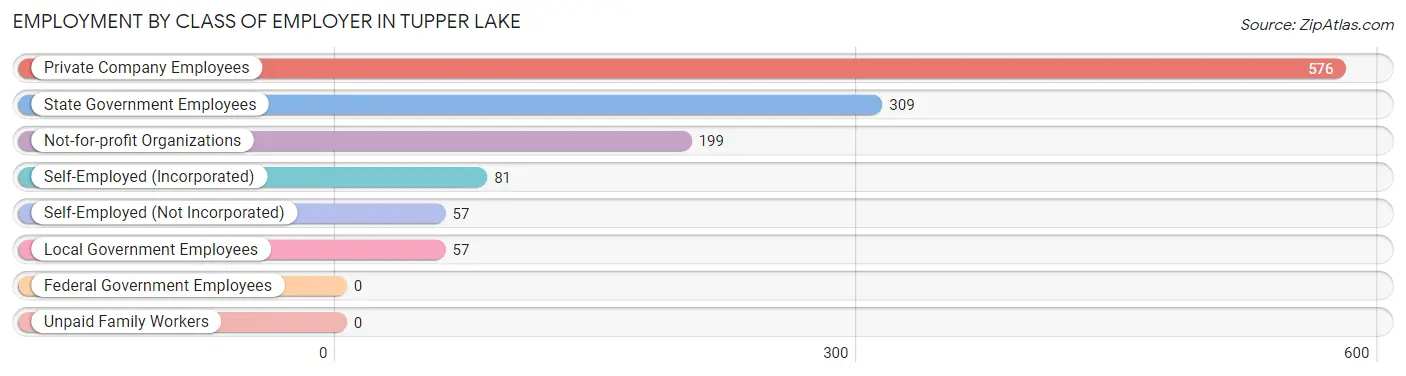
| Employer Class | # Employees | % Employees |
| Private Company Employees | 576 | 45.0% |
| Self-Employed (Incorporated) | 81 | 6.3% |
| Self-Employed (Not Incorporated) | 57 | 4.5% |
| Not-for-profit Organizations | 199 | 15.6% |
| Local Government Employees | 57 | 4.5% |
| State Government Employees | 309 | 24.2% |
| Federal Government Employees | 0 | 0.0% |
| Unpaid Family Workers | 0 | 0.0% |
| Total | 1,279 | 100.0% |
Employment Status by Age in Tupper Lake
According to the labor force statistics for Tupper Lake, out of the total population over 16 years of age (2,432), 56.9% or 1,384 individuals are in the labor force, with 4.8% or 66 of them unemployed. The age group with the highest labor force participation rate is 20 to 24 years, with 100.0% or 65 individuals in the labor force. Within the labor force, the 20 to 24 years age range has the highest percentage of unemployed individuals, with 15.4% or 10 of them being unemployed.
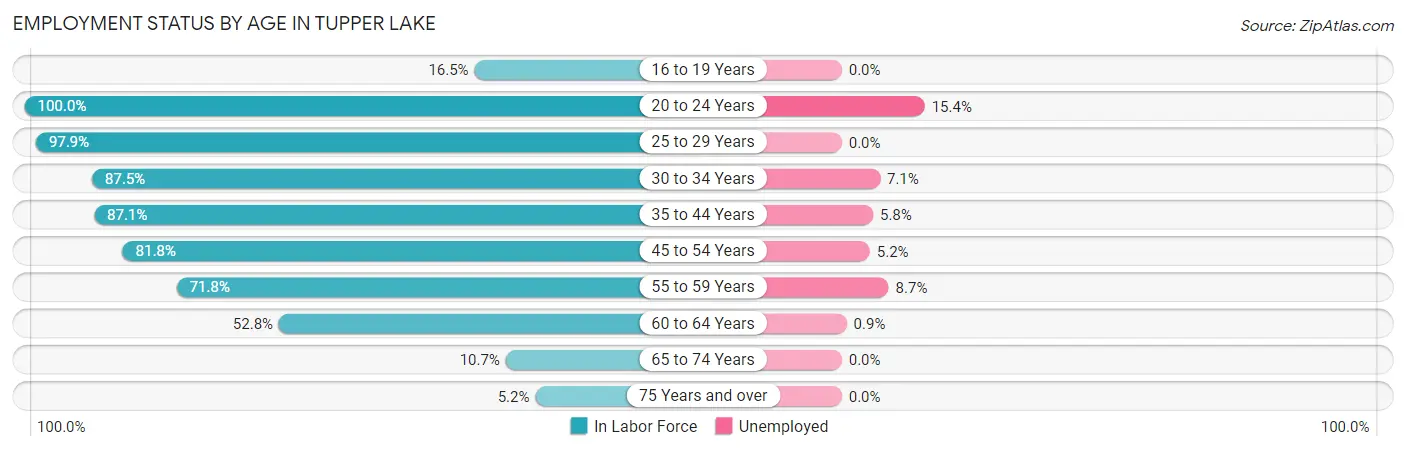
| Age Bracket | In Labor Force | Unemployed |
| 16 to 19 Years | 19 (16.5%) | 0 (0.0%) |
| 20 to 24 Years | 65 (100.0%) | 10 (15.4%) |
| 25 to 29 Years | 229 (97.9%) | 0 (0.0%) |
| 30 to 34 Years | 154 (87.5%) | 11 (7.1%) |
| 35 to 44 Years | 343 (87.1%) | 20 (5.8%) |
| 45 to 54 Years | 270 (81.8%) | 14 (5.2%) |
| 55 to 59 Years | 127 (71.8%) | 11 (8.7%) |
| 60 to 64 Years | 114 (52.8%) | 1 (0.9%) |
| 65 to 74 Years | 47 (10.7%) | 0 (0.0%) |
| 75 Years and over | 15 (5.2%) | 0 (0.0%) |
| Total | 1,384 (56.9%) | 66 (4.8%) |
Employment Status by Educational Attainment in Tupper Lake
According to labor force statistics for Tupper Lake, 81.0% of individuals (1,237) out of the total population between 25 and 64 years of age (1,527) are in the labor force, with 4.6% or 57 of them being unemployed. The group with the highest labor force participation rate are those with the educational attainment of bachelor's degree or higher, with 94.4% or 234 individuals in the labor force. Within the labor force, individuals with less than high school education have the highest percentage of unemployment, with 23.8% or 10 of them being unemployed.
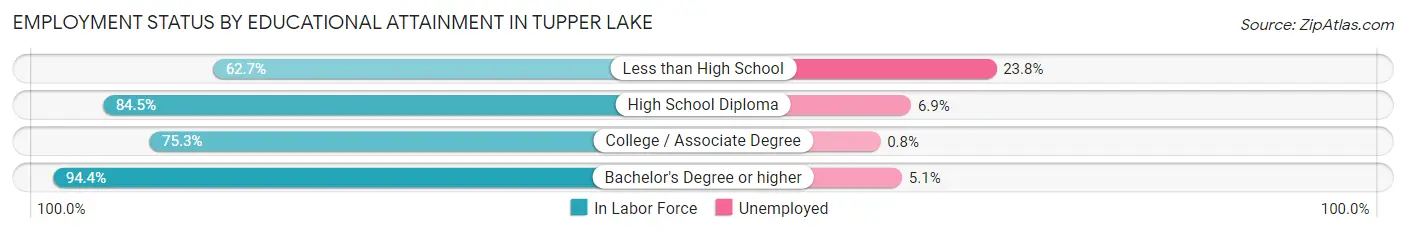
| Educational Attainment | In Labor Force | Unemployed |
| Less than High School | 42 (62.7%) | 16 (23.8%) |
| High School Diploma | 447 (84.5%) | 37 (6.9%) |
| College / Associate Degree | 514 (75.3%) | 5 (0.8%) |
| Bachelor's Degree or higher | 234 (94.4%) | 13 (5.1%) |
| Total | 1,237 (81.0%) | 70 (4.6%) |
Employment Occupations by Sex in Tupper Lake
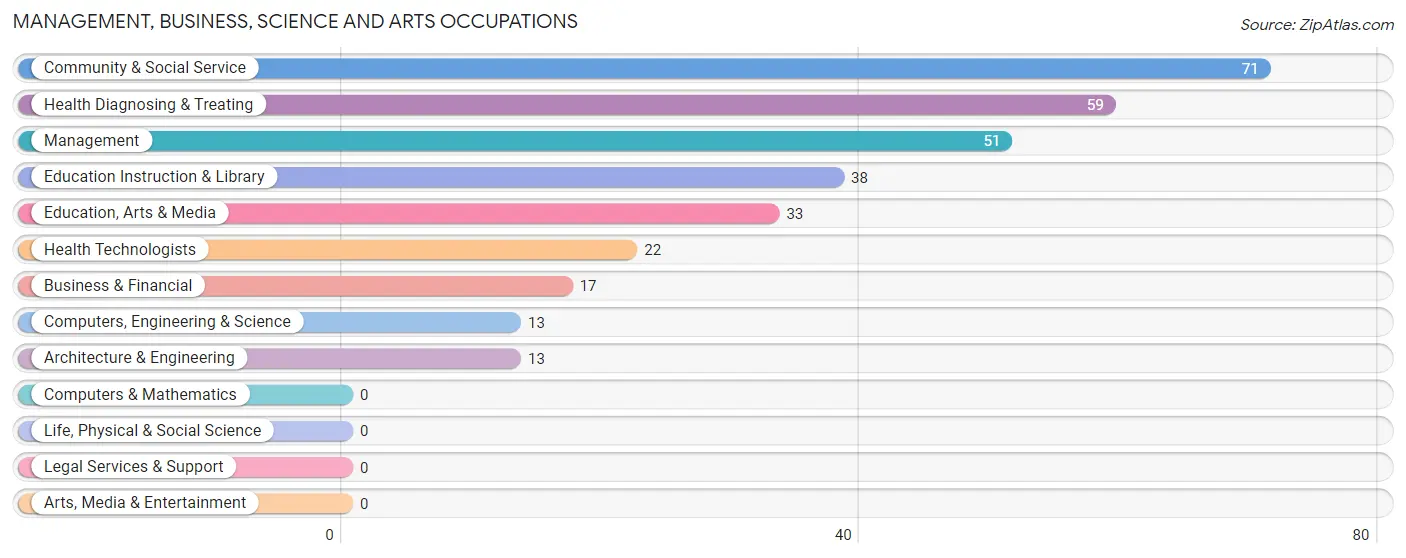
Management, Business, Science and Arts Occupations
The most common Management, Business, Science and Arts occupations in Tupper Lake are Community & Social Service (71 | 5.4%), Health Diagnosing & Treating (59 | 4.5%), Management (51 | 3.9%), Education Instruction & Library (38 | 2.9%), and Education, Arts & Media (33 | 2.5%).
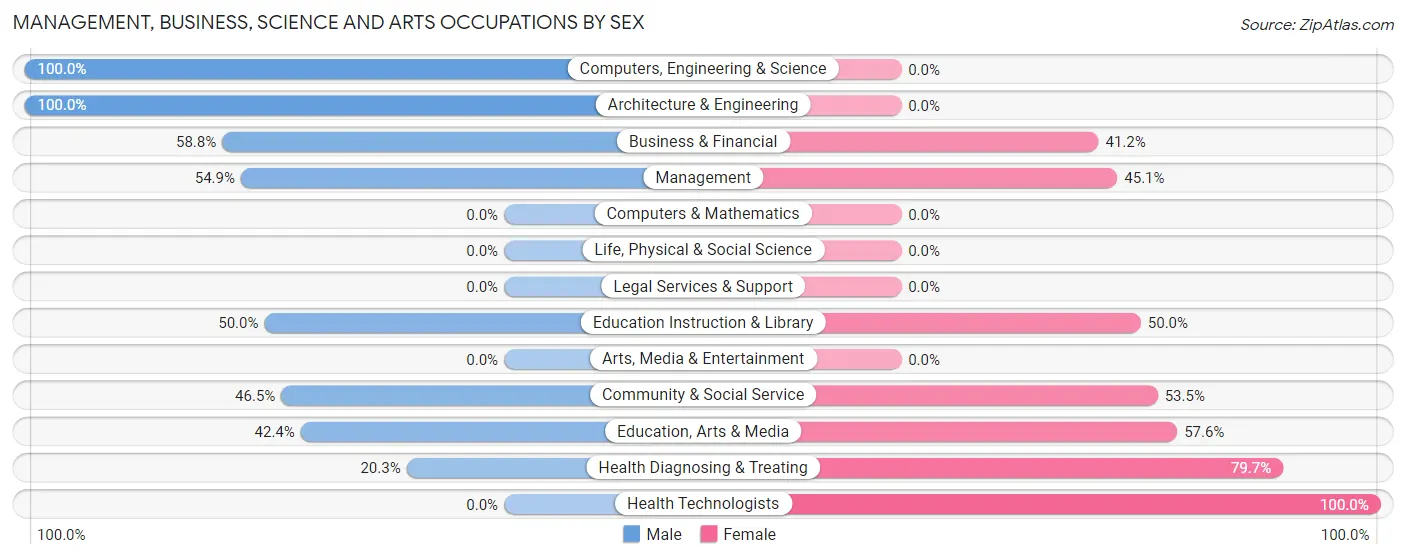
Management, Business, Science and Arts Occupations by Sex
Within the Management, Business, Science and Arts occupations in Tupper Lake, the most male-oriented occupations are Computers, Engineering & Science (100.0%), Architecture & Engineering (100.0%), and Business & Financial (58.8%), while the most female-oriented occupations are Health Technologists (100.0%), Health Diagnosing & Treating (79.7%), and Education, Arts & Media (57.6%).
| Occupation | Male | Female |
| Management | 28 (54.9%) | 23 (45.1%) |
| Business & Financial | 10 (58.8%) | 7 (41.2%) |
| Computers, Engineering & Science | 13 (100.0%) | 0 (0.0%) |
| Computers & Mathematics | 0 (0.0%) | 0 (0.0%) |
| Architecture & Engineering | 13 (100.0%) | 0 (0.0%) |
| Life, Physical & Social Science | 0 (0.0%) | 0 (0.0%) |
| Community & Social Service | 33 (46.5%) | 38 (53.5%) |
| Education, Arts & Media | 14 (42.4%) | 19 (57.6%) |
| Legal Services & Support | 0 (0.0%) | 0 (0.0%) |
| Education Instruction & Library | 19 (50.0%) | 19 (50.0%) |
| Arts, Media & Entertainment | 0 (0.0%) | 0 (0.0%) |
| Health Diagnosing & Treating | 12 (20.3%) | 47 (79.7%) |
| Health Technologists | 0 (0.0%) | 22 (100.0%) |
| Total (Category) | 96 (45.5%) | 115 (54.5%) |
| Total (Overall) | 733 (55.7%) | 583 (44.3%) |
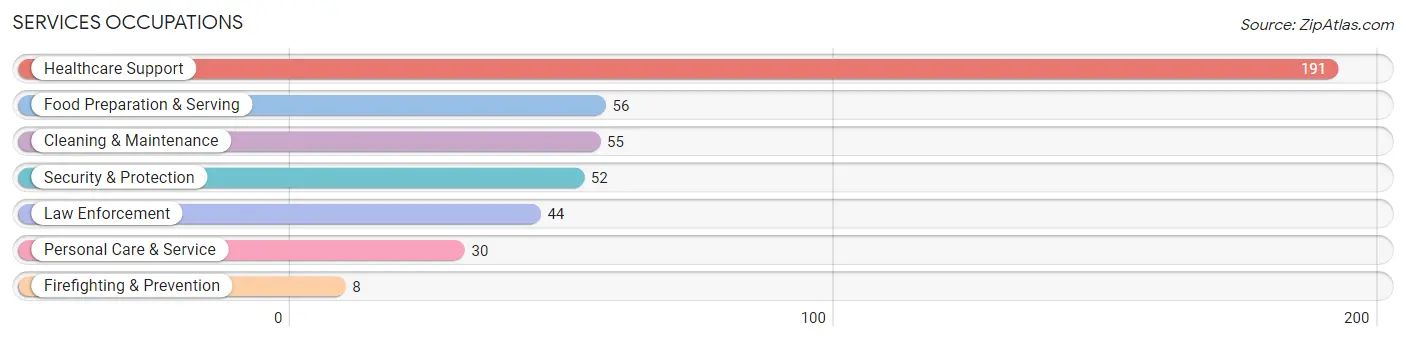
Services Occupations
The most common Services occupations in Tupper Lake are Healthcare Support (191 | 14.5%), Food Preparation & Serving (56 | 4.3%), Cleaning & Maintenance (55 | 4.2%), Security & Protection (52 | 4.0%), and Law Enforcement (44 | 3.3%).
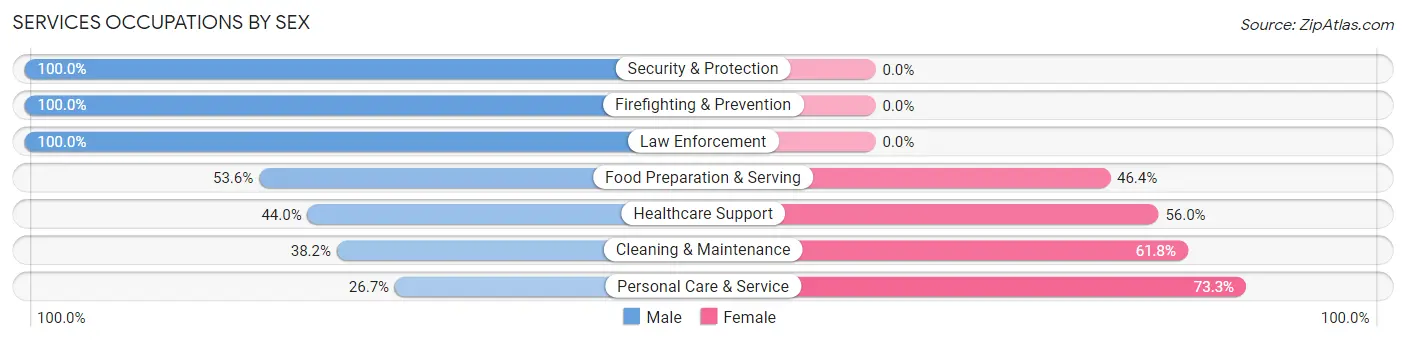
Services Occupations by Sex
Within the Services occupations in Tupper Lake, the most male-oriented occupations are Security & Protection (100.0%), Firefighting & Prevention (100.0%), and Law Enforcement (100.0%), while the most female-oriented occupations are Personal Care & Service (73.3%), Cleaning & Maintenance (61.8%), and Healthcare Support (56.0%).
| Occupation | Male | Female |
| Healthcare Support | 84 (44.0%) | 107 (56.0%) |
| Security & Protection | 52 (100.0%) | 0 (0.0%) |
| Firefighting & Prevention | 8 (100.0%) | 0 (0.0%) |
| Law Enforcement | 44 (100.0%) | 0 (0.0%) |
| Food Preparation & Serving | 30 (53.6%) | 26 (46.4%) |
| Cleaning & Maintenance | 21 (38.2%) | 34 (61.8%) |
| Personal Care & Service | 8 (26.7%) | 22 (73.3%) |
| Total (Category) | 195 (50.8%) | 189 (49.2%) |
| Total (Overall) | 733 (55.7%) | 583 (44.3%) |
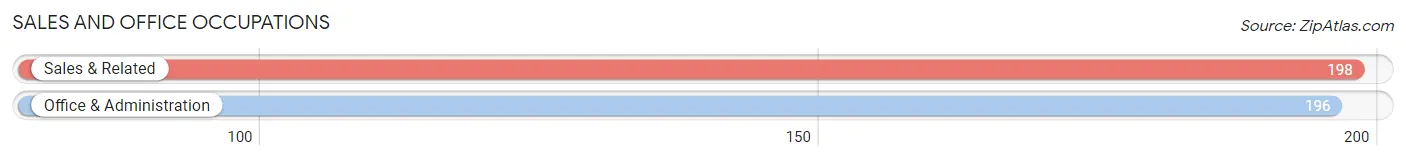
Sales and Office Occupations
The most common Sales and Office occupations in Tupper Lake are Sales & Related (198 | 15.0%), and Office & Administration (196 | 14.9%).
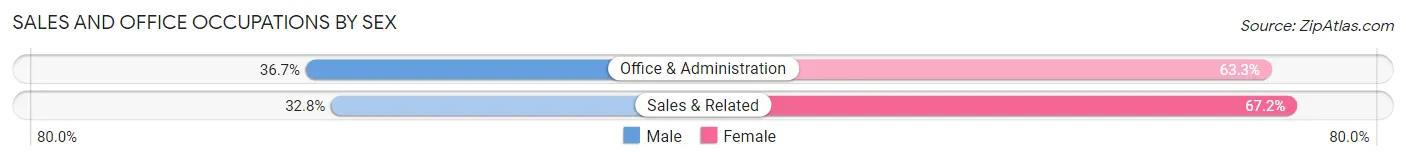
Sales and Office Occupations by Sex
| Occupation | Male | Female |
| Sales & Related | 65 (32.8%) | 133 (67.2%) |
| Office & Administration | 72 (36.7%) | 124 (63.3%) |
| Total (Category) | 137 (34.8%) | 257 (65.2%) |
| Total (Overall) | 733 (55.7%) | 583 (44.3%) |
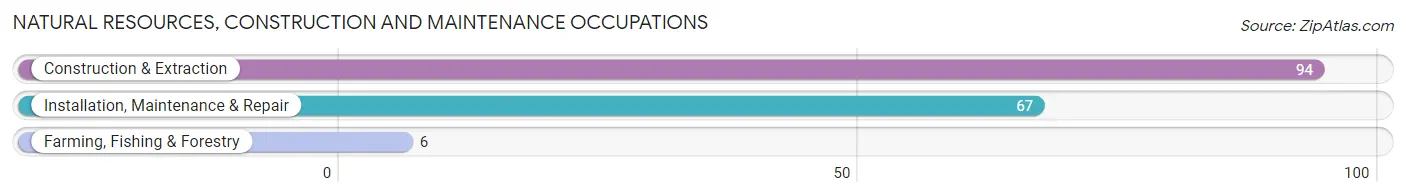
Natural Resources, Construction and Maintenance Occupations
The most common Natural Resources, Construction and Maintenance occupations in Tupper Lake are Construction & Extraction (94 | 7.1%), Installation, Maintenance & Repair (67 | 5.1%), and Farming, Fishing & Forestry (6 | 0.5%).
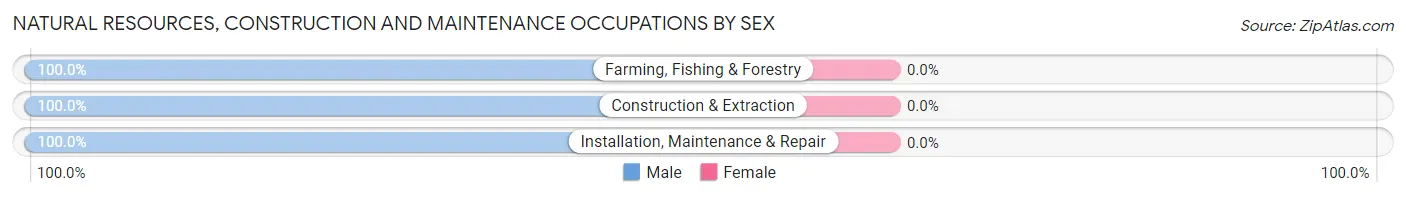
Natural Resources, Construction and Maintenance Occupations by Sex
| Occupation | Male | Female |
| Farming, Fishing & Forestry | 6 (100.0%) | 0 (0.0%) |
| Construction & Extraction | 94 (100.0%) | 0 (0.0%) |
| Installation, Maintenance & Repair | 67 (100.0%) | 0 (0.0%) |
| Total (Category) | 167 (100.0%) | 0 (0.0%) |
| Total (Overall) | 733 (55.7%) | 583 (44.3%) |
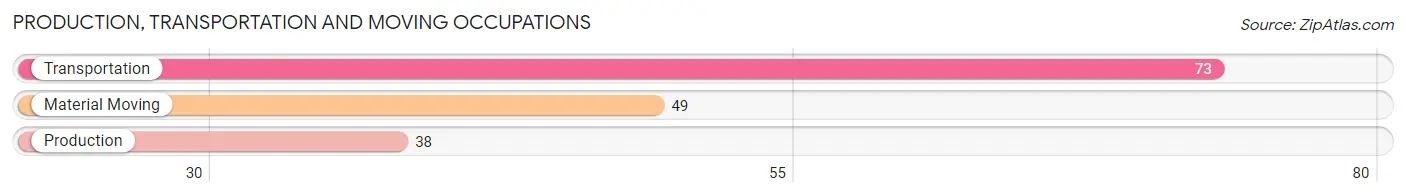
Production, Transportation and Moving Occupations
The most common Production, Transportation and Moving occupations in Tupper Lake are Transportation (73 | 5.6%), Material Moving (49 | 3.7%), and Production (38 | 2.9%).
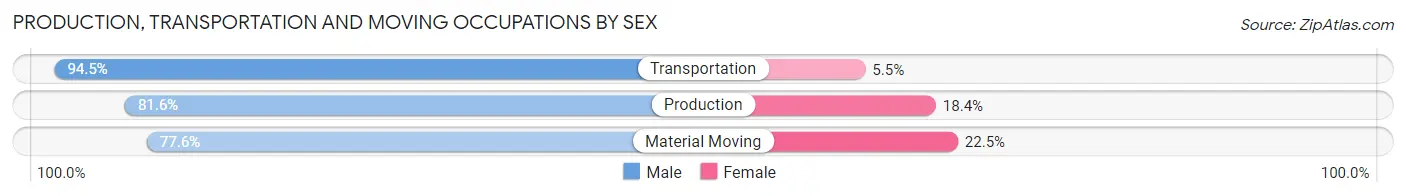
Production, Transportation and Moving Occupations by Sex
| Occupation | Male | Female |
| Production | 31 (81.6%) | 7 (18.4%) |
| Transportation | 69 (94.5%) | 4 (5.5%) |
| Material Moving | 38 (77.5%) | 11 (22.5%) |
| Total (Category) | 138 (86.3%) | 22 (13.8%) |
| Total (Overall) | 733 (55.7%) | 583 (44.3%) |
Employment Industries by Sex in Tupper Lake
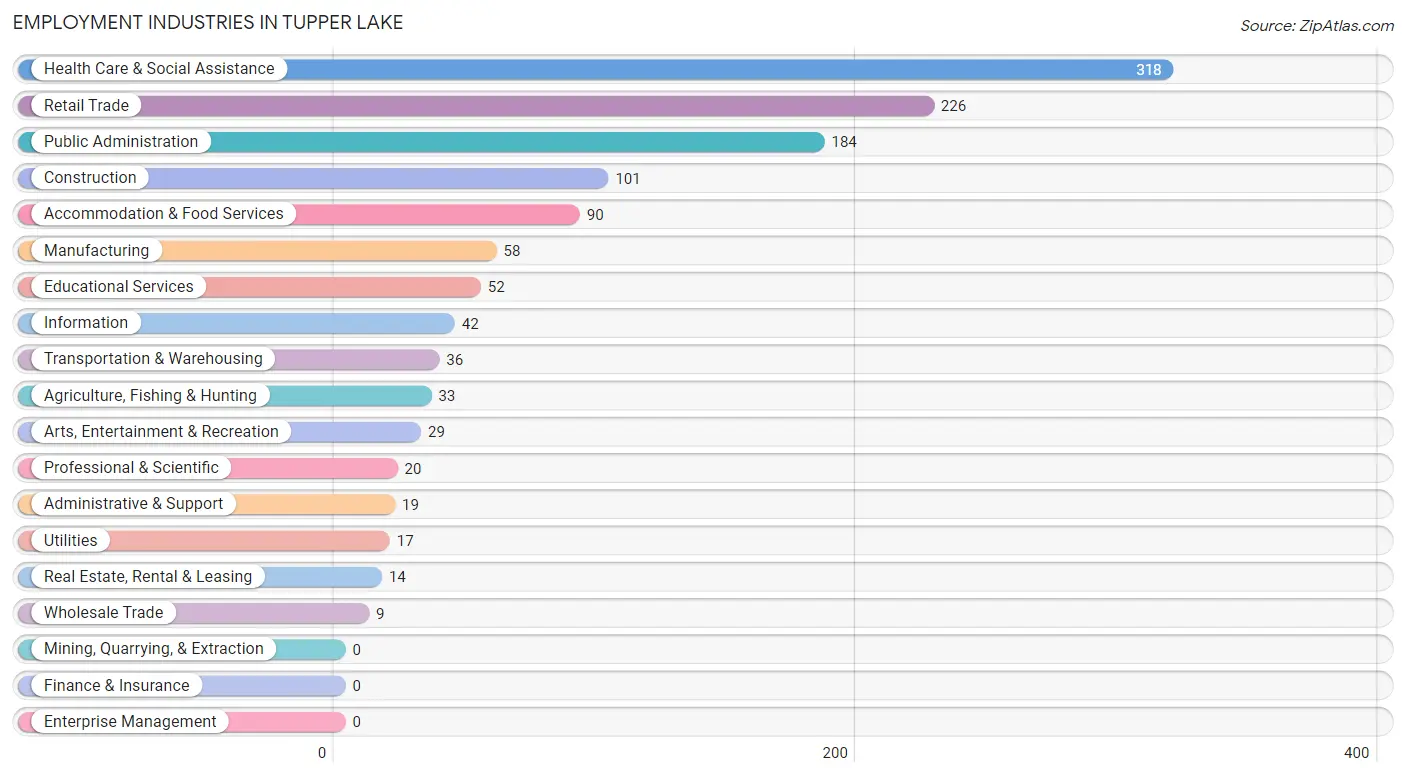
Employment Industries in Tupper Lake
The major employment industries in Tupper Lake include Health Care & Social Assistance (318 | 24.2%), Retail Trade (226 | 17.2%), Public Administration (184 | 14.0%), Construction (101 | 7.7%), and Accommodation & Food Services (90 | 6.8%).
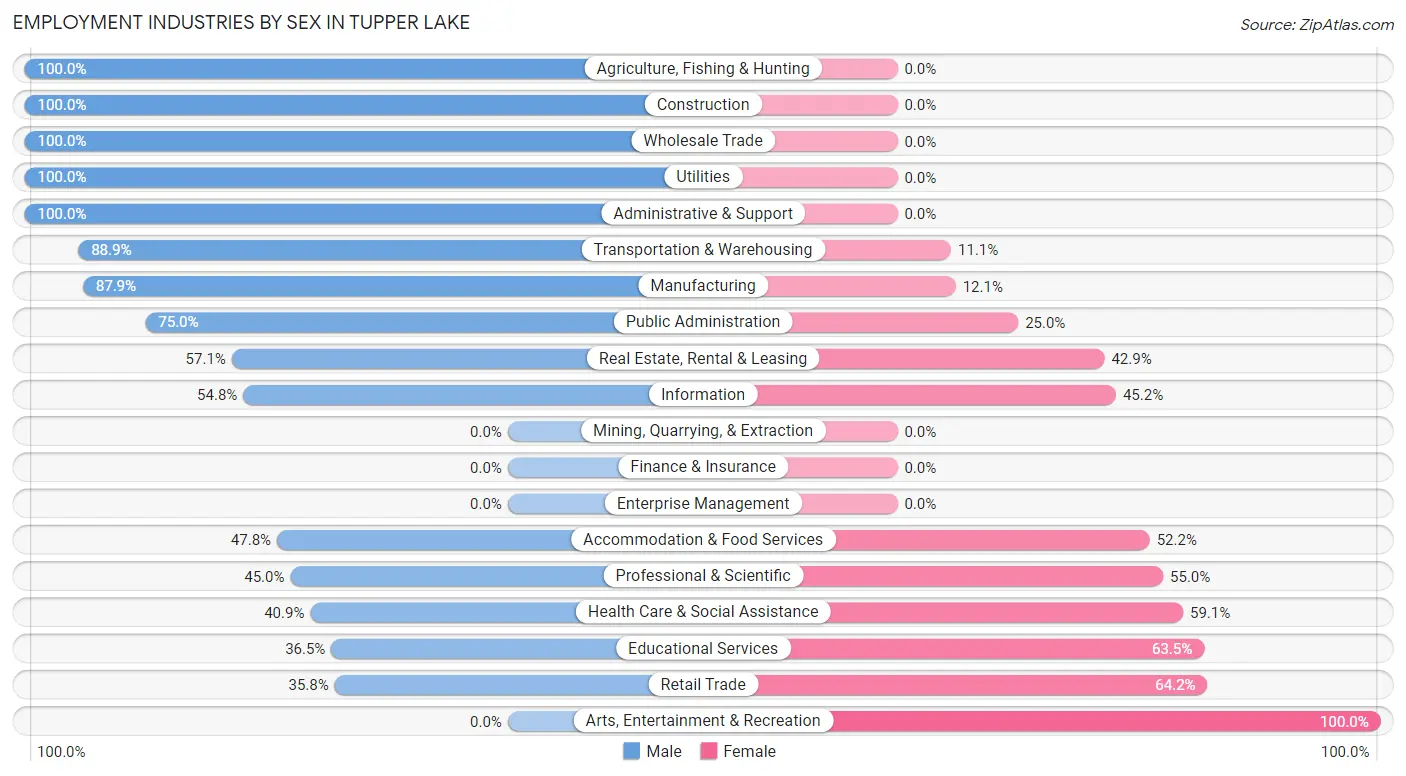
Employment Industries by Sex in Tupper Lake
The Tupper Lake industries that see more men than women are Agriculture, Fishing & Hunting (100.0%), Construction (100.0%), and Wholesale Trade (100.0%), whereas the industries that tend to have a higher number of women are Arts, Entertainment & Recreation (100.0%), Retail Trade (64.2%), and Educational Services (63.5%).
| Industry | Male | Female |
| Agriculture, Fishing & Hunting | 33 (100.0%) | 0 (0.0%) |
| Mining, Quarrying, & Extraction | 0 (0.0%) | 0 (0.0%) |
| Construction | 101 (100.0%) | 0 (0.0%) |
| Manufacturing | 51 (87.9%) | 7 (12.1%) |
| Wholesale Trade | 9 (100.0%) | 0 (0.0%) |
| Retail Trade | 81 (35.8%) | 145 (64.2%) |
| Transportation & Warehousing | 32 (88.9%) | 4 (11.1%) |
| Utilities | 17 (100.0%) | 0 (0.0%) |
| Information | 23 (54.8%) | 19 (45.2%) |
| Finance & Insurance | 0 (0.0%) | 0 (0.0%) |
| Real Estate, Rental & Leasing | 8 (57.1%) | 6 (42.9%) |
| Professional & Scientific | 9 (45.0%) | 11 (55.0%) |
| Enterprise Management | 0 (0.0%) | 0 (0.0%) |
| Administrative & Support | 19 (100.0%) | 0 (0.0%) |
| Educational Services | 19 (36.5%) | 33 (63.5%) |
| Health Care & Social Assistance | 130 (40.9%) | 188 (59.1%) |
| Arts, Entertainment & Recreation | 0 (0.0%) | 29 (100.0%) |
| Accommodation & Food Services | 43 (47.8%) | 47 (52.2%) |
| Public Administration | 138 (75.0%) | 46 (25.0%) |
| Total | 733 (55.7%) | 583 (44.3%) |
Education in Tupper Lake
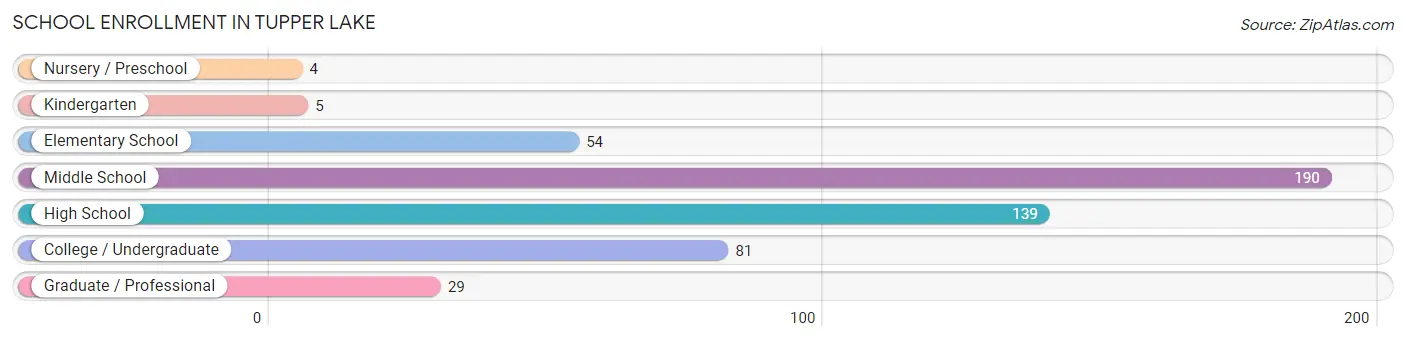
School Enrollment in Tupper Lake
The most common levels of schooling among the 502 students in Tupper Lake are middle school (190 | 37.9%), high school (139 | 27.7%), and college / undergraduate (81 | 16.1%).
| School Level | # Students | % Students |
| Nursery / Preschool | 4 | 0.8% |
| Kindergarten | 5 | 1.0% |
| Elementary School | 54 | 10.8% |
| Middle School | 190 | 37.9% |
| High School | 139 | 27.7% |
| College / Undergraduate | 81 | 16.1% |
| Graduate / Professional | 29 | 5.8% |
| Total | 502 | 100.0% |
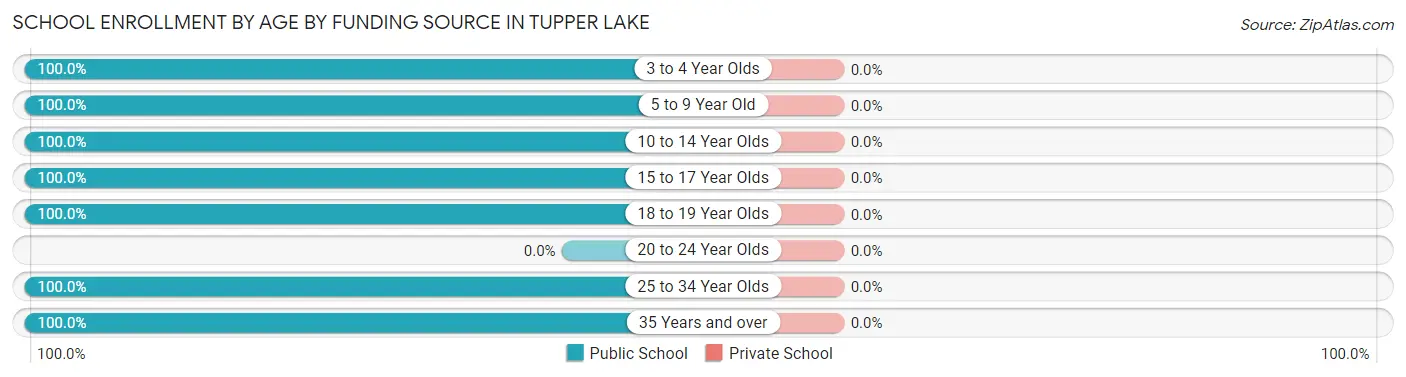
School Enrollment by Age by Funding Source in Tupper Lake
| Age Bracket | Public School | Private School |
| 3 to 4 Year Olds | 4 (100.0%) | 0 (0.0%) |
| 5 to 9 Year Old | 46 (100.0%) | 0 (0.0%) |
| 10 to 14 Year Olds | 255 (100.0%) | 0 (0.0%) |
| 15 to 17 Year Olds | 79 (100.0%) | 0 (0.0%) |
| 18 to 19 Year Olds | 8 (100.0%) | 0 (0.0%) |
| 20 to 24 Year Olds | 0 (0.0%) | 0 (0.0%) |
| 25 to 34 Year Olds | 105 (100.0%) | 0 (0.0%) |
| 35 Years and over | 5 (100.0%) | 0 (0.0%) |
| Total | 502 (100.0%) | 0 (0.0%) |
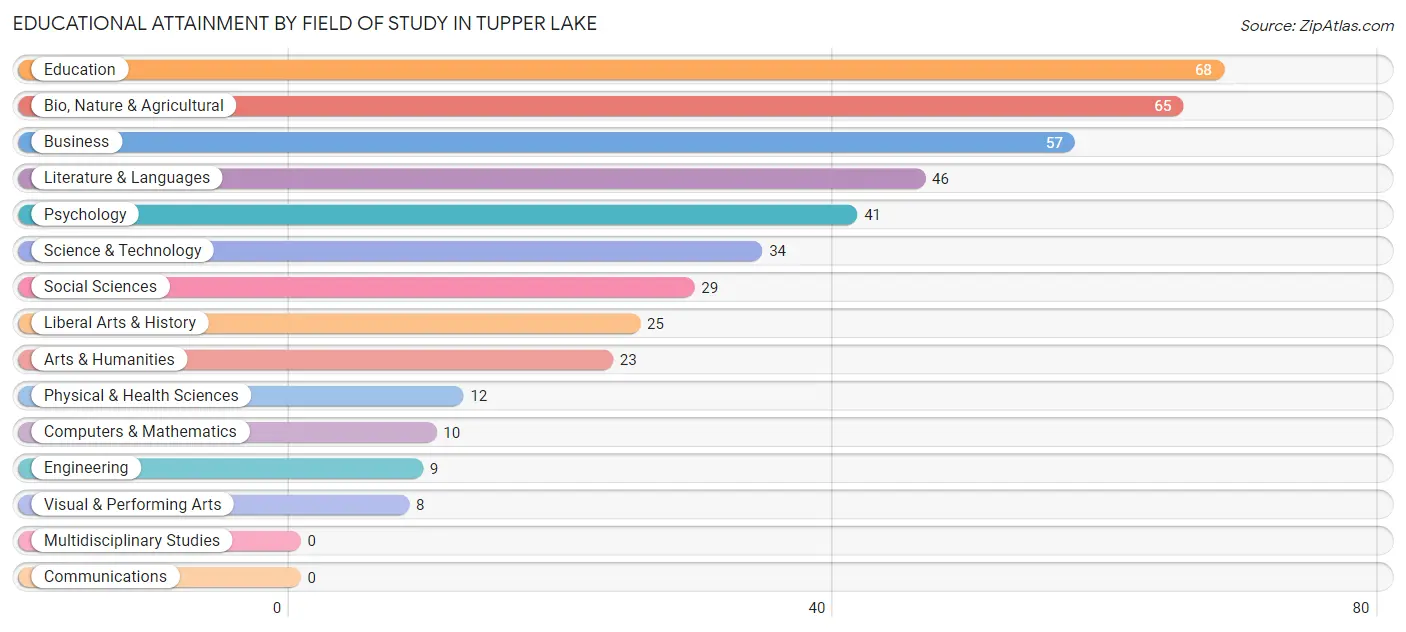
Educational Attainment by Field of Study in Tupper Lake
Education (68 | 15.9%), bio, nature & agricultural (65 | 15.2%), business (57 | 13.4%), literature & languages (46 | 10.8%), and psychology (41 | 9.6%) are the most common fields of study among 427 individuals in Tupper Lake who have obtained a bachelor's degree or higher.
| Field of Study | # Graduates | % Graduates |
| Computers & Mathematics | 10 | 2.3% |
| Bio, Nature & Agricultural | 65 | 15.2% |
| Physical & Health Sciences | 12 | 2.8% |
| Psychology | 41 | 9.6% |
| Social Sciences | 29 | 6.8% |
| Engineering | 9 | 2.1% |
| Multidisciplinary Studies | 0 | 0.0% |
| Science & Technology | 34 | 8.0% |
| Business | 57 | 13.4% |
| Education | 68 | 15.9% |
| Literature & Languages | 46 | 10.8% |
| Liberal Arts & History | 25 | 5.9% |
| Visual & Performing Arts | 8 | 1.9% |
| Communications | 0 | 0.0% |
| Arts & Humanities | 23 | 5.4% |
| Total | 427 | 100.0% |
Transportation & Commute in Tupper Lake
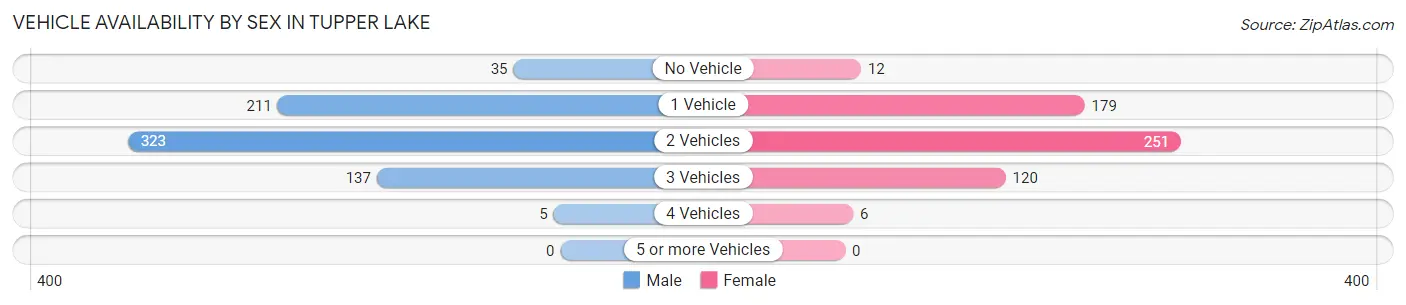
Vehicle Availability by Sex in Tupper Lake
The most prevalent vehicle ownership categories in Tupper Lake are males with 2 vehicles (323, accounting for 45.4%) and females with 2 vehicles (251, making up 56.9%).
| Vehicles Available | Male | Female |
| No Vehicle | 35 (4.9%) | 12 (2.1%) |
| 1 Vehicle | 211 (29.7%) | 179 (31.5%) |
| 2 Vehicles | 323 (45.4%) | 251 (44.2%) |
| 3 Vehicles | 137 (19.3%) | 120 (21.1%) |
| 4 Vehicles | 5 (0.7%) | 6 (1.1%) |
| 5 or more Vehicles | 0 (0.0%) | 0 (0.0%) |
| Total | 711 (100.0%) | 568 (100.0%) |
Commute Time in Tupper Lake
The most frequently occuring commute durations in Tupper Lake are 5 to 9 minutes (537 commuters, 44.9%), 10 to 14 minutes (160 commuters, 13.4%), and less than 5 minutes (139 commuters, 11.6%).
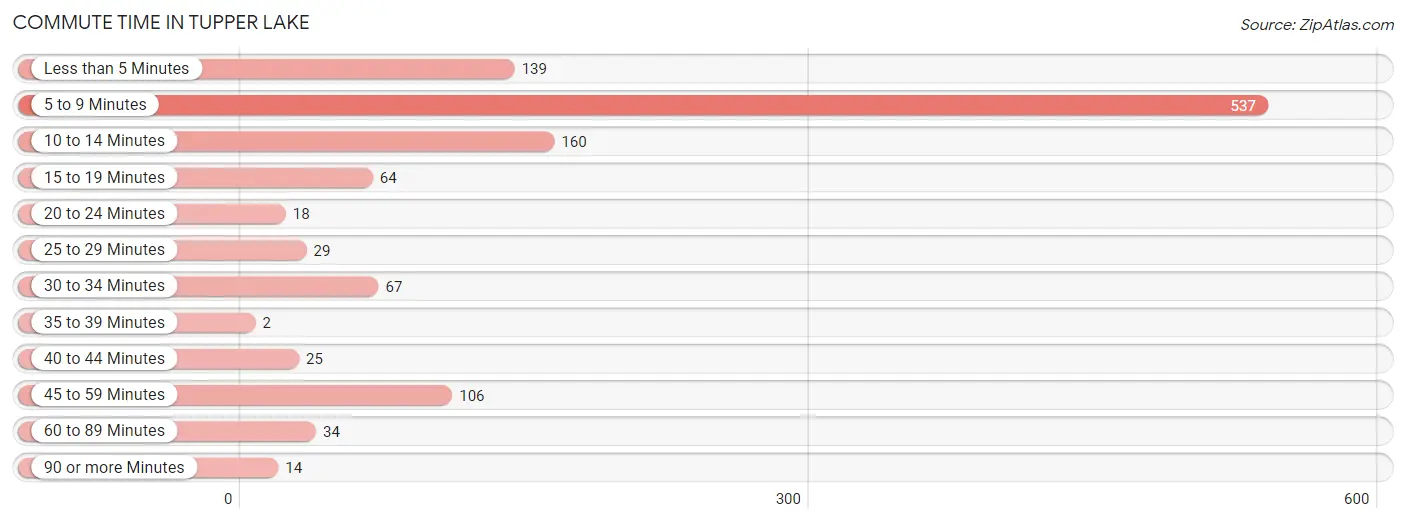
| Commute Time | # Commuters | % Commuters |
| Less than 5 Minutes | 139 | 11.6% |
| 5 to 9 Minutes | 537 | 44.9% |
| 10 to 14 Minutes | 160 | 13.4% |
| 15 to 19 Minutes | 64 | 5.4% |
| 20 to 24 Minutes | 18 | 1.5% |
| 25 to 29 Minutes | 29 | 2.4% |
| 30 to 34 Minutes | 67 | 5.6% |
| 35 to 39 Minutes | 2 | 0.2% |
| 40 to 44 Minutes | 25 | 2.1% |
| 45 to 59 Minutes | 106 | 8.9% |
| 60 to 89 Minutes | 34 | 2.9% |
| 90 or more Minutes | 14 | 1.2% |
Commute Time by Sex in Tupper Lake
The most common commute times in Tupper Lake are 5 to 9 minutes (295 commuters, 42.1%) for males and 5 to 9 minutes (242 commuters, 49.0%) for females.
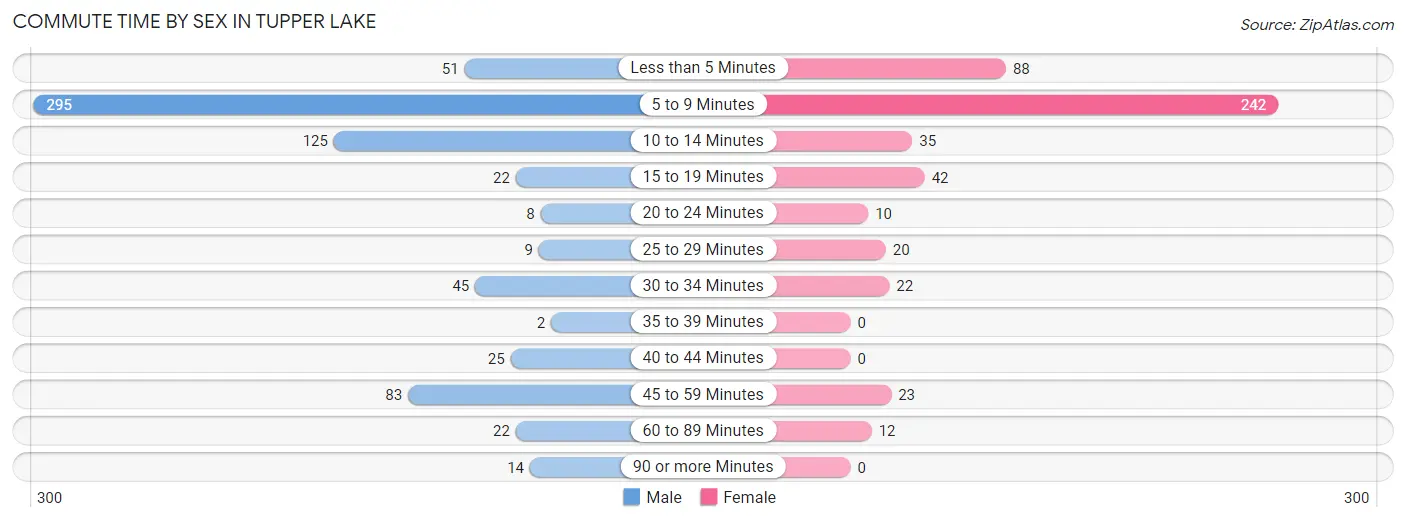
| Commute Time | Male | Female |
| Less than 5 Minutes | 51 (7.3%) | 88 (17.8%) |
| 5 to 9 Minutes | 295 (42.1%) | 242 (49.0%) |
| 10 to 14 Minutes | 125 (17.8%) | 35 (7.1%) |
| 15 to 19 Minutes | 22 (3.1%) | 42 (8.5%) |
| 20 to 24 Minutes | 8 (1.1%) | 10 (2.0%) |
| 25 to 29 Minutes | 9 (1.3%) | 20 (4.1%) |
| 30 to 34 Minutes | 45 (6.4%) | 22 (4.4%) |
| 35 to 39 Minutes | 2 (0.3%) | 0 (0.0%) |
| 40 to 44 Minutes | 25 (3.6%) | 0 (0.0%) |
| 45 to 59 Minutes | 83 (11.8%) | 23 (4.7%) |
| 60 to 89 Minutes | 22 (3.1%) | 12 (2.4%) |
| 90 or more Minutes | 14 (2.0%) | 0 (0.0%) |
Time of Departure to Work by Sex in Tupper Lake
The most frequent times of departure to work in Tupper Lake are 7:00 AM to 7:29 AM (249, 35.5%) for males and 7:30 AM to 7:59 AM (152, 30.8%) for females.
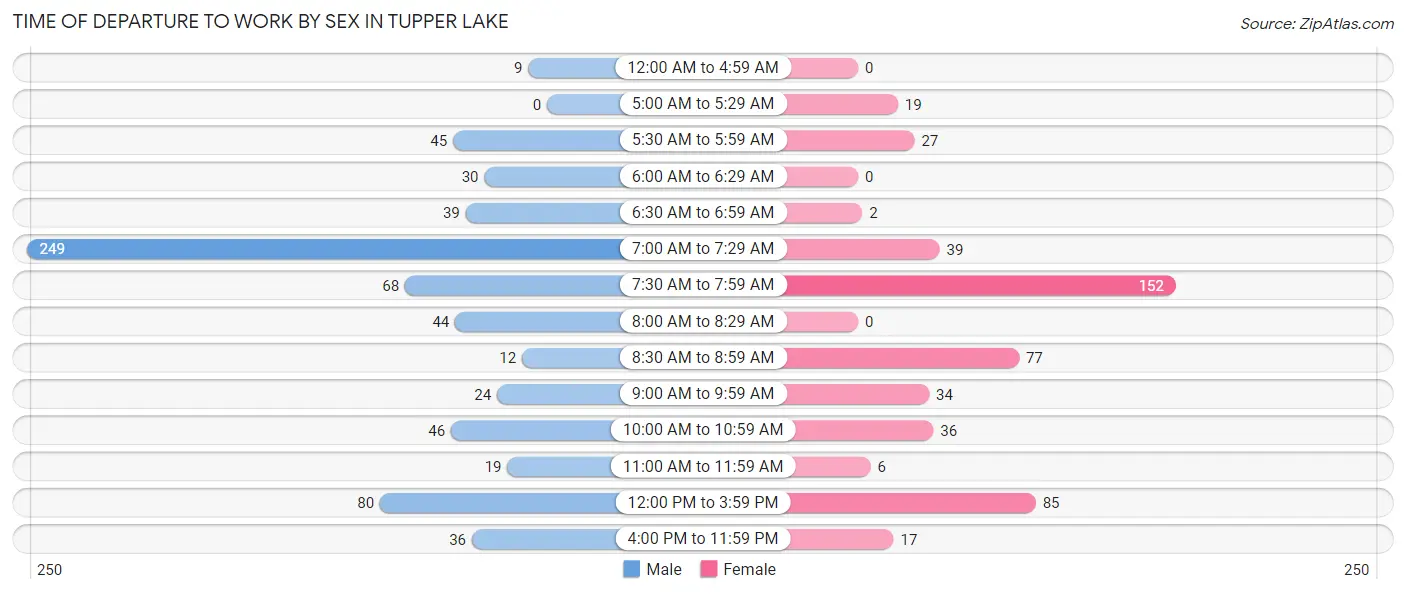
| Time of Departure | Male | Female |
| 12:00 AM to 4:59 AM | 9 (1.3%) | 0 (0.0%) |
| 5:00 AM to 5:29 AM | 0 (0.0%) | 19 (3.8%) |
| 5:30 AM to 5:59 AM | 45 (6.4%) | 27 (5.5%) |
| 6:00 AM to 6:29 AM | 30 (4.3%) | 0 (0.0%) |
| 6:30 AM to 6:59 AM | 39 (5.6%) | 2 (0.4%) |
| 7:00 AM to 7:29 AM | 249 (35.5%) | 39 (7.9%) |
| 7:30 AM to 7:59 AM | 68 (9.7%) | 152 (30.8%) |
| 8:00 AM to 8:29 AM | 44 (6.3%) | 0 (0.0%) |
| 8:30 AM to 8:59 AM | 12 (1.7%) | 77 (15.6%) |
| 9:00 AM to 9:59 AM | 24 (3.4%) | 34 (6.9%) |
| 10:00 AM to 10:59 AM | 46 (6.6%) | 36 (7.3%) |
| 11:00 AM to 11:59 AM | 19 (2.7%) | 6 (1.2%) |
| 12:00 PM to 3:59 PM | 80 (11.4%) | 85 (17.2%) |
| 4:00 PM to 11:59 PM | 36 (5.1%) | 17 (3.4%) |
| Total | 701 (100.0%) | 494 (100.0%) |
Housing Occupancy in Tupper Lake
Occupancy by Ownership in Tupper Lake
Of the total 1,499 dwellings in Tupper Lake, owner-occupied units account for 977 (65.2%), while renter-occupied units make up 522 (34.8%).
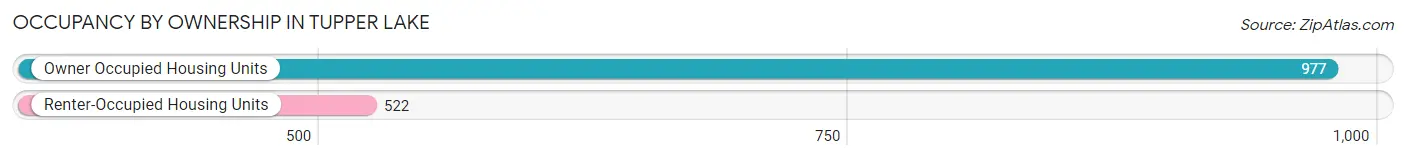
| Occupancy | # Housing Units | % Housing Units |
| Owner Occupied Housing Units | 977 | 65.2% |
| Renter-Occupied Housing Units | 522 | 34.8% |
| Total Occupied Housing Units | 1,499 | 100.0% |
Occupancy by Household Size in Tupper Lake
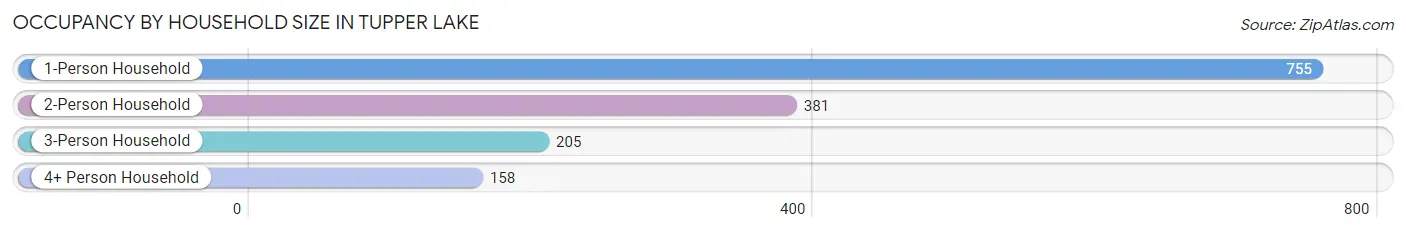
| Household Size | # Housing Units | % Housing Units |
| 1-Person Household | 755 | 50.4% |
| 2-Person Household | 381 | 25.4% |
| 3-Person Household | 205 | 13.7% |
| 4+ Person Household | 158 | 10.5% |
| Total Housing Units | 1,499 | 100.0% |
Occupancy by Ownership by Household Size in Tupper Lake
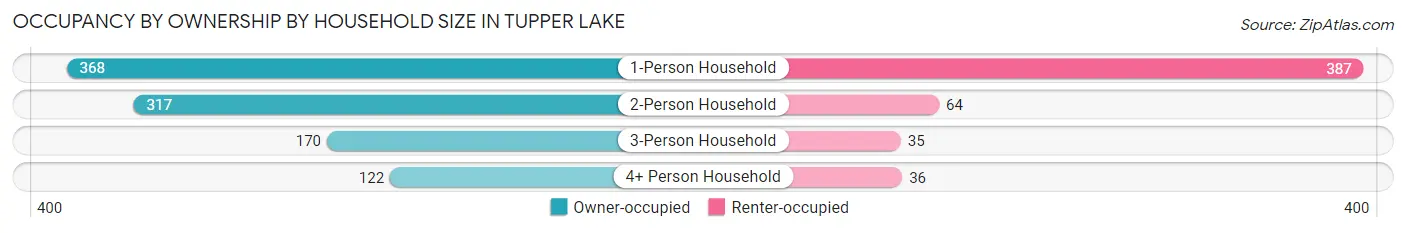
| Household Size | Owner-occupied | Renter-occupied |
| 1-Person Household | 368 (48.7%) | 387 (51.3%) |
| 2-Person Household | 317 (83.2%) | 64 (16.8%) |
| 3-Person Household | 170 (82.9%) | 35 (17.1%) |
| 4+ Person Household | 122 (77.2%) | 36 (22.8%) |
| Total Housing Units | 977 (65.2%) | 522 (34.8%) |
Occupancy by Educational Attainment in Tupper Lake
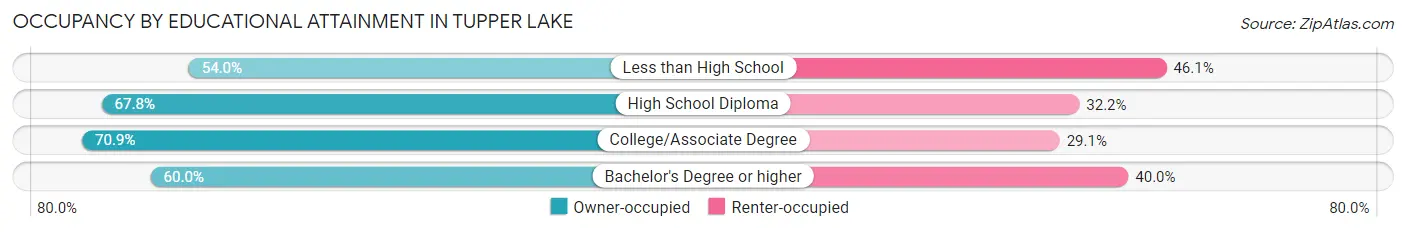
| Household Size | Owner-occupied | Renter-occupied |
| Less than High School | 116 (53.9%) | 99 (46.1%) |
| High School Diploma | 347 (67.8%) | 165 (32.2%) |
| College/Associate Degree | 331 (70.9%) | 136 (29.1%) |
| Bachelor's Degree or higher | 183 (60.0%) | 122 (40.0%) |
Occupancy by Age of Householder in Tupper Lake
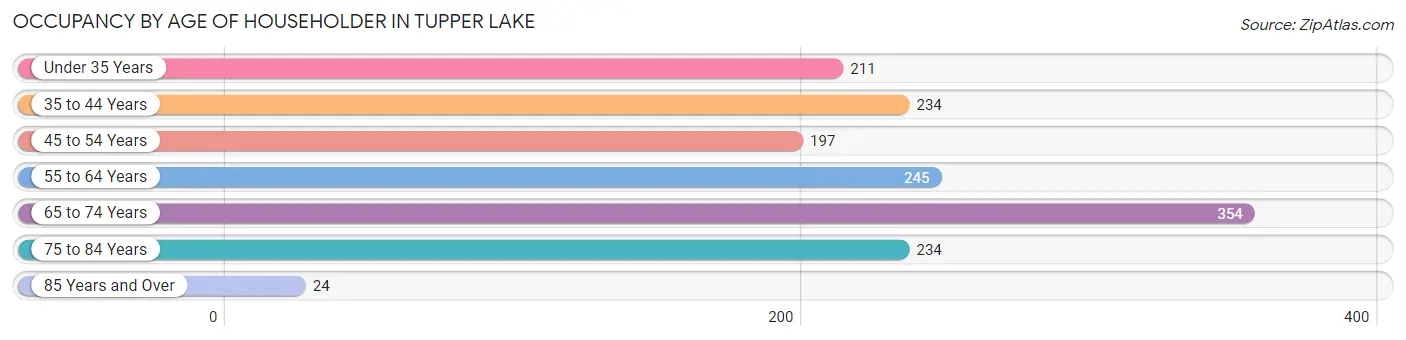
| Age Bracket | # Households | % Households |
| Under 35 Years | 211 | 14.1% |
| 35 to 44 Years | 234 | 15.6% |
| 45 to 54 Years | 197 | 13.1% |
| 55 to 64 Years | 245 | 16.3% |
| 65 to 74 Years | 354 | 23.6% |
| 75 to 84 Years | 234 | 15.6% |
| 85 Years and Over | 24 | 1.6% |
| Total | 1,499 | 100.0% |
Housing Finances in Tupper Lake
Median Income by Occupancy in Tupper Lake
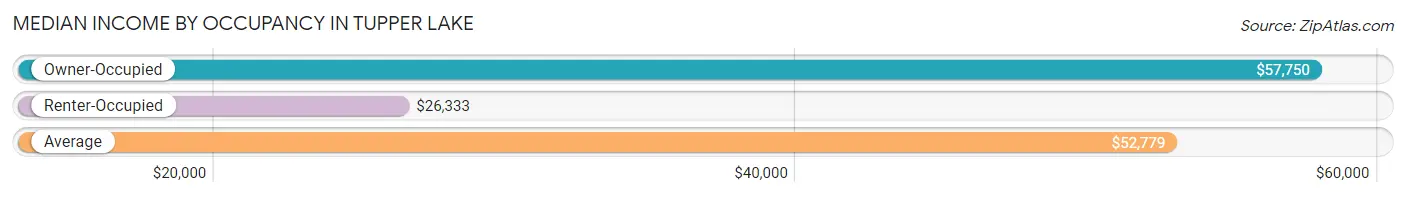
| Occupancy Type | # Households | Median Income |
| Owner-Occupied | 977 (65.2%) | $57,750 |
| Renter-Occupied | 522 (34.8%) | $26,333 |
| Average | 1,499 (100.0%) | $52,779 |
Occupancy by Householder Income Bracket in Tupper Lake
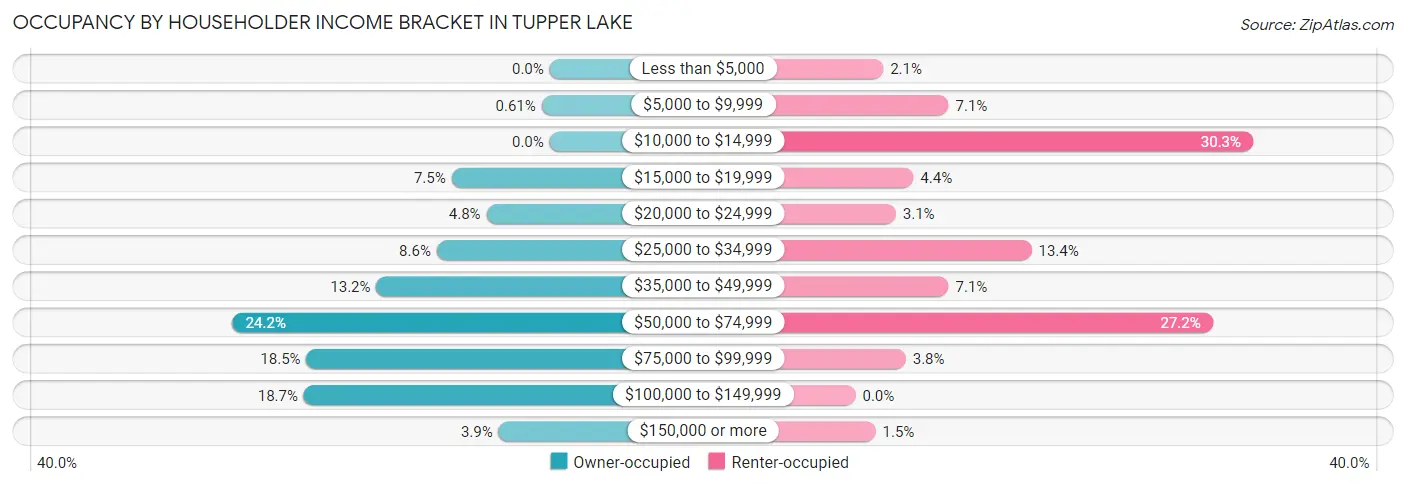
| Income Bracket | Owner-occupied | Renter-occupied |
| Less than $5,000 | 0 (0.0%) | 11 (2.1%) |
| $5,000 to $9,999 | 6 (0.6%) | 37 (7.1%) |
| $10,000 to $14,999 | 0 (0.0%) | 158 (30.3%) |
| $15,000 to $19,999 | 73 (7.5%) | 23 (4.4%) |
| $20,000 to $24,999 | 47 (4.8%) | 16 (3.1%) |
| $25,000 to $34,999 | 84 (8.6%) | 70 (13.4%) |
| $35,000 to $49,999 | 129 (13.2%) | 37 (7.1%) |
| $50,000 to $74,999 | 236 (24.2%) | 142 (27.2%) |
| $75,000 to $99,999 | 181 (18.5%) | 20 (3.8%) |
| $100,000 to $149,999 | 183 (18.7%) | 0 (0.0%) |
| $150,000 or more | 38 (3.9%) | 8 (1.5%) |
| Total | 977 (100.0%) | 522 (100.0%) |
Monthly Housing Cost Tiers in Tupper Lake
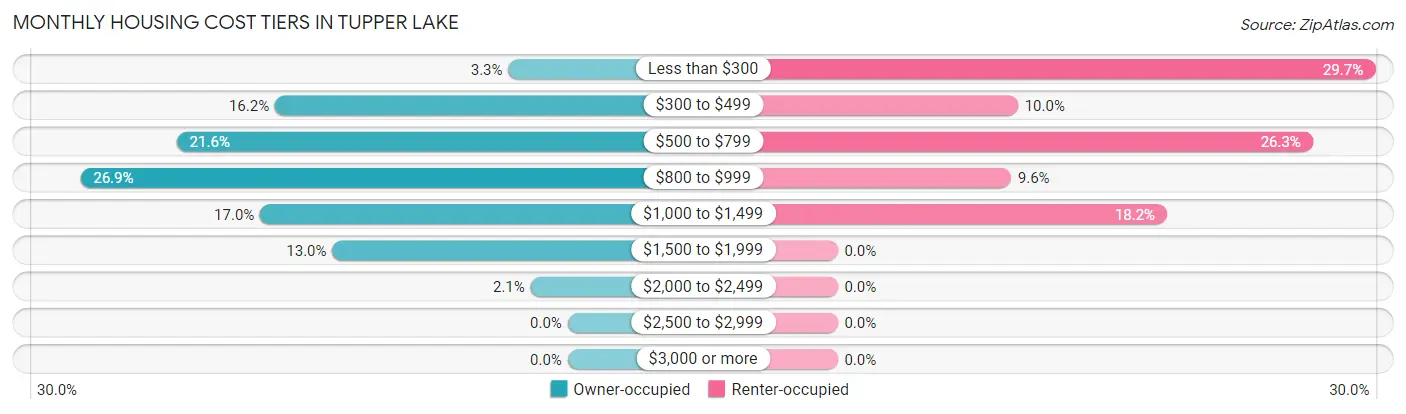
| Monthly Cost | Owner-occupied | Renter-occupied |
| Less than $300 | 32 (3.3%) | 155 (29.7%) |
| $300 to $499 | 158 (16.2%) | 52 (10.0%) |
| $500 to $799 | 211 (21.6%) | 137 (26.3%) |
| $800 to $999 | 263 (26.9%) | 50 (9.6%) |
| $1,000 to $1,499 | 166 (17.0%) | 95 (18.2%) |
| $1,500 to $1,999 | 127 (13.0%) | 0 (0.0%) |
| $2,000 to $2,499 | 20 (2.1%) | 0 (0.0%) |
| $2,500 to $2,999 | 0 (0.0%) | 0 (0.0%) |
| $3,000 or more | 0 (0.0%) | 0 (0.0%) |
| Total | 977 (100.0%) | 522 (100.0%) |
Physical Housing Characteristics in Tupper Lake
Housing Structures in Tupper Lake
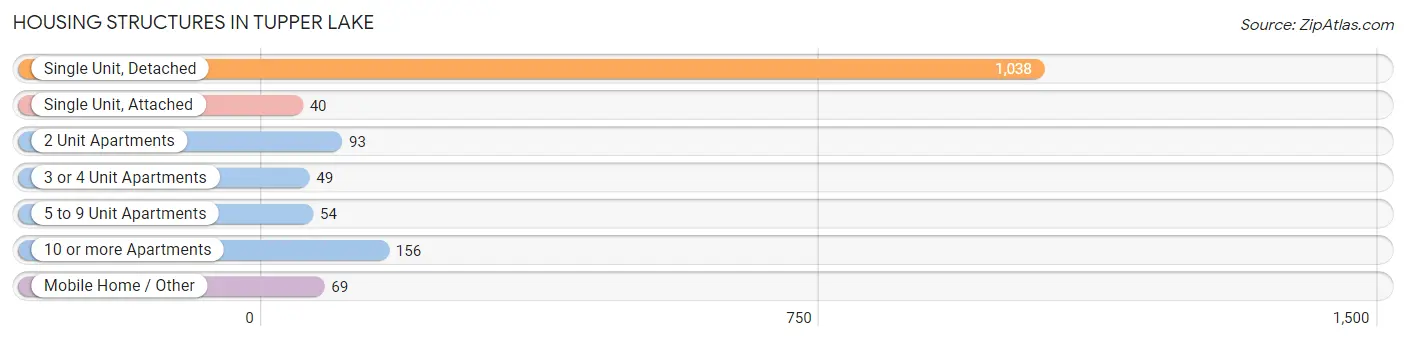
| Structure Type | # Housing Units | % Housing Units |
| Single Unit, Detached | 1,038 | 69.3% |
| Single Unit, Attached | 40 | 2.7% |
| 2 Unit Apartments | 93 | 6.2% |
| 3 or 4 Unit Apartments | 49 | 3.3% |
| 5 to 9 Unit Apartments | 54 | 3.6% |
| 10 or more Apartments | 156 | 10.4% |
| Mobile Home / Other | 69 | 4.6% |
| Total | 1,499 | 100.0% |
Housing Structures by Occupancy in Tupper Lake
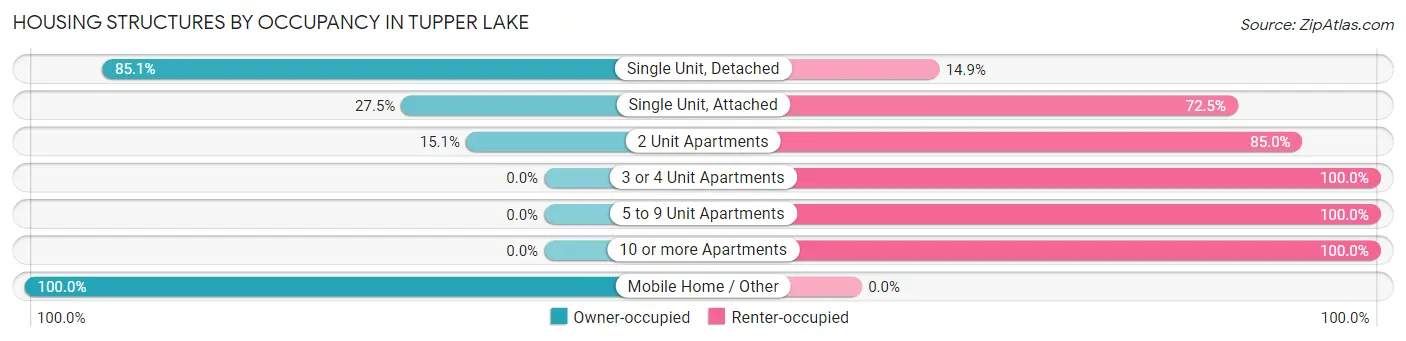
| Structure Type | Owner-occupied | Renter-occupied |
| Single Unit, Detached | 883 (85.1%) | 155 (14.9%) |
| Single Unit, Attached | 11 (27.5%) | 29 (72.5%) |
| 2 Unit Apartments | 14 (15.0%) | 79 (85.0%) |
| 3 or 4 Unit Apartments | 0 (0.0%) | 49 (100.0%) |
| 5 to 9 Unit Apartments | 0 (0.0%) | 54 (100.0%) |
| 10 or more Apartments | 0 (0.0%) | 156 (100.0%) |
| Mobile Home / Other | 69 (100.0%) | 0 (0.0%) |
| Total | 977 (65.2%) | 522 (34.8%) |
Housing Structures by Number of Rooms in Tupper Lake
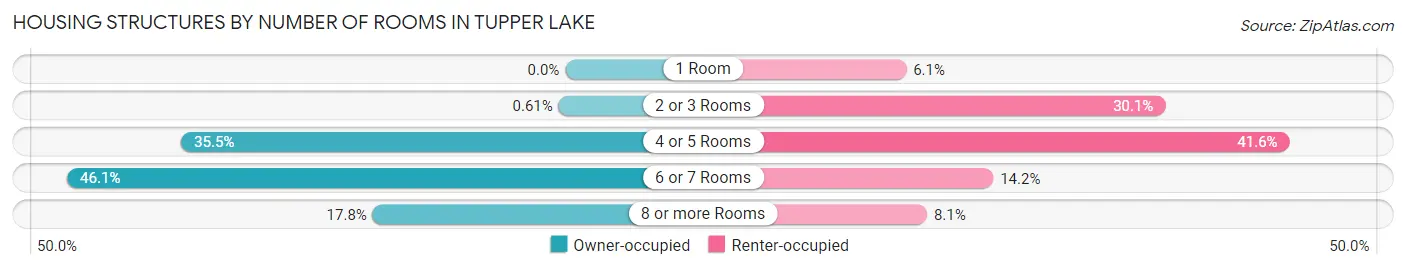
| Number of Rooms | Owner-occupied | Renter-occupied |
| 1 Room | 0 (0.0%) | 32 (6.1%) |
| 2 or 3 Rooms | 6 (0.6%) | 157 (30.1%) |
| 4 or 5 Rooms | 347 (35.5%) | 217 (41.6%) |
| 6 or 7 Rooms | 450 (46.1%) | 74 (14.2%) |
| 8 or more Rooms | 174 (17.8%) | 42 (8.1%) |
| Total | 977 (100.0%) | 522 (100.0%) |
Housing Structure by Heating Type in Tupper Lake
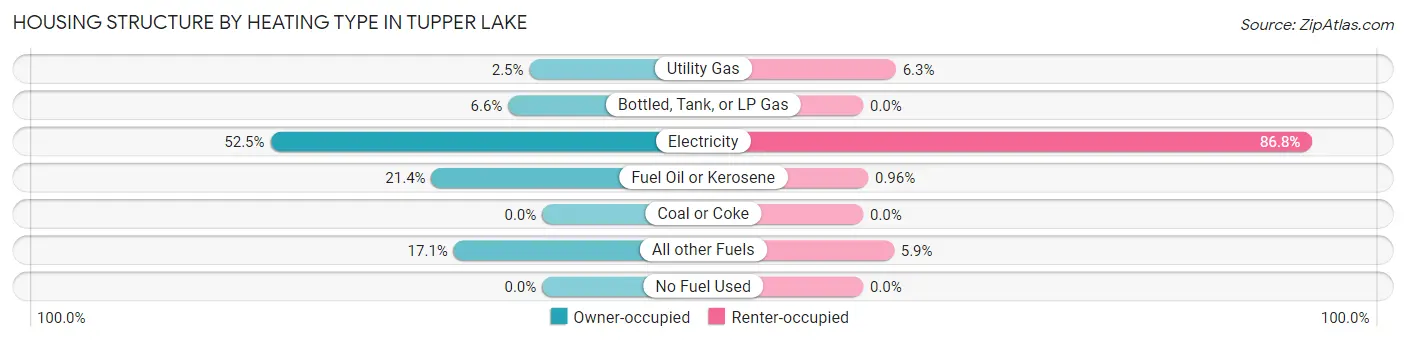
| Heating Type | Owner-occupied | Renter-occupied |
| Utility Gas | 24 (2.5%) | 33 (6.3%) |
| Bottled, Tank, or LP Gas | 64 (6.6%) | 0 (0.0%) |
| Electricity | 513 (52.5%) | 453 (86.8%) |
| Fuel Oil or Kerosene | 209 (21.4%) | 5 (1.0%) |
| Coal or Coke | 0 (0.0%) | 0 (0.0%) |
| All other Fuels | 167 (17.1%) | 31 (5.9%) |
| No Fuel Used | 0 (0.0%) | 0 (0.0%) |
| Total | 977 (100.0%) | 522 (100.0%) |
Household Vehicle Usage in Tupper Lake
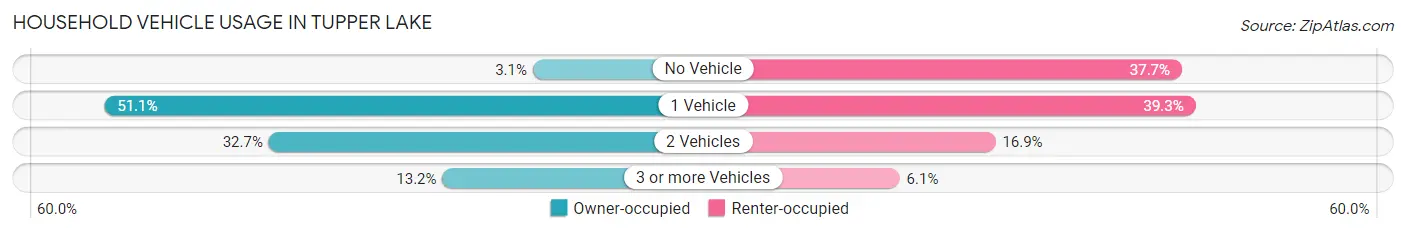
| Vehicles per Household | Owner-occupied | Renter-occupied |
| No Vehicle | 30 (3.1%) | 197 (37.7%) |
| 1 Vehicle | 499 (51.1%) | 205 (39.3%) |
| 2 Vehicles | 319 (32.7%) | 88 (16.9%) |
| 3 or more Vehicles | 129 (13.2%) | 32 (6.1%) |
| Total | 977 (100.0%) | 522 (100.0%) |
Real Estate & Mortgages in Tupper Lake
Real Estate and Mortgage Overview in Tupper Lake
| Characteristic | Without Mortgage | With Mortgage |
| Housing Units | 417 | 560 |
| Median Property Value | $96,200 | $95,900 |
| Median Household Income | $51,161 | $19 |
| Monthly Housing Costs | $518 | $0 |
| Real Estate Taxes | $2,854 | $11 |
Property Value by Mortgage Status in Tupper Lake
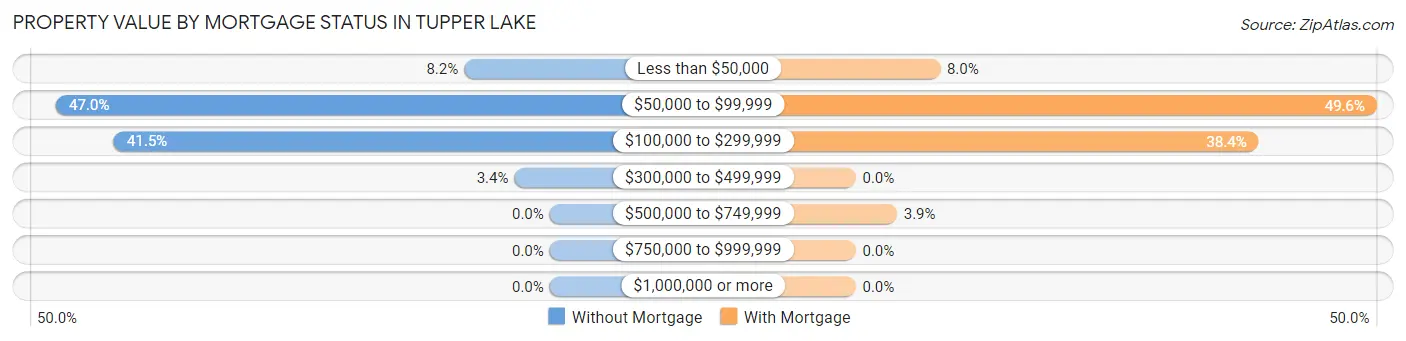
| Property Value | Without Mortgage | With Mortgage |
| Less than $50,000 | 34 (8.2%) | 45 (8.0%) |
| $50,000 to $99,999 | 196 (47.0%) | 278 (49.6%) |
| $100,000 to $299,999 | 173 (41.5%) | 215 (38.4%) |
| $300,000 to $499,999 | 14 (3.4%) | 0 (0.0%) |
| $500,000 to $749,999 | 0 (0.0%) | 22 (3.9%) |
| $750,000 to $999,999 | 0 (0.0%) | 0 (0.0%) |
| $1,000,000 or more | 0 (0.0%) | 0 (0.0%) |
| Total | 417 (100.0%) | 560 (100.0%) |
Household Income by Mortgage Status in Tupper Lake
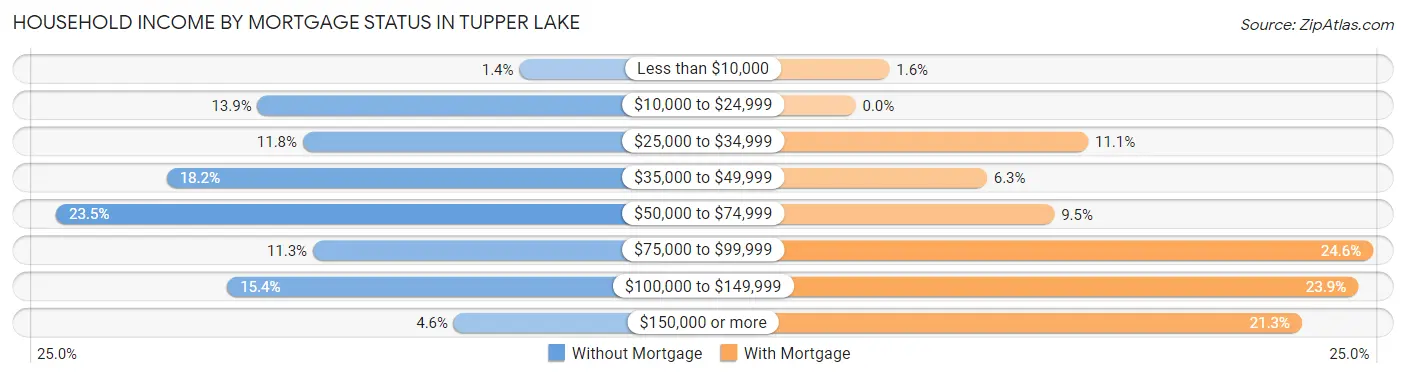
| Household Income | Without Mortgage | With Mortgage |
| Less than $10,000 | 6 (1.4%) | 9 (1.6%) |
| $10,000 to $24,999 | 58 (13.9%) | 0 (0.0%) |
| $25,000 to $34,999 | 49 (11.7%) | 62 (11.1%) |
| $35,000 to $49,999 | 76 (18.2%) | 35 (6.2%) |
| $50,000 to $74,999 | 98 (23.5%) | 53 (9.5%) |
| $75,000 to $99,999 | 47 (11.3%) | 138 (24.6%) |
| $100,000 to $149,999 | 64 (15.3%) | 134 (23.9%) |
| $150,000 or more | 19 (4.6%) | 119 (21.2%) |
| Total | 417 (100.0%) | 560 (100.0%) |
Property Value to Household Income Ratio in Tupper Lake
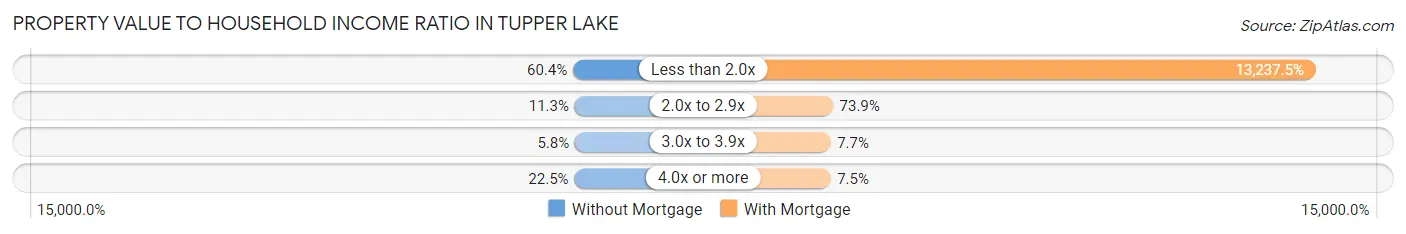
| Value-to-Income Ratio | Without Mortgage | With Mortgage |
| Less than 2.0x | 252 (60.4%) | 74,130 (13,237.5%) |
| 2.0x to 2.9x | 47 (11.3%) | 414 (73.9%) |
| 3.0x to 3.9x | 24 (5.8%) | 43 (7.7%) |
| 4.0x or more | 94 (22.5%) | 42 (7.5%) |
| Total | 417 (100.0%) | 560 (100.0%) |
Real Estate Taxes by Mortgage Status in Tupper Lake
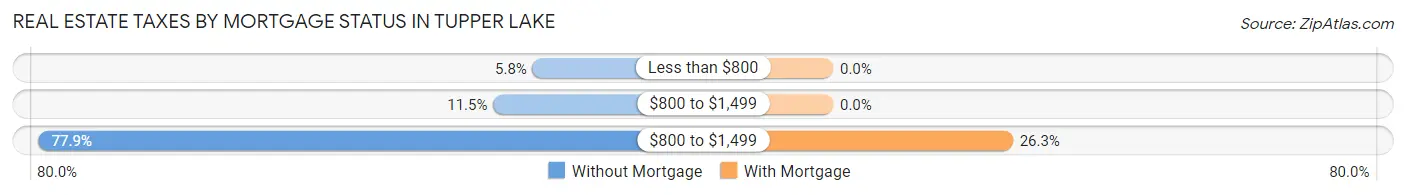
| Property Taxes | Without Mortgage | With Mortgage |
| Less than $800 | 24 (5.8%) | 0 (0.0%) |
| $800 to $1,499 | 48 (11.5%) | 0 (0.0%) |
| $800 to $1,499 | 325 (77.9%) | 147 (26.3%) |
| Total | 417 (100.0%) | 560 (100.0%) |
Health & Disability in Tupper Lake
Health Insurance Coverage by Age in Tupper Lake
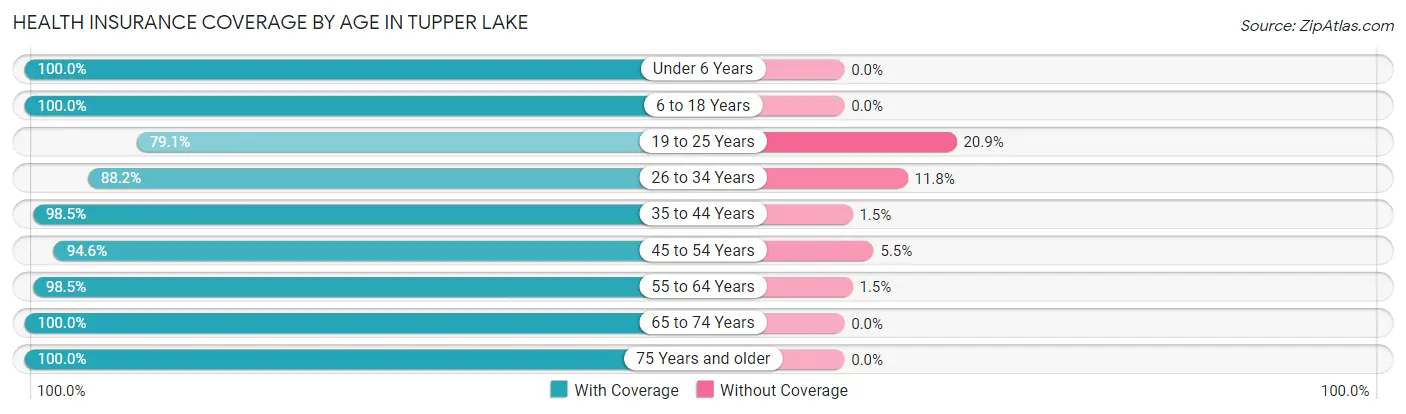
| Age Bracket | With Coverage | Without Coverage |
| Under 6 Years | 76 (100.0%) | 0 (0.0%) |
| 6 to 18 Years | 411 (100.0%) | 0 (0.0%) |
| 19 to 25 Years | 121 (79.1%) | 32 (20.9%) |
| 26 to 34 Years | 284 (88.2%) | 38 (11.8%) |
| 35 to 44 Years | 388 (98.5%) | 6 (1.5%) |
| 45 to 54 Years | 312 (94.6%) | 18 (5.4%) |
| 55 to 64 Years | 387 (98.5%) | 6 (1.5%) |
| 65 to 74 Years | 438 (100.0%) | 0 (0.0%) |
| 75 Years and older | 287 (100.0%) | 0 (0.0%) |
| Total | 2,704 (96.4%) | 100 (3.6%) |
Health Insurance Coverage by Citizenship Status in Tupper Lake
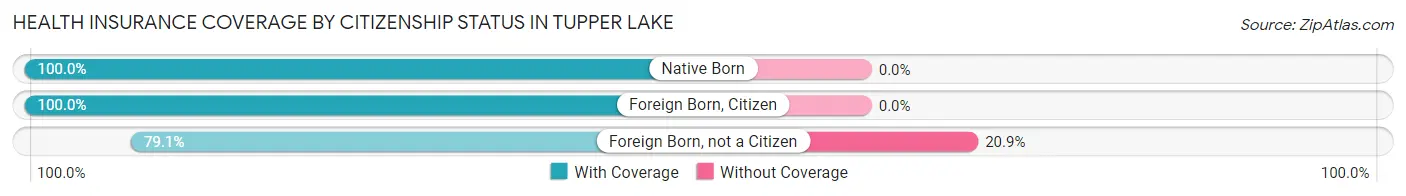
| Citizenship Status | With Coverage | Without Coverage |
| Native Born | 76 (100.0%) | 0 (0.0%) |
| Foreign Born, Citizen | 411 (100.0%) | 0 (0.0%) |
| Foreign Born, not a Citizen | 121 (79.1%) | 32 (20.9%) |
Health Insurance Coverage by Household Income in Tupper Lake
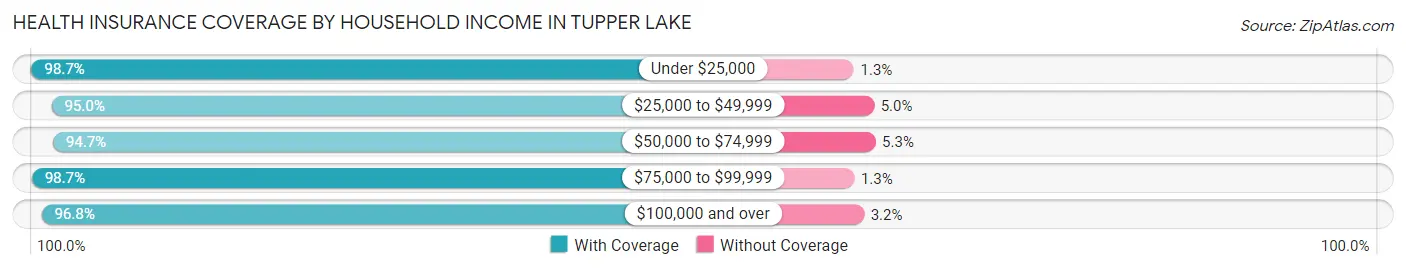
| Household Income | With Coverage | Without Coverage |
| Under $25,000 | 385 (98.7%) | 5 (1.3%) |
| $25,000 to $49,999 | 471 (95.0%) | 25 (5.0%) |
| $50,000 to $74,999 | 802 (94.7%) | 45 (5.3%) |
| $75,000 to $99,999 | 443 (98.7%) | 6 (1.3%) |
| $100,000 and over | 580 (96.8%) | 19 (3.2%) |
Public vs Private Health Insurance Coverage by Age in Tupper Lake
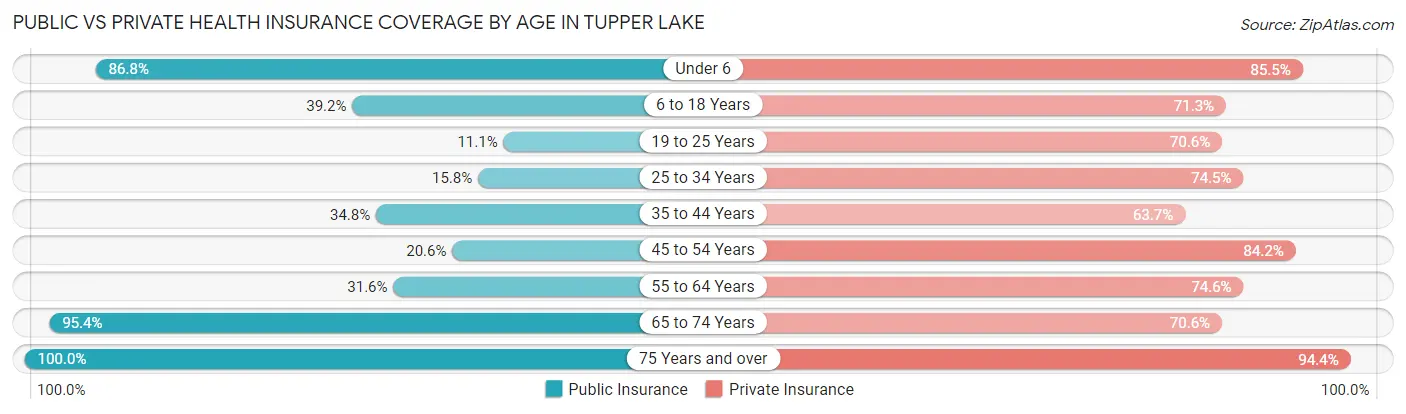
| Age Bracket | Public Insurance | Private Insurance |
| Under 6 | 66 (86.8%) | 65 (85.5%) |
| 6 to 18 Years | 161 (39.2%) | 293 (71.3%) |
| 19 to 25 Years | 17 (11.1%) | 108 (70.6%) |
| 25 to 34 Years | 51 (15.8%) | 240 (74.5%) |
| 35 to 44 Years | 137 (34.8%) | 251 (63.7%) |
| 45 to 54 Years | 68 (20.6%) | 278 (84.2%) |
| 55 to 64 Years | 124 (31.6%) | 293 (74.6%) |
| 65 to 74 Years | 418 (95.4%) | 309 (70.6%) |
| 75 Years and over | 287 (100.0%) | 271 (94.4%) |
| Total | 1,329 (47.4%) | 2,108 (75.2%) |
Disability Status by Sex by Age in Tupper Lake
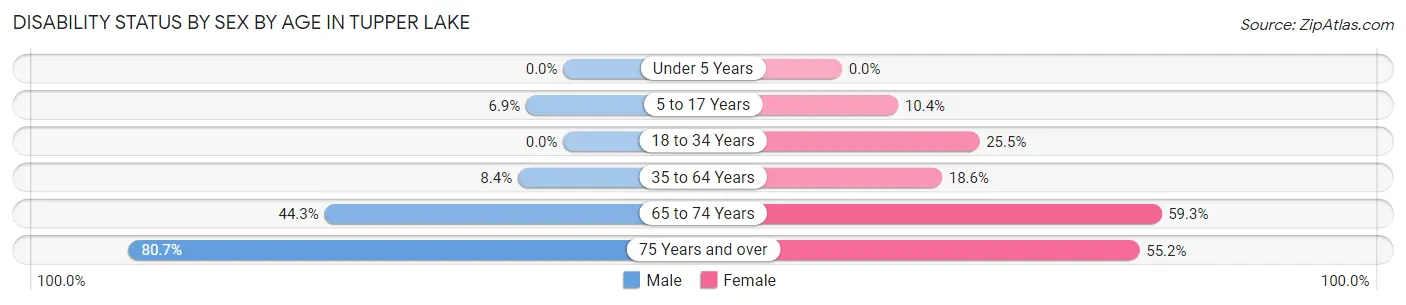
| Age Bracket | Male | Female |
| Under 5 Years | 0 (0.0%) | 0 (0.0%) |
| 5 to 17 Years | 13 (6.9%) | 20 (10.4%) |
| 18 to 34 Years | 0 (0.0%) | 63 (25.5%) |
| 35 to 64 Years | 46 (8.4%) | 106 (18.6%) |
| 65 to 74 Years | 82 (44.3%) | 150 (59.3%) |
| 75 Years and over | 46 (80.7%) | 127 (55.2%) |
Disability Class by Sex by Age in Tupper Lake
Disability Class: Hearing Difficulty
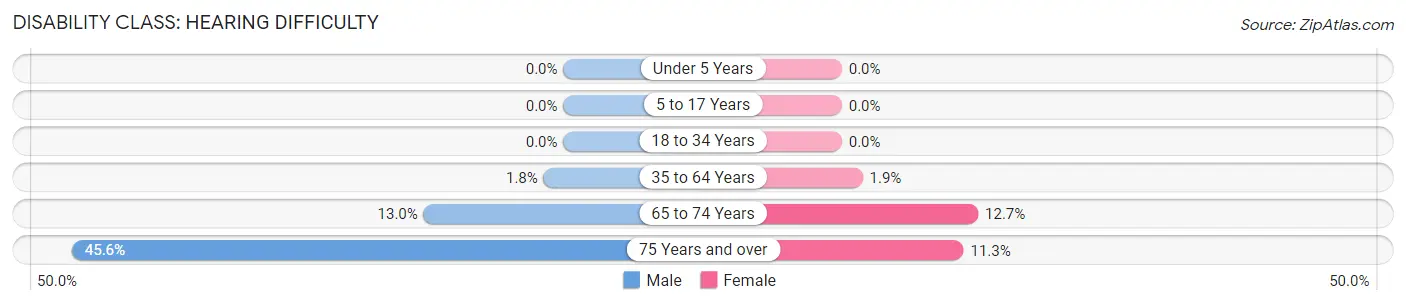
| Age Bracket | Male | Female |
| Under 5 Years | 0 (0.0%) | 0 (0.0%) |
| 5 to 17 Years | 0 (0.0%) | 0 (0.0%) |
| 18 to 34 Years | 0 (0.0%) | 0 (0.0%) |
| 35 to 64 Years | 10 (1.8%) | 11 (1.9%) |
| 65 to 74 Years | 24 (13.0%) | 32 (12.7%) |
| 75 Years and over | 26 (45.6%) | 26 (11.3%) |
Disability Class: Vision Difficulty
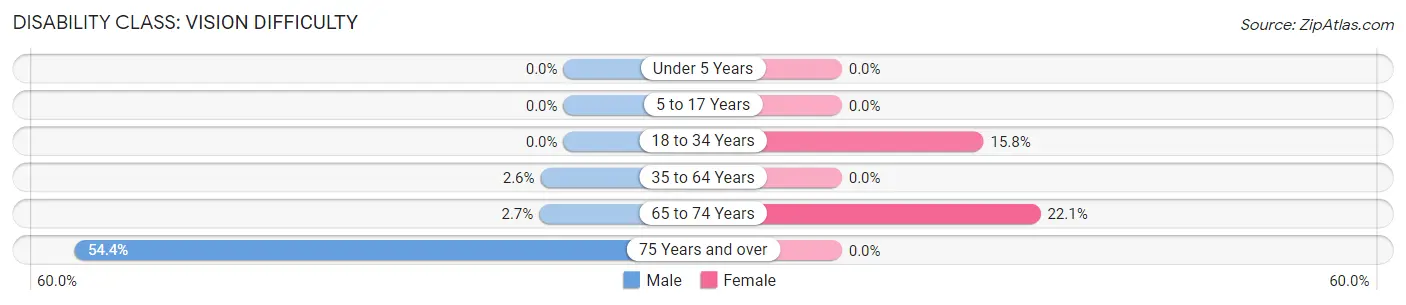
| Age Bracket | Male | Female |
| Under 5 Years | 0 (0.0%) | 0 (0.0%) |
| 5 to 17 Years | 0 (0.0%) | 0 (0.0%) |
| 18 to 34 Years | 0 (0.0%) | 39 (15.8%) |
| 35 to 64 Years | 14 (2.6%) | 0 (0.0%) |
| 65 to 74 Years | 5 (2.7%) | 56 (22.1%) |
| 75 Years and over | 31 (54.4%) | 0 (0.0%) |
Disability Class: Cognitive Difficulty
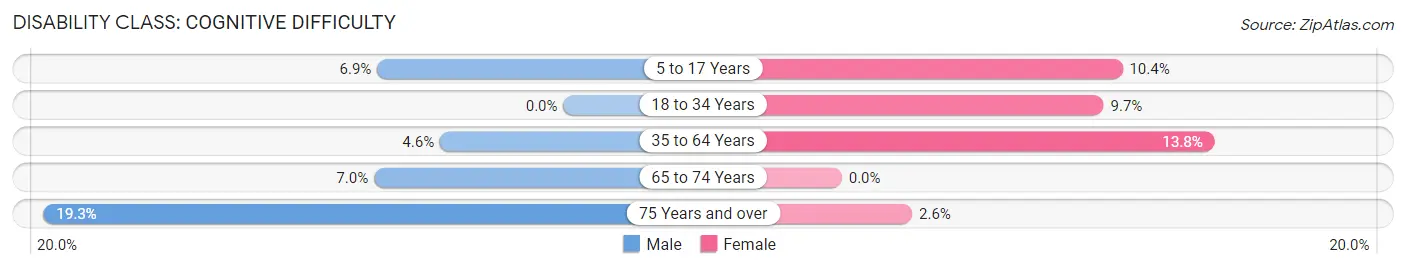
| Age Bracket | Male | Female |
| 5 to 17 Years | 13 (6.9%) | 20 (10.4%) |
| 18 to 34 Years | 0 (0.0%) | 24 (9.7%) |
| 35 to 64 Years | 25 (4.6%) | 79 (13.8%) |
| 65 to 74 Years | 13 (7.0%) | 0 (0.0%) |
| 75 Years and over | 11 (19.3%) | 6 (2.6%) |
Disability Class: Ambulatory Difficulty
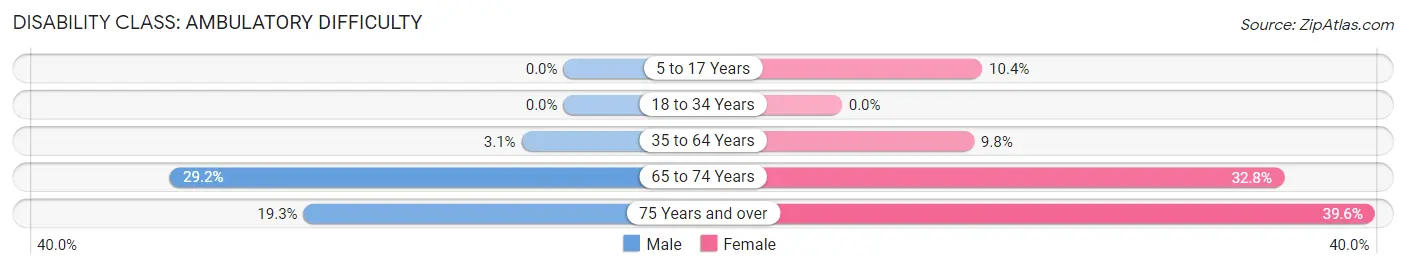
| Age Bracket | Male | Female |
| 5 to 17 Years | 0 (0.0%) | 20 (10.4%) |
| 18 to 34 Years | 0 (0.0%) | 0 (0.0%) |
| 35 to 64 Years | 17 (3.1%) | 56 (9.8%) |
| 65 to 74 Years | 54 (29.2%) | 83 (32.8%) |
| 75 Years and over | 11 (19.3%) | 91 (39.6%) |
Disability Class: Self-Care Difficulty
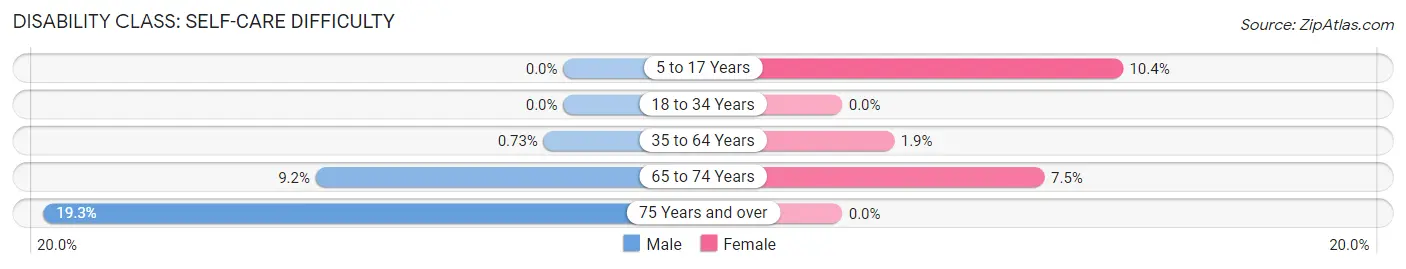
| Age Bracket | Male | Female |
| 5 to 17 Years | 0 (0.0%) | 20 (10.4%) |
| 18 to 34 Years | 0 (0.0%) | 0 (0.0%) |
| 35 to 64 Years | 4 (0.7%) | 11 (1.9%) |
| 65 to 74 Years | 17 (9.2%) | 19 (7.5%) |
| 75 Years and over | 11 (19.3%) | 0 (0.0%) |
Technology Access in Tupper Lake
Computing Device Access in Tupper Lake
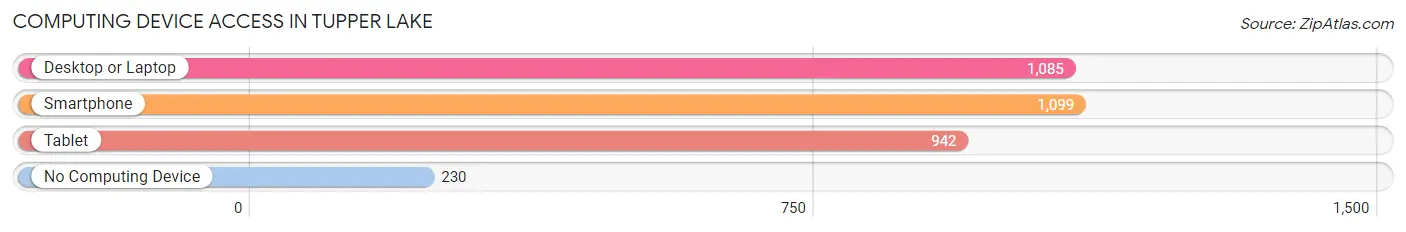
| Device Type | # Households | % Households |
| Desktop or Laptop | 1,085 | 72.4% |
| Smartphone | 1,099 | 73.3% |
| Tablet | 942 | 62.8% |
| No Computing Device | 230 | 15.3% |
| Total | 1,499 | 100.0% |
Internet Access in Tupper Lake
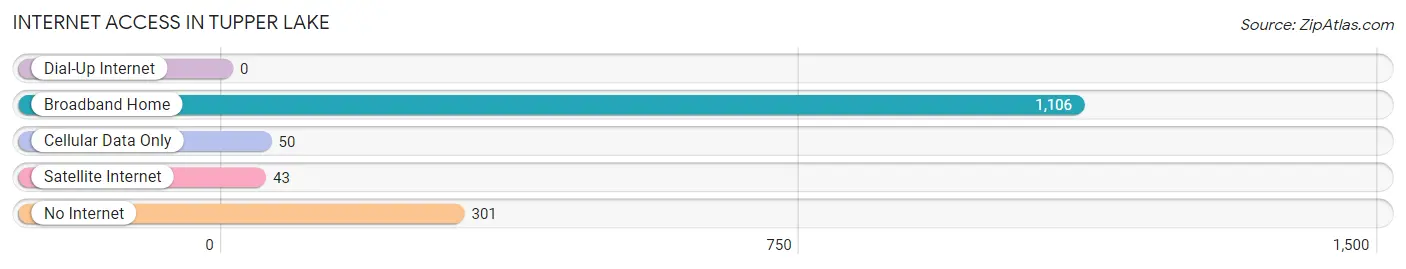
| Internet Type | # Households | % Households |
| Dial-Up Internet | 0 | 0.0% |
| Broadband Home | 1,106 | 73.8% |
| Cellular Data Only | 50 | 3.3% |
| Satellite Internet | 43 | 2.9% |
| No Internet | 301 | 20.1% |
| Total | 1,499 | 100.0% |
Tupper Lake Summary
Tupper Lake is a small town located in the Adirondack Mountains of northern New York State. It is situated in Franklin County, and is the largest community in the county. The town is named after surveyor and land agent, William Tupper, who was responsible for the development of the area in the late 19th century.
History
The area that is now Tupper Lake was originally inhabited by the Iroquois and Algonquin tribes. The first European settlers arrived in the area in the late 1700s, and the town was officially established in 1844. The town was named after William Tupper, who was responsible for the development of the area in the late 19th century.
In the late 19th century, the area experienced a period of rapid growth and development. The railroad arrived in 1892, and the town quickly became a popular tourist destination. The area was known for its beautiful scenery and outdoor activities, and it was a popular destination for wealthy New Yorkers.
In the early 20th century, the area experienced a period of decline. The railroad was abandoned in the 1930s, and the town's population began to decline. The area was also affected by the Great Depression, and many of the businesses in the area closed.
In the late 20th century, the area experienced a period of revitalization. The town was designated as a "Renaissance Community" in the 1990s, and the town has since experienced a period of growth and development.
Geography
Tupper Lake is located in the Adirondack Mountains of northern New York State. It is situated in Franklin County, and is the largest community in the county. The town is located at the northern end of Tupper Lake, a large lake that is part of the Raquette River system. The town is surrounded by mountains and forests, and is a popular destination for outdoor activities such as hiking, camping, and fishing.
Economy
Tupper Lake's economy is largely based on tourism. The town is a popular destination for outdoor activities, and it is home to several resorts and hotels. The town is also home to several restaurants, shops, and other businesses. The town is also home to a number of manufacturing companies, including a paper mill and a wood products plant.
Demographics
As of the 2010 census, Tupper Lake had a population of 5,941. The town has a median age of 41.7, and the median household income is $37,941. The town is predominantly white (94.3%), with small percentages of African American (1.2%), Native American (0.7%), Asian (0.5%), and other races (2.3%). The town is also home to a large number of French Canadians, who make up 8.3% of the population.
Conclusion
Tupper Lake is a small town located in the Adirondack Mountains of northern New York State. It is situated in Franklin County, and is the largest community in the county. The town is named after surveyor and land agent, William Tupper, who was responsible for the development of the area in the late 19th century. The town has a long history, and has experienced periods of growth and decline. The town is now experiencing a period of revitalization, and is a popular destination for outdoor activities and tourism. The town has a population of 5,941, and is predominantly white. The town is also home to a number of manufacturing companies, and is a popular destination for outdoor activities such as hiking, camping, and fishing.
Common Questions
What is Per Capita Income in Tupper Lake?
Per Capita income in Tupper Lake is $34,223.
What is the Median Family Income in Tupper Lake?
Median Family Income in Tupper Lake is $78,819.
What is the Median Household income in Tupper Lake?
Median Household Income in Tupper Lake is $52,779.
What is Income or Wage Gap in Tupper Lake?
Income or Wage Gap in Tupper Lake is 50.3%.
Women in Tupper Lake earn 49.7 cents for every dollar earned by a man.
What is Inequality or Gini Index in Tupper Lake?
Inequality or Gini Index in Tupper Lake is 0.43.
What is the Total Population of Tupper Lake?
Total Population of Tupper Lake is 2,804.
What is the Total Male Population of Tupper Lake?
Total Male Population of Tupper Lake is 1,250.
What is the Total Female Population of Tupper Lake?
Total Female Population of Tupper Lake is 1,554.
What is the Ratio of Males per 100 Females in Tupper Lake?
There are 80.44 Males per 100 Females in Tupper Lake.
What is the Ratio of Females per 100 Males in Tupper Lake?
There are 124.32 Females per 100 Males in Tupper Lake.
What is the Median Population Age in Tupper Lake?
Median Population Age in Tupper Lake is 47.4 Years.
What is the Average Family Size in Tupper Lake
Average Family Size in Tupper Lake is 2.6 People.
What is the Average Household Size in Tupper Lake
Average Household Size in Tupper Lake is 1.9 People.
How Large is the Labor Force in Tupper Lake?
There are 1,384 People in the Labor Forcein in Tupper Lake.
What is the Percentage of People in the Labor Force in Tupper Lake?
56.9% of People are in the Labor Force in Tupper Lake.
What is the Unemployment Rate in Tupper Lake?
Unemployment Rate in Tupper Lake is 4.8%.