Stottville, NY Map & Demographics
Stottville Map
Stottville Overview
$32,276
PER CAPITA INCOME
$73,000
AVG FAMILY INCOME
$56,667
AVG HOUSEHOLD INCOME
32.4%
WAGE / INCOME GAP [ % ]
67.6¢/ $1
WAGE / INCOME GAP [ $ ]
0.34
INEQUALITY / GINI INDEX
1,186
TOTAL POPULATION
630
MALE POPULATION
556
FEMALE POPULATION
113.31
MALES / 100 FEMALES
88.25
FEMALES / 100 MALES
38.7
MEDIAN AGE
2.9
AVG FAMILY SIZE
2.0
AVG HOUSEHOLD SIZE
604
LABOR FORCE [ PEOPLE ]
67.4%
PERCENT IN LABOR FORCE
1.8%
UNEMPLOYMENT RATE
Stottville Zip Codes
Stottville Area Codes
Income in Stottville
Income Overview in Stottville
Per Capita Income in Stottville is $32,276, while median incomes of families and households are $73,000 and $56,667 respectively.
| Characteristic | Number | Measure |
| Per Capita Income | 1,186 | $32,276 |
| Median Family Income | 302 | $73,000 |
| Mean Family Income | 302 | $72,245 |
| Median Household Income | 574 | $56,667 |
| Mean Household Income | 574 | $66,498 |
| Income Deficit | 302 | $0 |
| Wage / Income Gap (%) | 1,186 | 32.38% |
| Wage / Income Gap ($) | 1,186 | 67.62¢ per $1 |
| Gini / Inequality Index | 1,186 | 0.34 |
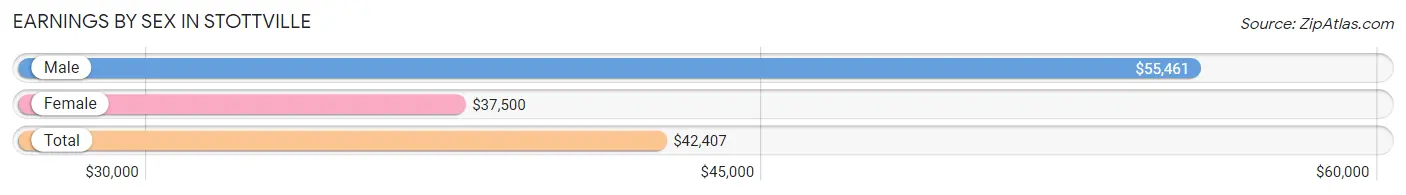
Earnings by Sex in Stottville
Average Earnings in Stottville are $42,407, $55,461 for men and $37,500 for women, a difference of 32.4%.
| Sex | Number | Average Earnings |
| Male | 286 (47.0%) | $55,461 |
| Female | 322 (53.0%) | $37,500 |
| Total | 608 (100.0%) | $42,407 |
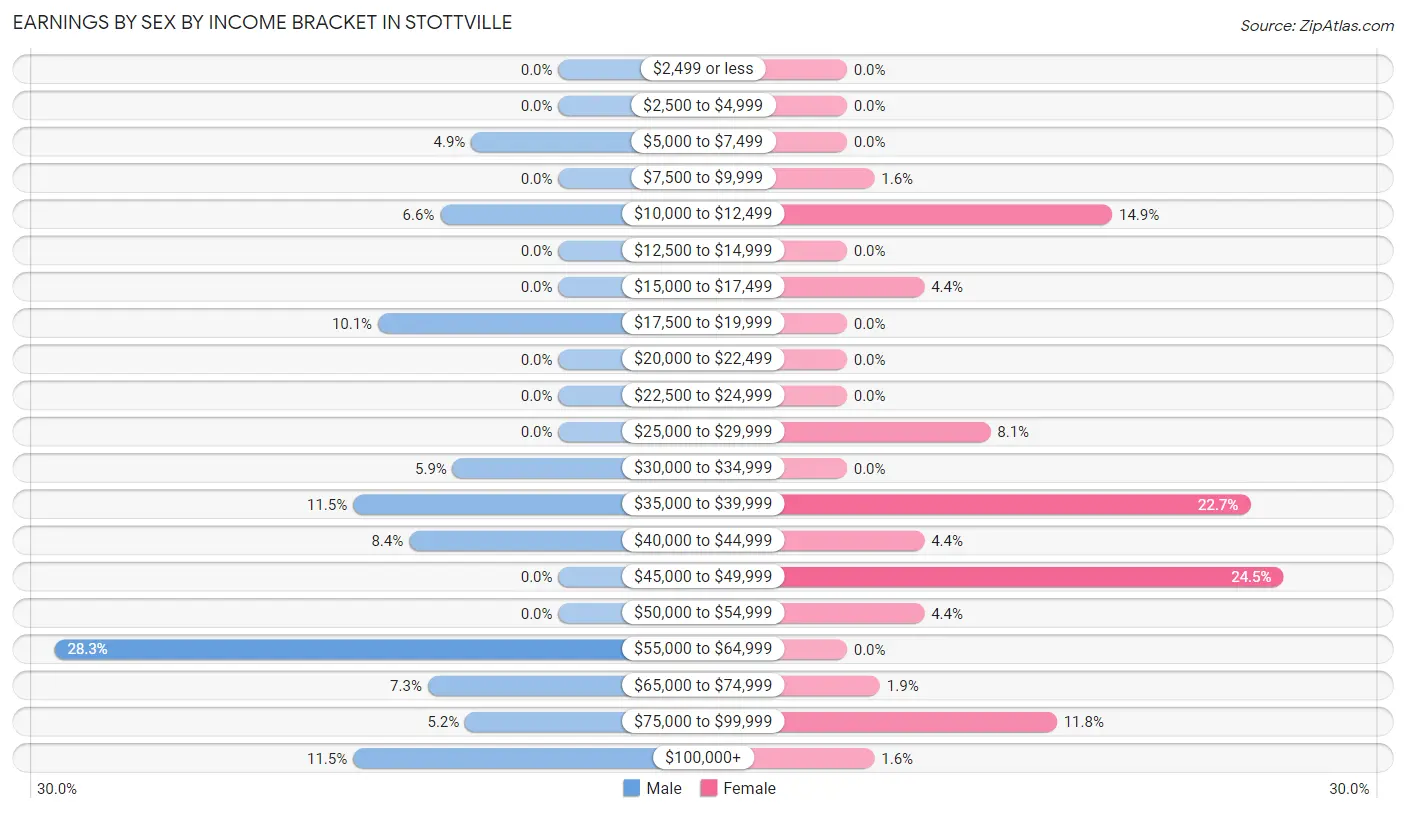
Earnings by Sex by Income Bracket in Stottville
The most common earnings brackets in Stottville are $55,000 to $64,999 for men (81 | 28.3%) and $45,000 to $49,999 for women (79 | 24.5%).
| Income | Male | Female |
| $2,499 or less | 0 (0.0%) | 0 (0.0%) |
| $2,500 to $4,999 | 0 (0.0%) | 0 (0.0%) |
| $5,000 to $7,499 | 14 (4.9%) | 0 (0.0%) |
| $7,500 to $9,999 | 0 (0.0%) | 5 (1.5%) |
| $10,000 to $12,499 | 19 (6.6%) | 48 (14.9%) |
| $12,500 to $14,999 | 0 (0.0%) | 0 (0.0%) |
| $15,000 to $17,499 | 0 (0.0%) | 14 (4.3%) |
| $17,500 to $19,999 | 29 (10.1%) | 0 (0.0%) |
| $20,000 to $22,499 | 0 (0.0%) | 0 (0.0%) |
| $22,500 to $24,999 | 0 (0.0%) | 0 (0.0%) |
| $25,000 to $29,999 | 0 (0.0%) | 26 (8.1%) |
| $30,000 to $34,999 | 17 (5.9%) | 0 (0.0%) |
| $35,000 to $39,999 | 33 (11.5%) | 73 (22.7%) |
| $40,000 to $44,999 | 24 (8.4%) | 14 (4.3%) |
| $45,000 to $49,999 | 0 (0.0%) | 79 (24.5%) |
| $50,000 to $54,999 | 0 (0.0%) | 14 (4.3%) |
| $55,000 to $64,999 | 81 (28.3%) | 0 (0.0%) |
| $65,000 to $74,999 | 21 (7.3%) | 6 (1.9%) |
| $75,000 to $99,999 | 15 (5.2%) | 38 (11.8%) |
| $100,000+ | 33 (11.5%) | 5 (1.5%) |
| Total | 286 (100.0%) | 322 (100.0%) |
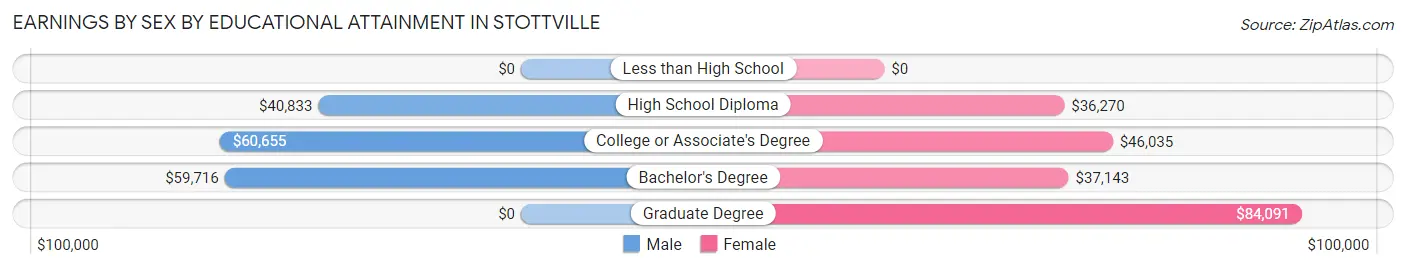
Earnings by Sex by Educational Attainment in Stottville
Average earnings in Stottville are $57,039 for men and $37,500 for women, a difference of 34.3%. Men with an educational attainment of college or associate's degree enjoy the highest average annual earnings of $60,655, while those with high school diploma education earn the least with $40,833. Women with an educational attainment of graduate degree earn the most with the average annual earnings of $84,091, while those with high school diploma education have the smallest earnings of $36,270.
| Educational Attainment | Male Income | Female Income |
| Less than High School | - | - |
| High School Diploma | $40,833 | $36,270 |
| College or Associate's Degree | $60,655 | $46,035 |
| Bachelor's Degree | $59,716 | $37,143 |
| Graduate Degree | - | - |
| Total | $57,039 | $37,500 |
Family Income in Stottville
Family Income Brackets in Stottville
According to the Stottville family income data, there are 97 families falling into the $100,000 to $149,999 income range, which is the most common income bracket and makes up 32.1% of all families.
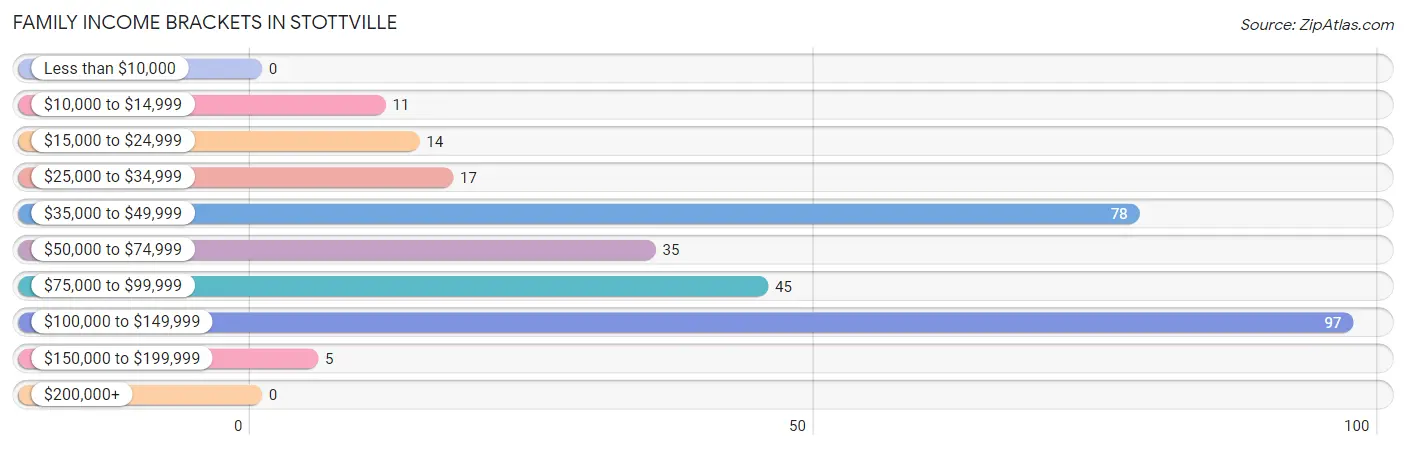
| Income Bracket | # Families | % Families |
| Less than $10,000 | 0 | 0.0% |
| $10,000 to $14,999 | 11 | 3.6% |
| $15,000 to $24,999 | 14 | 4.6% |
| $25,000 to $34,999 | 17 | 5.6% |
| $35,000 to $49,999 | 78 | 25.8% |
| $50,000 to $74,999 | 35 | 11.6% |
| $75,000 to $99,999 | 45 | 14.9% |
| $100,000 to $149,999 | 97 | 32.1% |
| $150,000 to $199,999 | 5 | 1.7% |
| $200,000+ | 0 | 0.0% |
Family Income by Famaliy Size in Stottville
3-person families (104 | 34.4%) account for the highest median family income in Stottville with $105,671 per family, while 2-person families (93 | 30.8%) have the highest median income of $40,208 per family member.
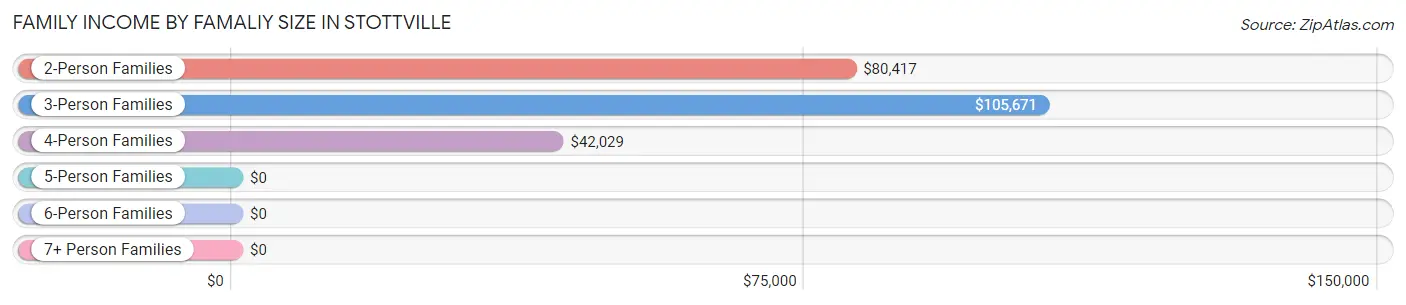
| Income Bracket | # Families | Median Income |
| 2-Person Families | 93 (30.8%) | $80,417 |
| 3-Person Families | 104 (34.4%) | $105,671 |
| 4-Person Families | 99 (32.8%) | $42,029 |
| 5-Person Families | 6 (2.0%) | $0 |
| 6-Person Families | 0 (0.0%) | $0 |
| 7+ Person Families | 0 (0.0%) | $0 |
| Total | 302 (100.0%) | $73,000 |
Family Income by Number of Earners in Stottville
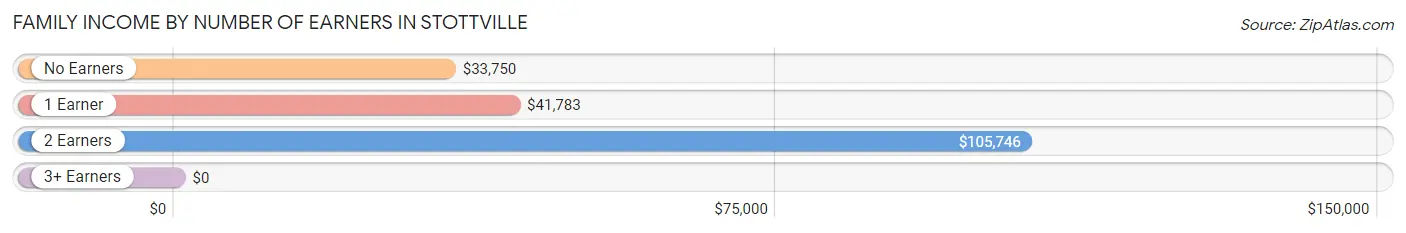
| Number of Earners | # Families | Median Income |
| No Earners | 21 (7.0%) | $33,750 |
| 1 Earner | 149 (49.3%) | $41,783 |
| 2 Earners | 108 (35.8%) | $105,746 |
| 3+ Earners | 24 (8.0%) | $0 |
| Total | 302 (100.0%) | $73,000 |
Household Income in Stottville
Household Income Brackets in Stottville
With 126 households falling in the category, the $100,000 to $149,999 income range is the most frequent in Stottville, accounting for 22.0% of all households.
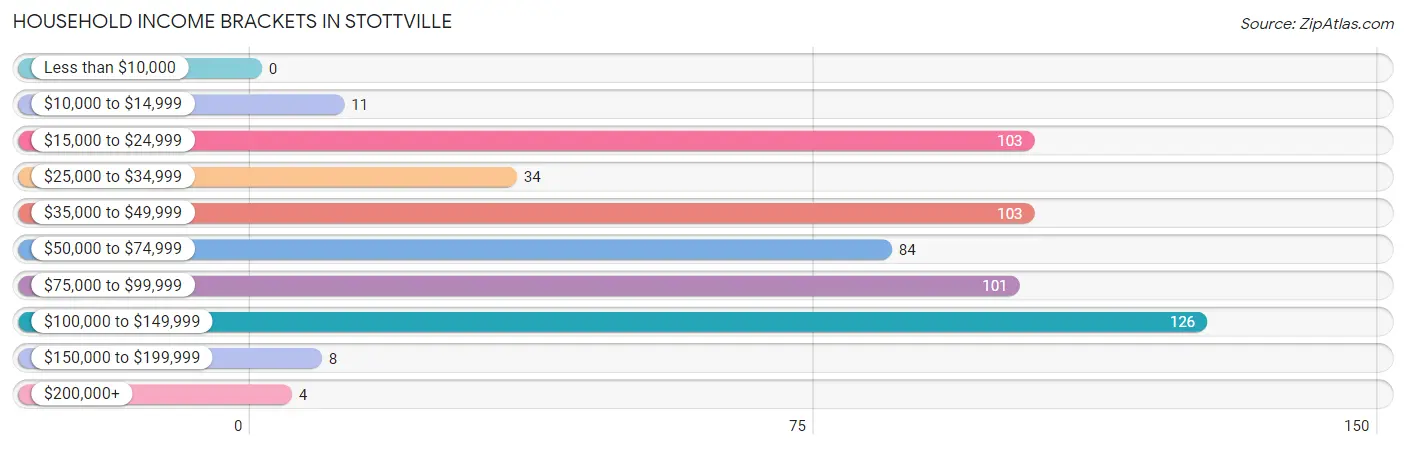
| Income Bracket | # Households | % Households |
| Less than $10,000 | 0 | 0.0% |
| $10,000 to $14,999 | 11 | 1.9% |
| $15,000 to $24,999 | 103 | 17.9% |
| $25,000 to $34,999 | 34 | 5.9% |
| $35,000 to $49,999 | 103 | 17.9% |
| $50,000 to $74,999 | 84 | 14.6% |
| $75,000 to $99,999 | 101 | 17.6% |
| $100,000 to $149,999 | 126 | 22.0% |
| $150,000 to $199,999 | 8 | 1.4% |
| $200,000+ | 4 | 0.7% |
Household Income by Householder Age in Stottville
The median household income in Stottville is $56,667, with the highest median household income of $78,250 found in the 45 to 64 years age bracket for the primary householder. A total of 219 households (38.2%) fall into this category. Meanwhile, the 15 to 24 years age bracket for the primary householder has the lowest median household income of $0, with 28 households (4.9%) in this group.
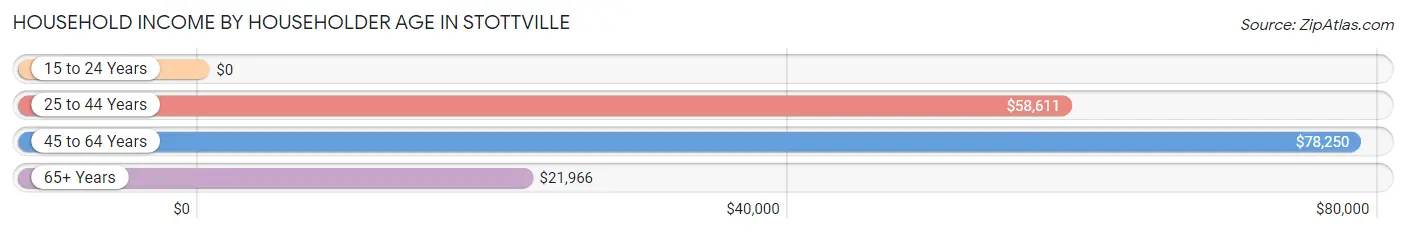
| Income Bracket | # Households | Median Income |
| 15 to 24 Years | 28 (4.9%) | $0 |
| 25 to 44 Years | 172 (30.0%) | $58,611 |
| 45 to 64 Years | 219 (38.2%) | $78,250 |
| 65+ Years | 155 (27.0%) | $21,966 |
| Total | 574 (100.0%) | $56,667 |
Poverty in Stottville
Income Below Poverty by Sex and Age in Stottville
With 7.1% poverty level for males and 11.0% for females among the residents of Stottville, 6 to 11 year old males and 18 to 24 year old females are the most vulnerable to poverty, with 15 males (48.4%) and 14 females (50.0%) in their respective age groups living below the poverty level.
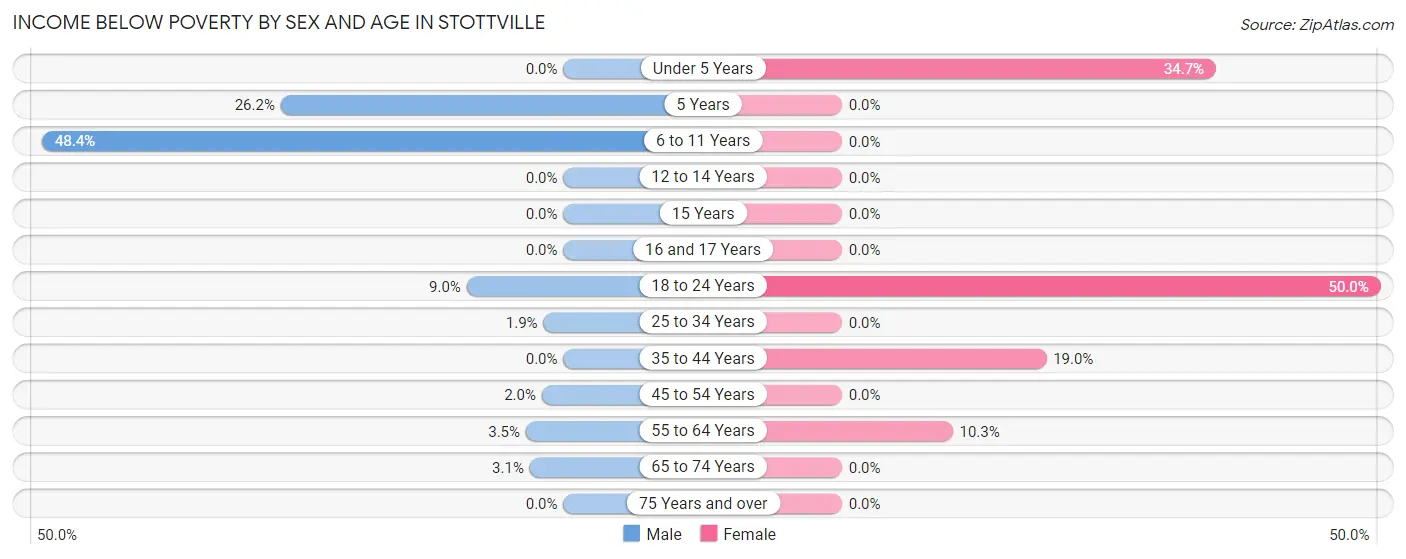
| Age Bracket | Male | Female |
| Under 5 Years | 0 (0.0%) | 25 (34.7%) |
| 5 Years | 16 (26.2%) | 0 (0.0%) |
| 6 to 11 Years | 15 (48.4%) | 0 (0.0%) |
| 12 to 14 Years | 0 (0.0%) | 0 (0.0%) |
| 15 Years | 0 (0.0%) | 0 (0.0%) |
| 16 and 17 Years | 0 (0.0%) | 0 (0.0%) |
| 18 to 24 Years | 7 (9.0%) | 14 (50.0%) |
| 25 to 34 Years | 1 (1.8%) | 0 (0.0%) |
| 35 to 44 Years | 0 (0.0%) | 11 (19.0%) |
| 45 to 54 Years | 1 (2.0%) | 0 (0.0%) |
| 55 to 64 Years | 4 (3.5%) | 11 (10.3%) |
| 65 to 74 Years | 1 (3.1%) | 0 (0.0%) |
| 75 Years and over | 0 (0.0%) | 0 (0.0%) |
| Total | 45 (7.1%) | 61 (11.0%) |
Income Above Poverty by Sex and Age in Stottville
According to the poverty statistics in Stottville, males aged 12 to 14 years and females aged 6 to 11 years are the age groups that are most secure financially, with 100.0% of males and 100.0% of females in these age groups living above the poverty line.
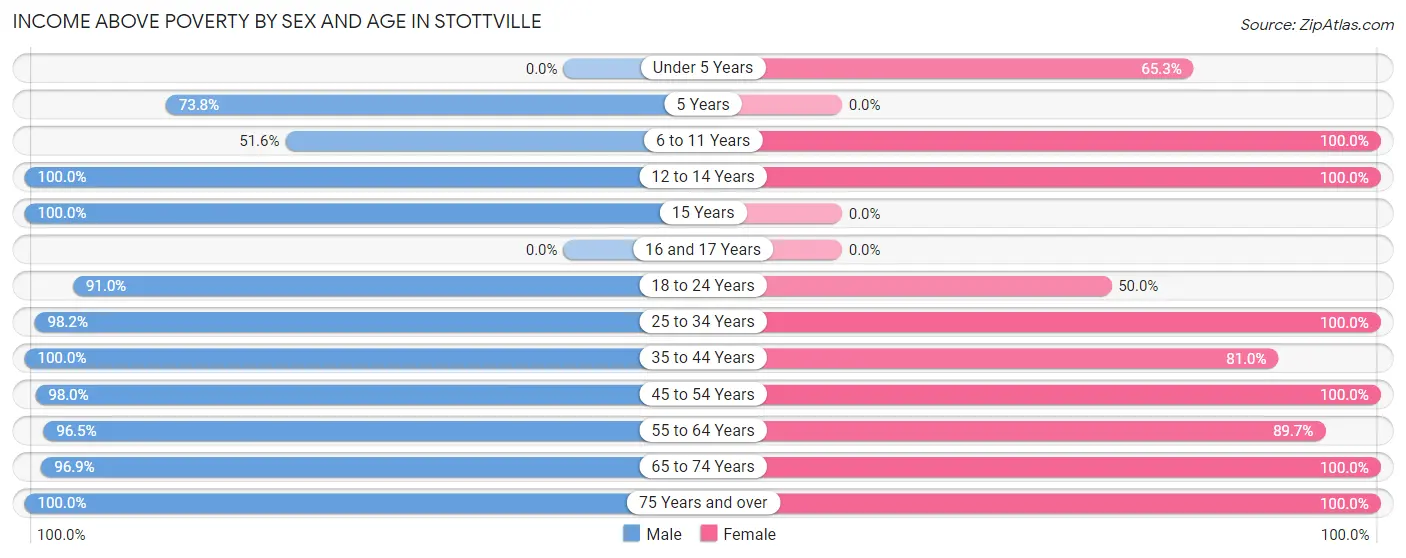
| Age Bracket | Male | Female |
| Under 5 Years | 0 (0.0%) | 47 (65.3%) |
| 5 Years | 45 (73.8%) | 0 (0.0%) |
| 6 to 11 Years | 16 (51.6%) | 51 (100.0%) |
| 12 to 14 Years | 49 (100.0%) | 20 (100.0%) |
| 15 Years | 6 (100.0%) | 0 (0.0%) |
| 16 and 17 Years | 0 (0.0%) | 0 (0.0%) |
| 18 to 24 Years | 71 (91.0%) | 14 (50.0%) |
| 25 to 34 Years | 53 (98.2%) | 102 (100.0%) |
| 35 to 44 Years | 54 (100.0%) | 47 (81.0%) |
| 45 to 54 Years | 49 (98.0%) | 38 (100.0%) |
| 55 to 64 Years | 111 (96.5%) | 96 (89.7%) |
| 65 to 74 Years | 31 (96.9%) | 55 (100.0%) |
| 75 Years and over | 100 (100.0%) | 25 (100.0%) |
| Total | 585 (92.9%) | 495 (89.0%) |
Income Below Poverty Among Married-Couple Families in Stottville
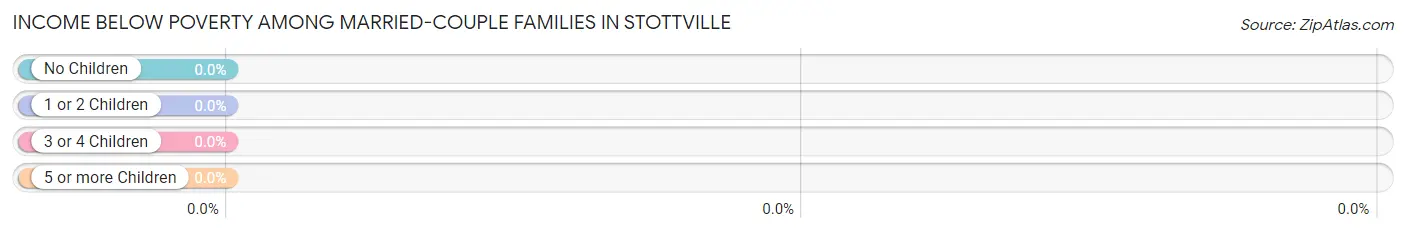
| Children | Above Poverty | Below Poverty |
| No Children | 106 (100.0%) | 0 (0.0%) |
| 1 or 2 Children | 61 (100.0%) | 0 (0.0%) |
| 3 or 4 Children | 6 (100.0%) | 0 (0.0%) |
| 5 or more Children | 0 (0.0%) | 0 (0.0%) |
| Total | 173 (100.0%) | 0 (0.0%) |
Income Below Poverty Among Single-Parent Households in Stottville
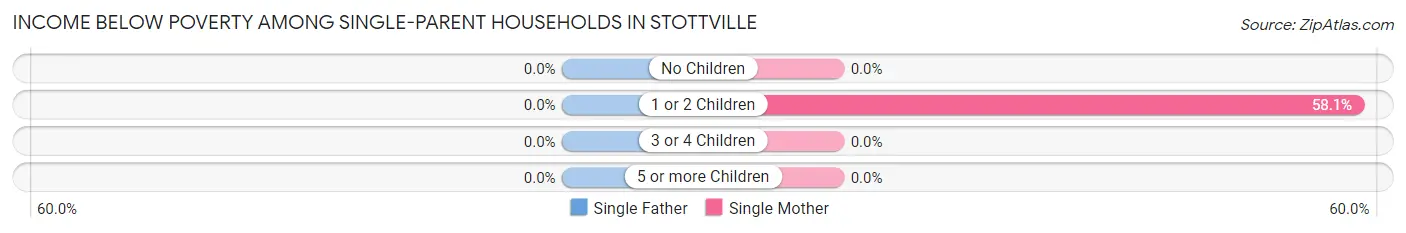
| Children | Single Father | Single Mother |
| No Children | 0 (0.0%) | 0 (0.0%) |
| 1 or 2 Children | 0 (0.0%) | 25 (58.1%) |
| 3 or 4 Children | 0 (0.0%) | 0 (0.0%) |
| 5 or more Children | 0 (0.0%) | 0 (0.0%) |
| Total | 0 (0.0%) | 25 (22.9%) |
Income Below Poverty Among Married-Couple vs Single-Parent Households in Stottville
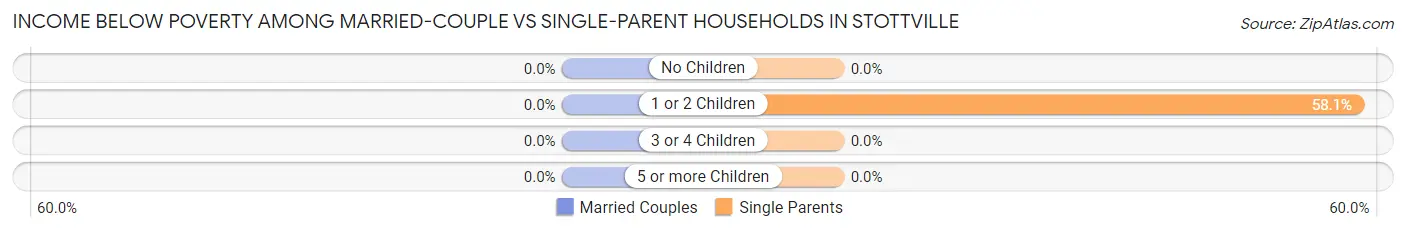
| Children | Married-Couple Families | Single-Parent Households |
| No Children | 0 (0.0%) | 0 (0.0%) |
| 1 or 2 Children | 0 (0.0%) | 25 (58.1%) |
| 3 or 4 Children | 0 (0.0%) | 0 (0.0%) |
| 5 or more Children | 0 (0.0%) | 0 (0.0%) |
| Total | 0 (0.0%) | 25 (19.4%) |
Race in Stottville
The most populous races in Stottville are White / Caucasian (996 | 84.0%), Two or more Races (104 | 8.8%), and Hispanic or Latino (86 | 7.2%).
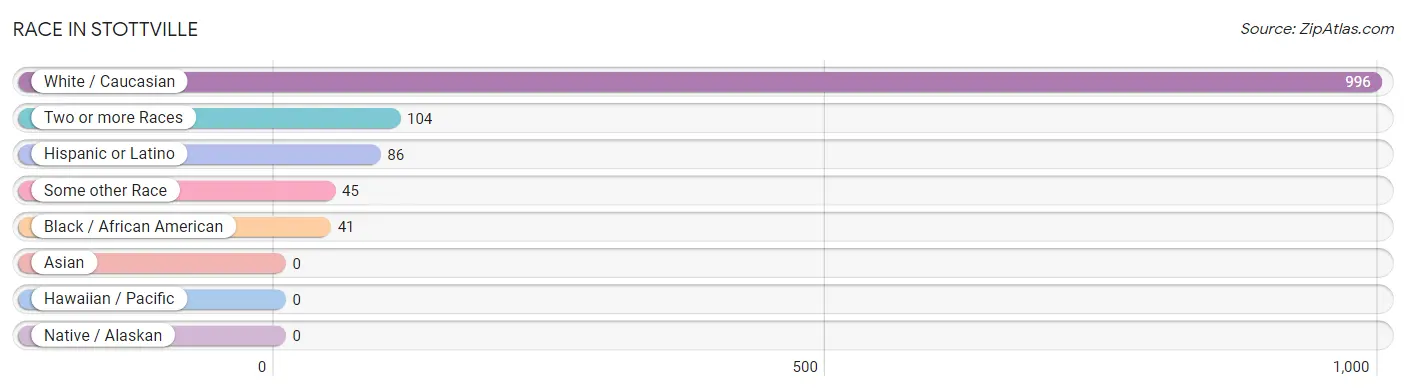
| Race | # Population | % Population |
| Asian | 0 | 0.0% |
| Black / African American | 41 | 3.5% |
| Hawaiian / Pacific | 0 | 0.0% |
| Hispanic or Latino | 86 | 7.2% |
| Native / Alaskan | 0 | 0.0% |
| White / Caucasian | 996 | 84.0% |
| Two or more Races | 104 | 8.8% |
| Some other Race | 45 | 3.8% |
| Total | 1,186 | 100.0% |
Ancestry in Stottville
The most populous ancestries reported in Stottville are Irish (187 | 15.8%), German (166 | 14.0%), Italian (129 | 10.9%), Polish (81 | 6.8%), and English (77 | 6.5%), together accounting for 54.0% of all Stottville residents.
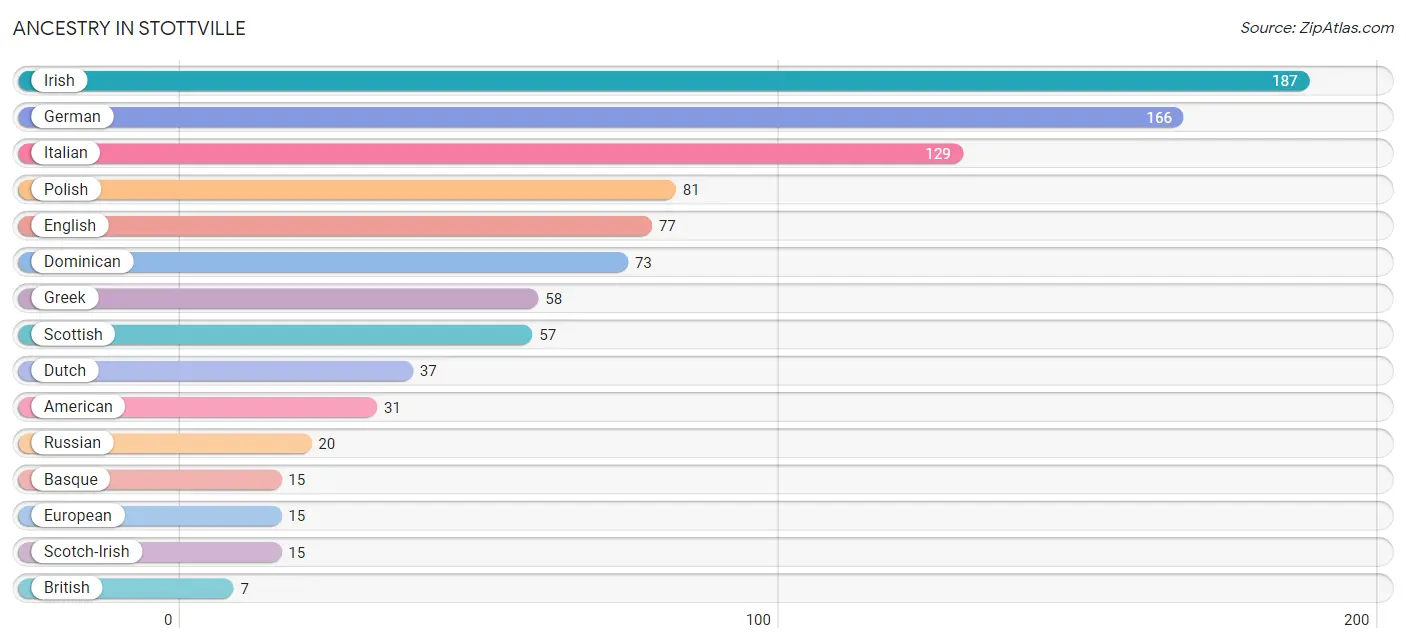
| Ancestry | # Population | % Population |
| American | 31 | 2.6% |
| Basque | 15 | 1.3% |
| British | 7 | 0.6% |
| Central American | 7 | 0.6% |
| Central American Indian | 7 | 0.6% |
| Colombian | 1 | 0.1% |
| Dominican | 73 | 6.2% |
| Dutch | 37 | 3.1% |
| Eastern European | 7 | 0.6% |
| English | 77 | 6.5% |
| European | 15 | 1.3% |
| German | 166 | 14.0% |
| Greek | 58 | 4.9% |
| Guatemalan | 7 | 0.6% |
| Irish | 187 | 15.8% |
| Italian | 129 | 10.9% |
| Jamaican | 5 | 0.4% |
| Polish | 81 | 6.8% |
| Puerto Rican | 5 | 0.4% |
| Russian | 20 | 1.7% |
| Scotch-Irish | 15 | 1.3% |
| Scottish | 57 | 4.8% |
| Slovak | 4 | 0.3% |
| South American | 1 | 0.1% |
| Swedish | 4 | 0.3% | View All 25 Rows |
Immigrants in Stottville
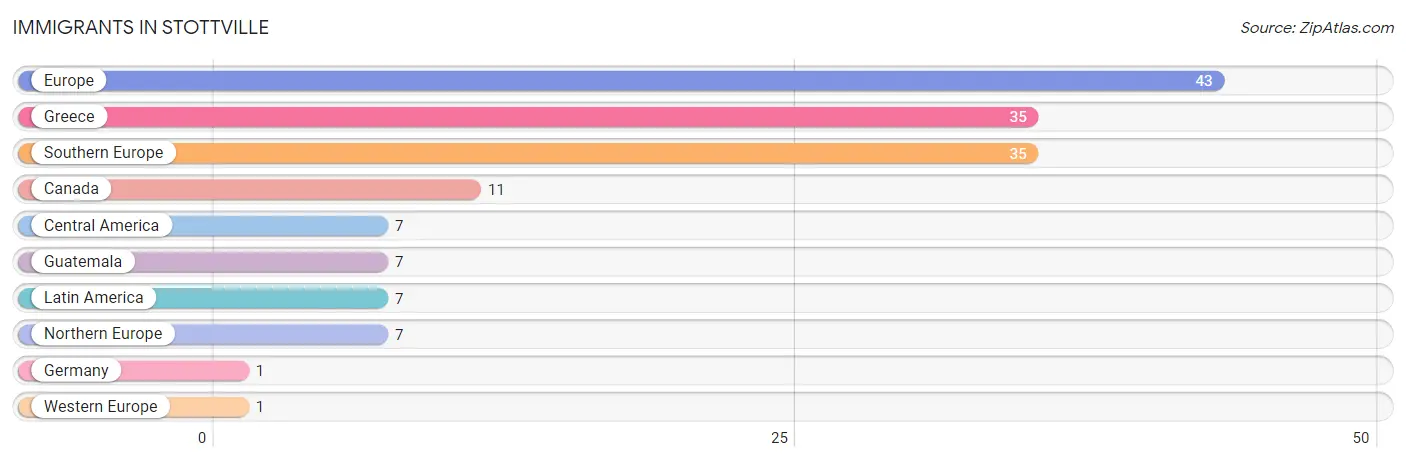
The most numerous immigrant groups reported in Stottville came from Europe (43 | 3.6%), Greece (35 | 2.9%), Southern Europe (35 | 2.9%), Canada (11 | 0.9%), and Central America (7 | 0.6%), together accounting for 11.1% of all Stottville residents.
| Immigration Origin | # Population | % Population |
| Canada | 11 | 0.9% |
| Central America | 7 | 0.6% |
| Europe | 43 | 3.6% |
| Germany | 1 | 0.1% |
| Greece | 35 | 2.9% |
| Guatemala | 7 | 0.6% |
| Latin America | 7 | 0.6% |
| Northern Europe | 7 | 0.6% |
| Southern Europe | 35 | 2.9% |
| Western Europe | 1 | 0.1% | View All 10 Rows |
Sex and Age in Stottville
Sex and Age in Stottville
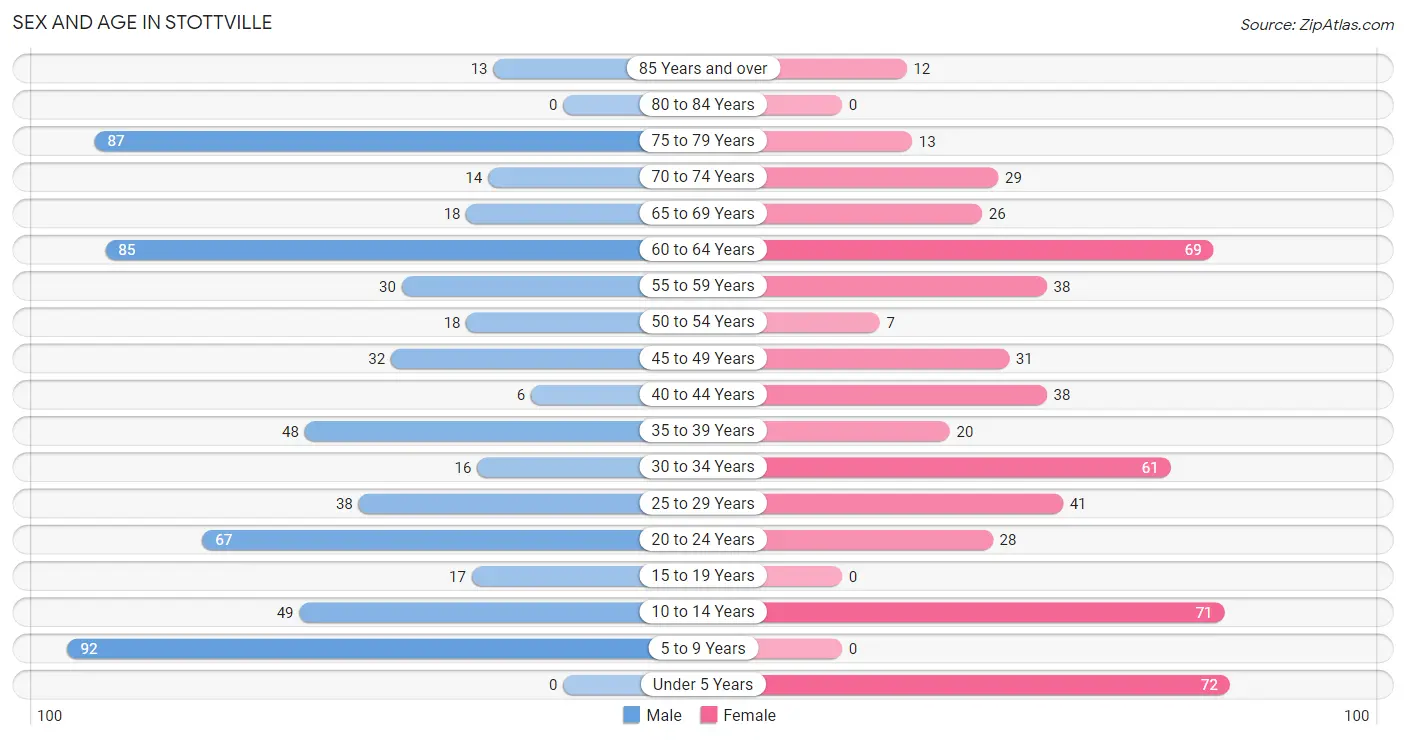
The most populous age groups in Stottville are 5 to 9 Years (92 | 14.6%) for men and Under 5 Years (72 | 13.0%) for women.
| Age Bracket | Male | Female |
| Under 5 Years | 0 (0.0%) | 72 (13.0%) |
| 5 to 9 Years | 92 (14.6%) | 0 (0.0%) |
| 10 to 14 Years | 49 (7.8%) | 71 (12.8%) |
| 15 to 19 Years | 17 (2.7%) | 0 (0.0%) |
| 20 to 24 Years | 67 (10.6%) | 28 (5.0%) |
| 25 to 29 Years | 38 (6.0%) | 41 (7.4%) |
| 30 to 34 Years | 16 (2.5%) | 61 (11.0%) |
| 35 to 39 Years | 48 (7.6%) | 20 (3.6%) |
| 40 to 44 Years | 6 (0.9%) | 38 (6.8%) |
| 45 to 49 Years | 32 (5.1%) | 31 (5.6%) |
| 50 to 54 Years | 18 (2.9%) | 7 (1.3%) |
| 55 to 59 Years | 30 (4.8%) | 38 (6.8%) |
| 60 to 64 Years | 85 (13.5%) | 69 (12.4%) |
| 65 to 69 Years | 18 (2.9%) | 26 (4.7%) |
| 70 to 74 Years | 14 (2.2%) | 29 (5.2%) |
| 75 to 79 Years | 87 (13.8%) | 13 (2.3%) |
| 80 to 84 Years | 0 (0.0%) | 0 (0.0%) |
| 85 Years and over | 13 (2.1%) | 12 (2.2%) |
| Total | 630 (100.0%) | 556 (100.0%) |
Families and Households in Stottville
Median Family Size in Stottville
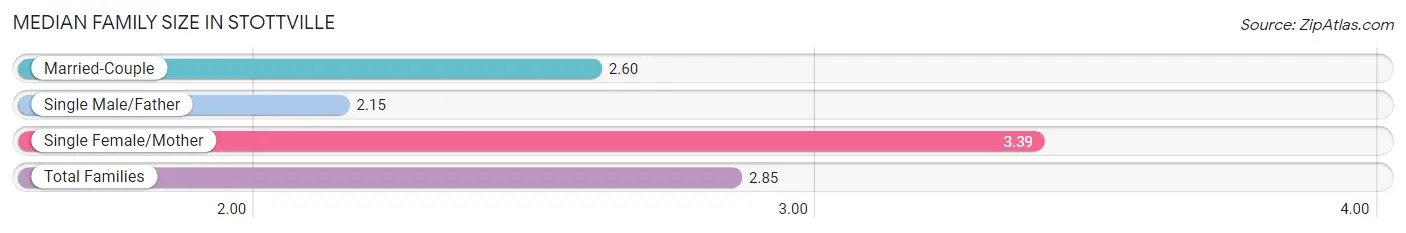
The median family size in Stottville is 2.85 persons per family, with single female/mother families (109 | 36.1%) accounting for the largest median family size of 3.39 persons per family. On the other hand, single male/father families (20 | 6.6%) represent the smallest median family size with 2.15 persons per family.
| Family Type | # Families | Family Size |
| Married-Couple | 173 (57.3%) | 2.60 |
| Single Male/Father | 20 (6.6%) | 2.15 |
| Single Female/Mother | 109 (36.1%) | 3.39 |
| Total Families | 302 (100.0%) | 2.85 |
Median Household Size in Stottville
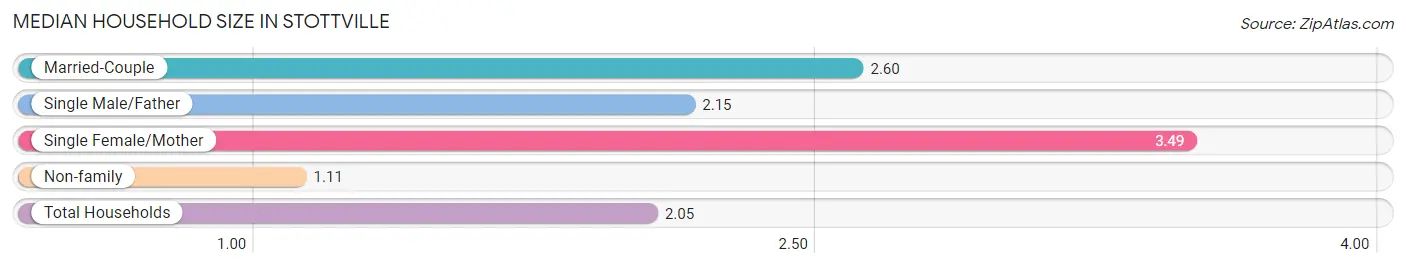
The median household size in Stottville is 2.05 persons per household, with single female/mother households (109 | 19.0%) accounting for the largest median household size of 3.49 persons per household. non-family households (272 | 47.4%) represent the smallest median household size with 1.11 persons per household.
| Household Type | # Households | Household Size |
| Married-Couple | 173 (30.1%) | 2.60 |
| Single Male/Father | 20 (3.5%) | 2.15 |
| Single Female/Mother | 109 (19.0%) | 3.49 |
| Non-family | 272 (47.4%) | 1.11 |
| Total Households | 574 (100.0%) | 2.05 |
Household Size by Marriage Status in Stottville
Out of a total of 574 households in Stottville, 302 (52.6%) are family households, while 272 (47.4%) are nonfamily households. The most numerous type of family households are 4-person households, comprising 113, and the most common type of nonfamily households are 1-person households, comprising 255.
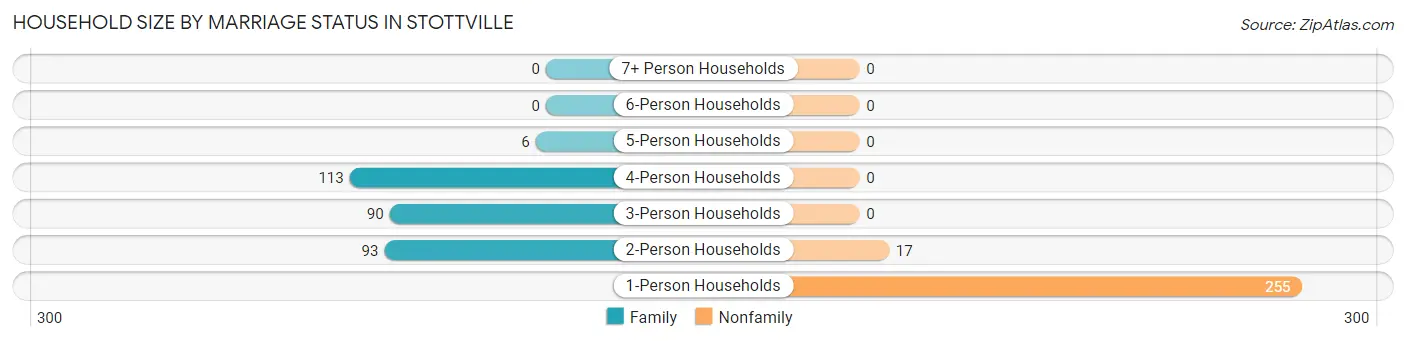
| Household Size | Family Households | Nonfamily Households |
| 1-Person Households | - | 255 (44.4%) |
| 2-Person Households | 93 (16.2%) | 17 (3.0%) |
| 3-Person Households | 90 (15.7%) | 0 (0.0%) |
| 4-Person Households | 113 (19.7%) | 0 (0.0%) |
| 5-Person Households | 6 (1.1%) | 0 (0.0%) |
| 6-Person Households | 0 (0.0%) | 0 (0.0%) |
| 7+ Person Households | 0 (0.0%) | 0 (0.0%) |
| Total | 302 (52.6%) | 272 (47.4%) |
Female Fertility in Stottville
Fertility by Age in Stottville
Average fertility rate in Stottville is 181.0 births per 1,000 women. Women in the age bracket of 20 to 34 years have the highest fertility rate with 315.0 births per 1,000 women. Women in the age bracket of 20 to 34 years acount for 100.0% of all women with births.
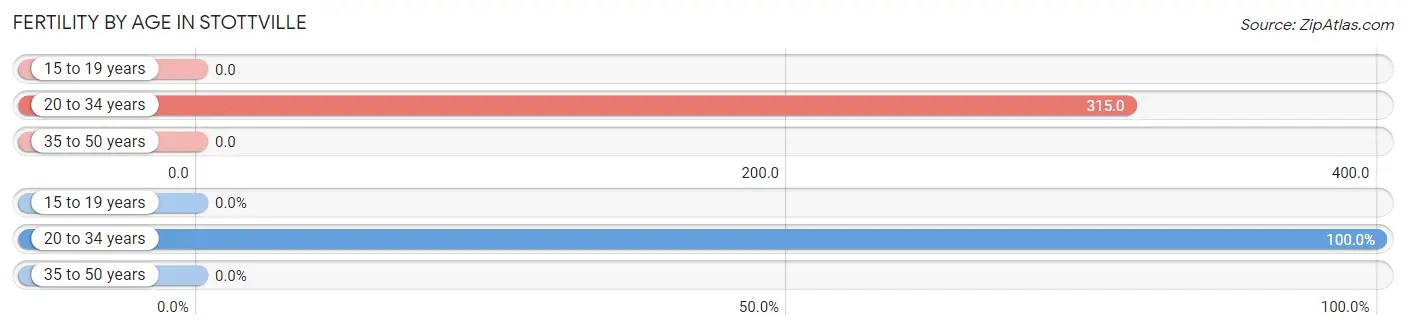
| Age Bracket | Women with Births | Births / 1,000 Women |
| 15 to 19 years | 0 (0.0%) | 0.0 |
| 20 to 34 years | 41 (100.0%) | 315.0 |
| 35 to 50 years | 0 (0.0%) | 0.0 |
| Total | 41 (100.0%) | 181.0 |
Fertility by Age by Marriage Status in Stottville
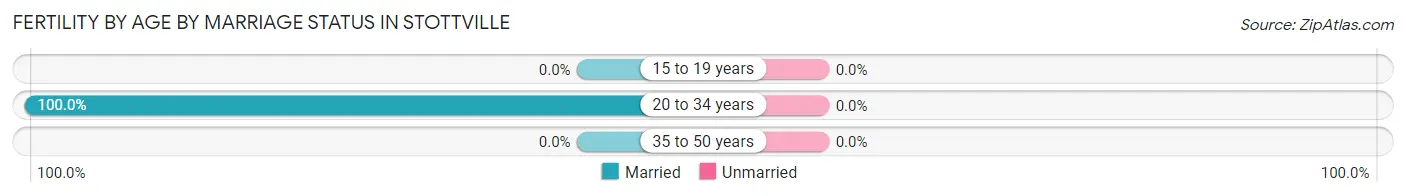
| Age Bracket | Married | Unmarried |
| 15 to 19 years | 0 (0.0%) | 0 (0.0%) |
| 20 to 34 years | 41 (100.0%) | 0 (0.0%) |
| 35 to 50 years | 0 (0.0%) | 0 (0.0%) |
| Total | 41 (100.0%) | 0 (0.0%) |
Fertility by Education in Stottville
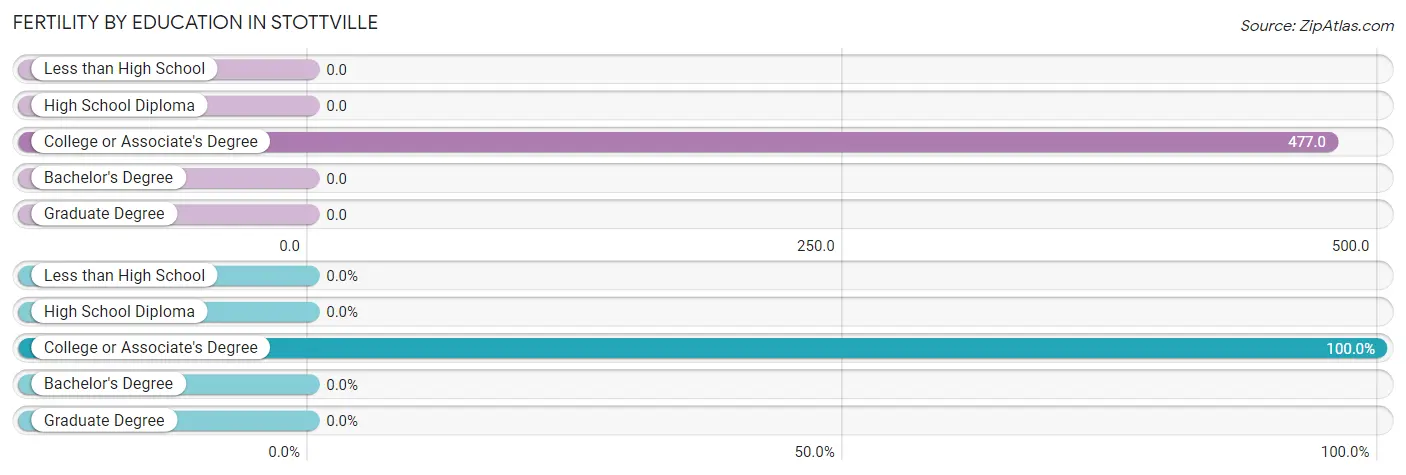
| Educational Attainment | Women with Births | Births / 1,000 Women |
| Less than High School | 0 (0.0%) | 0.0 |
| High School Diploma | 0 (0.0%) | 0.0 |
| College or Associate's Degree | 41 (100.0%) | 477.0 |
| Bachelor's Degree | 0 (0.0%) | 0.0 |
| Graduate Degree | 0 (0.0%) | 0.0 |
| Total | 41 (100.0%) | 181.0 |
Fertility by Education by Marriage Status in Stottville
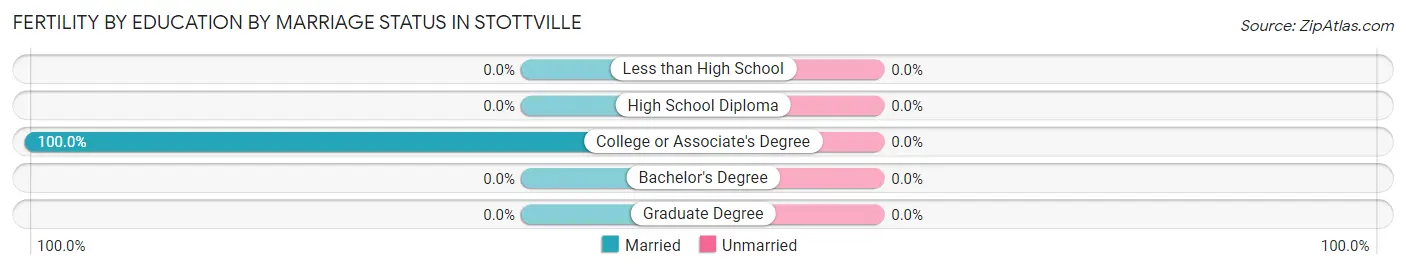
| Educational Attainment | Married | Unmarried |
| Less than High School | 0 (0.0%) | 0 (0.0%) |
| High School Diploma | 0 (0.0%) | 0 (0.0%) |
| College or Associate's Degree | 41 (100.0%) | 0 (0.0%) |
| Bachelor's Degree | 0 (0.0%) | 0 (0.0%) |
| Graduate Degree | 0 (0.0%) | 0 (0.0%) |
| Total | 41 (100.0%) | 0 (0.0%) |
Employment Characteristics in Stottville
Employment by Class of Employer in Stottville
Among the 558 employed individuals in Stottville, private company employees (357 | 64.0%), not-for-profit organizations (102 | 18.3%), and self-employed (incorporated) (38 | 6.8%) make up the most common classes of employment.
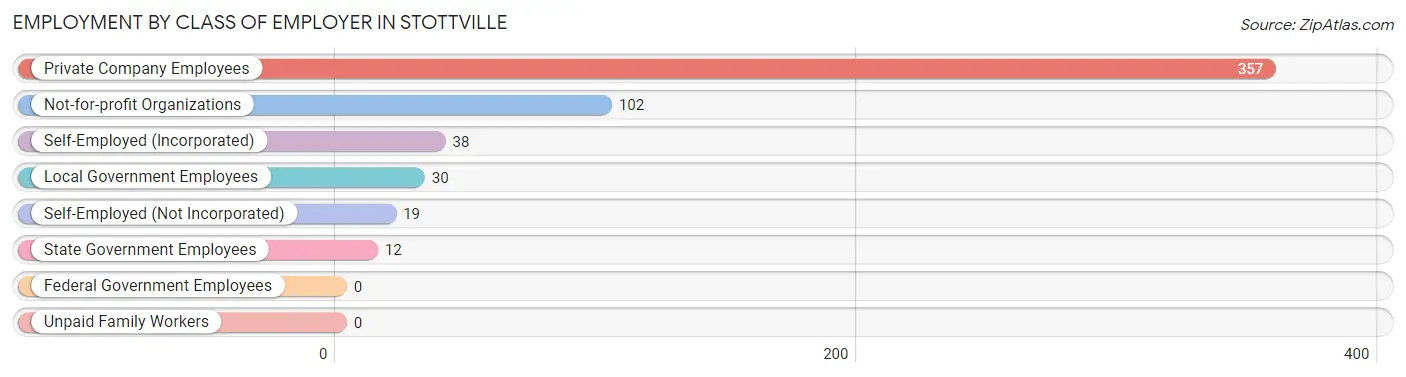
| Employer Class | # Employees | % Employees |
| Private Company Employees | 357 | 64.0% |
| Self-Employed (Incorporated) | 38 | 6.8% |
| Self-Employed (Not Incorporated) | 19 | 3.4% |
| Not-for-profit Organizations | 102 | 18.3% |
| Local Government Employees | 30 | 5.4% |
| State Government Employees | 12 | 2.1% |
| Federal Government Employees | 0 | 0.0% |
| Unpaid Family Workers | 0 | 0.0% |
| Total | 558 | 100.0% |
Employment Status by Age in Stottville
According to the labor force statistics for Stottville, out of the total population over 16 years of age (896), 67.4% or 604 individuals are in the labor force, with 1.8% or 11 of them unemployed. The age group with the highest labor force participation rate is 25 to 29 years, with 100.0% or 79 individuals in the labor force. Within the labor force, the 35 to 44 years age range has the highest percentage of unemployed individuals, with 10.7% or 11 of them being unemployed.
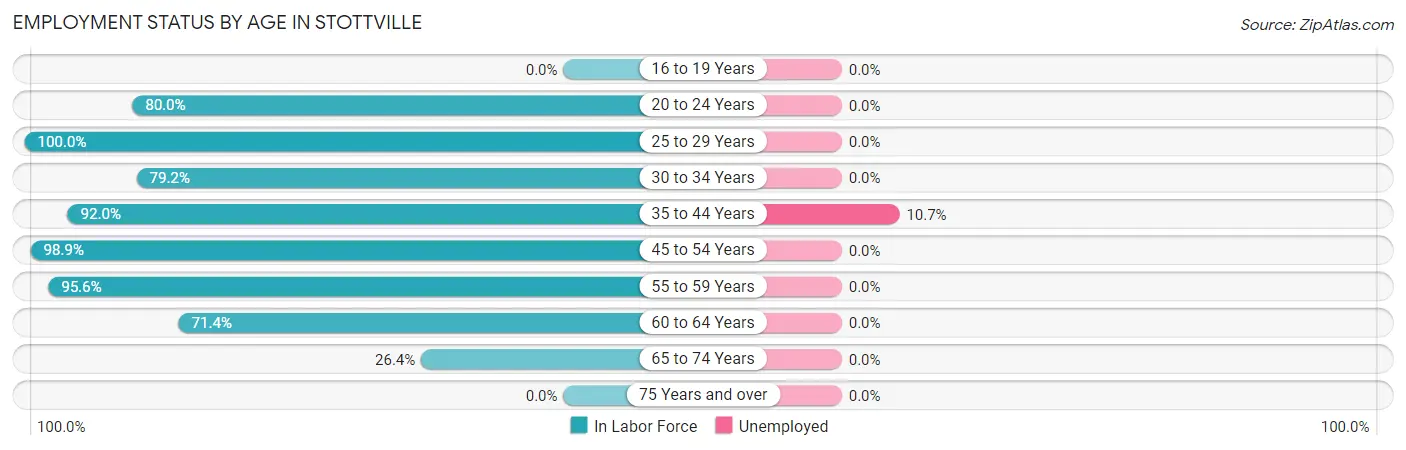
| Age Bracket | In Labor Force | Unemployed |
| 16 to 19 Years | 0 (0.0%) | 0 (0.0%) |
| 20 to 24 Years | 76 (80.0%) | 0 (0.0%) |
| 25 to 29 Years | 79 (100.0%) | 0 (0.0%) |
| 30 to 34 Years | 61 (79.2%) | 0 (0.0%) |
| 35 to 44 Years | 103 (92.0%) | 11 (10.7%) |
| 45 to 54 Years | 87 (98.9%) | 0 (0.0%) |
| 55 to 59 Years | 65 (95.6%) | 0 (0.0%) |
| 60 to 64 Years | 110 (71.4%) | 0 (0.0%) |
| 65 to 74 Years | 23 (26.4%) | 0 (0.0%) |
| 75 Years and over | 0 (0.0%) | 0 (0.0%) |
| Total | 604 (67.4%) | 11 (1.8%) |
Employment Status by Educational Attainment in Stottville
According to labor force statistics for Stottville, 87.4% of individuals (505) out of the total population between 25 and 64 years of age (578) are in the labor force, with 2.2% or 11 of them being unemployed. The group with the highest labor force participation rate are those with the educational attainment of bachelor's degree or higher, with 97.8% or 131 individuals in the labor force. Within the labor force, individuals with high school diploma education have the highest percentage of unemployment, with 7.4% or 11 of them being unemployed.
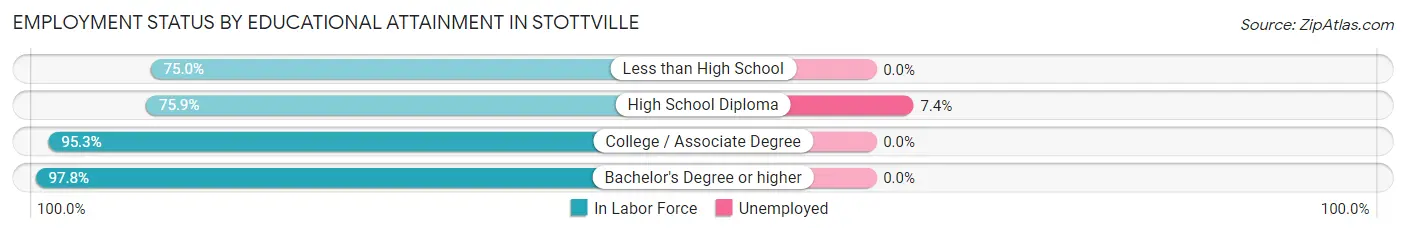
| Educational Attainment | In Labor Force | Unemployed |
| Less than High School | 42 (75.0%) | 0 (0.0%) |
| High School Diploma | 148 (75.9%) | 14 (7.4%) |
| College / Associate Degree | 184 (95.3%) | 0 (0.0%) |
| Bachelor's Degree or higher | 131 (97.8%) | 0 (0.0%) |
| Total | 505 (87.4%) | 13 (2.2%) |
Employment Occupations by Sex in Stottville
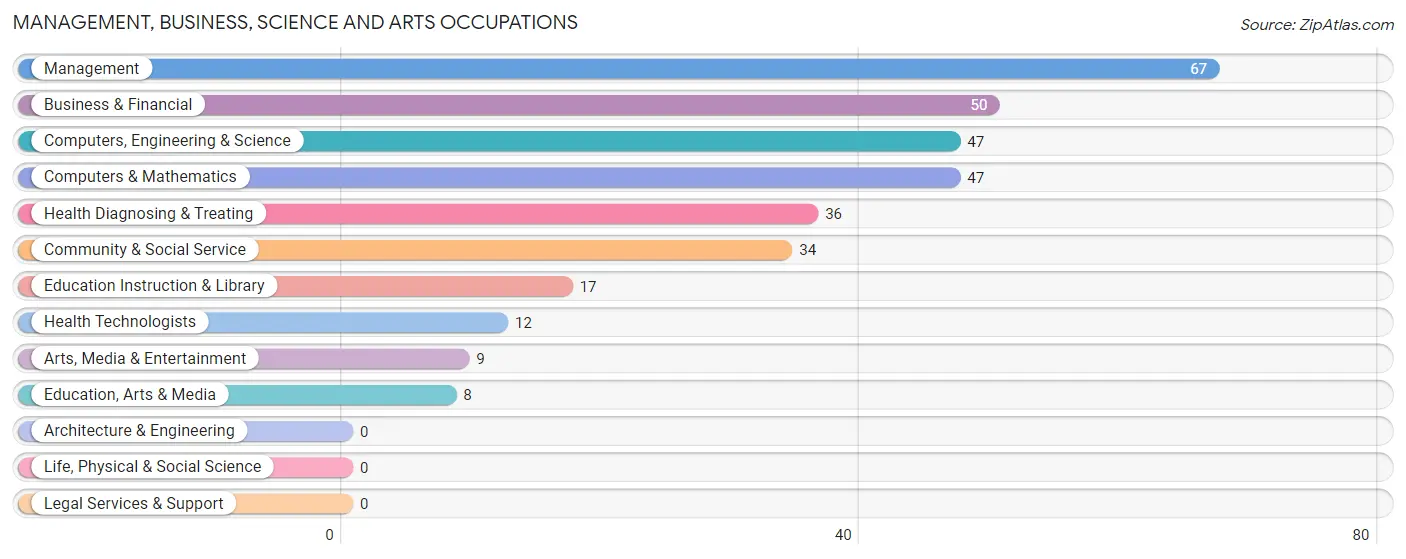
Management, Business, Science and Arts Occupations
The most common Management, Business, Science and Arts occupations in Stottville are Management (67 | 11.3%), Business & Financial (50 | 8.4%), Computers, Engineering & Science (47 | 7.9%), Computers & Mathematics (47 | 7.9%), and Health Diagnosing & Treating (36 | 6.1%).
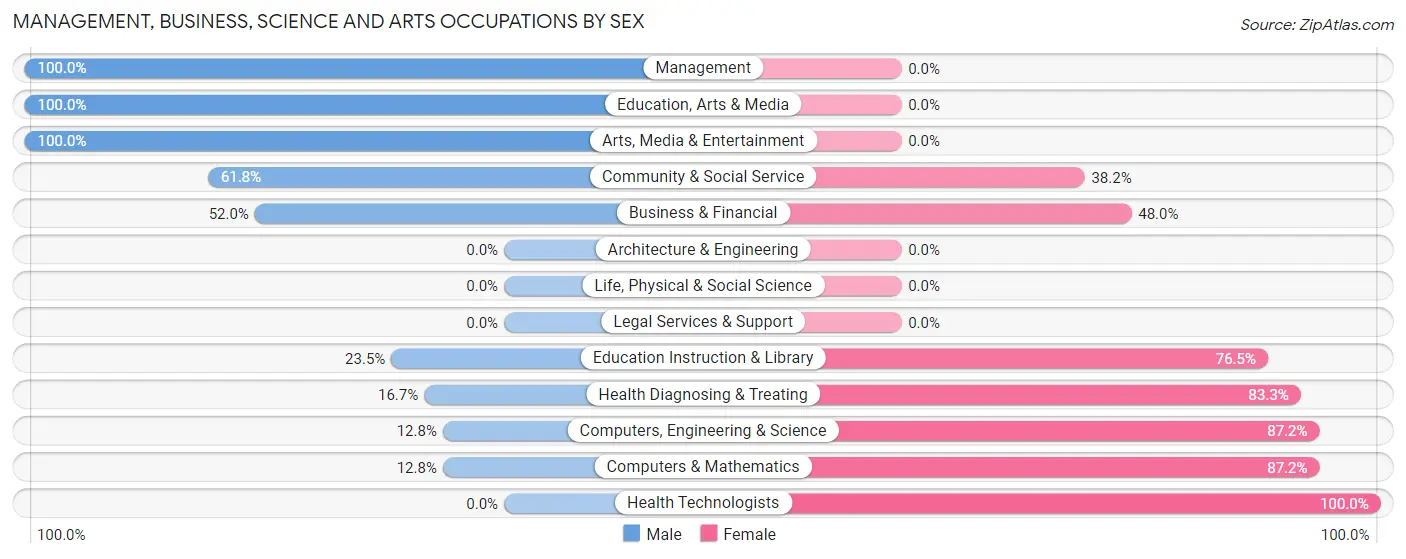
Management, Business, Science and Arts Occupations by Sex
Within the Management, Business, Science and Arts occupations in Stottville, the most male-oriented occupations are Management (100.0%), Education, Arts & Media (100.0%), and Arts, Media & Entertainment (100.0%), while the most female-oriented occupations are Health Technologists (100.0%), Computers, Engineering & Science (87.2%), and Computers & Mathematics (87.2%).
| Occupation | Male | Female |
| Management | 67 (100.0%) | 0 (0.0%) |
| Business & Financial | 26 (52.0%) | 24 (48.0%) |
| Computers, Engineering & Science | 6 (12.8%) | 41 (87.2%) |
| Computers & Mathematics | 6 (12.8%) | 41 (87.2%) |
| Architecture & Engineering | 0 (0.0%) | 0 (0.0%) |
| Life, Physical & Social Science | 0 (0.0%) | 0 (0.0%) |
| Community & Social Service | 21 (61.8%) | 13 (38.2%) |
| Education, Arts & Media | 8 (100.0%) | 0 (0.0%) |
| Legal Services & Support | 0 (0.0%) | 0 (0.0%) |
| Education Instruction & Library | 4 (23.5%) | 13 (76.5%) |
| Arts, Media & Entertainment | 9 (100.0%) | 0 (0.0%) |
| Health Diagnosing & Treating | 6 (16.7%) | 30 (83.3%) |
| Health Technologists | 0 (0.0%) | 12 (100.0%) |
| Total (Category) | 126 (53.8%) | 108 (46.2%) |
| Total (Overall) | 286 (48.2%) | 307 (51.8%) |
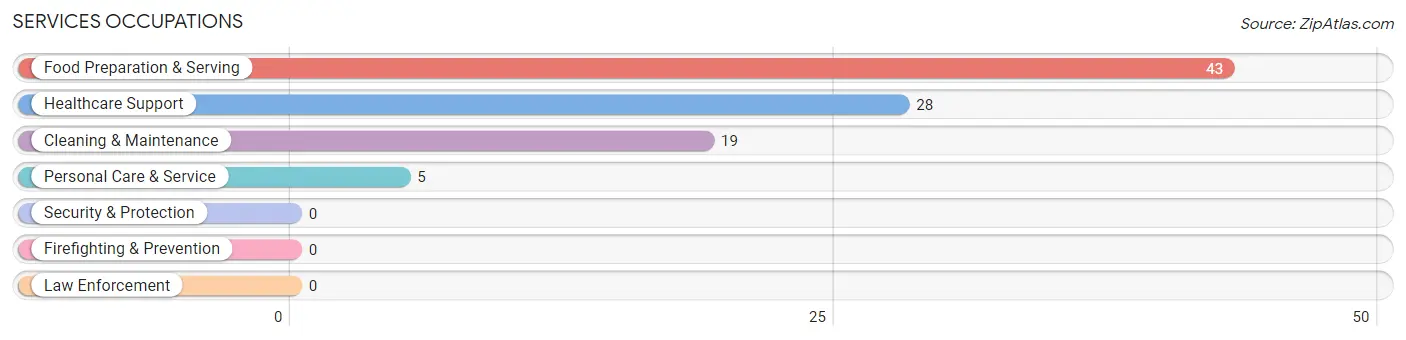
Services Occupations
The most common Services occupations in Stottville are Food Preparation & Serving (43 | 7.2%), Healthcare Support (28 | 4.7%), Cleaning & Maintenance (19 | 3.2%), and Personal Care & Service (5 | 0.8%).
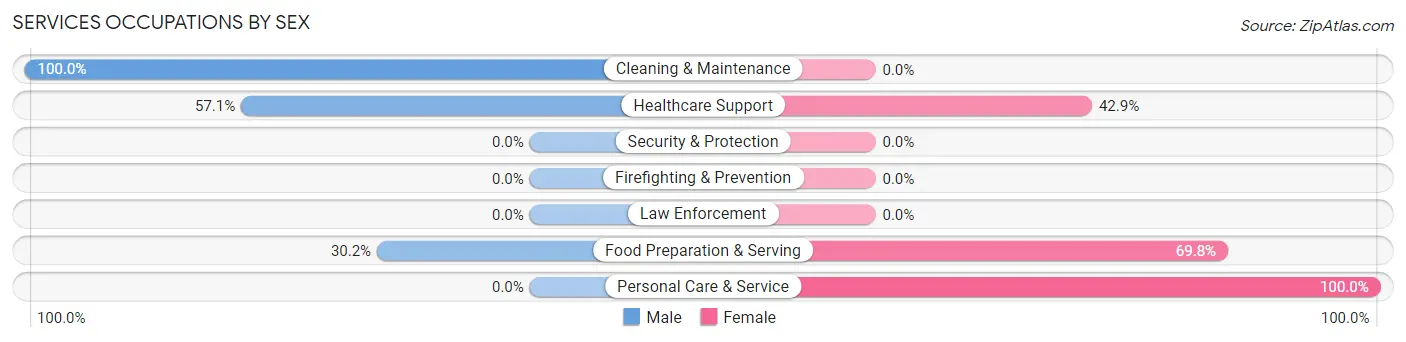
Services Occupations by Sex
Within the Services occupations in Stottville, the most male-oriented occupations are Cleaning & Maintenance (100.0%), Healthcare Support (57.1%), and Food Preparation & Serving (30.2%), while the most female-oriented occupations are Personal Care & Service (100.0%), Food Preparation & Serving (69.8%), and Healthcare Support (42.9%).
| Occupation | Male | Female |
| Healthcare Support | 16 (57.1%) | 12 (42.9%) |
| Security & Protection | 0 (0.0%) | 0 (0.0%) |
| Firefighting & Prevention | 0 (0.0%) | 0 (0.0%) |
| Law Enforcement | 0 (0.0%) | 0 (0.0%) |
| Food Preparation & Serving | 13 (30.2%) | 30 (69.8%) |
| Cleaning & Maintenance | 19 (100.0%) | 0 (0.0%) |
| Personal Care & Service | 0 (0.0%) | 5 (100.0%) |
| Total (Category) | 48 (50.5%) | 47 (49.5%) |
| Total (Overall) | 286 (48.2%) | 307 (51.8%) |
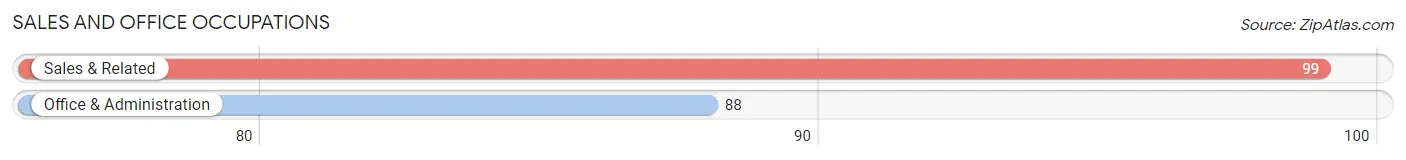
Sales and Office Occupations
The most common Sales and Office occupations in Stottville are Sales & Related (99 | 16.7%), and Office & Administration (88 | 14.8%).
Sales and Office Occupations by Sex
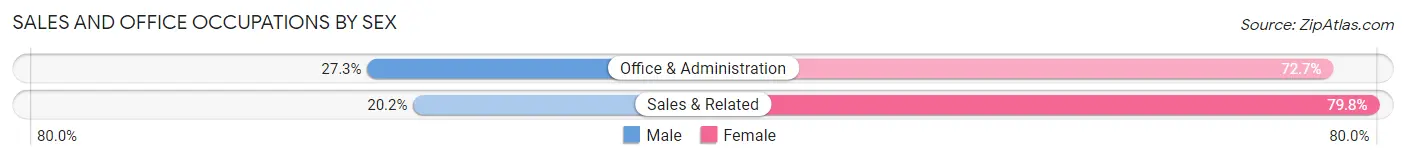
| Occupation | Male | Female |
| Sales & Related | 20 (20.2%) | 79 (79.8%) |
| Office & Administration | 24 (27.3%) | 64 (72.7%) |
| Total (Category) | 44 (23.5%) | 143 (76.5%) |
| Total (Overall) | 286 (48.2%) | 307 (51.8%) |
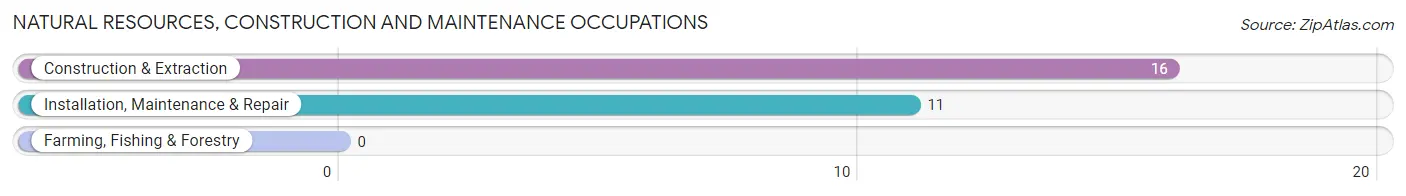
Natural Resources, Construction and Maintenance Occupations
The most common Natural Resources, Construction and Maintenance occupations in Stottville are Construction & Extraction (16 | 2.7%), and Installation, Maintenance & Repair (11 | 1.8%).
Natural Resources, Construction and Maintenance Occupations by Sex
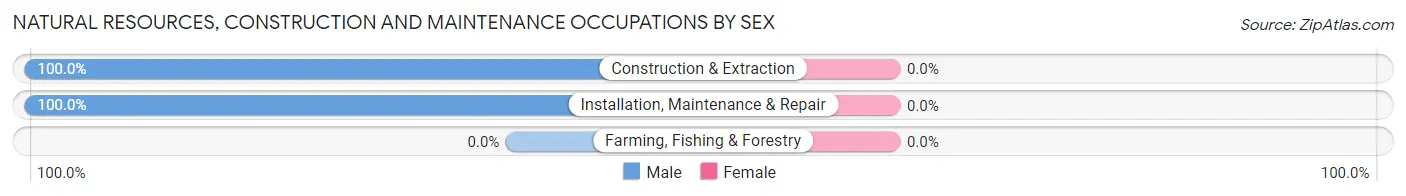
| Occupation | Male | Female |
| Farming, Fishing & Forestry | 0 (0.0%) | 0 (0.0%) |
| Construction & Extraction | 16 (100.0%) | 0 (0.0%) |
| Installation, Maintenance & Repair | 11 (100.0%) | 0 (0.0%) |
| Total (Category) | 27 (100.0%) | 0 (0.0%) |
| Total (Overall) | 286 (48.2%) | 307 (51.8%) |
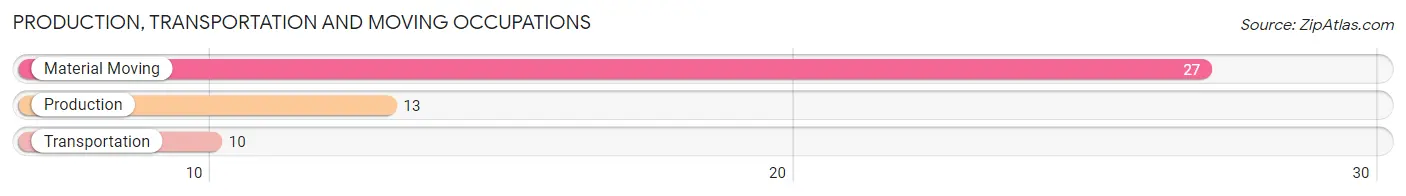
Production, Transportation and Moving Occupations
The most common Production, Transportation and Moving occupations in Stottville are Material Moving (27 | 4.5%), Production (13 | 2.2%), and Transportation (10 | 1.7%).
Production, Transportation and Moving Occupations by Sex
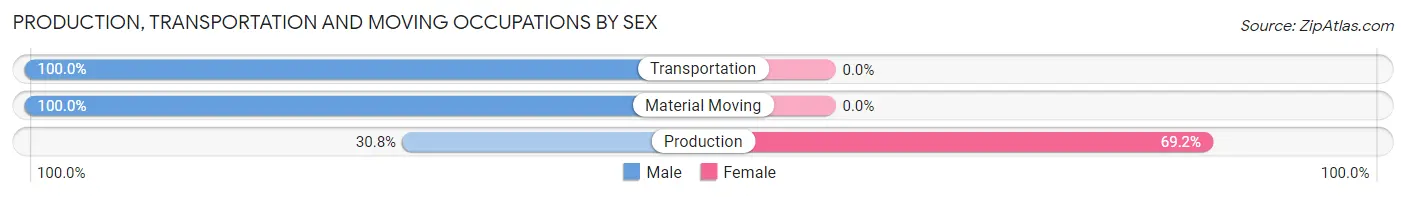
| Occupation | Male | Female |
| Production | 4 (30.8%) | 9 (69.2%) |
| Transportation | 10 (100.0%) | 0 (0.0%) |
| Material Moving | 27 (100.0%) | 0 (0.0%) |
| Total (Category) | 41 (82.0%) | 9 (18.0%) |
| Total (Overall) | 286 (48.2%) | 307 (51.8%) |
Employment Industries by Sex in Stottville
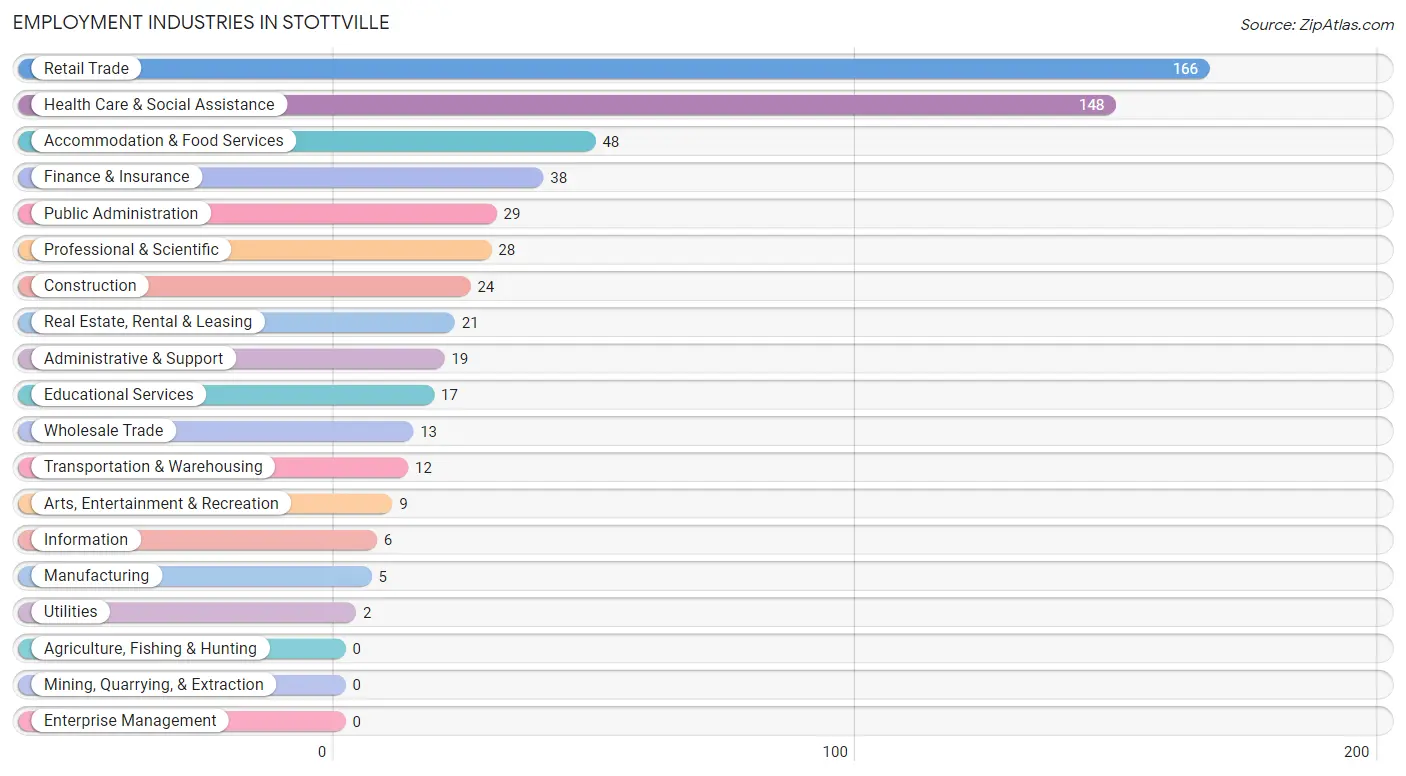
Employment Industries in Stottville
The major employment industries in Stottville include Retail Trade (166 | 28.0%), Health Care & Social Assistance (148 | 25.0%), Accommodation & Food Services (48 | 8.1%), Finance & Insurance (38 | 6.4%), and Public Administration (29 | 4.9%).
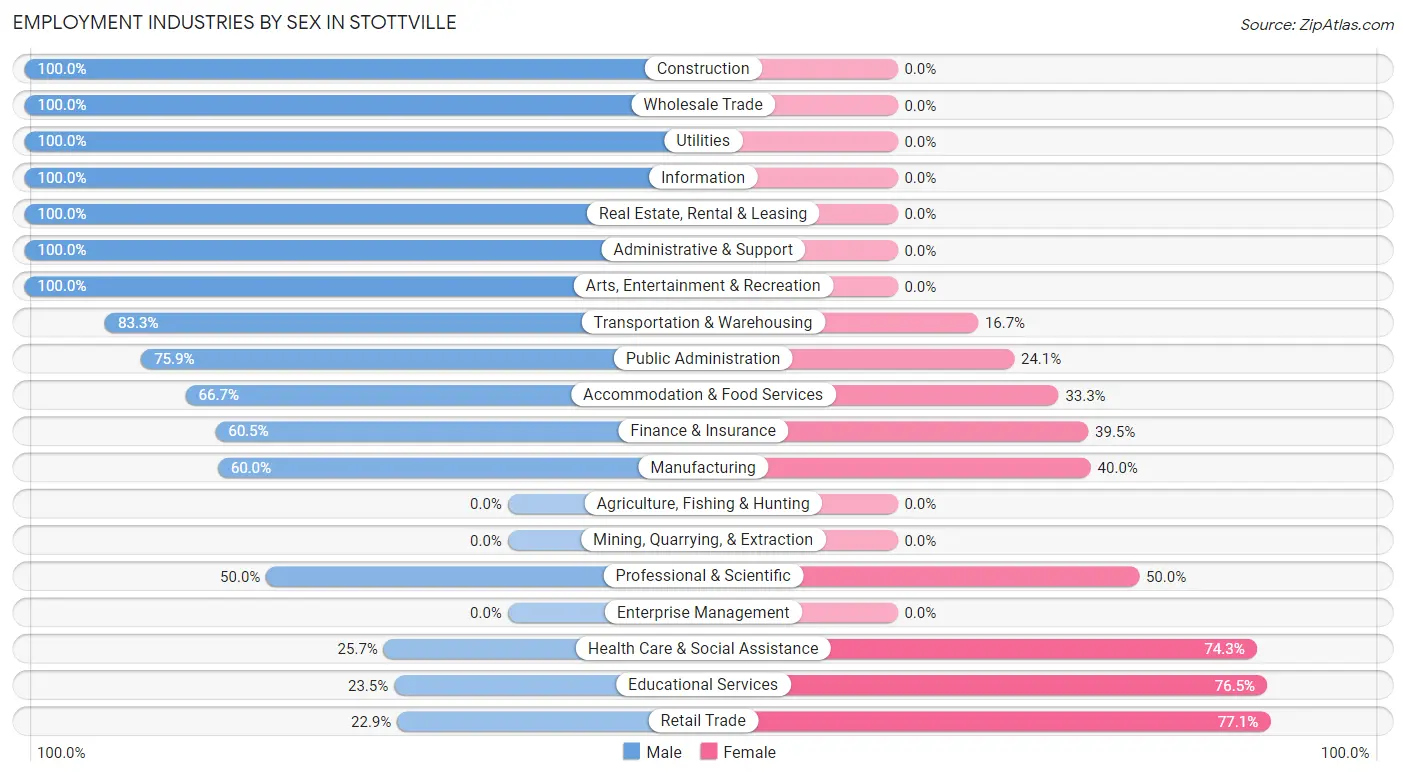
Employment Industries by Sex in Stottville
The Stottville industries that see more men than women are Construction (100.0%), Wholesale Trade (100.0%), and Utilities (100.0%), whereas the industries that tend to have a higher number of women are Retail Trade (77.1%), Educational Services (76.5%), and Health Care & Social Assistance (74.3%).
| Industry | Male | Female |
| Agriculture, Fishing & Hunting | 0 (0.0%) | 0 (0.0%) |
| Mining, Quarrying, & Extraction | 0 (0.0%) | 0 (0.0%) |
| Construction | 24 (100.0%) | 0 (0.0%) |
| Manufacturing | 3 (60.0%) | 2 (40.0%) |
| Wholesale Trade | 13 (100.0%) | 0 (0.0%) |
| Retail Trade | 38 (22.9%) | 128 (77.1%) |
| Transportation & Warehousing | 10 (83.3%) | 2 (16.7%) |
| Utilities | 2 (100.0%) | 0 (0.0%) |
| Information | 6 (100.0%) | 0 (0.0%) |
| Finance & Insurance | 23 (60.5%) | 15 (39.5%) |
| Real Estate, Rental & Leasing | 21 (100.0%) | 0 (0.0%) |
| Professional & Scientific | 14 (50.0%) | 14 (50.0%) |
| Enterprise Management | 0 (0.0%) | 0 (0.0%) |
| Administrative & Support | 19 (100.0%) | 0 (0.0%) |
| Educational Services | 4 (23.5%) | 13 (76.5%) |
| Health Care & Social Assistance | 38 (25.7%) | 110 (74.3%) |
| Arts, Entertainment & Recreation | 9 (100.0%) | 0 (0.0%) |
| Accommodation & Food Services | 32 (66.7%) | 16 (33.3%) |
| Public Administration | 22 (75.9%) | 7 (24.1%) |
| Total | 286 (48.2%) | 307 (51.8%) |
Education in Stottville
School Enrollment in Stottville
The most common levels of schooling among the 241 students in Stottville are middle school (120 | 49.8%), kindergarten (61 | 25.3%), and elementary school (31 | 12.9%).
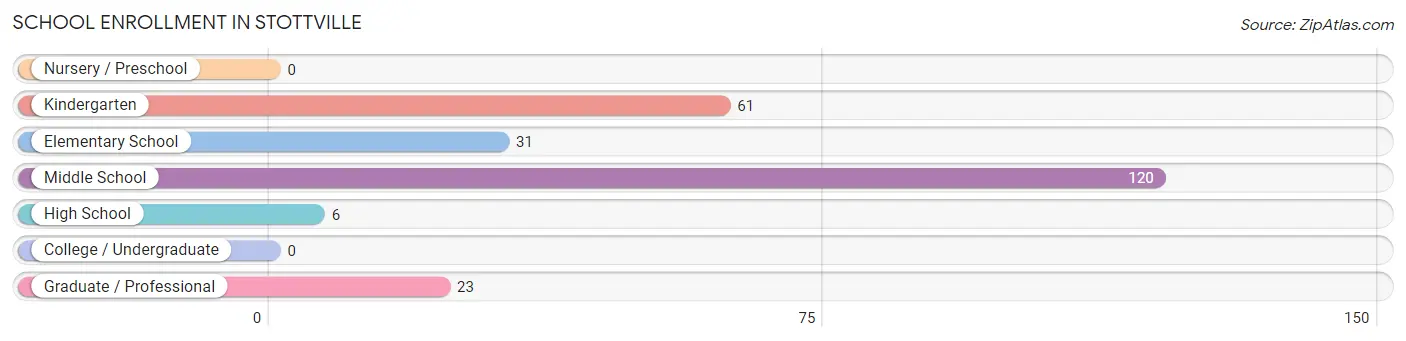
| School Level | # Students | % Students |
| Nursery / Preschool | 0 | 0.0% |
| Kindergarten | 61 | 25.3% |
| Elementary School | 31 | 12.9% |
| Middle School | 120 | 49.8% |
| High School | 6 | 2.5% |
| College / Undergraduate | 0 | 0.0% |
| Graduate / Professional | 23 | 9.5% |
| Total | 241 | 100.0% |
School Enrollment by Age by Funding Source in Stottville
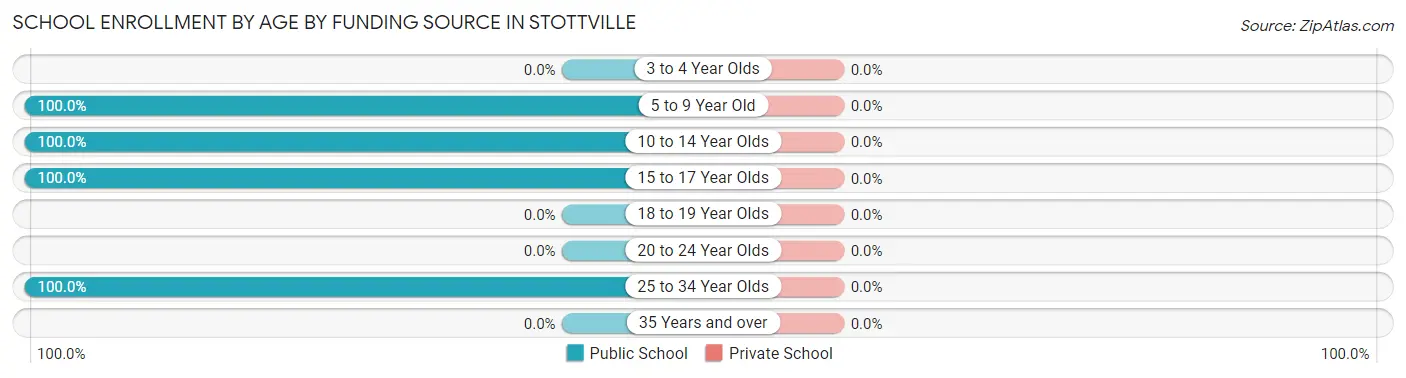
| Age Bracket | Public School | Private School |
| 3 to 4 Year Olds | 0 (0.0%) | 0 (0.0%) |
| 5 to 9 Year Old | 92 (100.0%) | 0 (0.0%) |
| 10 to 14 Year Olds | 120 (100.0%) | 0 (0.0%) |
| 15 to 17 Year Olds | 6 (100.0%) | 0 (0.0%) |
| 18 to 19 Year Olds | 0 (0.0%) | 0 (0.0%) |
| 20 to 24 Year Olds | 0 (0.0%) | 0 (0.0%) |
| 25 to 34 Year Olds | 23 (100.0%) | 0 (0.0%) |
| 35 Years and over | 0 (0.0%) | 0 (0.0%) |
| Total | 241 (100.0%) | 0 (0.0%) |
Educational Attainment by Field of Study in Stottville
Business (53 | 34.9%), visual & performing arts (51 | 33.6%), bio, nature & agricultural (14 | 9.2%), education (14 | 9.2%), and arts & humanities (9 | 5.9%) are the most common fields of study among 152 individuals in Stottville who have obtained a bachelor's degree or higher.
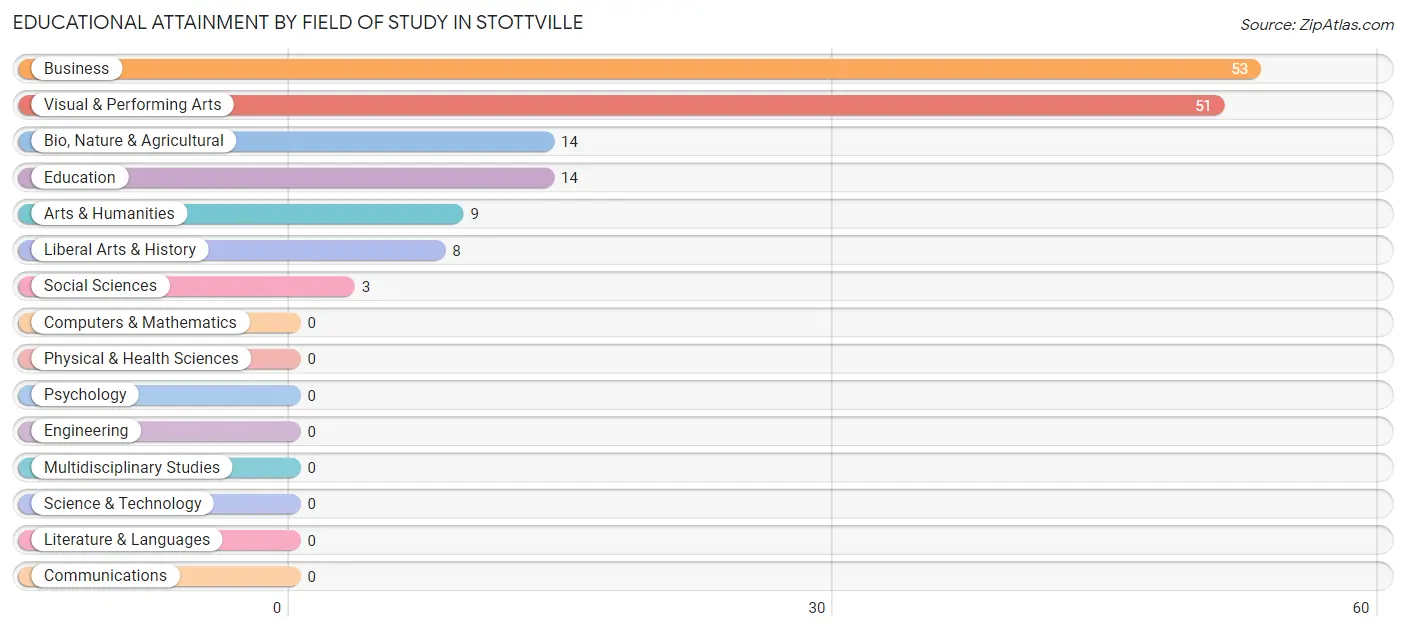
| Field of Study | # Graduates | % Graduates |
| Computers & Mathematics | 0 | 0.0% |
| Bio, Nature & Agricultural | 14 | 9.2% |
| Physical & Health Sciences | 0 | 0.0% |
| Psychology | 0 | 0.0% |
| Social Sciences | 3 | 2.0% |
| Engineering | 0 | 0.0% |
| Multidisciplinary Studies | 0 | 0.0% |
| Science & Technology | 0 | 0.0% |
| Business | 53 | 34.9% |
| Education | 14 | 9.2% |
| Literature & Languages | 0 | 0.0% |
| Liberal Arts & History | 8 | 5.3% |
| Visual & Performing Arts | 51 | 33.6% |
| Communications | 0 | 0.0% |
| Arts & Humanities | 9 | 5.9% |
| Total | 152 | 100.0% |
Transportation & Commute in Stottville
Vehicle Availability by Sex in Stottville
The most prevalent vehicle ownership categories in Stottville are males with 2 vehicles (121, accounting for 42.3%) and females with 2 vehicles (33, making up 44.5%).
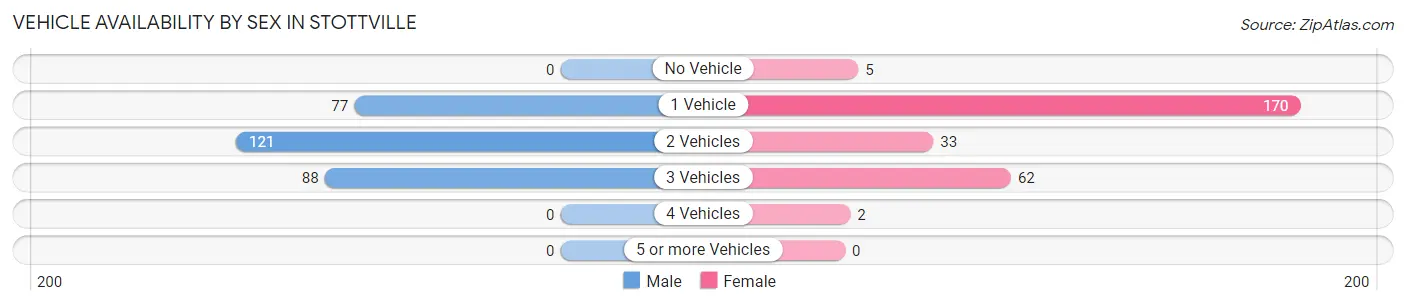
| Vehicles Available | Male | Female |
| No Vehicle | 0 (0.0%) | 5 (1.8%) |
| 1 Vehicle | 77 (26.9%) | 170 (62.5%) |
| 2 Vehicles | 121 (42.3%) | 33 (12.1%) |
| 3 Vehicles | 88 (30.8%) | 62 (22.8%) |
| 4 Vehicles | 0 (0.0%) | 2 (0.7%) |
| 5 or more Vehicles | 0 (0.0%) | 0 (0.0%) |
| Total | 286 (100.0%) | 272 (100.0%) |
Commute Time in Stottville
The most frequently occuring commute durations in Stottville are 5 to 9 minutes (109 commuters, 20.3%), 10 to 14 minutes (77 commuters, 14.4%), and less than 5 minutes (72 commuters, 13.4%).
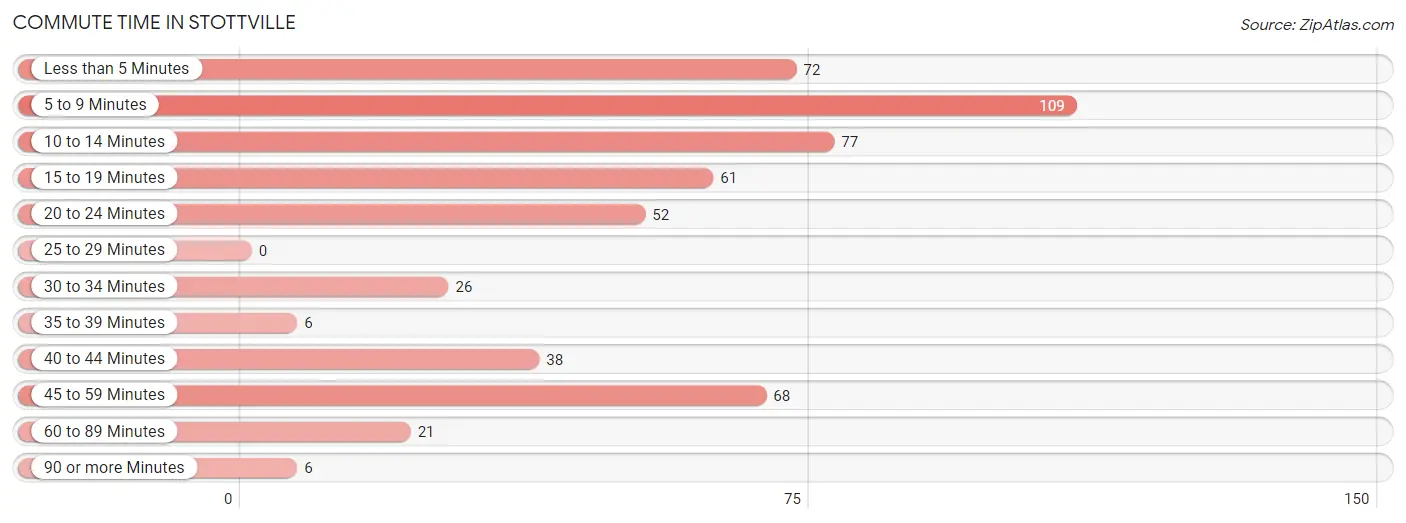
| Commute Time | # Commuters | % Commuters |
| Less than 5 Minutes | 72 | 13.4% |
| 5 to 9 Minutes | 109 | 20.3% |
| 10 to 14 Minutes | 77 | 14.4% |
| 15 to 19 Minutes | 61 | 11.4% |
| 20 to 24 Minutes | 52 | 9.7% |
| 25 to 29 Minutes | 0 | 0.0% |
| 30 to 34 Minutes | 26 | 4.9% |
| 35 to 39 Minutes | 6 | 1.1% |
| 40 to 44 Minutes | 38 | 7.1% |
| 45 to 59 Minutes | 68 | 12.7% |
| 60 to 89 Minutes | 21 | 3.9% |
| 90 or more Minutes | 6 | 1.1% |
Commute Time by Sex in Stottville
The most common commute times in Stottville are 5 to 9 minutes (52 commuters, 19.7%) for males and less than 5 minutes (61 commuters, 22.4%) for females.
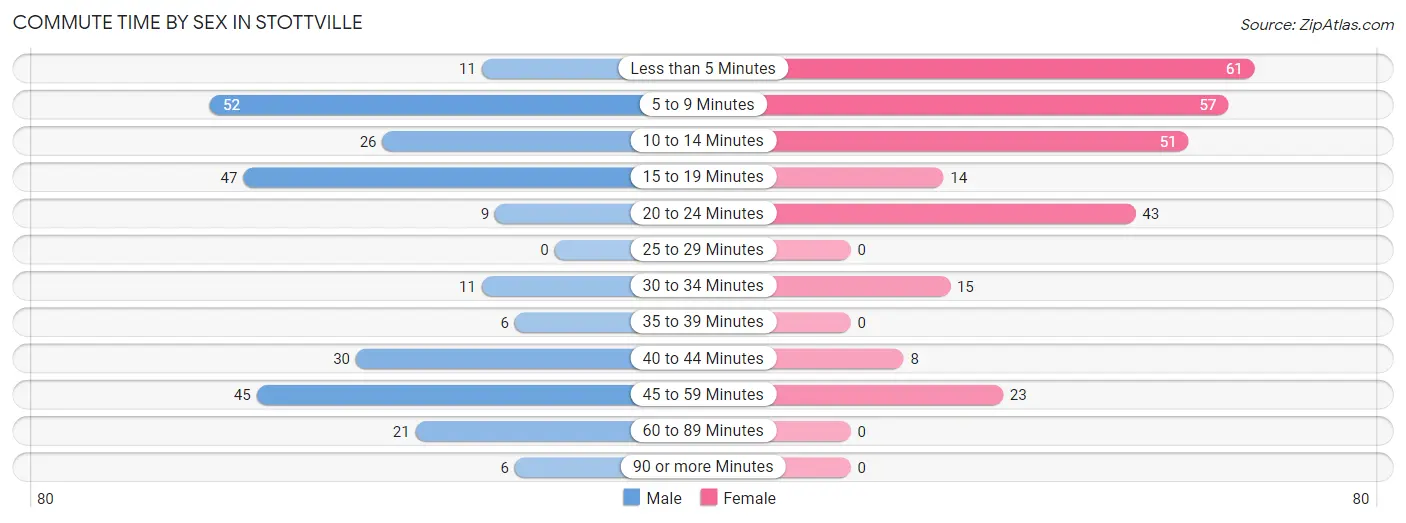
| Commute Time | Male | Female |
| Less than 5 Minutes | 11 (4.2%) | 61 (22.4%) |
| 5 to 9 Minutes | 52 (19.7%) | 57 (21.0%) |
| 10 to 14 Minutes | 26 (9.9%) | 51 (18.8%) |
| 15 to 19 Minutes | 47 (17.8%) | 14 (5.1%) |
| 20 to 24 Minutes | 9 (3.4%) | 43 (15.8%) |
| 25 to 29 Minutes | 0 (0.0%) | 0 (0.0%) |
| 30 to 34 Minutes | 11 (4.2%) | 15 (5.5%) |
| 35 to 39 Minutes | 6 (2.3%) | 0 (0.0%) |
| 40 to 44 Minutes | 30 (11.4%) | 8 (2.9%) |
| 45 to 59 Minutes | 45 (17.1%) | 23 (8.5%) |
| 60 to 89 Minutes | 21 (8.0%) | 0 (0.0%) |
| 90 or more Minutes | 6 (2.3%) | 0 (0.0%) |
Time of Departure to Work by Sex in Stottville
The most frequent times of departure to work in Stottville are 7:00 AM to 7:29 AM (61, 23.1%) for males and 8:30 AM to 8:59 AM (61, 22.4%) for females.
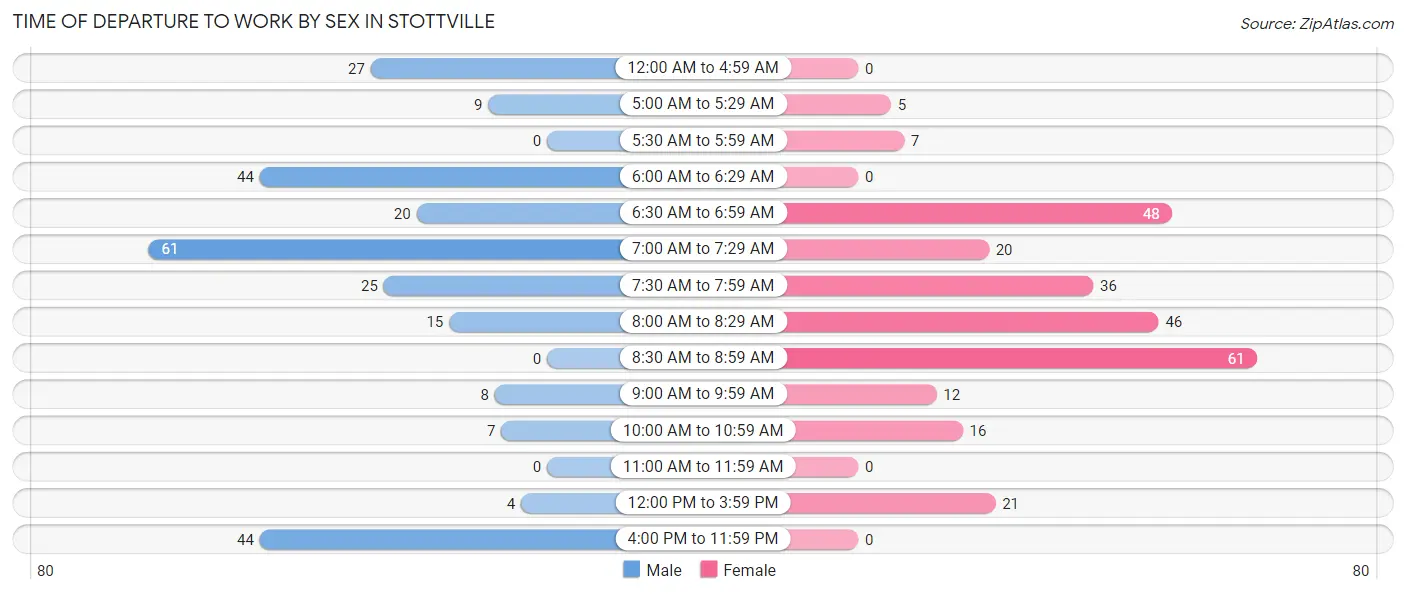
| Time of Departure | Male | Female |
| 12:00 AM to 4:59 AM | 27 (10.2%) | 0 (0.0%) |
| 5:00 AM to 5:29 AM | 9 (3.4%) | 5 (1.8%) |
| 5:30 AM to 5:59 AM | 0 (0.0%) | 7 (2.6%) |
| 6:00 AM to 6:29 AM | 44 (16.7%) | 0 (0.0%) |
| 6:30 AM to 6:59 AM | 20 (7.6%) | 48 (17.6%) |
| 7:00 AM to 7:29 AM | 61 (23.1%) | 20 (7.3%) |
| 7:30 AM to 7:59 AM | 25 (9.5%) | 36 (13.2%) |
| 8:00 AM to 8:29 AM | 15 (5.7%) | 46 (16.9%) |
| 8:30 AM to 8:59 AM | 0 (0.0%) | 61 (22.4%) |
| 9:00 AM to 9:59 AM | 8 (3.0%) | 12 (4.4%) |
| 10:00 AM to 10:59 AM | 7 (2.6%) | 16 (5.9%) |
| 11:00 AM to 11:59 AM | 0 (0.0%) | 0 (0.0%) |
| 12:00 PM to 3:59 PM | 4 (1.5%) | 21 (7.7%) |
| 4:00 PM to 11:59 PM | 44 (16.7%) | 0 (0.0%) |
| Total | 264 (100.0%) | 272 (100.0%) |
Housing Occupancy in Stottville
Occupancy by Ownership in Stottville
Of the total 574 dwellings in Stottville, owner-occupied units account for 239 (41.6%), while renter-occupied units make up 335 (58.4%).
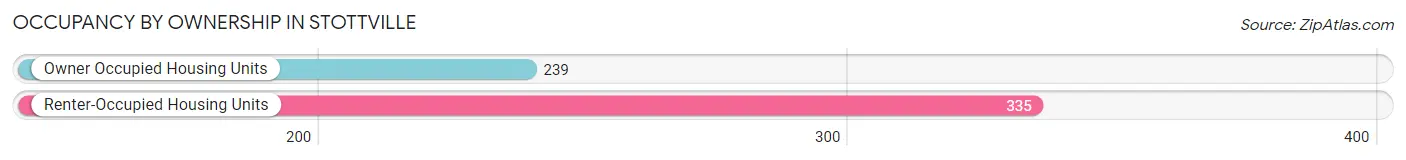
| Occupancy | # Housing Units | % Housing Units |
| Owner Occupied Housing Units | 239 | 41.6% |
| Renter-Occupied Housing Units | 335 | 58.4% |
| Total Occupied Housing Units | 574 | 100.0% |
Occupancy by Household Size in Stottville
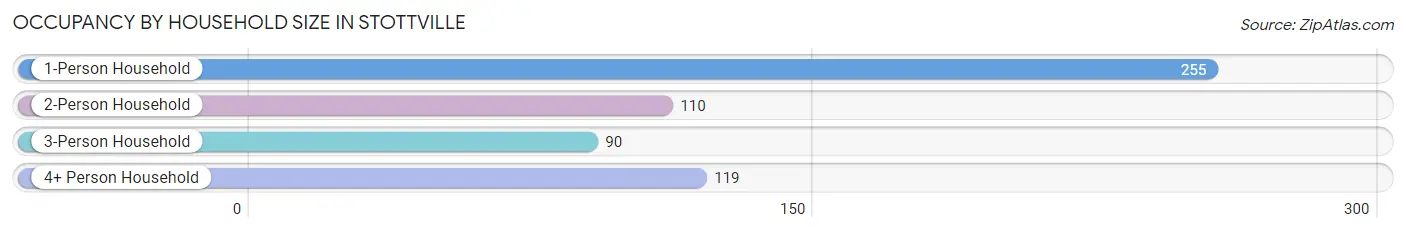
| Household Size | # Housing Units | % Housing Units |
| 1-Person Household | 255 | 44.4% |
| 2-Person Household | 110 | 19.2% |
| 3-Person Household | 90 | 15.7% |
| 4+ Person Household | 119 | 20.7% |
| Total Housing Units | 574 | 100.0% |
Occupancy by Ownership by Household Size in Stottville
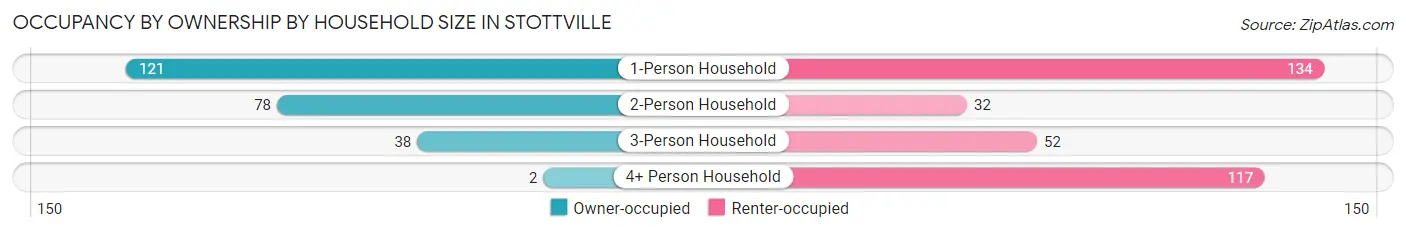
| Household Size | Owner-occupied | Renter-occupied |
| 1-Person Household | 121 (47.4%) | 134 (52.5%) |
| 2-Person Household | 78 (70.9%) | 32 (29.1%) |
| 3-Person Household | 38 (42.2%) | 52 (57.8%) |
| 4+ Person Household | 2 (1.7%) | 117 (98.3%) |
| Total Housing Units | 239 (41.6%) | 335 (58.4%) |
Occupancy by Educational Attainment in Stottville
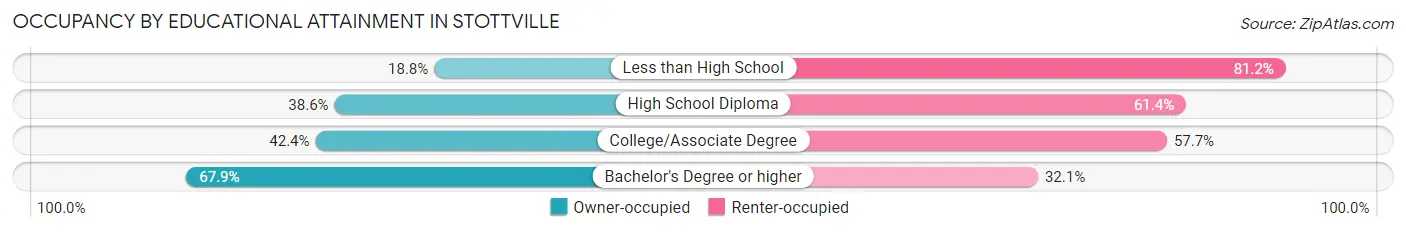
| Household Size | Owner-occupied | Renter-occupied |
| Less than High School | 19 (18.8%) | 82 (81.2%) |
| High School Diploma | 76 (38.6%) | 121 (61.4%) |
| College/Associate Degree | 72 (42.3%) | 98 (57.7%) |
| Bachelor's Degree or higher | 72 (67.9%) | 34 (32.1%) |
Occupancy by Age of Householder in Stottville
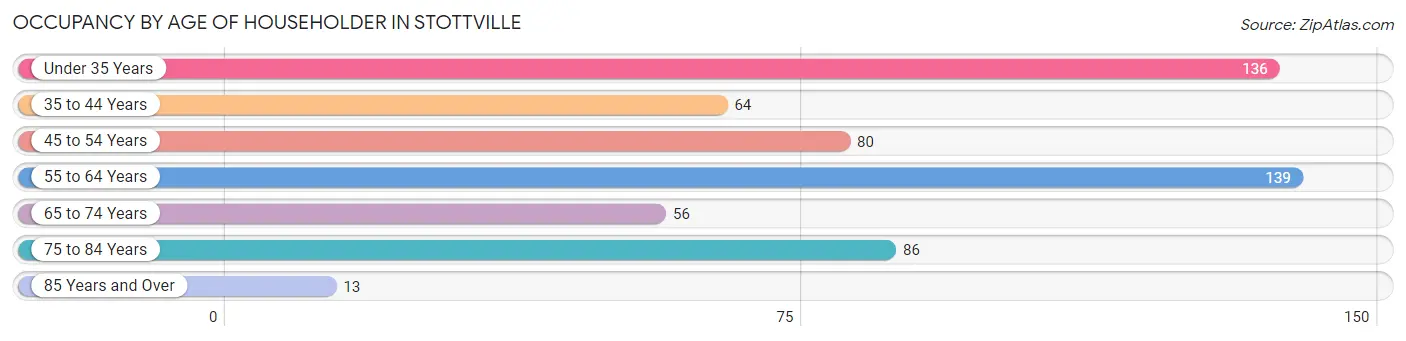
| Age Bracket | # Households | % Households |
| Under 35 Years | 136 | 23.7% |
| 35 to 44 Years | 64 | 11.2% |
| 45 to 54 Years | 80 | 13.9% |
| 55 to 64 Years | 139 | 24.2% |
| 65 to 74 Years | 56 | 9.8% |
| 75 to 84 Years | 86 | 15.0% |
| 85 Years and Over | 13 | 2.3% |
| Total | 574 | 100.0% |
Housing Finances in Stottville
Median Income by Occupancy in Stottville

| Occupancy Type | # Households | Median Income |
| Owner-Occupied | 239 (41.6%) | $80,139 |
| Renter-Occupied | 335 (58.4%) | $41,799 |
| Average | 574 (100.0%) | $56,667 |
Occupancy by Householder Income Bracket in Stottville
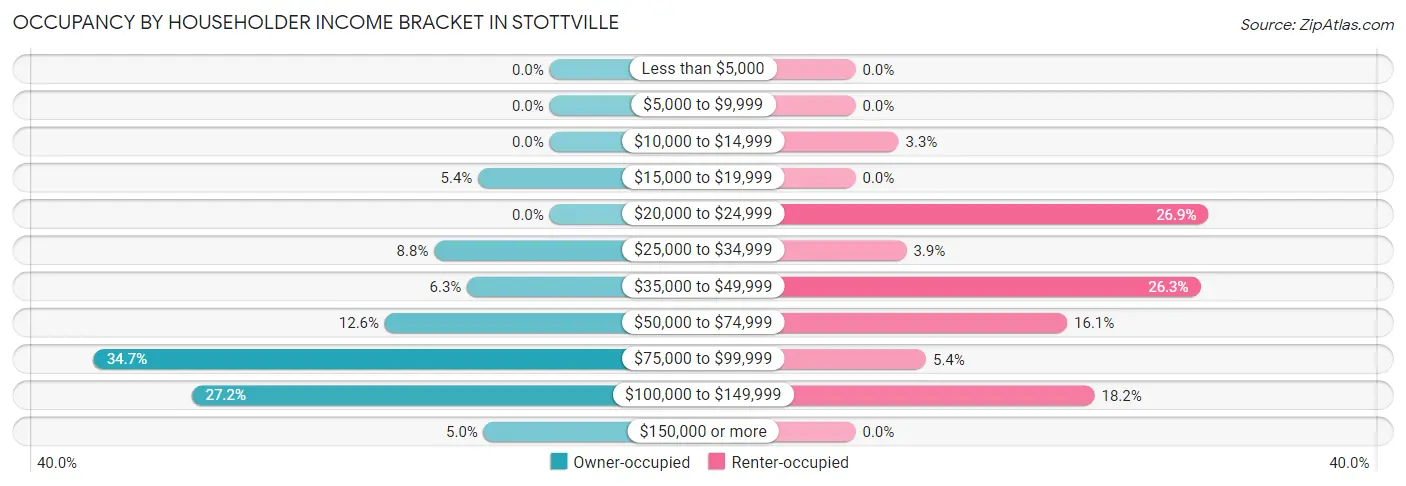
| Income Bracket | Owner-occupied | Renter-occupied |
| Less than $5,000 | 0 (0.0%) | 0 (0.0%) |
| $5,000 to $9,999 | 0 (0.0%) | 0 (0.0%) |
| $10,000 to $14,999 | 0 (0.0%) | 11 (3.3%) |
| $15,000 to $19,999 | 13 (5.4%) | 0 (0.0%) |
| $20,000 to $24,999 | 0 (0.0%) | 90 (26.9%) |
| $25,000 to $34,999 | 21 (8.8%) | 13 (3.9%) |
| $35,000 to $49,999 | 15 (6.3%) | 88 (26.3%) |
| $50,000 to $74,999 | 30 (12.6%) | 54 (16.1%) |
| $75,000 to $99,999 | 83 (34.7%) | 18 (5.4%) |
| $100,000 to $149,999 | 65 (27.2%) | 61 (18.2%) |
| $150,000 or more | 12 (5.0%) | 0 (0.0%) |
| Total | 239 (100.0%) | 335 (100.0%) |
Monthly Housing Cost Tiers in Stottville
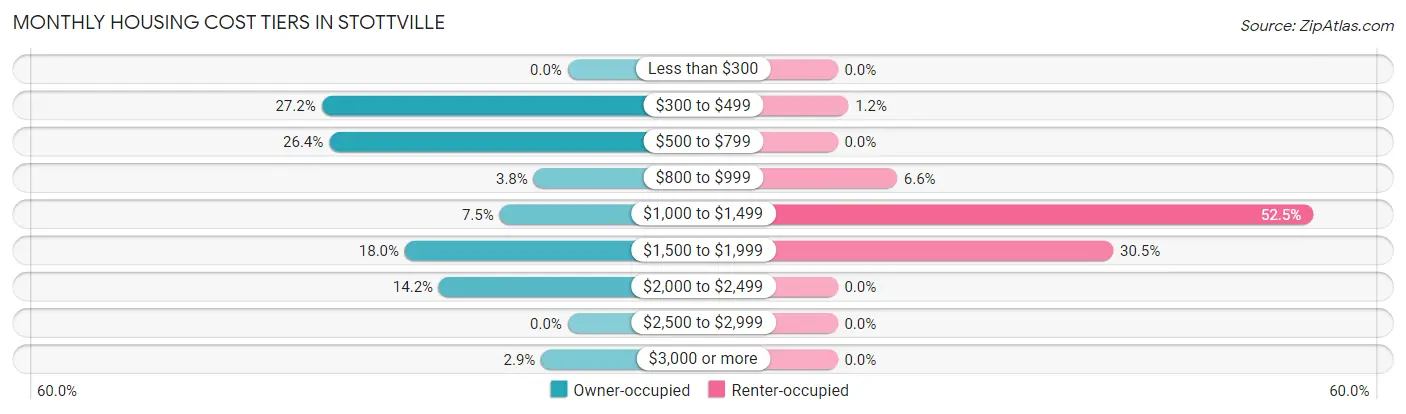
| Monthly Cost | Owner-occupied | Renter-occupied |
| Less than $300 | 0 (0.0%) | 0 (0.0%) |
| $300 to $499 | 65 (27.2%) | 4 (1.2%) |
| $500 to $799 | 63 (26.4%) | 0 (0.0%) |
| $800 to $999 | 9 (3.8%) | 22 (6.6%) |
| $1,000 to $1,499 | 18 (7.5%) | 176 (52.5%) |
| $1,500 to $1,999 | 43 (18.0%) | 102 (30.4%) |
| $2,000 to $2,499 | 34 (14.2%) | 0 (0.0%) |
| $2,500 to $2,999 | 0 (0.0%) | 0 (0.0%) |
| $3,000 or more | 7 (2.9%) | 0 (0.0%) |
| Total | 239 (100.0%) | 335 (100.0%) |
Physical Housing Characteristics in Stottville
Housing Structures in Stottville
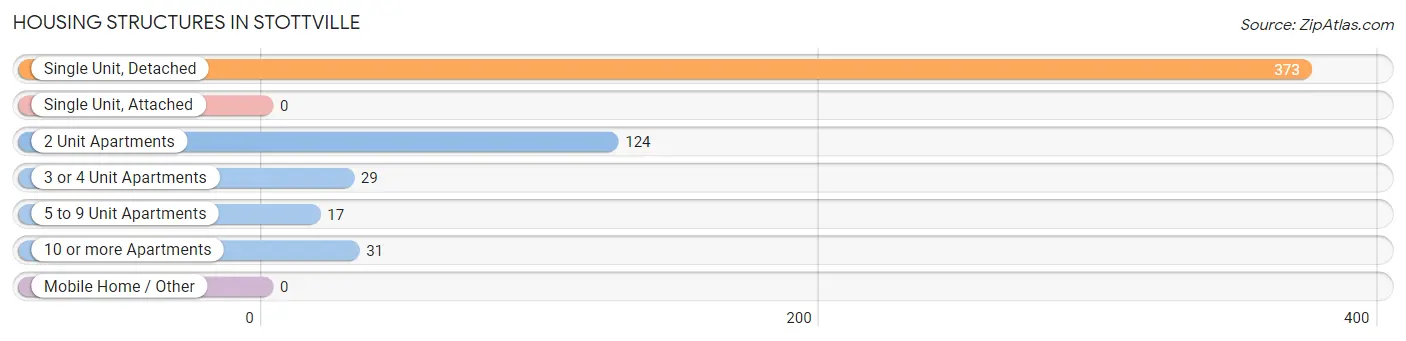
| Structure Type | # Housing Units | % Housing Units |
| Single Unit, Detached | 373 | 65.0% |
| Single Unit, Attached | 0 | 0.0% |
| 2 Unit Apartments | 124 | 21.6% |
| 3 or 4 Unit Apartments | 29 | 5.1% |
| 5 to 9 Unit Apartments | 17 | 3.0% |
| 10 or more Apartments | 31 | 5.4% |
| Mobile Home / Other | 0 | 0.0% |
| Total | 574 | 100.0% |
Housing Structures by Occupancy in Stottville
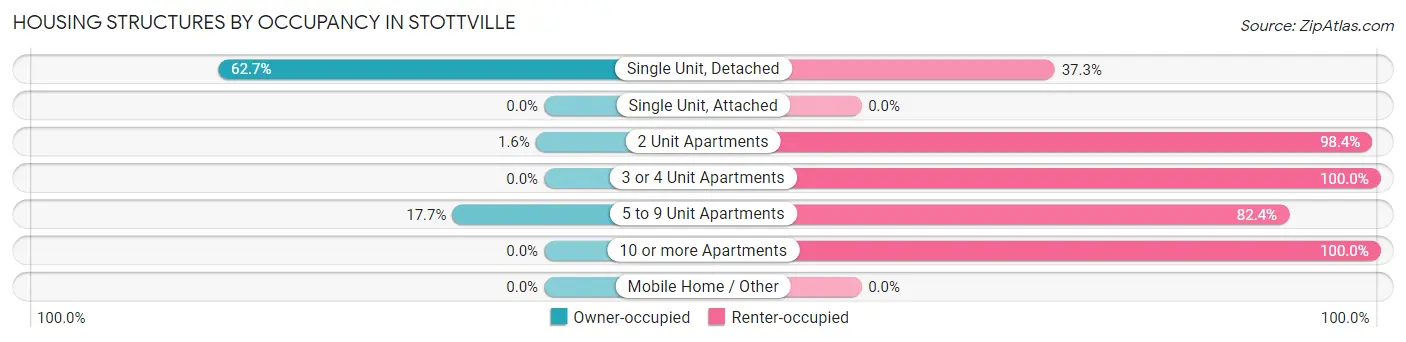
| Structure Type | Owner-occupied | Renter-occupied |
| Single Unit, Detached | 234 (62.7%) | 139 (37.3%) |
| Single Unit, Attached | 0 (0.0%) | 0 (0.0%) |
| 2 Unit Apartments | 2 (1.6%) | 122 (98.4%) |
| 3 or 4 Unit Apartments | 0 (0.0%) | 29 (100.0%) |
| 5 to 9 Unit Apartments | 3 (17.6%) | 14 (82.4%) |
| 10 or more Apartments | 0 (0.0%) | 31 (100.0%) |
| Mobile Home / Other | 0 (0.0%) | 0 (0.0%) |
| Total | 239 (41.6%) | 335 (58.4%) |
Housing Structures by Number of Rooms in Stottville
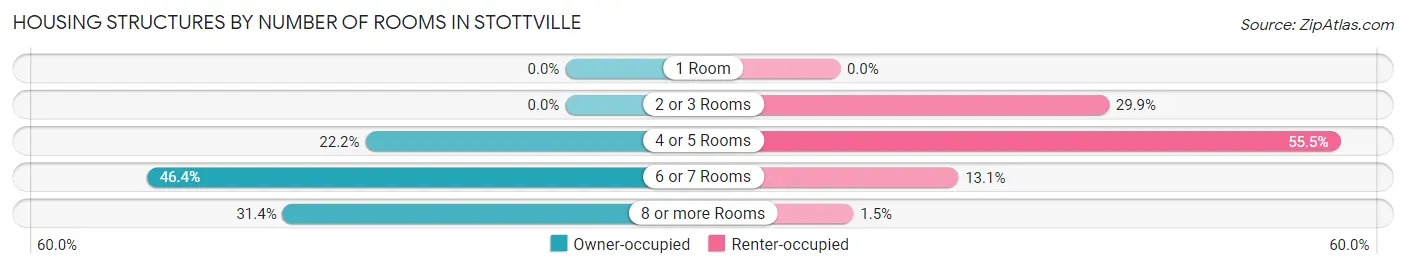
| Number of Rooms | Owner-occupied | Renter-occupied |
| 1 Room | 0 (0.0%) | 0 (0.0%) |
| 2 or 3 Rooms | 0 (0.0%) | 100 (29.8%) |
| 4 or 5 Rooms | 53 (22.2%) | 186 (55.5%) |
| 6 or 7 Rooms | 111 (46.4%) | 44 (13.1%) |
| 8 or more Rooms | 75 (31.4%) | 5 (1.5%) |
| Total | 239 (100.0%) | 335 (100.0%) |
Housing Structure by Heating Type in Stottville
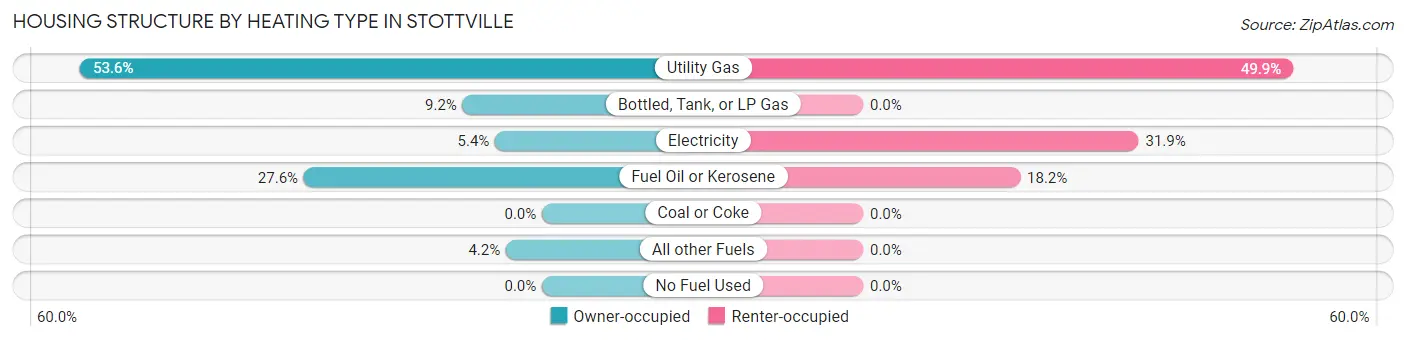
| Heating Type | Owner-occupied | Renter-occupied |
| Utility Gas | 128 (53.6%) | 167 (49.8%) |
| Bottled, Tank, or LP Gas | 22 (9.2%) | 0 (0.0%) |
| Electricity | 13 (5.4%) | 107 (31.9%) |
| Fuel Oil or Kerosene | 66 (27.6%) | 61 (18.2%) |
| Coal or Coke | 0 (0.0%) | 0 (0.0%) |
| All other Fuels | 10 (4.2%) | 0 (0.0%) |
| No Fuel Used | 0 (0.0%) | 0 (0.0%) |
| Total | 239 (100.0%) | 335 (100.0%) |
Household Vehicle Usage in Stottville
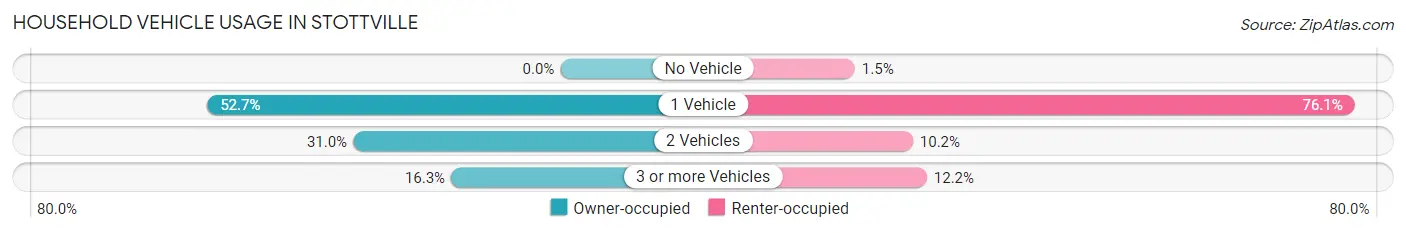
| Vehicles per Household | Owner-occupied | Renter-occupied |
| No Vehicle | 0 (0.0%) | 5 (1.5%) |
| 1 Vehicle | 126 (52.7%) | 255 (76.1%) |
| 2 Vehicles | 74 (31.0%) | 34 (10.2%) |
| 3 or more Vehicles | 39 (16.3%) | 41 (12.2%) |
| Total | 239 (100.0%) | 335 (100.0%) |
Real Estate & Mortgages in Stottville
Real Estate and Mortgage Overview in Stottville
| Characteristic | Without Mortgage | With Mortgage |
| Housing Units | 122 | 117 |
| Median Property Value | $124,600 | $199,500 |
| Median Household Income | $75,857 | $10 |
| Monthly Housing Costs | $494 | $7 |
| Real Estate Taxes | $3,119 | $9 |
Property Value by Mortgage Status in Stottville
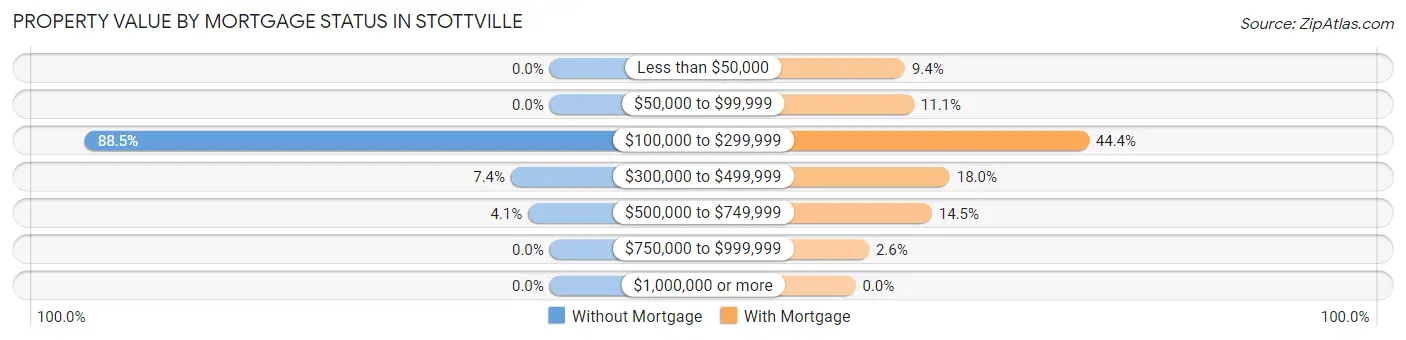
| Property Value | Without Mortgage | With Mortgage |
| Less than $50,000 | 0 (0.0%) | 11 (9.4%) |
| $50,000 to $99,999 | 0 (0.0%) | 13 (11.1%) |
| $100,000 to $299,999 | 108 (88.5%) | 52 (44.4%) |
| $300,000 to $499,999 | 9 (7.4%) | 21 (17.9%) |
| $500,000 to $749,999 | 5 (4.1%) | 17 (14.5%) |
| $750,000 to $999,999 | 0 (0.0%) | 3 (2.6%) |
| $1,000,000 or more | 0 (0.0%) | 0 (0.0%) |
| Total | 122 (100.0%) | 117 (100.0%) |
Household Income by Mortgage Status in Stottville
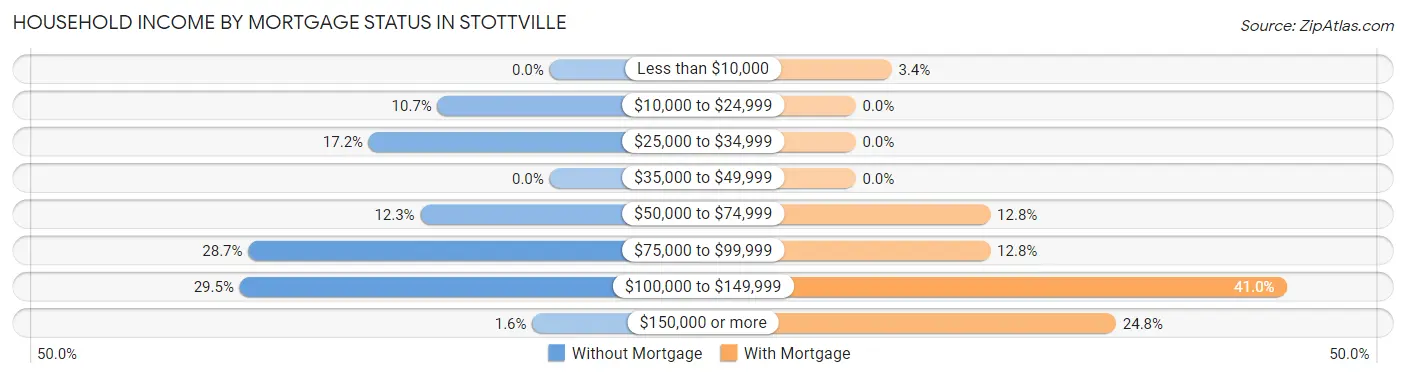
| Household Income | Without Mortgage | With Mortgage |
| Less than $10,000 | 0 (0.0%) | 4 (3.4%) |
| $10,000 to $24,999 | 13 (10.7%) | 0 (0.0%) |
| $25,000 to $34,999 | 21 (17.2%) | 0 (0.0%) |
| $35,000 to $49,999 | 0 (0.0%) | 0 (0.0%) |
| $50,000 to $74,999 | 15 (12.3%) | 15 (12.8%) |
| $75,000 to $99,999 | 35 (28.7%) | 15 (12.8%) |
| $100,000 to $149,999 | 36 (29.5%) | 48 (41.0%) |
| $150,000 or more | 2 (1.6%) | 29 (24.8%) |
| Total | 122 (100.0%) | 117 (100.0%) |
Property Value to Household Income Ratio in Stottville
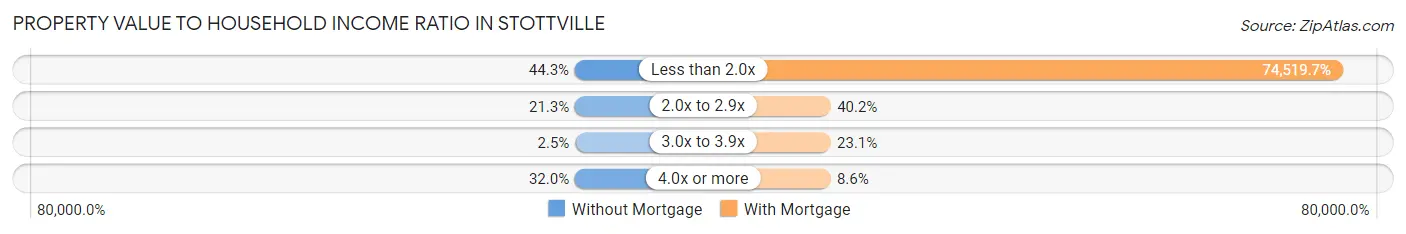
| Value-to-Income Ratio | Without Mortgage | With Mortgage |
| Less than 2.0x | 54 (44.3%) | 87,188 (74,519.7%) |
| 2.0x to 2.9x | 26 (21.3%) | 47 (40.2%) |
| 3.0x to 3.9x | 3 (2.5%) | 27 (23.1%) |
| 4.0x or more | 39 (32.0%) | 10 (8.6%) |
| Total | 122 (100.0%) | 117 (100.0%) |
Real Estate Taxes by Mortgage Status in Stottville
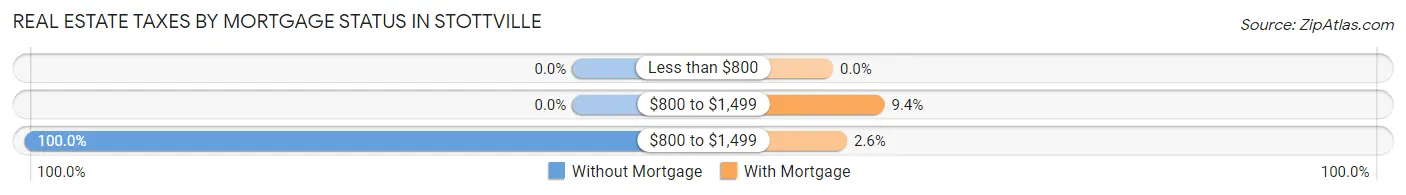
| Property Taxes | Without Mortgage | With Mortgage |
| Less than $800 | 0 (0.0%) | 0 (0.0%) |
| $800 to $1,499 | 0 (0.0%) | 11 (9.4%) |
| $800 to $1,499 | 122 (100.0%) | 3 (2.6%) |
| Total | 122 (100.0%) | 117 (100.0%) |
Health & Disability in Stottville
Health Insurance Coverage by Age in Stottville
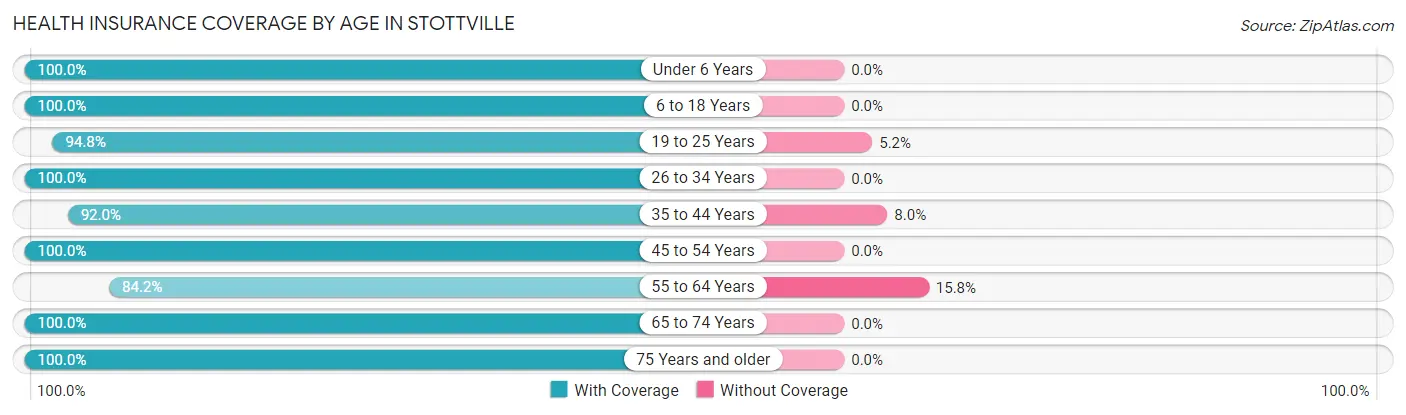
| Age Bracket | With Coverage | Without Coverage |
| Under 6 Years | 133 (100.0%) | 0 (0.0%) |
| 6 to 18 Years | 157 (100.0%) | 0 (0.0%) |
| 19 to 25 Years | 127 (94.8%) | 7 (5.2%) |
| 26 to 34 Years | 128 (100.0%) | 0 (0.0%) |
| 35 to 44 Years | 103 (92.0%) | 9 (8.0%) |
| 45 to 54 Years | 88 (100.0%) | 0 (0.0%) |
| 55 to 64 Years | 187 (84.2%) | 35 (15.8%) |
| 65 to 74 Years | 87 (100.0%) | 0 (0.0%) |
| 75 Years and older | 125 (100.0%) | 0 (0.0%) |
| Total | 1,135 (95.7%) | 51 (4.3%) |
Health Insurance Coverage by Citizenship Status in Stottville
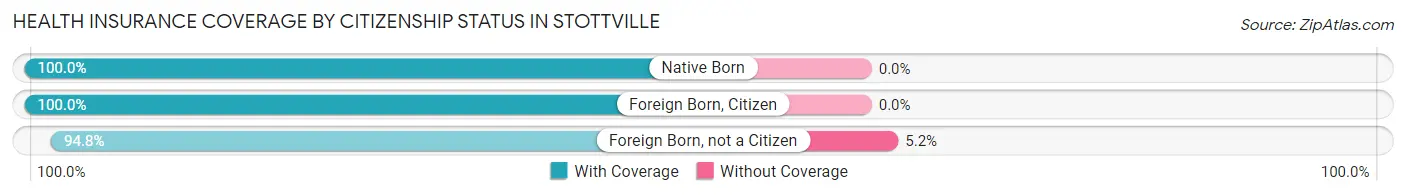
| Citizenship Status | With Coverage | Without Coverage |
| Native Born | 133 (100.0%) | 0 (0.0%) |
| Foreign Born, Citizen | 157 (100.0%) | 0 (0.0%) |
| Foreign Born, not a Citizen | 127 (94.8%) | 7 (5.2%) |
Health Insurance Coverage by Household Income in Stottville
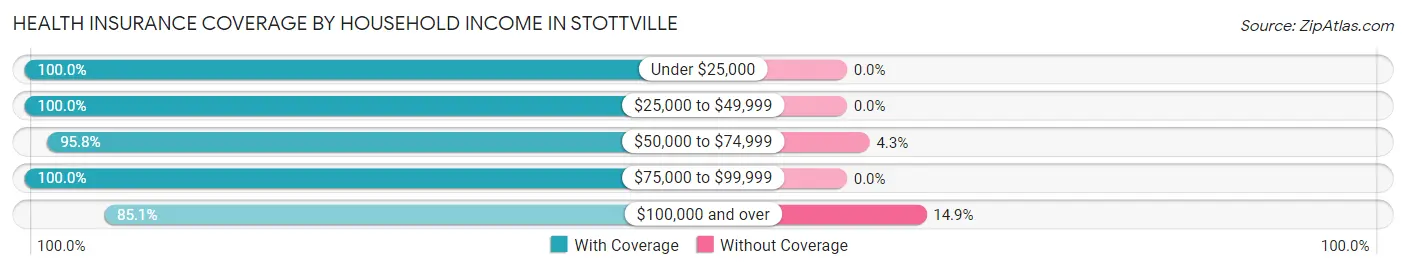
| Household Income | With Coverage | Without Coverage |
| Under $25,000 | 145 (100.0%) | 0 (0.0%) |
| $25,000 to $49,999 | 322 (100.0%) | 0 (0.0%) |
| $50,000 to $74,999 | 203 (95.8%) | 9 (4.3%) |
| $75,000 to $99,999 | 213 (100.0%) | 0 (0.0%) |
| $100,000 and over | 240 (85.1%) | 42 (14.9%) |
Public vs Private Health Insurance Coverage by Age in Stottville
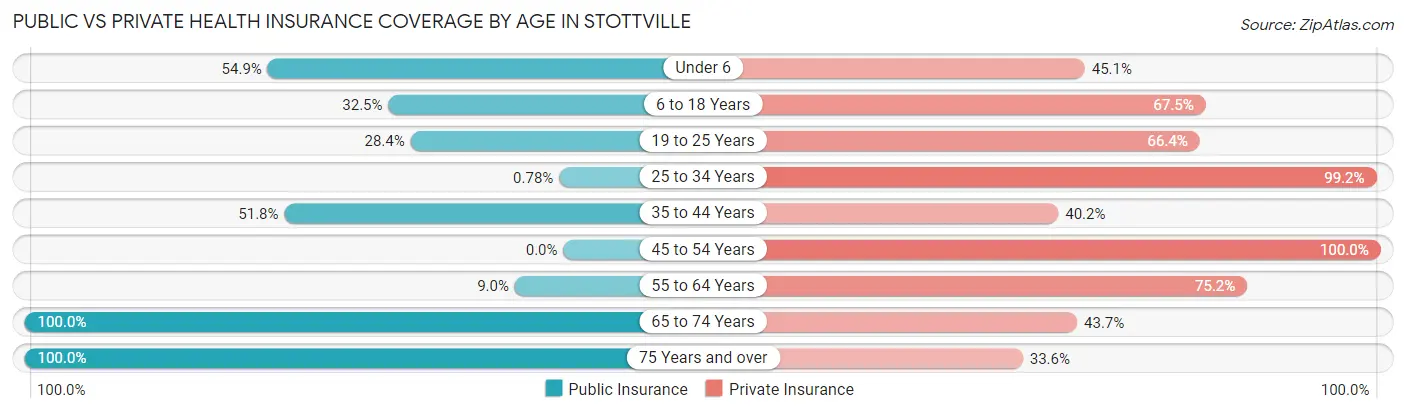
| Age Bracket | Public Insurance | Private Insurance |
| Under 6 | 73 (54.9%) | 60 (45.1%) |
| 6 to 18 Years | 51 (32.5%) | 106 (67.5%) |
| 19 to 25 Years | 38 (28.4%) | 89 (66.4%) |
| 25 to 34 Years | 1 (0.8%) | 127 (99.2%) |
| 35 to 44 Years | 58 (51.8%) | 45 (40.2%) |
| 45 to 54 Years | 0 (0.0%) | 88 (100.0%) |
| 55 to 64 Years | 20 (9.0%) | 167 (75.2%) |
| 65 to 74 Years | 87 (100.0%) | 38 (43.7%) |
| 75 Years and over | 125 (100.0%) | 42 (33.6%) |
| Total | 453 (38.2%) | 762 (64.2%) |
Disability Status by Sex by Age in Stottville
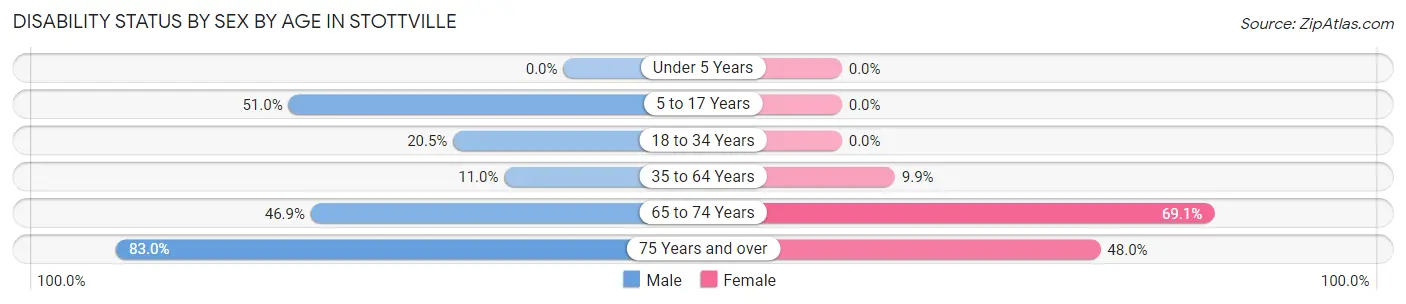
| Age Bracket | Male | Female |
| Under 5 Years | 0 (0.0%) | 0 (0.0%) |
| 5 to 17 Years | 75 (51.0%) | 0 (0.0%) |
| 18 to 34 Years | 27 (20.4%) | 0 (0.0%) |
| 35 to 64 Years | 24 (11.0%) | 20 (9.9%) |
| 65 to 74 Years | 15 (46.9%) | 38 (69.1%) |
| 75 Years and over | 83 (83.0%) | 12 (48.0%) |
Disability Class by Sex by Age in Stottville
Disability Class: Hearing Difficulty
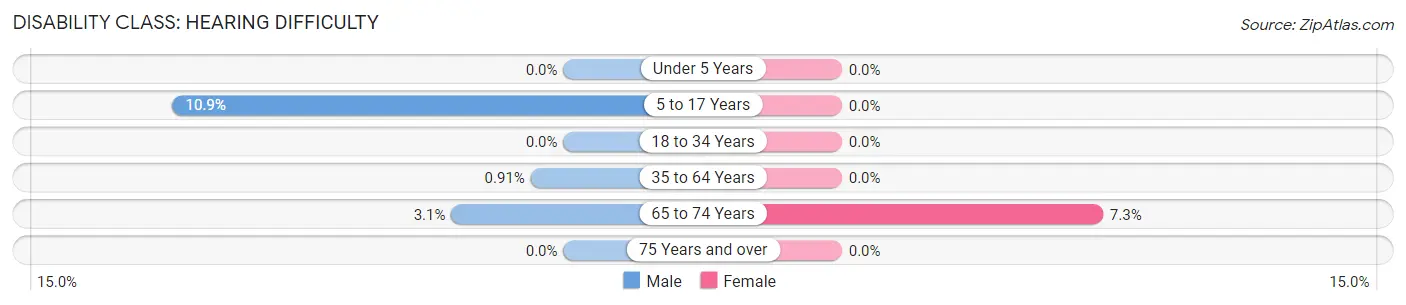
| Age Bracket | Male | Female |
| Under 5 Years | 0 (0.0%) | 0 (0.0%) |
| 5 to 17 Years | 16 (10.9%) | 0 (0.0%) |
| 18 to 34 Years | 0 (0.0%) | 0 (0.0%) |
| 35 to 64 Years | 2 (0.9%) | 0 (0.0%) |
| 65 to 74 Years | 1 (3.1%) | 4 (7.3%) |
| 75 Years and over | 0 (0.0%) | 0 (0.0%) |
Disability Class: Vision Difficulty
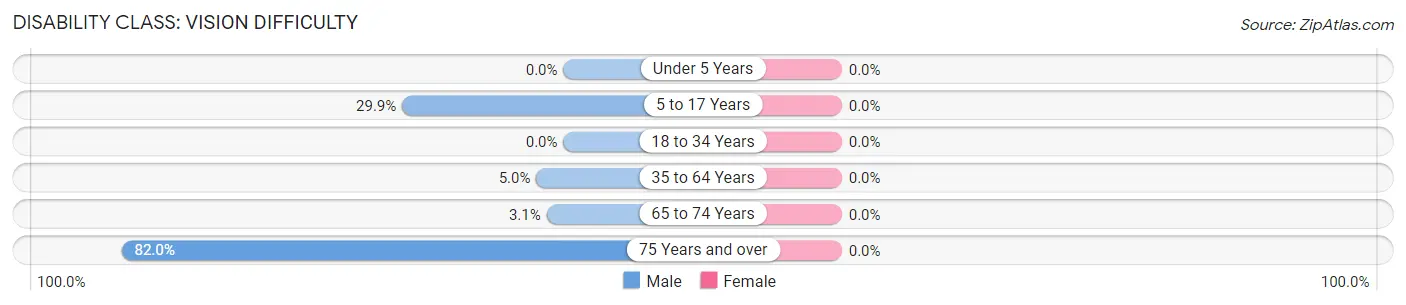
| Age Bracket | Male | Female |
| Under 5 Years | 0 (0.0%) | 0 (0.0%) |
| 5 to 17 Years | 44 (29.9%) | 0 (0.0%) |
| 18 to 34 Years | 0 (0.0%) | 0 (0.0%) |
| 35 to 64 Years | 11 (5.0%) | 0 (0.0%) |
| 65 to 74 Years | 1 (3.1%) | 0 (0.0%) |
| 75 Years and over | 82 (82.0%) | 0 (0.0%) |
Disability Class: Cognitive Difficulty
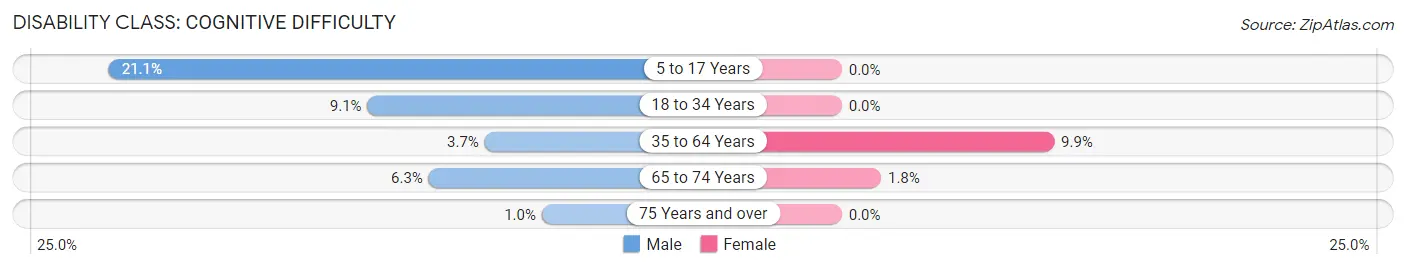
| Age Bracket | Male | Female |
| 5 to 17 Years | 31 (21.1%) | 0 (0.0%) |
| 18 to 34 Years | 12 (9.1%) | 0 (0.0%) |
| 35 to 64 Years | 8 (3.6%) | 20 (9.9%) |
| 65 to 74 Years | 2 (6.2%) | 1 (1.8%) |
| 75 Years and over | 1 (1.0%) | 0 (0.0%) |
Disability Class: Ambulatory Difficulty
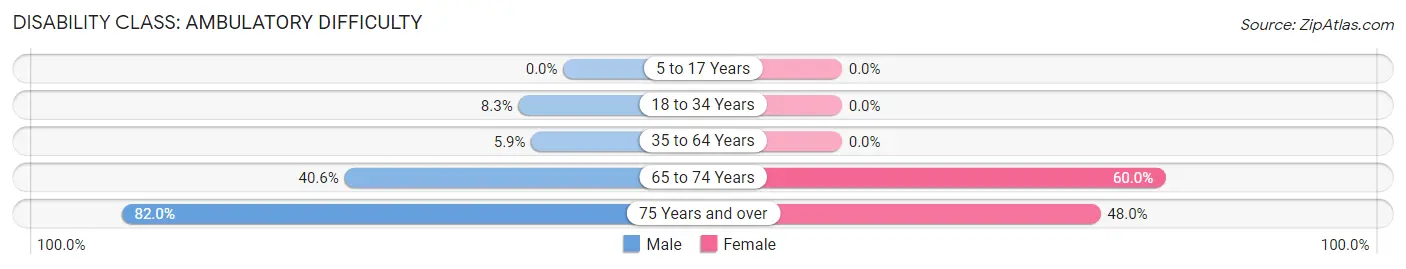
| Age Bracket | Male | Female |
| 5 to 17 Years | 0 (0.0%) | 0 (0.0%) |
| 18 to 34 Years | 11 (8.3%) | 0 (0.0%) |
| 35 to 64 Years | 13 (5.9%) | 0 (0.0%) |
| 65 to 74 Years | 13 (40.6%) | 33 (60.0%) |
| 75 Years and over | 82 (82.0%) | 12 (48.0%) |
Disability Class: Self-Care Difficulty
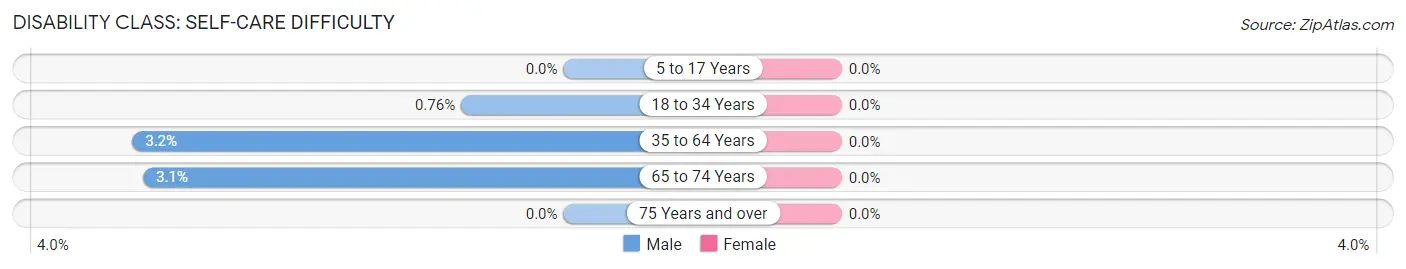
| Age Bracket | Male | Female |
| 5 to 17 Years | 0 (0.0%) | 0 (0.0%) |
| 18 to 34 Years | 1 (0.8%) | 0 (0.0%) |
| 35 to 64 Years | 7 (3.2%) | 0 (0.0%) |
| 65 to 74 Years | 1 (3.1%) | 0 (0.0%) |
| 75 Years and over | 0 (0.0%) | 0 (0.0%) |
Technology Access in Stottville
Computing Device Access in Stottville
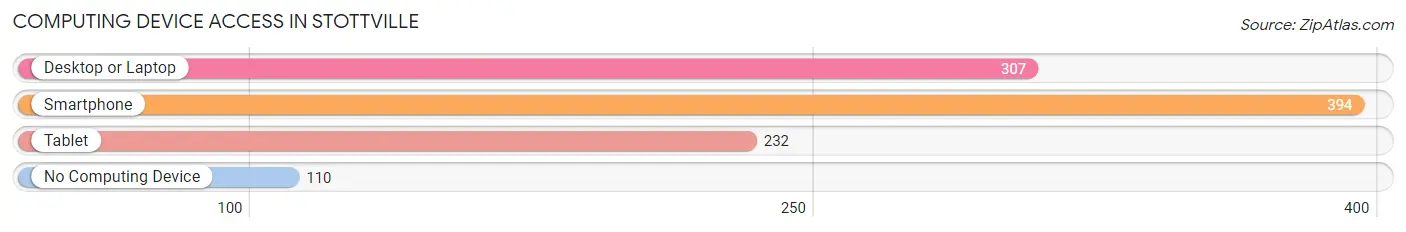
| Device Type | # Households | % Households |
| Desktop or Laptop | 307 | 53.5% |
| Smartphone | 394 | 68.6% |
| Tablet | 232 | 40.4% |
| No Computing Device | 110 | 19.2% |
| Total | 574 | 100.0% |
Internet Access in Stottville
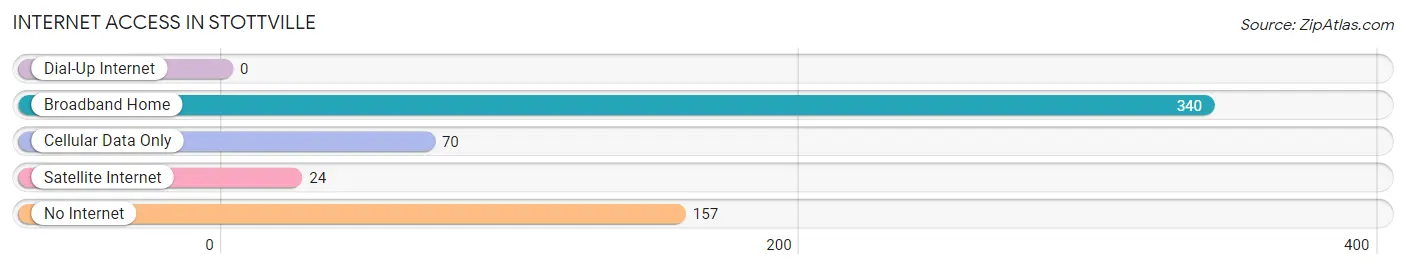
| Internet Type | # Households | % Households |
| Dial-Up Internet | 0 | 0.0% |
| Broadband Home | 340 | 59.2% |
| Cellular Data Only | 70 | 12.2% |
| Satellite Internet | 24 | 4.2% |
| No Internet | 157 | 27.4% |
| Total | 574 | 100.0% |
Stottville Summary
Stottville is a hamlet located in the town of Stockport in Columbia County, New York. It is situated on the east bank of the Hudson River, about two miles south of the village of Hudson. The hamlet is named after the Stott family, who were among the first settlers in the area.
History
The Stott family was among the first settlers in the area, arriving in the late 1700s. The family built a grist mill and a saw mill on the banks of the Hudson River, which provided the foundation for the hamlet’s economy. The Stott family also built a store and a post office, which was established in 1825.
The hamlet was originally known as Stott’s Mills, but the name was changed to Stottville in 1845. The hamlet grew steadily throughout the 19th century, and by the early 20th century, it had become a thriving community with a population of over 500 people.
The hamlet was home to several industries, including a brickyard, a tannery, a furniture factory, and a paper mill. The paper mill was the largest employer in the area, and it provided jobs for many of the local residents.
The hamlet was also home to several churches, including the Stottville Methodist Church, which was established in 1845. The church is still active today, and it is the oldest church in the hamlet.
Geography
Stottville is located in the town of Stockport in Columbia County, New York. It is situated on the east bank of the Hudson River, about two miles south of the village of Hudson. The hamlet is bordered by the towns of Claverack and Ghent to the north, and the towns of Stuyvesant and Kinderhook to the south.
The hamlet is located in a rural area, and it is surrounded by rolling hills and farmland. The Hudson River provides a scenic backdrop to the hamlet, and it is a popular spot for fishing and boating.
Economy
The economy of Stottville is largely based on agriculture and tourism. The hamlet is home to several farms, which produce a variety of crops, including corn, soybeans, and hay. The farms also raise livestock, including cows, pigs, and chickens.
The hamlet is also home to several small businesses, including a grocery store, a hardware store, and a gas station. The hamlet is also home to several restaurants, which serve a variety of cuisines, including Italian, Mexican, and American.
The hamlet is also a popular tourist destination, and it is home to several bed and breakfasts, as well as a campground. The hamlet is also home to several antique shops, which attract visitors from all over the region.
Demographics
As of the 2010 census, the population of Stottville was 545. The population is largely white (94.3%), with a small percentage of African Americans (2.2%) and Hispanics (2.2%). The median household income is $50,000, and the median home value is $170,000.
The hamlet is served by the Hudson City School District, which includes two elementary schools, a middle school, and a high school. The hamlet is also home to several churches, including the Stottville Methodist Church, which was established in 1845.
Conclusion
Stottville is a small hamlet located in the town of Stockport in Columbia County, New York. It is situated on the east bank of the Hudson River, about two miles south of the village of Hudson. The hamlet is named after the Stott family, who were among the first settlers in the area. The economy of Stottville is largely based on agriculture and tourism, and the population is largely white. The hamlet is home to several churches, including the Stottville Methodist Church, which was established in 1845.
Common Questions
What is Per Capita Income in Stottville?
Per Capita income in Stottville is $32,276.
What is the Median Family Income in Stottville?
Median Family Income in Stottville is $73,000.
What is the Median Household income in Stottville?
Median Household Income in Stottville is $56,667.
What is Income or Wage Gap in Stottville?
Income or Wage Gap in Stottville is 32.4%.
Women in Stottville earn 67.6 cents for every dollar earned by a man.
What is Inequality or Gini Index in Stottville?
Inequality or Gini Index in Stottville is 0.34.
What is the Total Population of Stottville?
Total Population of Stottville is 1,186.
What is the Total Male Population of Stottville?
Total Male Population of Stottville is 630.
What is the Total Female Population of Stottville?
Total Female Population of Stottville is 556.
What is the Ratio of Males per 100 Females in Stottville?
There are 113.31 Males per 100 Females in Stottville.
What is the Ratio of Females per 100 Males in Stottville?
There are 88.25 Females per 100 Males in Stottville.
What is the Median Population Age in Stottville?
Median Population Age in Stottville is 38.7 Years.
What is the Average Family Size in Stottville
Average Family Size in Stottville is 2.9 People.
What is the Average Household Size in Stottville
Average Household Size in Stottville is 2.0 People.
How Large is the Labor Force in Stottville?
There are 604 People in the Labor Forcein in Stottville.
What is the Percentage of People in the Labor Force in Stottville?
67.4% of People are in the Labor Force in Stottville.
What is the Unemployment Rate in Stottville?
Unemployment Rate in Stottville is 1.8%.