Southport, NY Map & Demographics
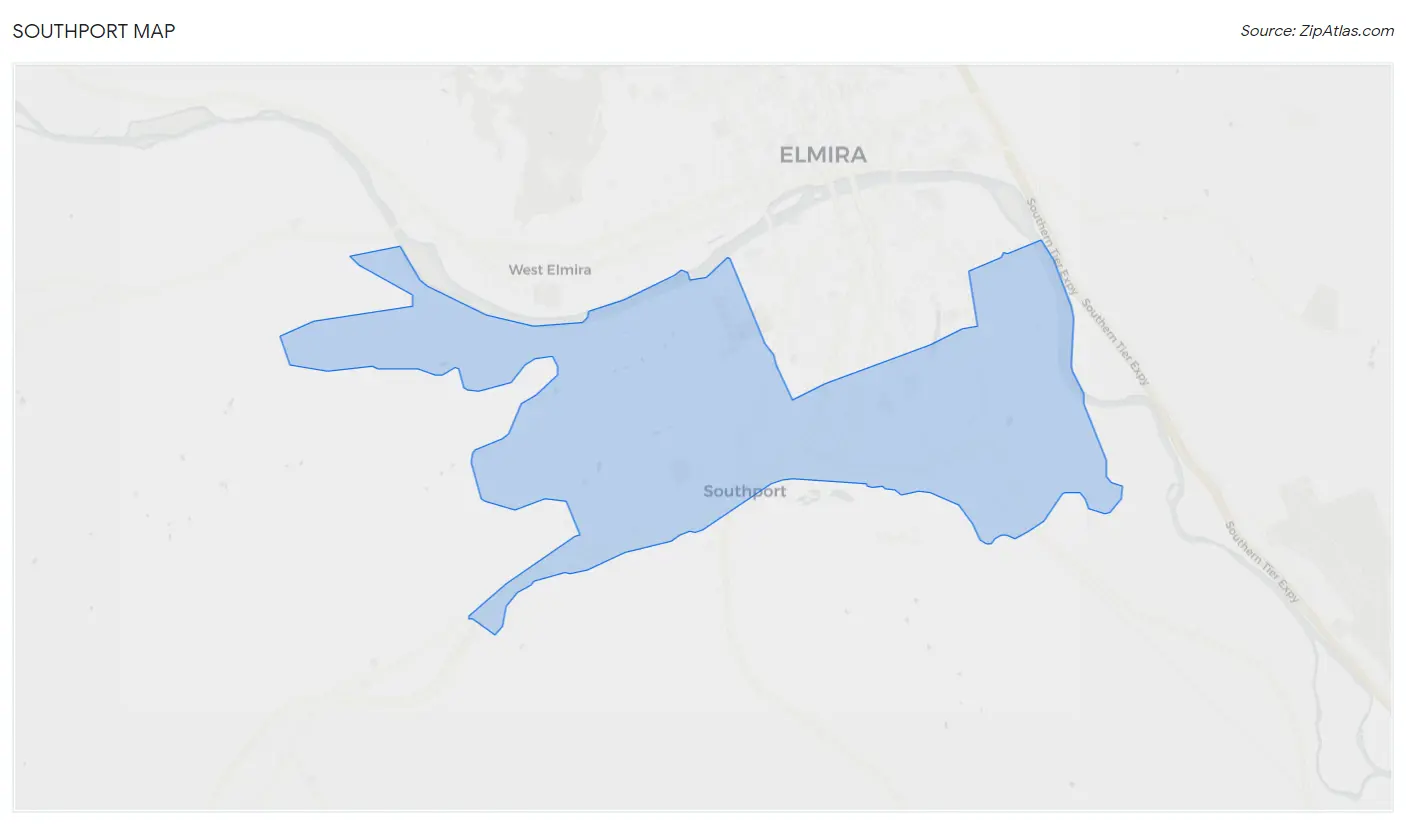
Southport Map
Southport Overview
$32,414
PER CAPITA INCOME
$66,948
AVG FAMILY INCOME
$54,531
AVG HOUSEHOLD INCOME
13.3%
WAGE / INCOME GAP [ % ]
86.7¢/ $1
WAGE / INCOME GAP [ $ ]
0.42
INEQUALITY / GINI INDEX
6,661
TOTAL POPULATION
3,510
MALE POPULATION
3,151
FEMALE POPULATION
111.39
MALES / 100 FEMALES
89.77
FEMALES / 100 MALES
45.5
MEDIAN AGE
2.6
AVG FAMILY SIZE
2.1
AVG HOUSEHOLD SIZE
3,640
LABOR FORCE [ PEOPLE ]
64.5%
PERCENT IN LABOR FORCE
6.3%
UNEMPLOYMENT RATE
Income in Southport
Income Overview in Southport
Per Capita Income in Southport is $32,414, while median incomes of families and households are $66,948 and $54,531 respectively.
| Characteristic | Number | Measure |
| Per Capita Income | 6,661 | $32,414 |
| Median Family Income | 1,737 | $66,948 |
| Mean Family Income | 1,737 | $76,339 |
| Median Household Income | 3,188 | $54,531 |
| Mean Household Income | 3,188 | $66,754 |
| Income Deficit | 1,737 | $0 |
| Wage / Income Gap (%) | 6,661 | 13.30% |
| Wage / Income Gap ($) | 6,661 | 86.70¢ per $1 |
| Gini / Inequality Index | 6,661 | 0.42 |
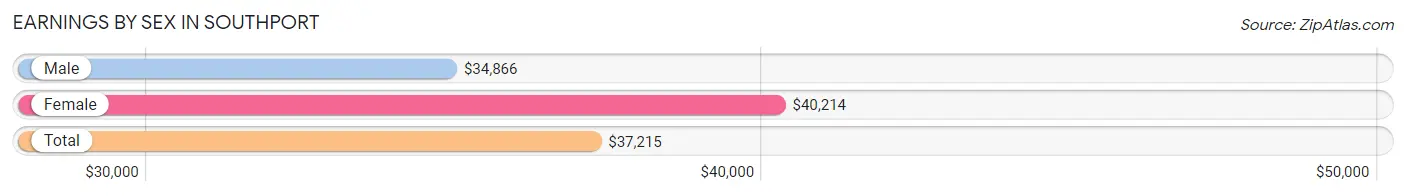
Earnings by Sex in Southport
Average Earnings in Southport are $37,215, $34,866 for men and $40,214 for women, a difference of 13.3%.
| Sex | Number | Average Earnings |
| Male | 2,229 (58.1%) | $34,866 |
| Female | 1,606 (41.9%) | $40,214 |
| Total | 3,835 (100.0%) | $37,215 |
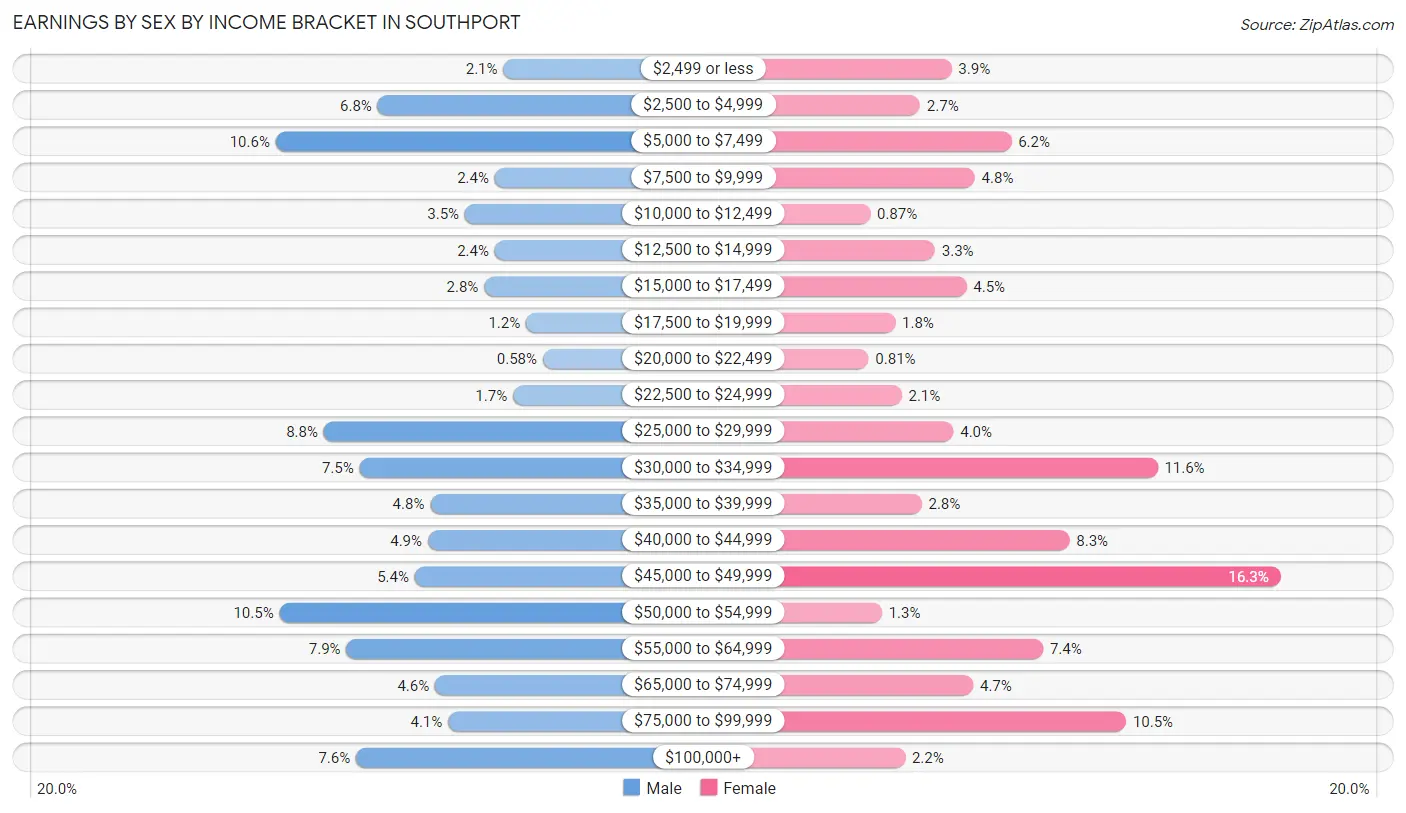
Earnings by Sex by Income Bracket in Southport
The most common earnings brackets in Southport are $5,000 to $7,499 for men (236 | 10.6%) and $45,000 to $49,999 for women (261 | 16.3%).
| Income | Male | Female |
| $2,499 or less | 46 (2.1%) | 63 (3.9%) |
| $2,500 to $4,999 | 151 (6.8%) | 44 (2.7%) |
| $5,000 to $7,499 | 236 (10.6%) | 99 (6.2%) |
| $7,500 to $9,999 | 53 (2.4%) | 77 (4.8%) |
| $10,000 to $12,499 | 78 (3.5%) | 14 (0.9%) |
| $12,500 to $14,999 | 53 (2.4%) | 53 (3.3%) |
| $15,000 to $17,499 | 62 (2.8%) | 72 (4.5%) |
| $17,500 to $19,999 | 27 (1.2%) | 29 (1.8%) |
| $20,000 to $22,499 | 13 (0.6%) | 13 (0.8%) |
| $22,500 to $24,999 | 38 (1.7%) | 33 (2.1%) |
| $25,000 to $29,999 | 196 (8.8%) | 64 (4.0%) |
| $30,000 to $34,999 | 166 (7.4%) | 187 (11.6%) |
| $35,000 to $39,999 | 107 (4.8%) | 45 (2.8%) |
| $40,000 to $44,999 | 109 (4.9%) | 134 (8.3%) |
| $45,000 to $49,999 | 120 (5.4%) | 261 (16.3%) |
| $50,000 to $54,999 | 233 (10.4%) | 21 (1.3%) |
| $55,000 to $64,999 | 177 (7.9%) | 118 (7.3%) |
| $65,000 to $74,999 | 103 (4.6%) | 76 (4.7%) |
| $75,000 to $99,999 | 92 (4.1%) | 168 (10.5%) |
| $100,000+ | 169 (7.6%) | 35 (2.2%) |
| Total | 2,229 (100.0%) | 1,606 (100.0%) |
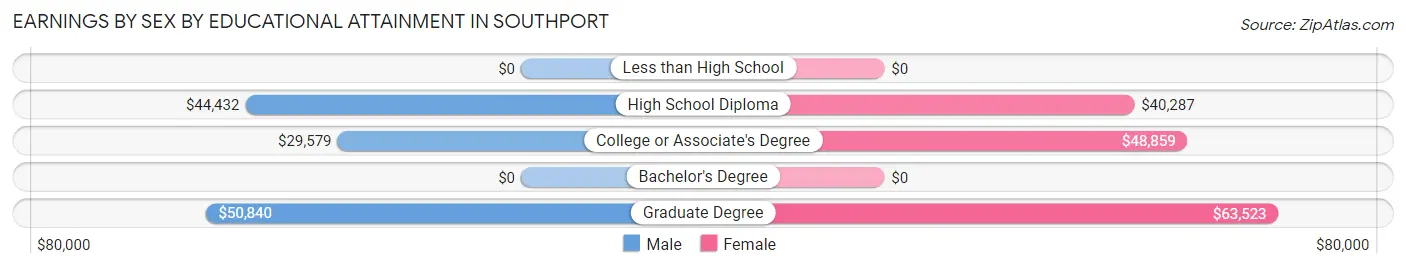
Earnings by Sex by Educational Attainment in Southport
Average earnings in Southport are $38,639 for men and $42,011 for women, a difference of 8.0%. Men with an educational attainment of graduate degree enjoy the highest average annual earnings of $50,840, while those with college or associate's degree education earn the least with $29,579. Women with an educational attainment of graduate degree earn the most with the average annual earnings of $63,523, while those with high school diploma education have the smallest earnings of $40,287.
| Educational Attainment | Male Income | Female Income |
| Less than High School | - | - |
| High School Diploma | $44,432 | $40,287 |
| College or Associate's Degree | $29,579 | $48,859 |
| Bachelor's Degree | - | - |
| Graduate Degree | $50,840 | $63,523 |
| Total | $38,639 | $42,011 |
Family Income in Southport
Family Income Brackets in Southport
According to the Southport family income data, there are 349 families falling into the $25,000 to $34,999 income range, which is the most common income bracket and makes up 20.1% of all families. Conversely, the less than $10,000 income bracket is the least frequent group with only 38 families (2.2%) belonging to this category.
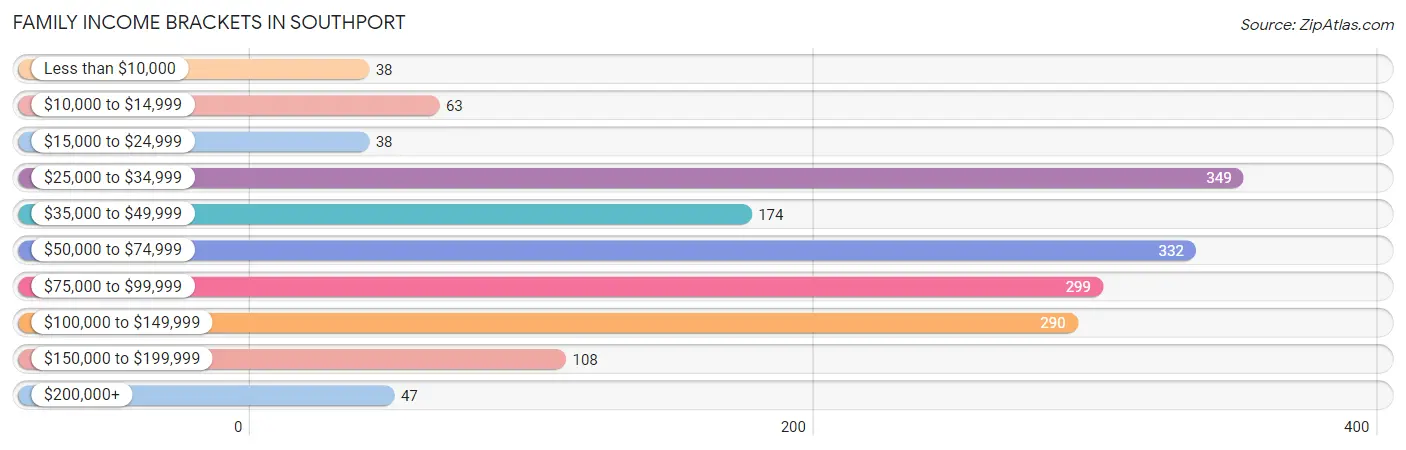
| Income Bracket | # Families | % Families |
| Less than $10,000 | 38 | 2.2% |
| $10,000 to $14,999 | 63 | 3.6% |
| $15,000 to $24,999 | 38 | 2.2% |
| $25,000 to $34,999 | 349 | 20.1% |
| $35,000 to $49,999 | 174 | 10.0% |
| $50,000 to $74,999 | 332 | 19.1% |
| $75,000 to $99,999 | 299 | 17.2% |
| $100,000 to $149,999 | 290 | 16.7% |
| $150,000 to $199,999 | 108 | 6.2% |
| $200,000+ | 47 | 2.7% |
Family Income by Famaliy Size in Southport
6-person families (68 | 3.9%) account for the highest median family income in Southport with $137,125 per family, while 2-person families (1,087 | 62.6%) have the highest median income of $30,218 per family member.
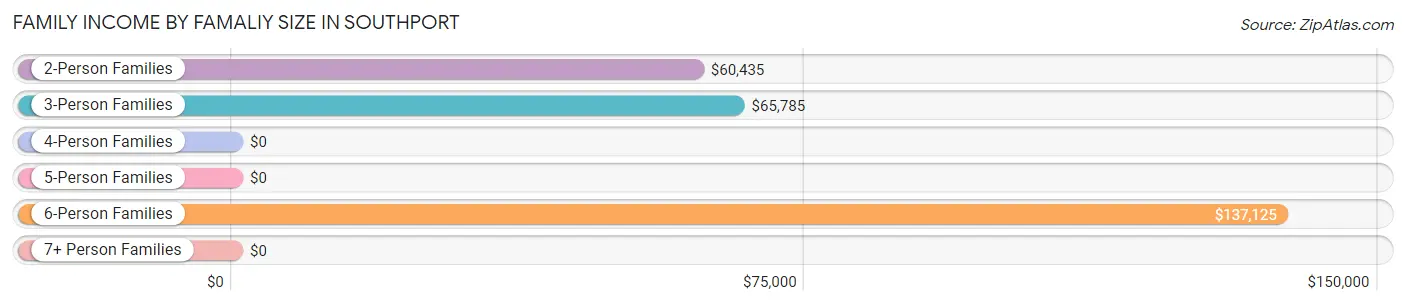
| Income Bracket | # Families | Median Income |
| 2-Person Families | 1,087 (62.6%) | $60,435 |
| 3-Person Families | 349 (20.1%) | $65,785 |
| 4-Person Families | 199 (11.5%) | $0 |
| 5-Person Families | 34 (2.0%) | $0 |
| 6-Person Families | 68 (3.9%) | $137,125 |
| 7+ Person Families | 0 (0.0%) | $0 |
| Total | 1,737 (100.0%) | $66,948 |
Family Income by Number of Earners in Southport
The median family income in Southport is $66,948, with families comprising 3+ earners (105) having the highest median family income of $136,031, while families with no earners (272) have the lowest median family income of $34,806, accounting for 6.0% and 15.7% of families, respectively.
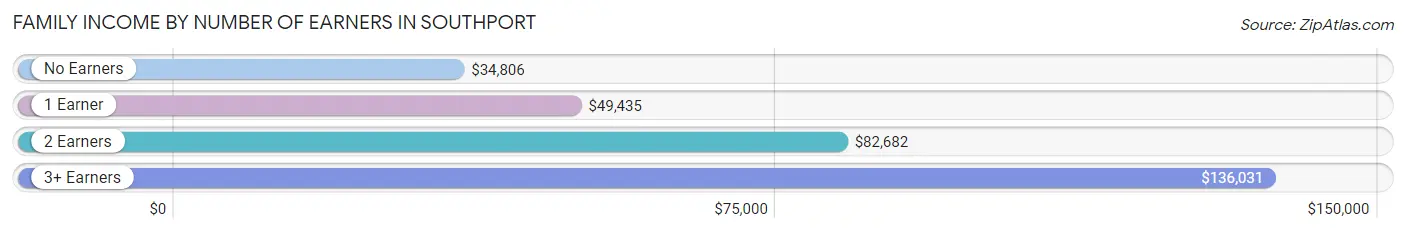
| Number of Earners | # Families | Median Income |
| No Earners | 272 (15.7%) | $34,806 |
| 1 Earner | 682 (39.3%) | $49,435 |
| 2 Earners | 678 (39.0%) | $82,682 |
| 3+ Earners | 105 (6.0%) | $136,031 |
| Total | 1,737 (100.0%) | $66,948 |
Household Income in Southport
Household Income Brackets in Southport
With 615 households falling in the category, the $50,000 to $74,999 income range is the most frequent in Southport, accounting for 19.3% of all households. In contrast, only 70 households (2.2%) fall into the $10,000 to $14,999 income bracket, making it the least populous group.
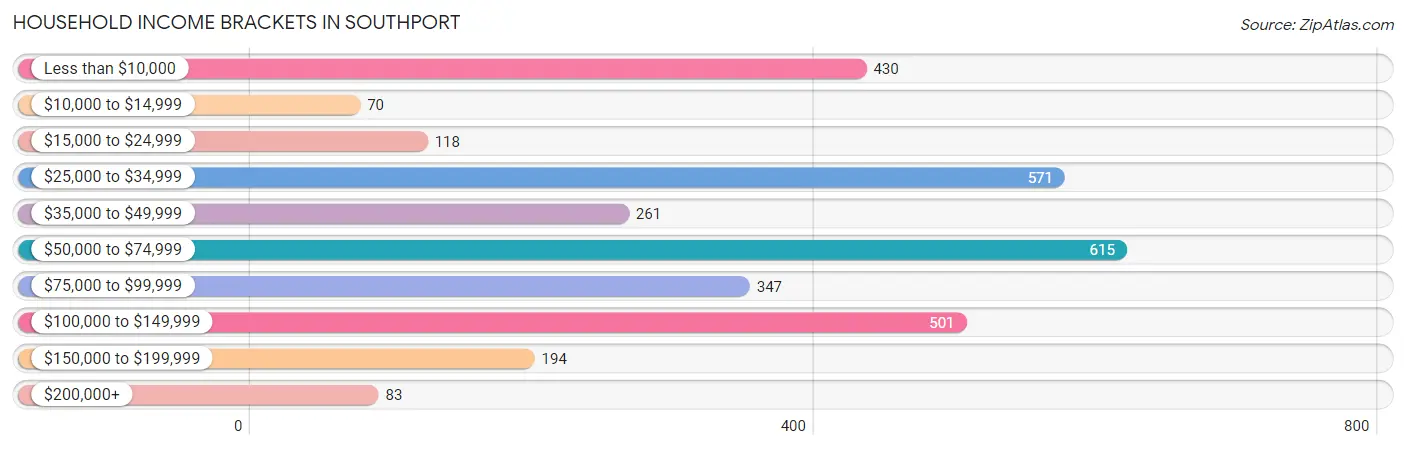
| Income Bracket | # Households | % Households |
| Less than $10,000 | 430 | 13.5% |
| $10,000 to $14,999 | 70 | 2.2% |
| $15,000 to $24,999 | 118 | 3.7% |
| $25,000 to $34,999 | 571 | 17.9% |
| $35,000 to $49,999 | 261 | 8.2% |
| $50,000 to $74,999 | 615 | 19.3% |
| $75,000 to $99,999 | 347 | 10.9% |
| $100,000 to $149,999 | 501 | 15.7% |
| $150,000 to $199,999 | 194 | 6.1% |
| $200,000+ | 83 | 2.6% |
Household Income by Householder Age in Southport
The median household income in Southport is $54,531, with the highest median household income of $82,818 found in the 45 to 64 years age bracket for the primary householder. A total of 914 households (28.7%) fall into this category. Meanwhile, the 15 to 24 years age bracket for the primary householder has the lowest median household income of $0, with 90 households (2.8%) in this group.
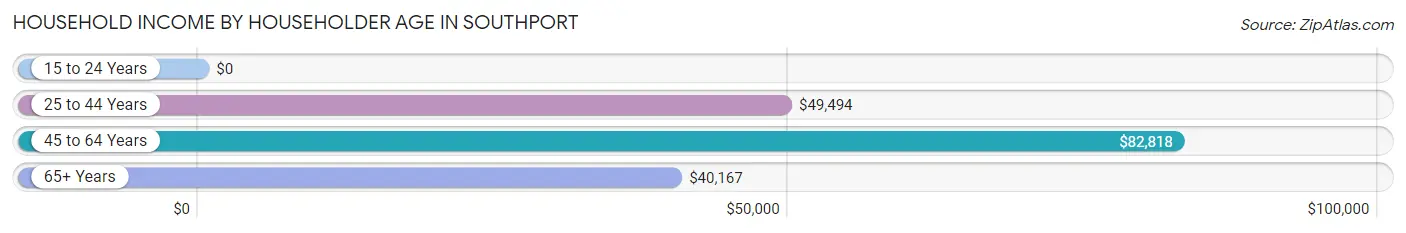
| Income Bracket | # Households | Median Income |
| 15 to 24 Years | 90 (2.8%) | $0 |
| 25 to 44 Years | 1,160 (36.4%) | $49,494 |
| 45 to 64 Years | 914 (28.7%) | $82,818 |
| 65+ Years | 1,024 (32.1%) | $40,167 |
| Total | 3,188 (100.0%) | $54,531 |
Poverty in Southport
Income Below Poverty by Sex and Age in Southport
With 17.2% poverty level for males and 12.8% for females among the residents of Southport, 15 year old males and 25 to 34 year old females are the most vulnerable to poverty, with 22 males (56.4%) and 120 females (37.0%) in their respective age groups living below the poverty level.
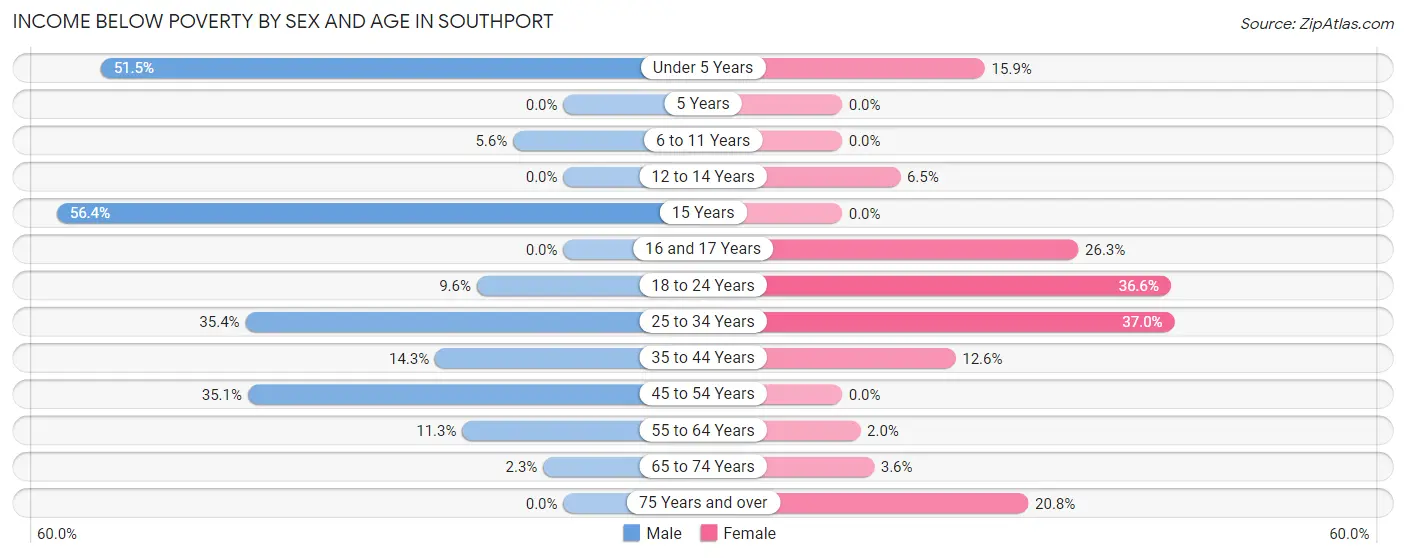
| Age Bracket | Male | Female |
| Under 5 Years | 34 (51.5%) | 14 (15.9%) |
| 5 Years | 0 (0.0%) | 0 (0.0%) |
| 6 to 11 Years | 14 (5.6%) | 0 (0.0%) |
| 12 to 14 Years | 0 (0.0%) | 14 (6.5%) |
| 15 Years | 22 (56.4%) | 0 (0.0%) |
| 16 and 17 Years | 0 (0.0%) | 15 (26.3%) |
| 18 to 24 Years | 16 (9.6%) | 96 (36.6%) |
| 25 to 34 Years | 261 (35.4%) | 120 (37.0%) |
| 35 to 44 Years | 65 (14.3%) | 33 (12.6%) |
| 45 to 54 Years | 117 (35.1%) | 0 (0.0%) |
| 55 to 64 Years | 63 (11.3%) | 13 (2.0%) |
| 65 to 74 Years | 10 (2.2%) | 11 (3.6%) |
| 75 Years and over | 0 (0.0%) | 88 (20.7%) |
| Total | 602 (17.2%) | 404 (12.8%) |
Income Above Poverty by Sex and Age in Southport
According to the poverty statistics in Southport, males aged 12 to 14 years and females aged 6 to 11 years are the age groups that are most secure financially, with 100.0% of males and 100.0% of females in these age groups living above the poverty line.

| Age Bracket | Male | Female |
| Under 5 Years | 32 (48.5%) | 74 (84.1%) |
| 5 Years | 0 (0.0%) | 0 (0.0%) |
| 6 to 11 Years | 236 (94.4%) | 282 (100.0%) |
| 12 to 14 Years | 46 (100.0%) | 202 (93.5%) |
| 15 Years | 17 (43.6%) | 15 (100.0%) |
| 16 and 17 Years | 29 (100.0%) | 42 (73.7%) |
| 18 to 24 Years | 150 (90.4%) | 166 (63.4%) |
| 25 to 34 Years | 476 (64.6%) | 204 (63.0%) |
| 35 to 44 Years | 390 (85.7%) | 228 (87.4%) |
| 45 to 54 Years | 216 (64.9%) | 275 (100.0%) |
| 55 to 64 Years | 497 (88.7%) | 625 (98.0%) |
| 65 to 74 Years | 435 (97.8%) | 298 (96.4%) |
| 75 Years and over | 368 (100.0%) | 336 (79.2%) |
| Total | 2,892 (82.8%) | 2,747 (87.2%) |
Income Below Poverty Among Married-Couple Families in Southport
The poverty statistics for married-couple families in Southport show that 3.7% or 40 of the total 1,083 families live below the poverty line. Families with 1 or 2 children have the highest poverty rate of 9.8%, comprising of 29 families. On the other hand, families with 3 or 4 children have the lowest poverty rate of 0.0%, which includes 0 families.
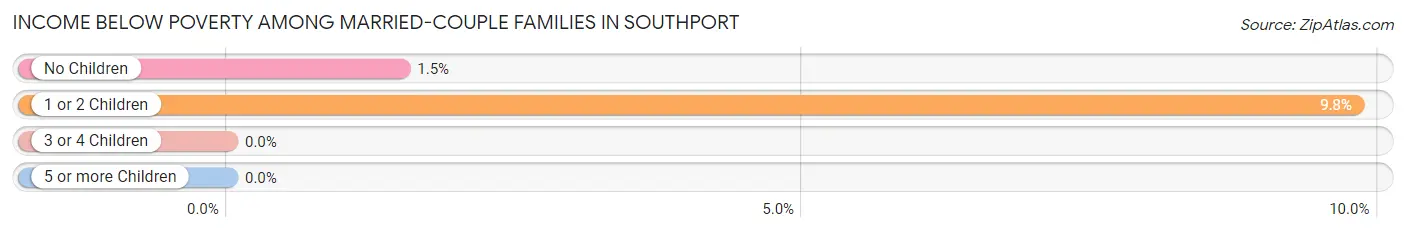
| Children | Above Poverty | Below Poverty |
| No Children | 720 (98.5%) | 11 (1.5%) |
| 1 or 2 Children | 267 (90.2%) | 29 (9.8%) |
| 3 or 4 Children | 56 (100.0%) | 0 (0.0%) |
| 5 or more Children | 0 (0.0%) | 0 (0.0%) |
| Total | 1,043 (96.3%) | 40 (3.7%) |
Income Below Poverty Among Single-Parent Households in Southport
According to the poverty data in Southport, 20.0% or 70 single-father households and 7.6% or 23 single-mother households are living below the poverty line. Among single-father households, those with no children have the highest poverty rate, with 47 households (29.6%) experiencing poverty. Likewise, among single-mother households, those with 1 or 2 children have the highest poverty rate, with 23 households (13.5%) falling below the poverty line.
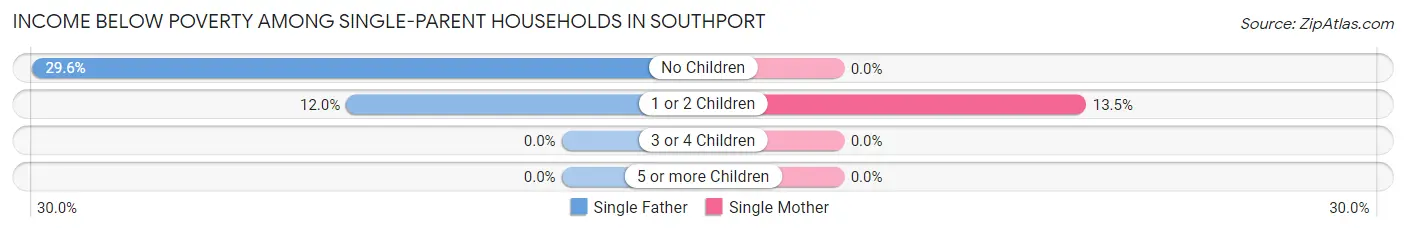
| Children | Single Father | Single Mother |
| No Children | 47 (29.6%) | 0 (0.0%) |
| 1 or 2 Children | 23 (12.0%) | 23 (13.5%) |
| 3 or 4 Children | 0 (0.0%) | 0 (0.0%) |
| 5 or more Children | 0 (0.0%) | 0 (0.0%) |
| Total | 70 (20.0%) | 23 (7.6%) |
Income Below Poverty Among Married-Couple vs Single-Parent Households in Southport
The poverty data for Southport shows that 40 of the married-couple family households (3.7%) and 93 of the single-parent households (14.2%) are living below the poverty level. Within the married-couple family households, those with 1 or 2 children have the highest poverty rate, with 29 households (9.8%) falling below the poverty line. Among the single-parent households, those with no children have the highest poverty rate, with 47 household (16.0%) living below poverty.
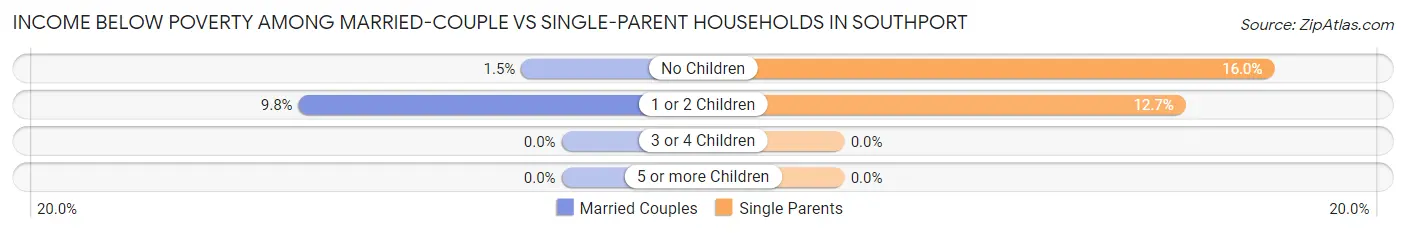
| Children | Married-Couple Families | Single-Parent Households |
| No Children | 11 (1.5%) | 47 (16.0%) |
| 1 or 2 Children | 29 (9.8%) | 46 (12.7%) |
| 3 or 4 Children | 0 (0.0%) | 0 (0.0%) |
| 5 or more Children | 0 (0.0%) | 0 (0.0%) |
| Total | 40 (3.7%) | 93 (14.2%) |
Race in Southport
The most populous races in Southport are White / Caucasian (6,062 | 91.0%), Black / African American (346 | 5.2%), and Two or more Races (253 | 3.8%).
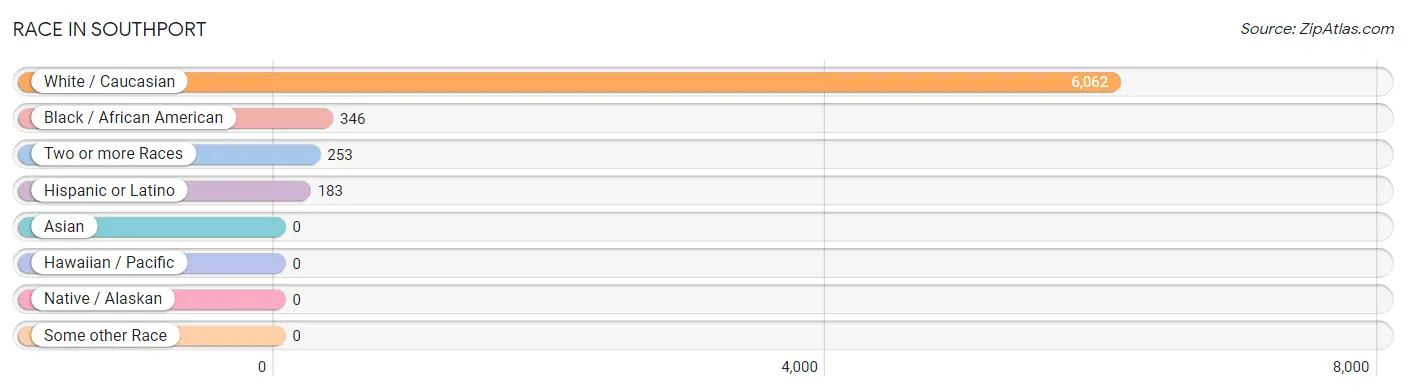
| Race | # Population | % Population |
| Asian | 0 | 0.0% |
| Black / African American | 346 | 5.2% |
| Hawaiian / Pacific | 0 | 0.0% |
| Hispanic or Latino | 183 | 2.8% |
| Native / Alaskan | 0 | 0.0% |
| White / Caucasian | 6,062 | 91.0% |
| Two or more Races | 253 | 3.8% |
| Some other Race | 0 | 0.0% |
| Total | 6,661 | 100.0% |
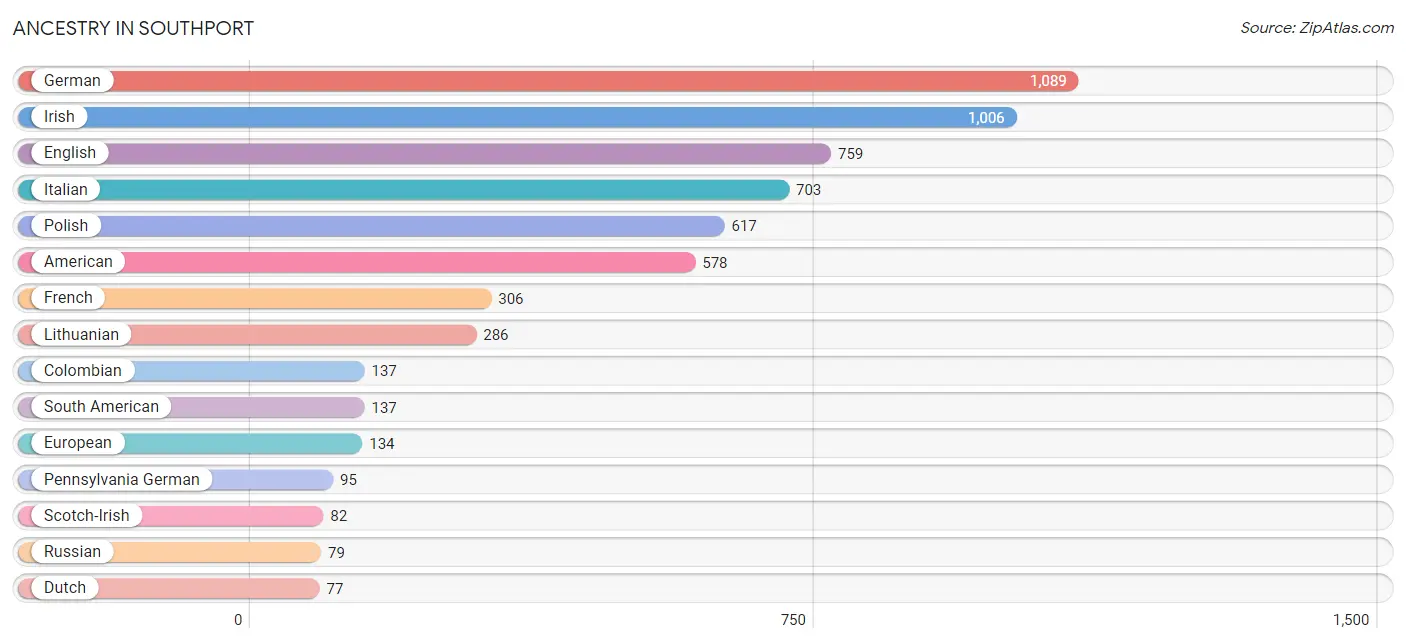
Ancestry in Southport
The most populous ancestries reported in Southport are German (1,089 | 16.4%), Irish (1,006 | 15.1%), English (759 | 11.4%), Italian (703 | 10.5%), and Polish (617 | 9.3%), together accounting for 62.7% of all Southport residents.
| Ancestry | # Population | % Population |
| American | 578 | 8.7% |
| Arab | 8 | 0.1% |
| British | 11 | 0.2% |
| Colombian | 137 | 2.1% |
| Czech | 72 | 1.1% |
| Danish | 49 | 0.7% |
| Dutch | 77 | 1.2% |
| Eastern European | 10 | 0.2% |
| English | 759 | 11.4% |
| European | 134 | 2.0% |
| Finnish | 56 | 0.8% |
| French | 306 | 4.6% |
| German | 1,089 | 16.4% |
| Hungarian | 14 | 0.2% |
| Indian (Asian) | 19 | 0.3% |
| Irish | 1,006 | 15.1% |
| Italian | 703 | 10.5% |
| Lithuanian | 286 | 4.3% |
| Mexican | 46 | 0.7% |
| Northern European | 9 | 0.1% |
| Norwegian | 18 | 0.3% |
| Pennsylvania German | 95 | 1.4% |
| Polish | 617 | 9.3% |
| Russian | 79 | 1.2% |
| Scandinavian | 29 | 0.4% |
| Scotch-Irish | 82 | 1.2% |
| Scottish | 38 | 0.6% |
| South American | 137 | 2.1% |
| Swedish | 26 | 0.4% |
| Swiss | 44 | 0.7% |
| Syrian | 8 | 0.1% |
| Ukrainian | 71 | 1.1% |
| Welsh | 65 | 1.0% | View All 33 Rows |
Immigrants in Southport
The most numerous immigrant groups reported in Southport came from Colombia (137 | 2.1%), Latin America (137 | 2.1%), South America (137 | 2.1%), Europe (20 | 0.3%), and Germany (12 | 0.2%), together accounting for 6.7% of all Southport residents.
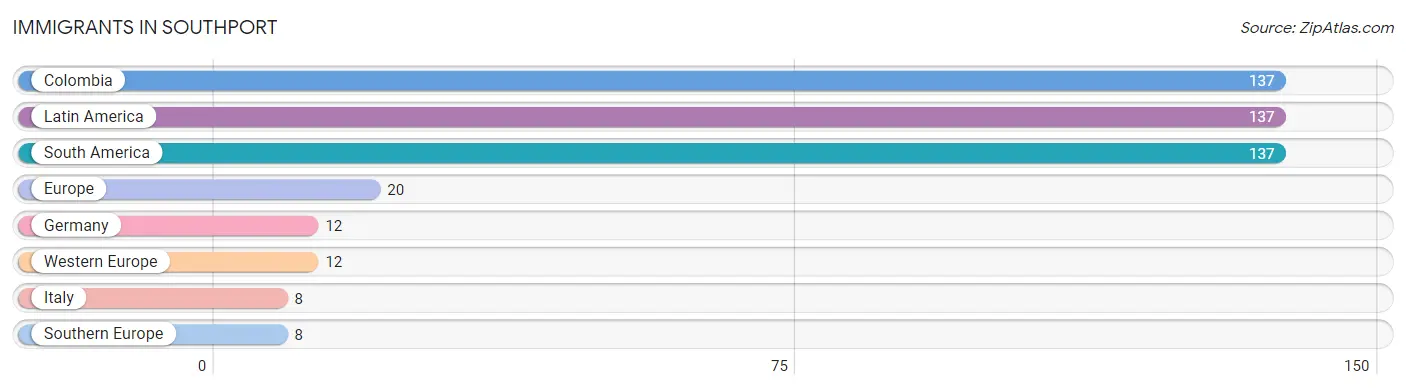
| Immigration Origin | # Population | % Population |
| Colombia | 137 | 2.1% |
| Europe | 20 | 0.3% |
| Germany | 12 | 0.2% |
| Italy | 8 | 0.1% |
| Latin America | 137 | 2.1% |
| South America | 137 | 2.1% |
| Southern Europe | 8 | 0.1% |
| Western Europe | 12 | 0.2% | View All 8 Rows |
Sex and Age in Southport
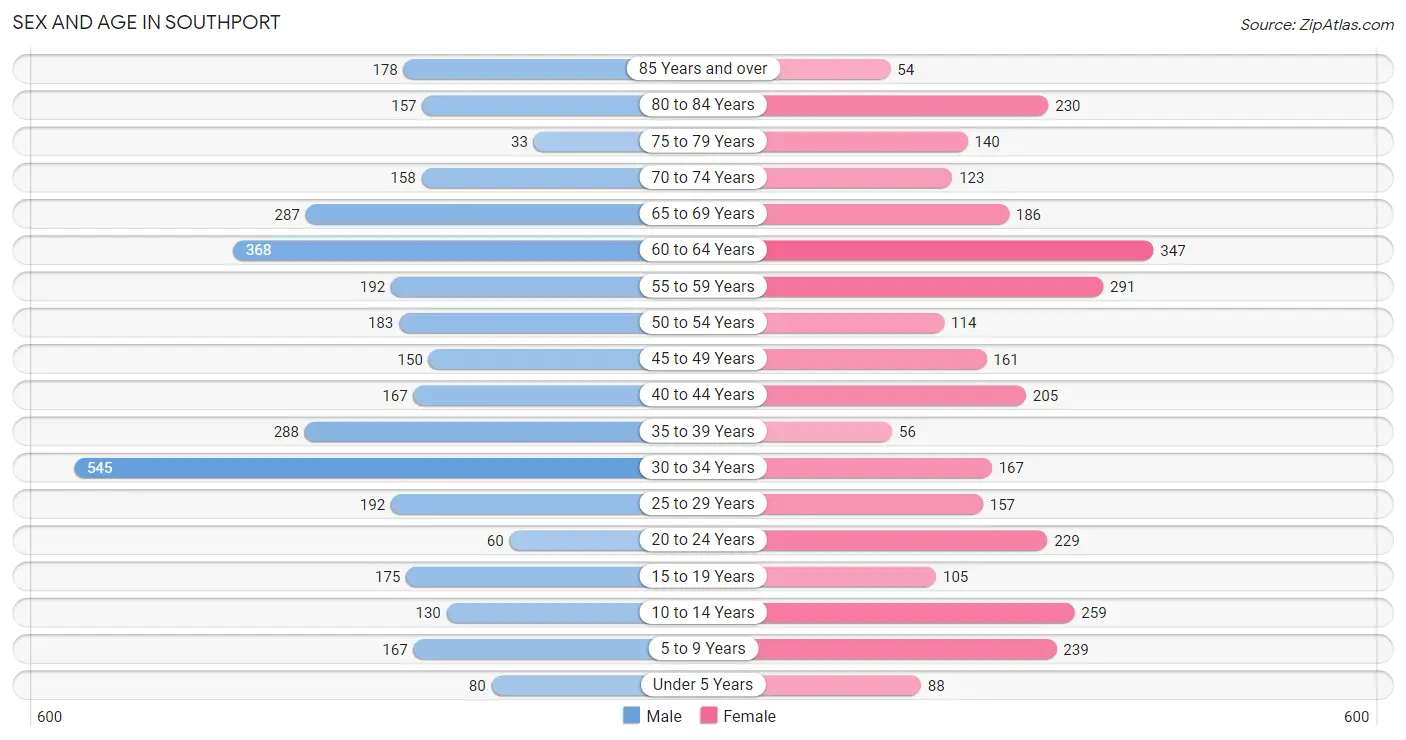
Sex and Age in Southport
The most populous age groups in Southport are 30 to 34 Years (545 | 15.5%) for men and 60 to 64 Years (347 | 11.0%) for women.
| Age Bracket | Male | Female |
| Under 5 Years | 80 (2.3%) | 88 (2.8%) |
| 5 to 9 Years | 167 (4.8%) | 239 (7.6%) |
| 10 to 14 Years | 130 (3.7%) | 259 (8.2%) |
| 15 to 19 Years | 175 (5.0%) | 105 (3.3%) |
| 20 to 24 Years | 60 (1.7%) | 229 (7.3%) |
| 25 to 29 Years | 192 (5.5%) | 157 (5.0%) |
| 30 to 34 Years | 545 (15.5%) | 167 (5.3%) |
| 35 to 39 Years | 288 (8.2%) | 56 (1.8%) |
| 40 to 44 Years | 167 (4.8%) | 205 (6.5%) |
| 45 to 49 Years | 150 (4.3%) | 161 (5.1%) |
| 50 to 54 Years | 183 (5.2%) | 114 (3.6%) |
| 55 to 59 Years | 192 (5.5%) | 291 (9.2%) |
| 60 to 64 Years | 368 (10.5%) | 347 (11.0%) |
| 65 to 69 Years | 287 (8.2%) | 186 (5.9%) |
| 70 to 74 Years | 158 (4.5%) | 123 (3.9%) |
| 75 to 79 Years | 33 (0.9%) | 140 (4.4%) |
| 80 to 84 Years | 157 (4.5%) | 230 (7.3%) |
| 85 Years and over | 178 (5.1%) | 54 (1.7%) |
| Total | 3,510 (100.0%) | 3,151 (100.0%) |
Families and Households in Southport
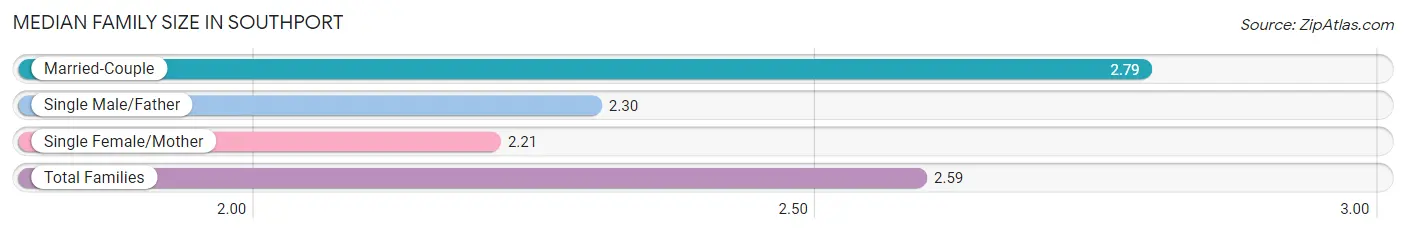
Median Family Size in Southport
The median family size in Southport is 2.59 persons per family, with married-couple families (1,083 | 62.4%) accounting for the largest median family size of 2.79 persons per family. On the other hand, single female/mother families (304 | 17.5%) represent the smallest median family size with 2.21 persons per family.
| Family Type | # Families | Family Size |
| Married-Couple | 1,083 (62.4%) | 2.79 |
| Single Male/Father | 350 (20.2%) | 2.30 |
| Single Female/Mother | 304 (17.5%) | 2.21 |
| Total Families | 1,737 (100.0%) | 2.59 |
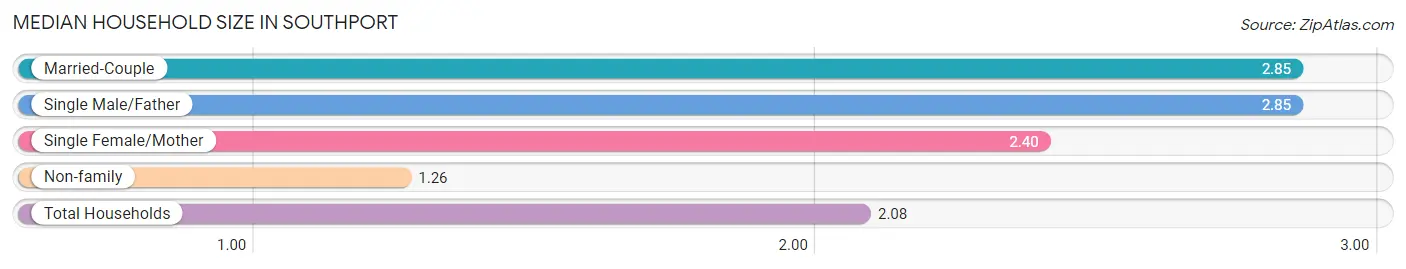
Median Household Size in Southport
The median household size in Southport is 2.08 persons per household, with married-couple households (1,083 | 34.0%) accounting for the largest median household size of 2.85 persons per household. non-family households (1,451 | 45.5%) represent the smallest median household size with 1.26 persons per household.
| Household Type | # Households | Household Size |
| Married-Couple | 1,083 (34.0%) | 2.85 |
| Single Male/Father | 350 (11.0%) | 2.85 |
| Single Female/Mother | 304 (9.5%) | 2.40 |
| Non-family | 1,451 (45.5%) | 1.26 |
| Total Households | 3,188 (100.0%) | 2.08 |
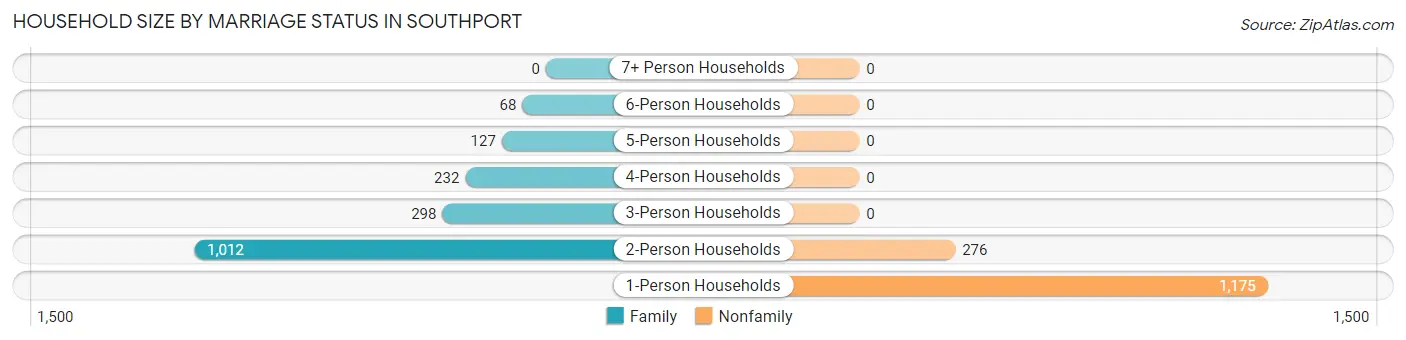
Household Size by Marriage Status in Southport
Out of a total of 3,188 households in Southport, 1,737 (54.5%) are family households, while 1,451 (45.5%) are nonfamily households. The most numerous type of family households are 2-person households, comprising 1,012, and the most common type of nonfamily households are 1-person households, comprising 1,175.
| Household Size | Family Households | Nonfamily Households |
| 1-Person Households | - | 1,175 (36.9%) |
| 2-Person Households | 1,012 (31.7%) | 276 (8.7%) |
| 3-Person Households | 298 (9.3%) | 0 (0.0%) |
| 4-Person Households | 232 (7.3%) | 0 (0.0%) |
| 5-Person Households | 127 (4.0%) | 0 (0.0%) |
| 6-Person Households | 68 (2.1%) | 0 (0.0%) |
| 7+ Person Households | 0 (0.0%) | 0 (0.0%) |
| Total | 1,737 (54.5%) | 1,451 (45.5%) |
Female Fertility in Southport
Fertility by Age in Southport
Average fertility rate in Southport is 53.0 births per 1,000 women. Women in the age bracket of 20 to 34 years have the highest fertility rate with 103.0 births per 1,000 women. Women in the age bracket of 20 to 34 years acount for 100.0% of all women with births.
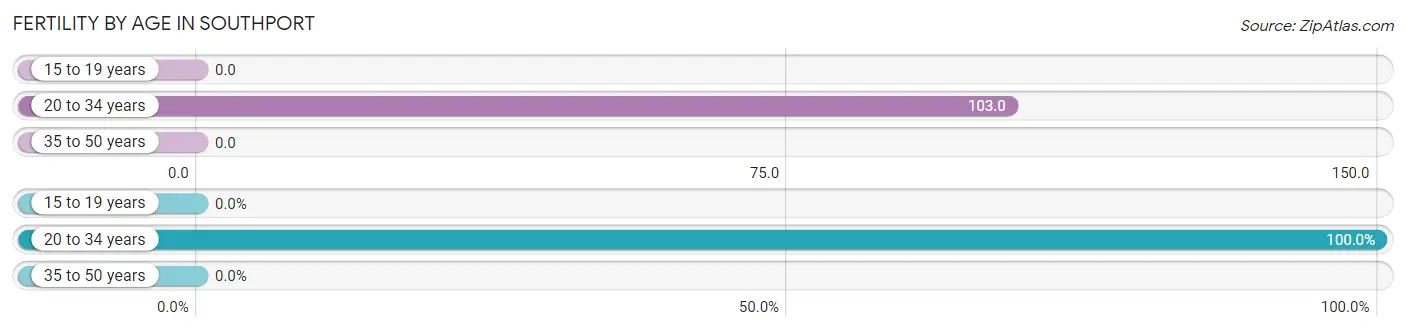
| Age Bracket | Women with Births | Births / 1,000 Women |
| 15 to 19 years | 0 (0.0%) | 0.0 |
| 20 to 34 years | 57 (100.0%) | 103.0 |
| 35 to 50 years | 0 (0.0%) | 0.0 |
| Total | 57 (100.0%) | 53.0 |
Fertility by Age by Marriage Status in Southport
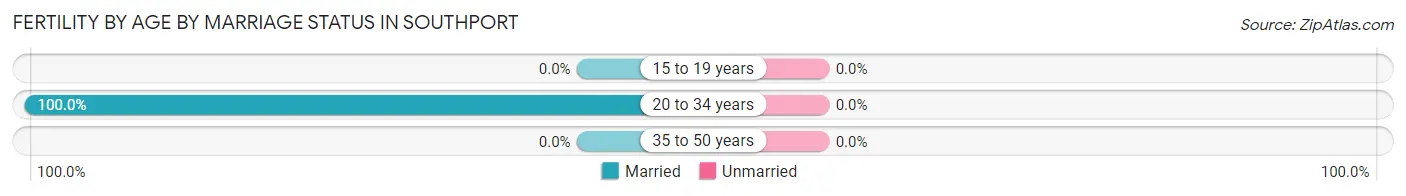
| Age Bracket | Married | Unmarried |
| 15 to 19 years | 0 (0.0%) | 0 (0.0%) |
| 20 to 34 years | 57 (100.0%) | 0 (0.0%) |
| 35 to 50 years | 0 (0.0%) | 0 (0.0%) |
| Total | 57 (100.0%) | 0 (0.0%) |
Fertility by Education in Southport
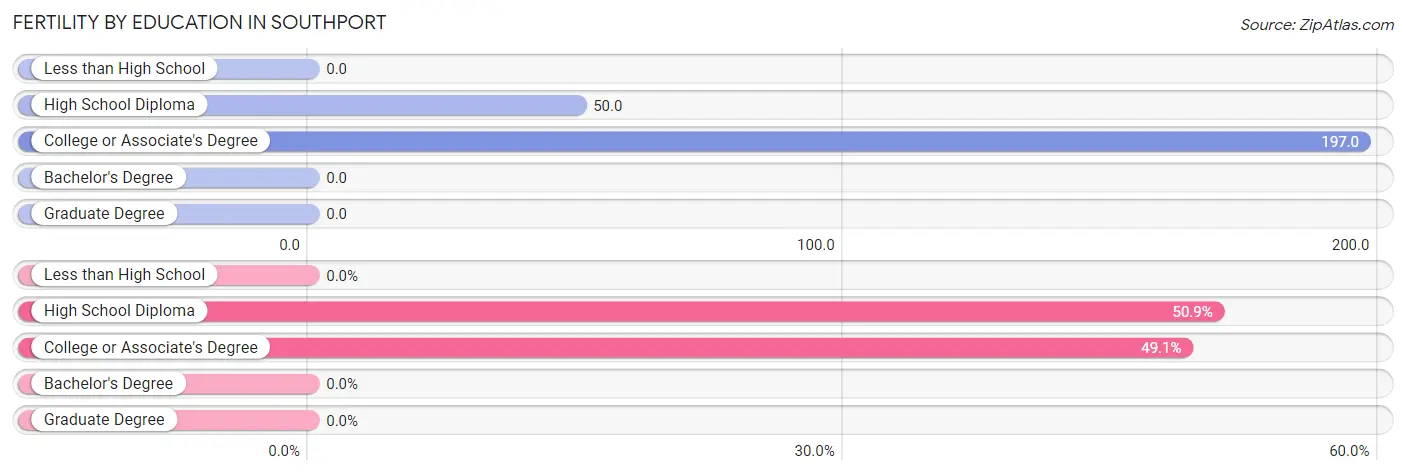
| Educational Attainment | Women with Births | Births / 1,000 Women |
| Less than High School | 0 (0.0%) | 0.0 |
| High School Diploma | 29 (50.9%) | 50.0 |
| College or Associate's Degree | 28 (49.1%) | 197.0 |
| Bachelor's Degree | 0 (0.0%) | 0.0 |
| Graduate Degree | 0 (0.0%) | 0.0 |
| Total | 57 (100.0%) | 53.0 |
Fertility by Education by Marriage Status in Southport
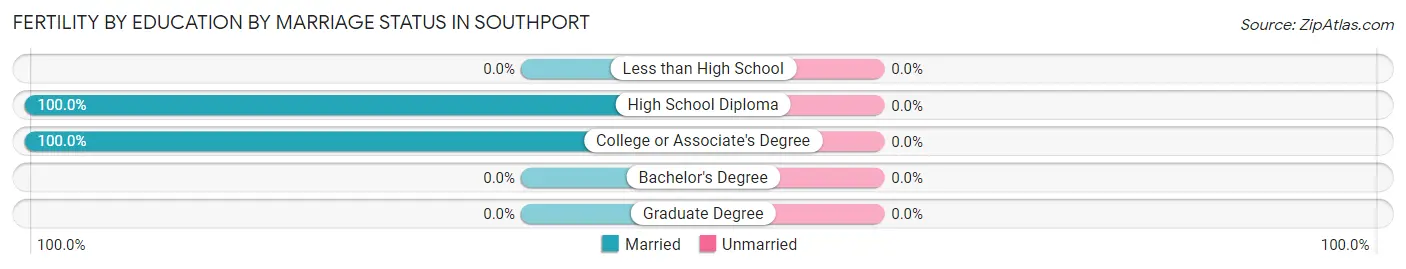
| Educational Attainment | Married | Unmarried |
| Less than High School | 0 (0.0%) | 0 (0.0%) |
| High School Diploma | 29 (100.0%) | 0 (0.0%) |
| College or Associate's Degree | 28 (100.0%) | 0 (0.0%) |
| Bachelor's Degree | 0 (0.0%) | 0 (0.0%) |
| Graduate Degree | 0 (0.0%) | 0 (0.0%) |
| Total | 57 (100.0%) | 0 (0.0%) |
Employment Characteristics in Southport
Employment by Class of Employer in Southport
Among the 3,009 employed individuals in Southport, private company employees (1,986 | 66.0%), local government employees (337 | 11.2%), and not-for-profit organizations (334 | 11.1%) make up the most common classes of employment.
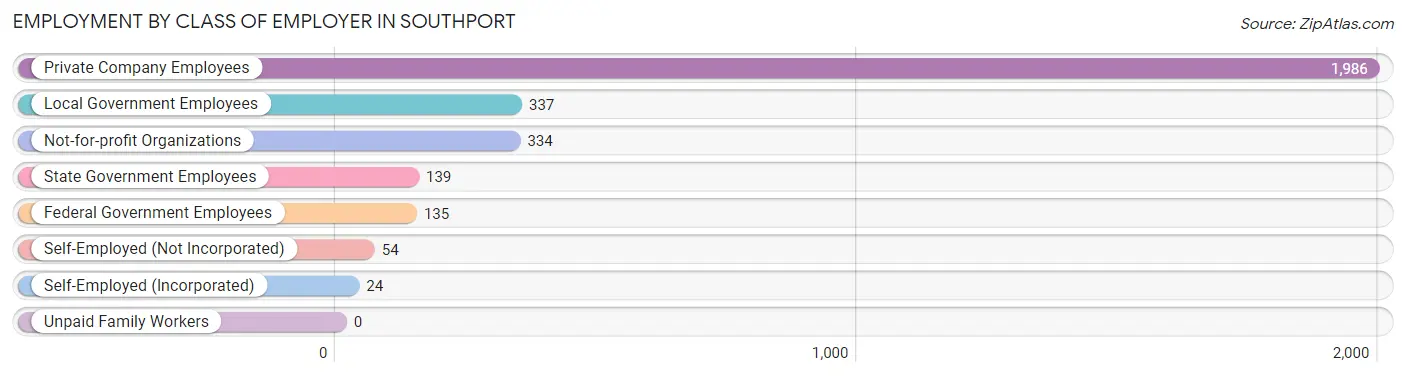
| Employer Class | # Employees | % Employees |
| Private Company Employees | 1,986 | 66.0% |
| Self-Employed (Incorporated) | 24 | 0.8% |
| Self-Employed (Not Incorporated) | 54 | 1.8% |
| Not-for-profit Organizations | 334 | 11.1% |
| Local Government Employees | 337 | 11.2% |
| State Government Employees | 139 | 4.6% |
| Federal Government Employees | 135 | 4.5% |
| Unpaid Family Workers | 0 | 0.0% |
| Total | 3,009 | 100.0% |
Employment Status by Age in Southport
According to the labor force statistics for Southport, out of the total population over 16 years of age (5,643), 64.5% or 3,640 individuals are in the labor force, with 6.3% or 229 of them unemployed. The age group with the highest labor force participation rate is 35 to 44 years, with 98.3% or 704 individuals in the labor force. Within the labor force, the 25 to 29 years age range has the highest percentage of unemployed individuals, with 23.2% or 73 of them being unemployed.
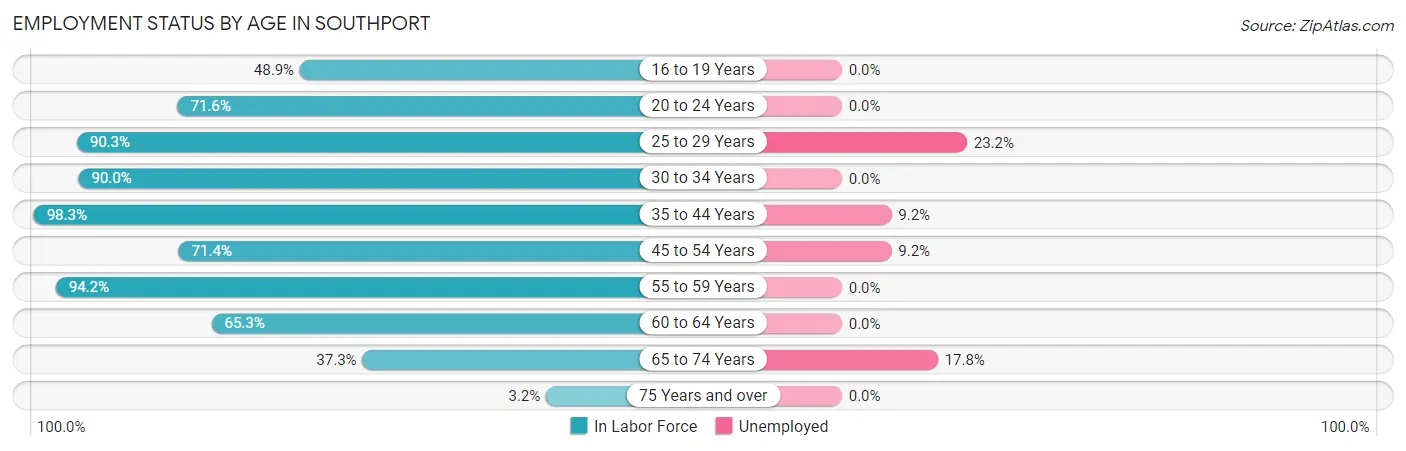
| Age Bracket | In Labor Force | Unemployed |
| 16 to 19 Years | 110 (48.9%) | 0 (0.0%) |
| 20 to 24 Years | 207 (71.6%) | 0 (0.0%) |
| 25 to 29 Years | 315 (90.3%) | 73 (23.2%) |
| 30 to 34 Years | 641 (90.0%) | 0 (0.0%) |
| 35 to 44 Years | 704 (98.3%) | 65 (9.2%) |
| 45 to 54 Years | 434 (71.4%) | 40 (9.2%) |
| 55 to 59 Years | 455 (94.2%) | 0 (0.0%) |
| 60 to 64 Years | 467 (65.3%) | 0 (0.0%) |
| 65 to 74 Years | 281 (37.3%) | 50 (17.8%) |
| 75 Years and over | 25 (3.2%) | 0 (0.0%) |
| Total | 3,640 (64.5%) | 229 (6.3%) |
Employment Status by Educational Attainment in Southport
According to labor force statistics for Southport, 84.2% of individuals (3,017) out of the total population between 25 and 64 years of age (3,583) are in the labor force, with 5.9% or 178 of them being unemployed. The group with the highest labor force participation rate are those with the educational attainment of college / associate degree, with 93.7% or 1,240 individuals in the labor force. Within the labor force, individuals with less than high school education have the highest percentage of unemployment, with 49.1% or 27 of them being unemployed.
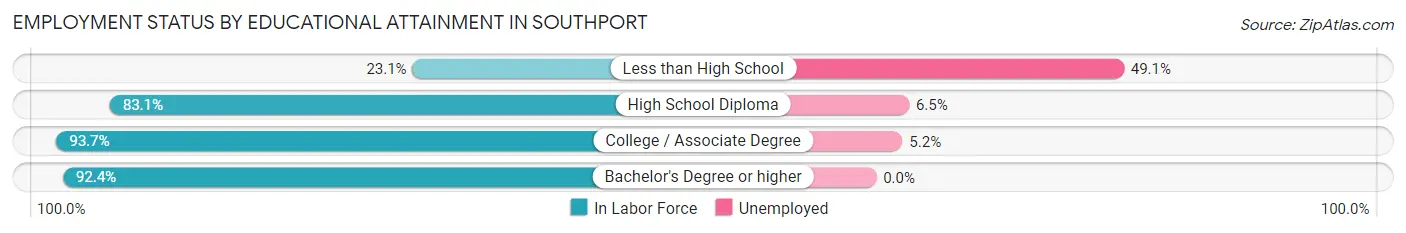
| Educational Attainment | In Labor Force | Unemployed |
| Less than High School | 55 (23.1%) | 117 (49.1%) |
| High School Diploma | 1,321 (83.1%) | 103 (6.5%) |
| College / Associate Degree | 1,240 (93.7%) | 69 (5.2%) |
| Bachelor's Degree or higher | 399 (92.4%) | 0 (0.0%) |
| Total | 3,017 (84.2%) | 211 (5.9%) |
Employment Occupations by Sex in Southport
Management, Business, Science and Arts Occupations
The most common Management, Business, Science and Arts occupations in Southport are Community & Social Service (281 | 8.2%), Health Diagnosing & Treating (258 | 7.6%), Management (255 | 7.5%), Education Instruction & Library (174 | 5.1%), and Health Technologists (81 | 2.4%).
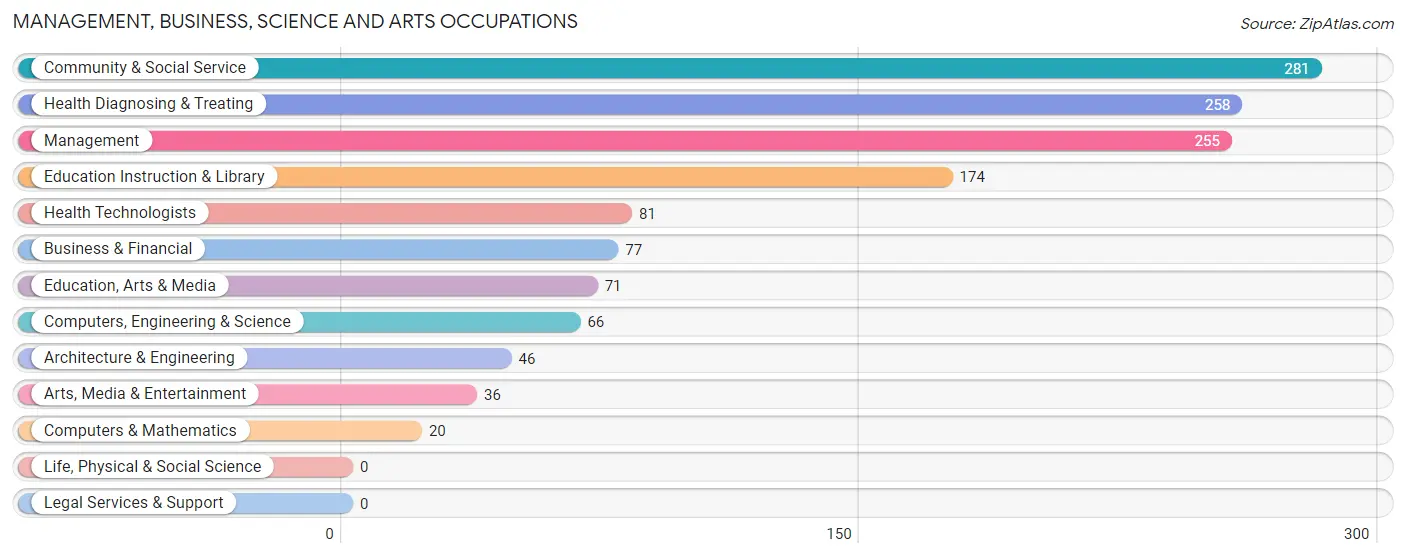
Management, Business, Science and Arts Occupations by Sex
Within the Management, Business, Science and Arts occupations in Southport, the most male-oriented occupations are Computers, Engineering & Science (100.0%), Computers & Mathematics (100.0%), and Architecture & Engineering (100.0%), while the most female-oriented occupations are Education, Arts & Media (100.0%), Health Technologists (100.0%), and Health Diagnosing & Treating (95.0%).
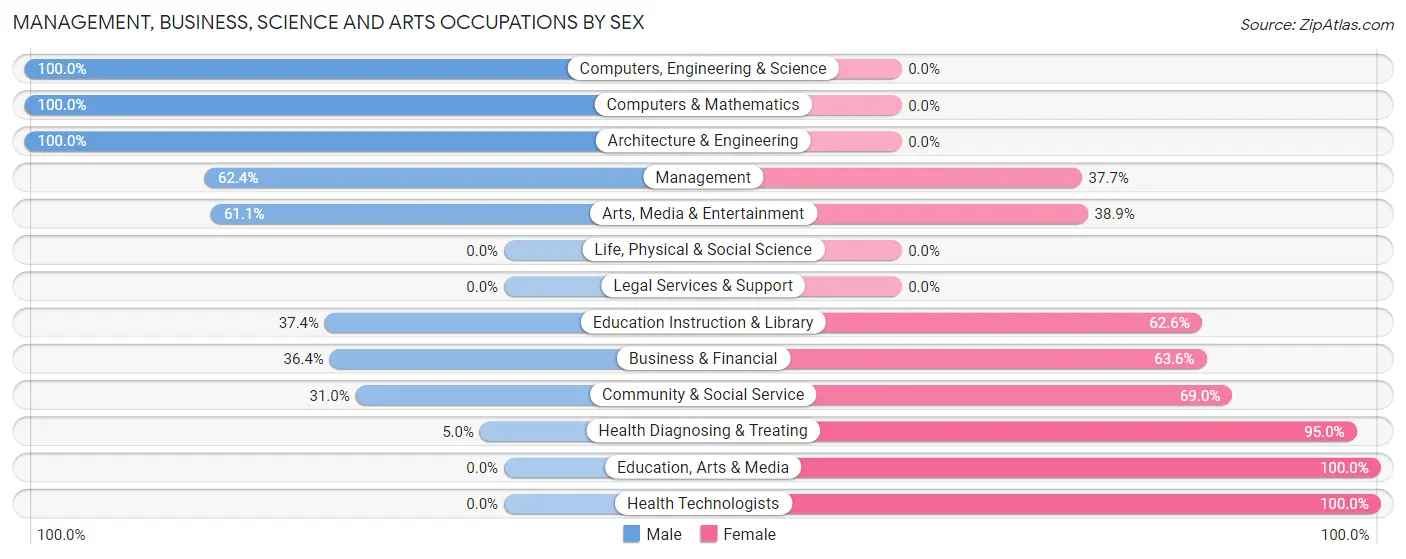
| Occupation | Male | Female |
| Management | 159 (62.4%) | 96 (37.7%) |
| Business & Financial | 28 (36.4%) | 49 (63.6%) |
| Computers, Engineering & Science | 66 (100.0%) | 0 (0.0%) |
| Computers & Mathematics | 20 (100.0%) | 0 (0.0%) |
| Architecture & Engineering | 46 (100.0%) | 0 (0.0%) |
| Life, Physical & Social Science | 0 (0.0%) | 0 (0.0%) |
| Community & Social Service | 87 (31.0%) | 194 (69.0%) |
| Education, Arts & Media | 0 (0.0%) | 71 (100.0%) |
| Legal Services & Support | 0 (0.0%) | 0 (0.0%) |
| Education Instruction & Library | 65 (37.4%) | 109 (62.6%) |
| Arts, Media & Entertainment | 22 (61.1%) | 14 (38.9%) |
| Health Diagnosing & Treating | 13 (5.0%) | 245 (95.0%) |
| Health Technologists | 0 (0.0%) | 81 (100.0%) |
| Total (Category) | 353 (37.7%) | 584 (62.3%) |
| Total (Overall) | 1,913 (56.1%) | 1,498 (43.9%) |
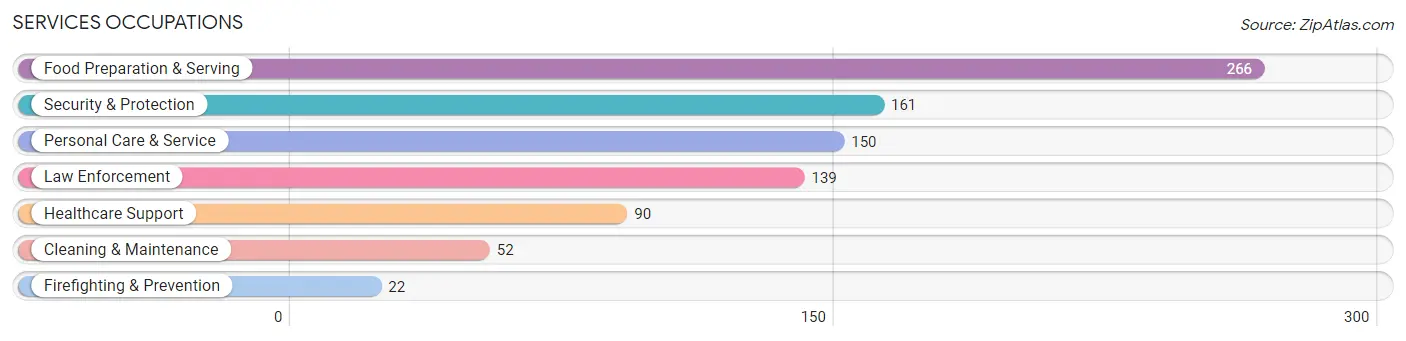
Services Occupations
The most common Services occupations in Southport are Food Preparation & Serving (266 | 7.8%), Security & Protection (161 | 4.7%), Personal Care & Service (150 | 4.4%), Law Enforcement (139 | 4.1%), and Healthcare Support (90 | 2.6%).
Services Occupations by Sex
Within the Services occupations in Southport, the most male-oriented occupations are Security & Protection (100.0%), Firefighting & Prevention (100.0%), and Law Enforcement (100.0%), while the most female-oriented occupations are Healthcare Support (100.0%), Cleaning & Maintenance (82.7%), and Personal Care & Service (35.3%).
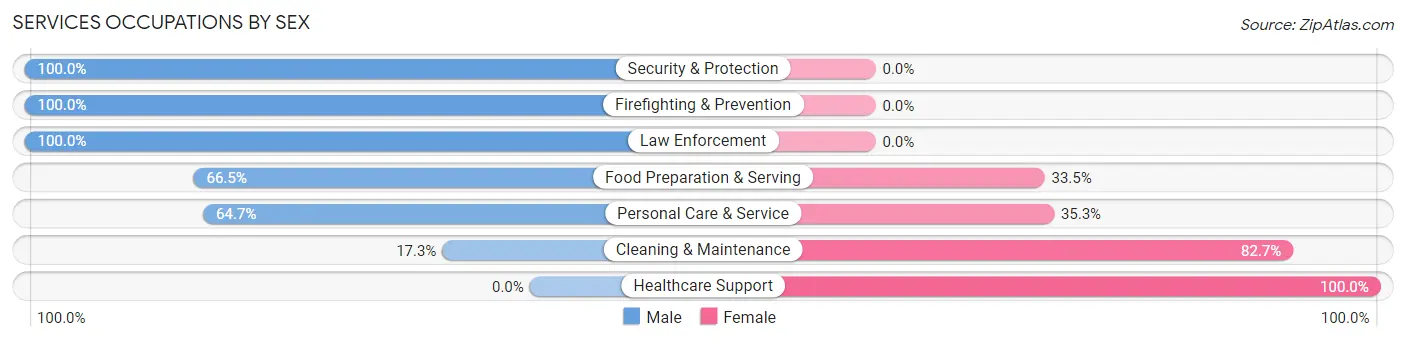
| Occupation | Male | Female |
| Healthcare Support | 0 (0.0%) | 90 (100.0%) |
| Security & Protection | 161 (100.0%) | 0 (0.0%) |
| Firefighting & Prevention | 22 (100.0%) | 0 (0.0%) |
| Law Enforcement | 139 (100.0%) | 0 (0.0%) |
| Food Preparation & Serving | 177 (66.5%) | 89 (33.5%) |
| Cleaning & Maintenance | 9 (17.3%) | 43 (82.7%) |
| Personal Care & Service | 97 (64.7%) | 53 (35.3%) |
| Total (Category) | 444 (61.8%) | 275 (38.3%) |
| Total (Overall) | 1,913 (56.1%) | 1,498 (43.9%) |
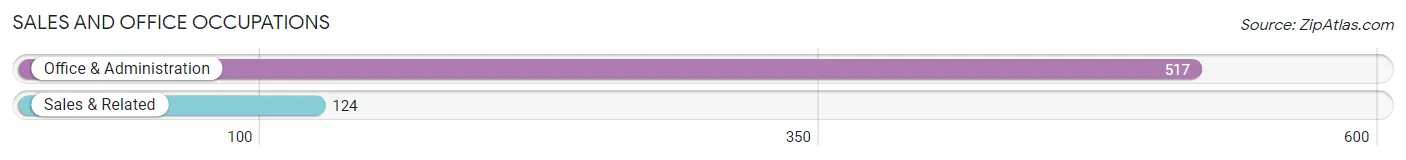
Sales and Office Occupations
The most common Sales and Office occupations in Southport are Office & Administration (517 | 15.2%), and Sales & Related (124 | 3.6%).
Sales and Office Occupations by Sex
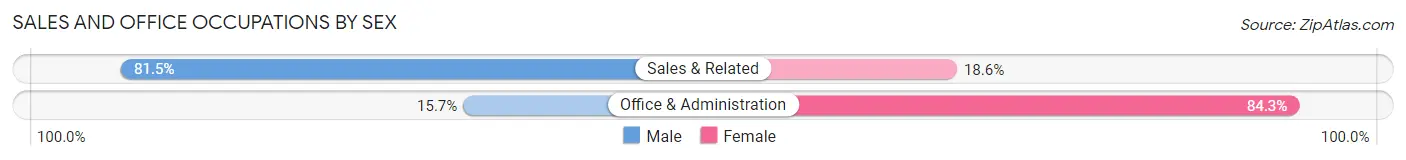
| Occupation | Male | Female |
| Sales & Related | 101 (81.5%) | 23 (18.5%) |
| Office & Administration | 81 (15.7%) | 436 (84.3%) |
| Total (Category) | 182 (28.4%) | 459 (71.6%) |
| Total (Overall) | 1,913 (56.1%) | 1,498 (43.9%) |
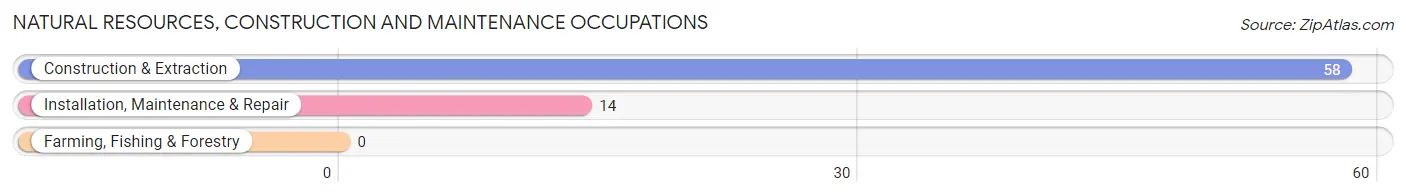
Natural Resources, Construction and Maintenance Occupations
The most common Natural Resources, Construction and Maintenance occupations in Southport are Construction & Extraction (58 | 1.7%), and Installation, Maintenance & Repair (14 | 0.4%).
Natural Resources, Construction and Maintenance Occupations by Sex
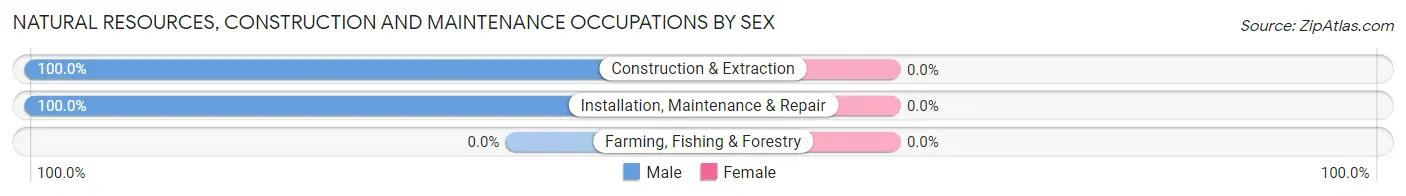
| Occupation | Male | Female |
| Farming, Fishing & Forestry | 0 (0.0%) | 0 (0.0%) |
| Construction & Extraction | 58 (100.0%) | 0 (0.0%) |
| Installation, Maintenance & Repair | 14 (100.0%) | 0 (0.0%) |
| Total (Category) | 72 (100.0%) | 0 (0.0%) |
| Total (Overall) | 1,913 (56.1%) | 1,498 (43.9%) |
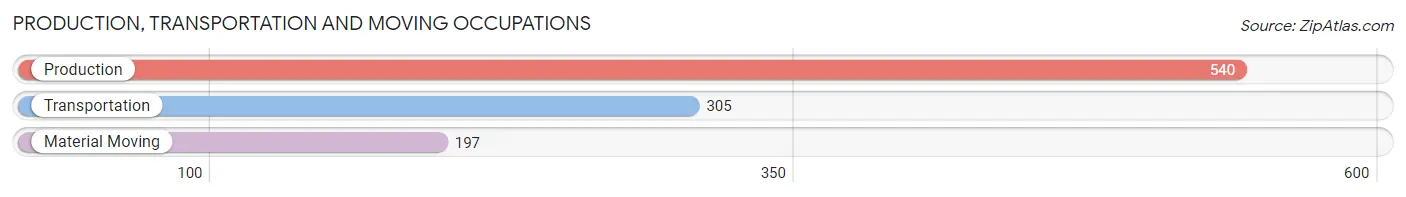
Production, Transportation and Moving Occupations
The most common Production, Transportation and Moving occupations in Southport are Production (540 | 15.8%), Transportation (305 | 8.9%), and Material Moving (197 | 5.8%).
Production, Transportation and Moving Occupations by Sex
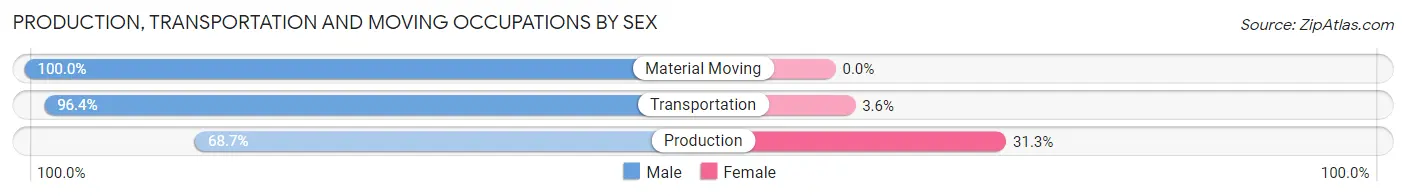
| Occupation | Male | Female |
| Production | 371 (68.7%) | 169 (31.3%) |
| Transportation | 294 (96.4%) | 11 (3.6%) |
| Material Moving | 197 (100.0%) | 0 (0.0%) |
| Total (Category) | 862 (82.7%) | 180 (17.3%) |
| Total (Overall) | 1,913 (56.1%) | 1,498 (43.9%) |
Employment Industries by Sex in Southport
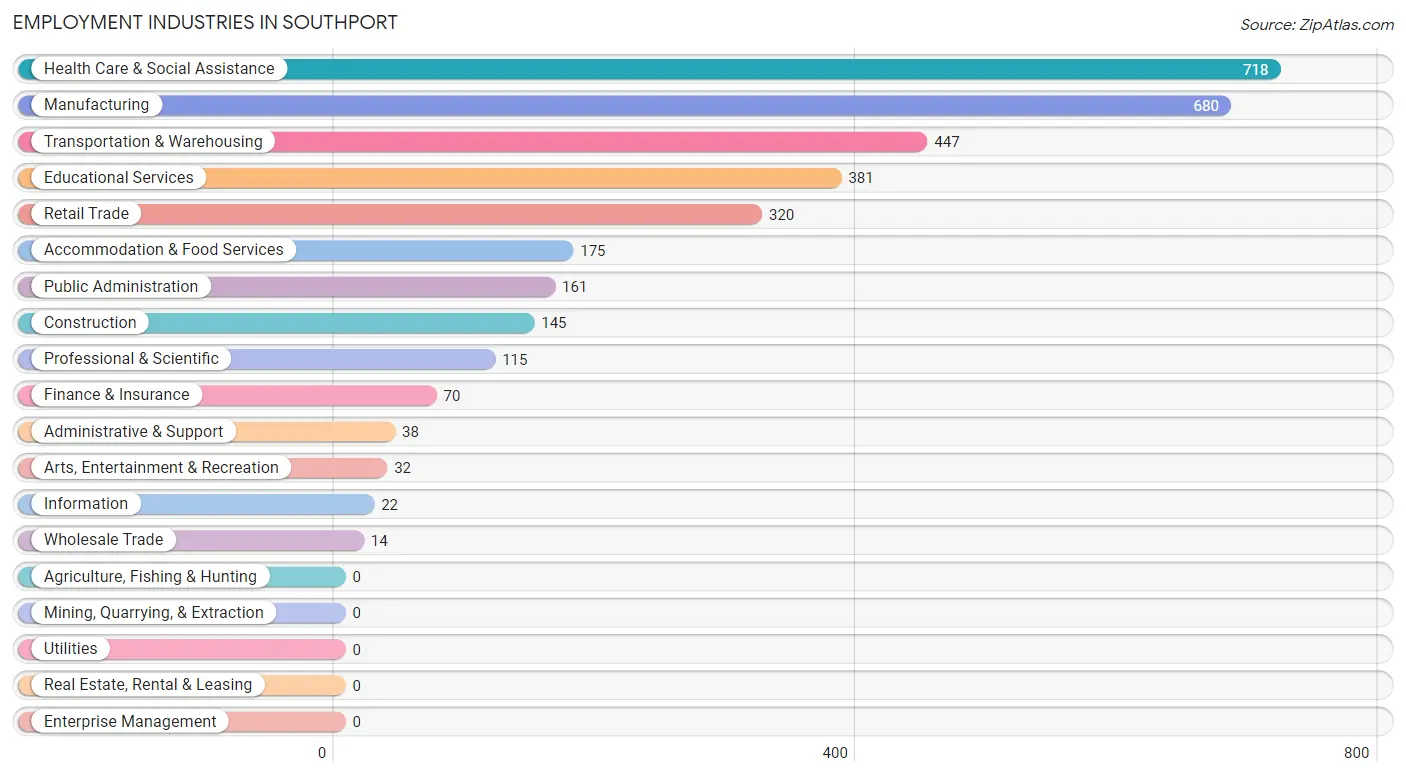
Employment Industries in Southport
The major employment industries in Southport include Health Care & Social Assistance (718 | 21.0%), Manufacturing (680 | 19.9%), Transportation & Warehousing (447 | 13.1%), Educational Services (381 | 11.2%), and Retail Trade (320 | 9.4%).
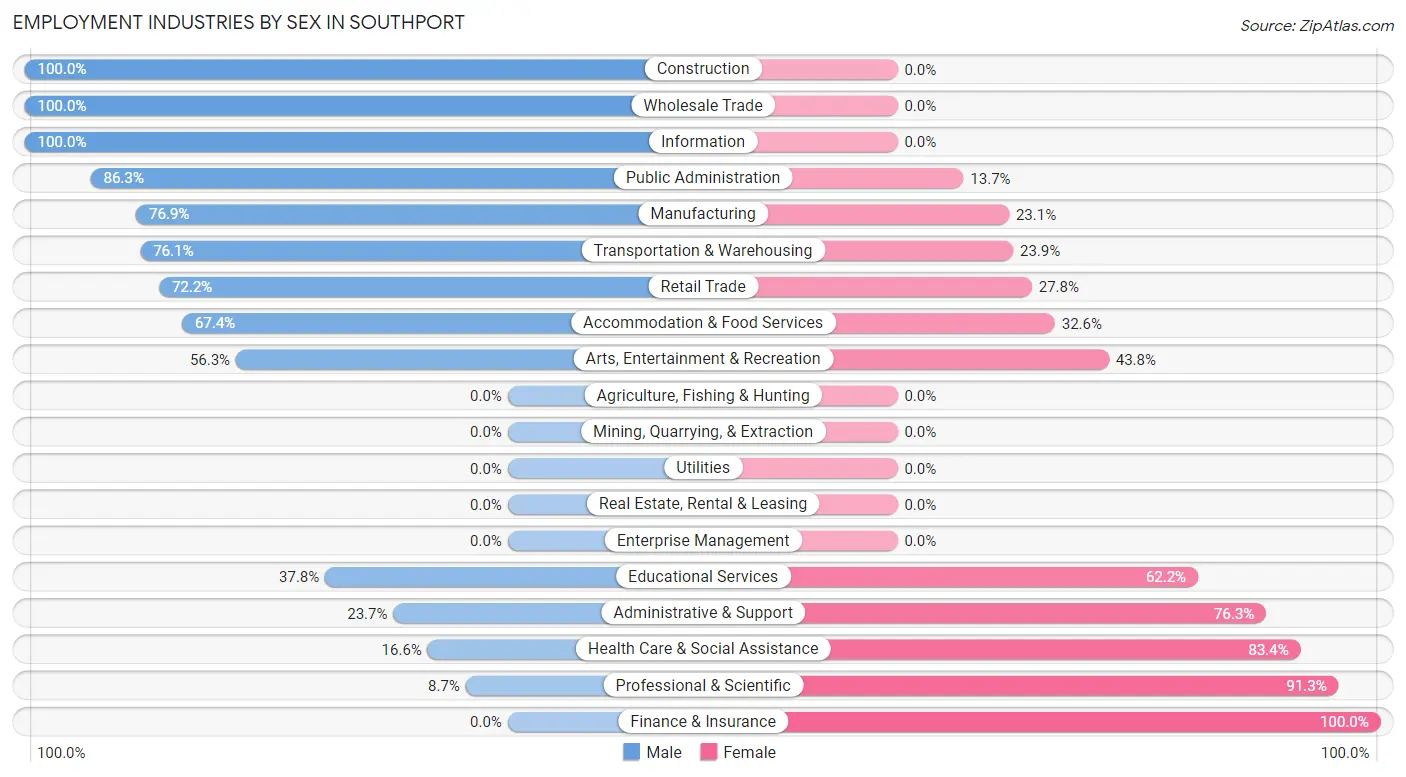
Employment Industries by Sex in Southport
The Southport industries that see more men than women are Construction (100.0%), Wholesale Trade (100.0%), and Information (100.0%), whereas the industries that tend to have a higher number of women are Finance & Insurance (100.0%), Professional & Scientific (91.3%), and Health Care & Social Assistance (83.4%).
| Industry | Male | Female |
| Agriculture, Fishing & Hunting | 0 (0.0%) | 0 (0.0%) |
| Mining, Quarrying, & Extraction | 0 (0.0%) | 0 (0.0%) |
| Construction | 145 (100.0%) | 0 (0.0%) |
| Manufacturing | 523 (76.9%) | 157 (23.1%) |
| Wholesale Trade | 14 (100.0%) | 0 (0.0%) |
| Retail Trade | 231 (72.2%) | 89 (27.8%) |
| Transportation & Warehousing | 340 (76.1%) | 107 (23.9%) |
| Utilities | 0 (0.0%) | 0 (0.0%) |
| Information | 22 (100.0%) | 0 (0.0%) |
| Finance & Insurance | 0 (0.0%) | 70 (100.0%) |
| Real Estate, Rental & Leasing | 0 (0.0%) | 0 (0.0%) |
| Professional & Scientific | 10 (8.7%) | 105 (91.3%) |
| Enterprise Management | 0 (0.0%) | 0 (0.0%) |
| Administrative & Support | 9 (23.7%) | 29 (76.3%) |
| Educational Services | 144 (37.8%) | 237 (62.2%) |
| Health Care & Social Assistance | 119 (16.6%) | 599 (83.4%) |
| Arts, Entertainment & Recreation | 18 (56.2%) | 14 (43.8%) |
| Accommodation & Food Services | 118 (67.4%) | 57 (32.6%) |
| Public Administration | 139 (86.3%) | 22 (13.7%) |
| Total | 1,913 (56.1%) | 1,498 (43.9%) |
Education in Southport
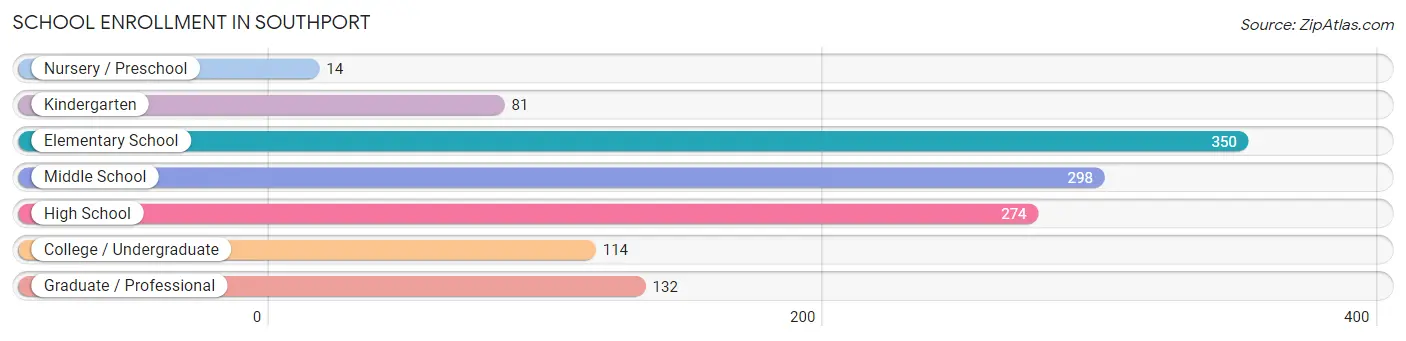
School Enrollment in Southport
The most common levels of schooling among the 1,263 students in Southport are elementary school (350 | 27.7%), middle school (298 | 23.6%), and high school (274 | 21.7%).
| School Level | # Students | % Students |
| Nursery / Preschool | 14 | 1.1% |
| Kindergarten | 81 | 6.4% |
| Elementary School | 350 | 27.7% |
| Middle School | 298 | 23.6% |
| High School | 274 | 21.7% |
| College / Undergraduate | 114 | 9.0% |
| Graduate / Professional | 132 | 10.4% |
| Total | 1,263 | 100.0% |
School Enrollment by Age by Funding Source in Southport
Out of a total of 1,263 students who are enrolled in schools in Southport, 244 (19.3%) attend a private institution, while the remaining 1,019 (80.7%) are enrolled in public schools. The age group of 20 to 24 year olds has the highest likelihood of being enrolled in private schools, with 82 (100.0% in the age bracket) enrolled. Conversely, the age group of 3 to 4 year olds has the lowest likelihood of being enrolled in a private school, with 24 (100.0% in the age bracket) attending a public institution.
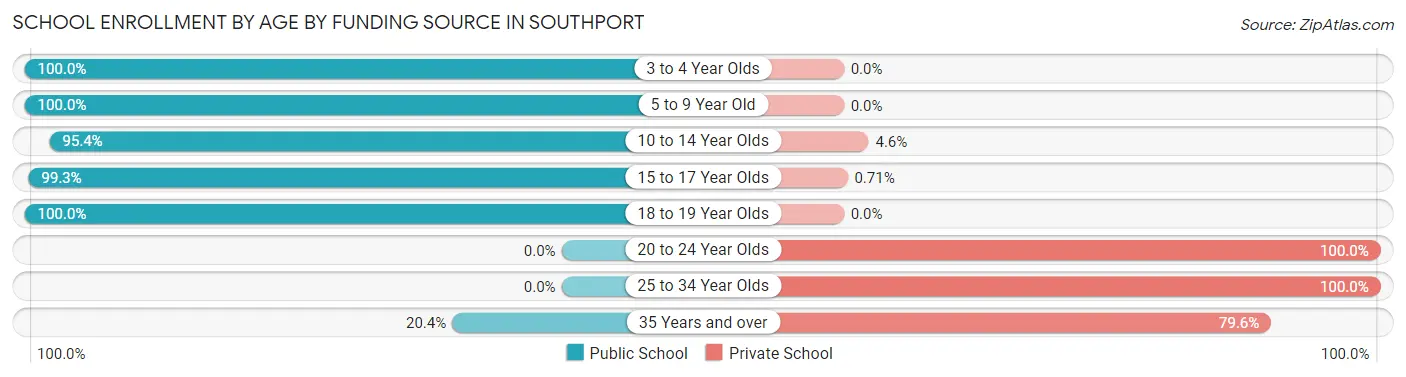
| Age Bracket | Public School | Private School |
| 3 to 4 Year Olds | 24 (100.0%) | 0 (0.0%) |
| 5 to 9 Year Old | 406 (100.0%) | 0 (0.0%) |
| 10 to 14 Year Olds | 371 (95.4%) | 18 (4.6%) |
| 15 to 17 Year Olds | 140 (99.3%) | 1 (0.7%) |
| 18 to 19 Year Olds | 57 (100.0%) | 0 (0.0%) |
| 20 to 24 Year Olds | 0 (0.0%) | 82 (100.0%) |
| 25 to 34 Year Olds | 0 (0.0%) | 61 (100.0%) |
| 35 Years and over | 21 (20.4%) | 82 (79.6%) |
| Total | 1,019 (80.7%) | 244 (19.3%) |
Educational Attainment by Field of Study in Southport
Education (258 | 33.4%), business (108 | 14.0%), engineering (94 | 12.2%), arts & humanities (86 | 11.1%), and science & technology (65 | 8.4%) are the most common fields of study among 773 individuals in Southport who have obtained a bachelor's degree or higher.
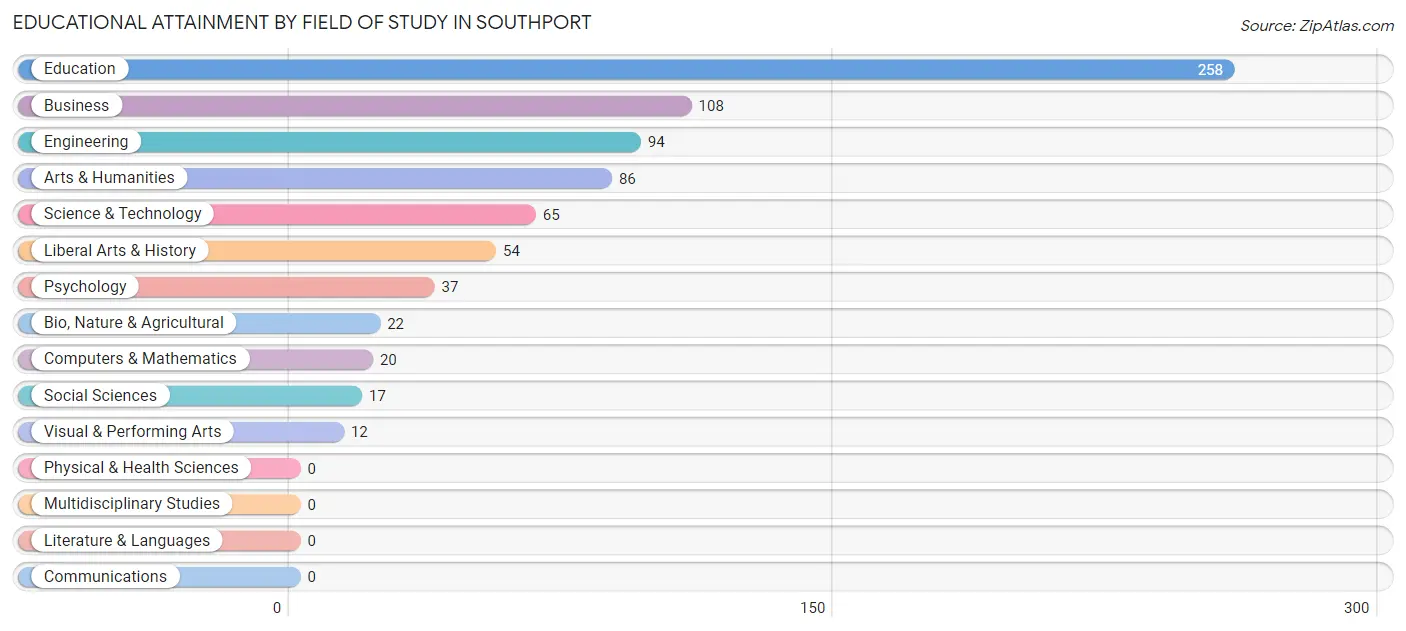
| Field of Study | # Graduates | % Graduates |
| Computers & Mathematics | 20 | 2.6% |
| Bio, Nature & Agricultural | 22 | 2.9% |
| Physical & Health Sciences | 0 | 0.0% |
| Psychology | 37 | 4.8% |
| Social Sciences | 17 | 2.2% |
| Engineering | 94 | 12.2% |
| Multidisciplinary Studies | 0 | 0.0% |
| Science & Technology | 65 | 8.4% |
| Business | 108 | 14.0% |
| Education | 258 | 33.4% |
| Literature & Languages | 0 | 0.0% |
| Liberal Arts & History | 54 | 7.0% |
| Visual & Performing Arts | 12 | 1.5% |
| Communications | 0 | 0.0% |
| Arts & Humanities | 86 | 11.1% |
| Total | 773 | 100.0% |
Transportation & Commute in Southport
Vehicle Availability by Sex in Southport
The most prevalent vehicle ownership categories in Southport are males with 2 vehicles (828, accounting for 52.0%) and females with 2 vehicles (575, making up 58.5%).
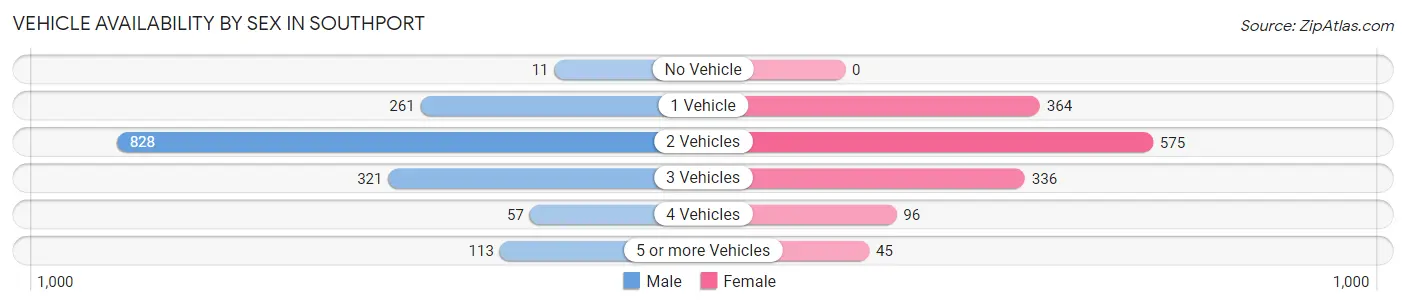
| Vehicles Available | Male | Female |
| No Vehicle | 11 (0.7%) | 0 (0.0%) |
| 1 Vehicle | 261 (16.4%) | 364 (25.7%) |
| 2 Vehicles | 828 (52.0%) | 575 (40.6%) |
| 3 Vehicles | 321 (20.2%) | 336 (23.7%) |
| 4 Vehicles | 57 (3.6%) | 96 (6.8%) |
| 5 or more Vehicles | 113 (7.1%) | 45 (3.2%) |
| Total | 1,591 (100.0%) | 1,416 (100.0%) |
Commute Time in Southport
The most frequently occuring commute durations in Southport are 10 to 14 minutes (762 commuters, 25.5%), 20 to 24 minutes (614 commuters, 20.5%), and 15 to 19 minutes (447 commuters, 15.0%).
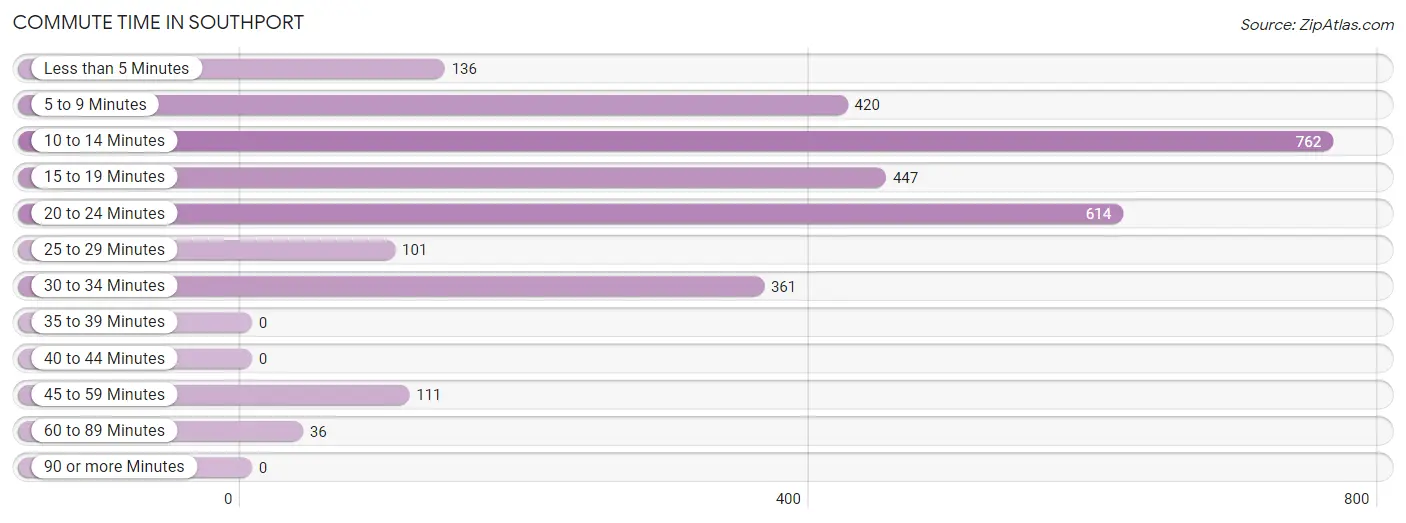
| Commute Time | # Commuters | % Commuters |
| Less than 5 Minutes | 136 | 4.5% |
| 5 to 9 Minutes | 420 | 14.1% |
| 10 to 14 Minutes | 762 | 25.5% |
| 15 to 19 Minutes | 447 | 15.0% |
| 20 to 24 Minutes | 614 | 20.5% |
| 25 to 29 Minutes | 101 | 3.4% |
| 30 to 34 Minutes | 361 | 12.1% |
| 35 to 39 Minutes | 0 | 0.0% |
| 40 to 44 Minutes | 0 | 0.0% |
| 45 to 59 Minutes | 111 | 3.7% |
| 60 to 89 Minutes | 36 | 1.2% |
| 90 or more Minutes | 0 | 0.0% |
Commute Time by Sex in Southport
The most common commute times in Southport are 10 to 14 minutes (507 commuters, 32.1%) for males and 5 to 9 minutes (281 commuters, 20.0%) for females.
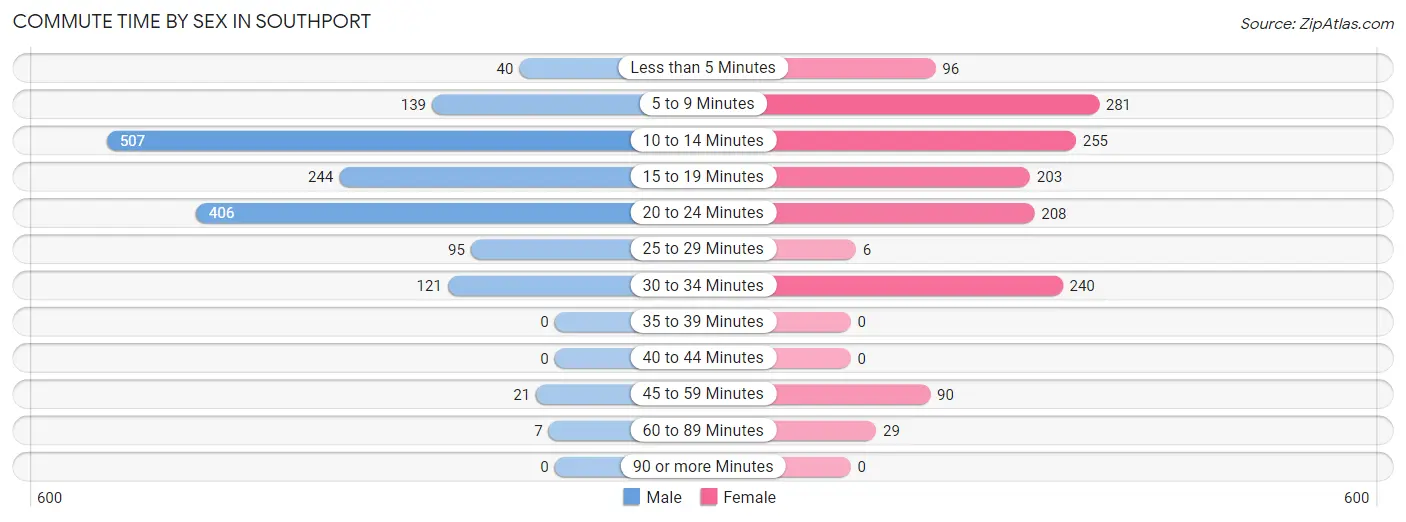
| Commute Time | Male | Female |
| Less than 5 Minutes | 40 (2.5%) | 96 (6.8%) |
| 5 to 9 Minutes | 139 (8.8%) | 281 (20.0%) |
| 10 to 14 Minutes | 507 (32.1%) | 255 (18.1%) |
| 15 to 19 Minutes | 244 (15.4%) | 203 (14.4%) |
| 20 to 24 Minutes | 406 (25.7%) | 208 (14.8%) |
| 25 to 29 Minutes | 95 (6.0%) | 6 (0.4%) |
| 30 to 34 Minutes | 121 (7.7%) | 240 (17.1%) |
| 35 to 39 Minutes | 0 (0.0%) | 0 (0.0%) |
| 40 to 44 Minutes | 0 (0.0%) | 0 (0.0%) |
| 45 to 59 Minutes | 21 (1.3%) | 90 (6.4%) |
| 60 to 89 Minutes | 7 (0.4%) | 29 (2.1%) |
| 90 or more Minutes | 0 (0.0%) | 0 (0.0%) |
Time of Departure to Work by Sex in Southport
The most frequent times of departure to work in Southport are 4:00 PM to 11:59 PM (274, 17.3%) for males and 4:00 PM to 11:59 PM (353, 25.1%) for females.
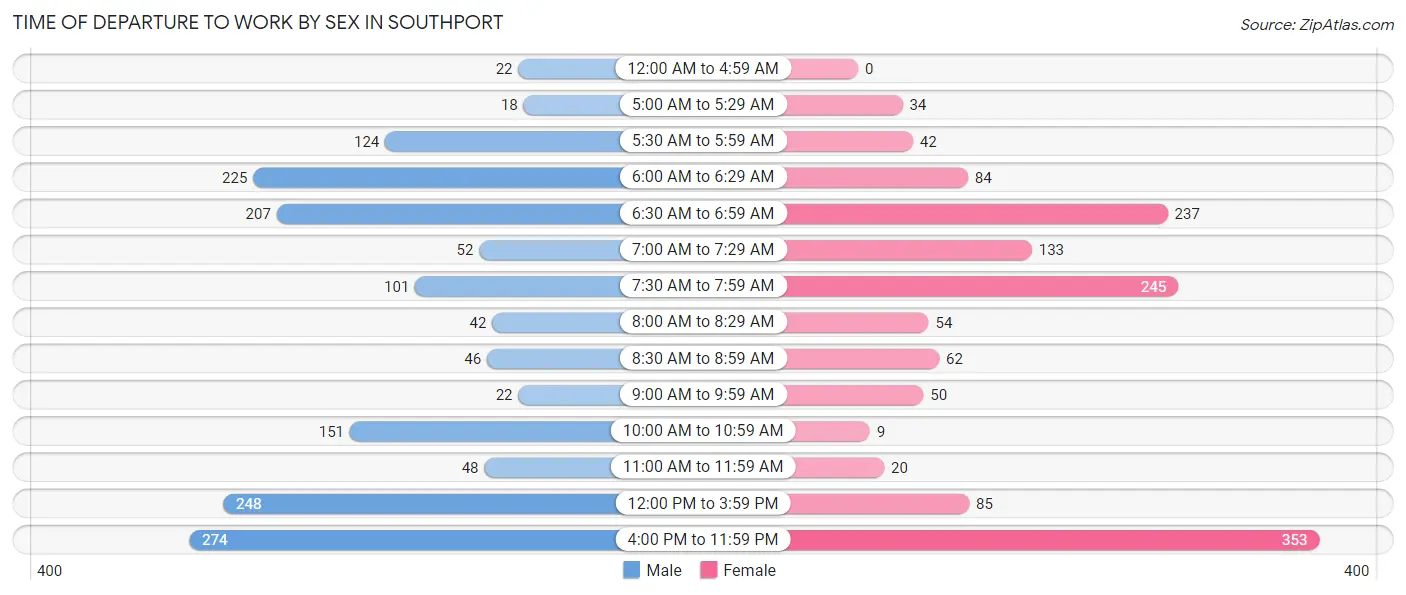
| Time of Departure | Male | Female |
| 12:00 AM to 4:59 AM | 22 (1.4%) | 0 (0.0%) |
| 5:00 AM to 5:29 AM | 18 (1.1%) | 34 (2.4%) |
| 5:30 AM to 5:59 AM | 124 (7.9%) | 42 (3.0%) |
| 6:00 AM to 6:29 AM | 225 (14.2%) | 84 (6.0%) |
| 6:30 AM to 6:59 AM | 207 (13.1%) | 237 (16.8%) |
| 7:00 AM to 7:29 AM | 52 (3.3%) | 133 (9.5%) |
| 7:30 AM to 7:59 AM | 101 (6.4%) | 245 (17.4%) |
| 8:00 AM to 8:29 AM | 42 (2.7%) | 54 (3.8%) |
| 8:30 AM to 8:59 AM | 46 (2.9%) | 62 (4.4%) |
| 9:00 AM to 9:59 AM | 22 (1.4%) | 50 (3.5%) |
| 10:00 AM to 10:59 AM | 151 (9.6%) | 9 (0.6%) |
| 11:00 AM to 11:59 AM | 48 (3.0%) | 20 (1.4%) |
| 12:00 PM to 3:59 PM | 248 (15.7%) | 85 (6.0%) |
| 4:00 PM to 11:59 PM | 274 (17.3%) | 353 (25.1%) |
| Total | 1,580 (100.0%) | 1,408 (100.0%) |
Housing Occupancy in Southport
Occupancy by Ownership in Southport
Of the total 3,188 dwellings in Southport, owner-occupied units account for 2,164 (67.9%), while renter-occupied units make up 1,024 (32.1%).
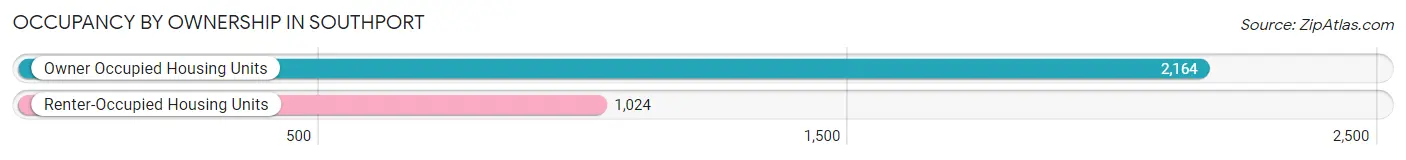
| Occupancy | # Housing Units | % Housing Units |
| Owner Occupied Housing Units | 2,164 | 67.9% |
| Renter-Occupied Housing Units | 1,024 | 32.1% |
| Total Occupied Housing Units | 3,188 | 100.0% |
Occupancy by Household Size in Southport
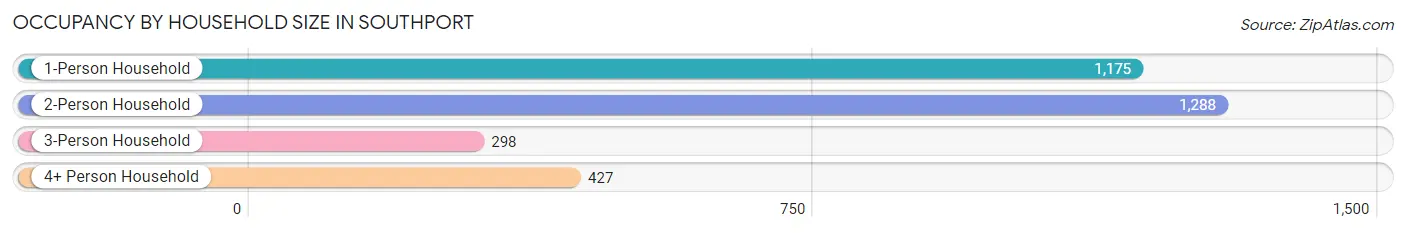
| Household Size | # Housing Units | % Housing Units |
| 1-Person Household | 1,175 | 36.9% |
| 2-Person Household | 1,288 | 40.4% |
| 3-Person Household | 298 | 9.3% |
| 4+ Person Household | 427 | 13.4% |
| Total Housing Units | 3,188 | 100.0% |
Occupancy by Ownership by Household Size in Southport
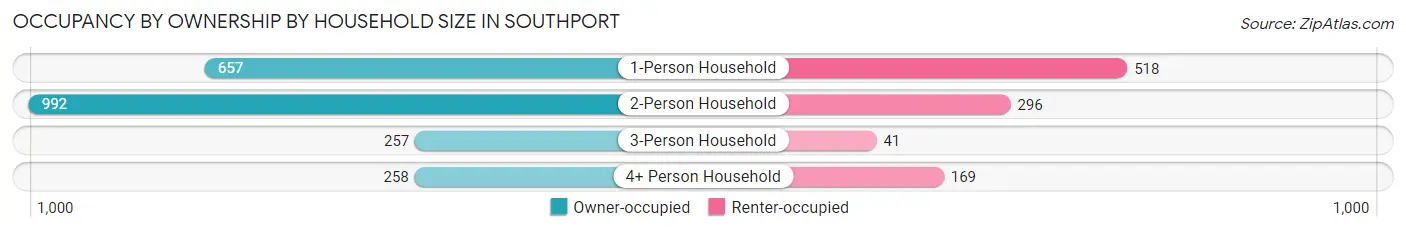
| Household Size | Owner-occupied | Renter-occupied |
| 1-Person Household | 657 (55.9%) | 518 (44.1%) |
| 2-Person Household | 992 (77.0%) | 296 (23.0%) |
| 3-Person Household | 257 (86.2%) | 41 (13.8%) |
| 4+ Person Household | 258 (60.4%) | 169 (39.6%) |
| Total Housing Units | 2,164 (67.9%) | 1,024 (32.1%) |
Occupancy by Educational Attainment in Southport
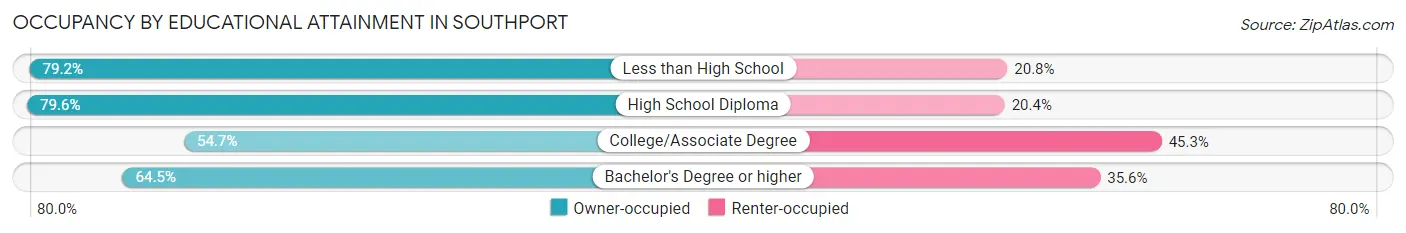
| Household Size | Owner-occupied | Renter-occupied |
| Less than High School | 118 (79.2%) | 31 (20.8%) |
| High School Diploma | 1,066 (79.6%) | 273 (20.4%) |
| College/Associate Degree | 650 (54.7%) | 538 (45.3%) |
| Bachelor's Degree or higher | 330 (64.4%) | 182 (35.5%) |
Occupancy by Age of Householder in Southport

| Age Bracket | # Households | % Households |
| Under 35 Years | 794 | 24.9% |
| 35 to 44 Years | 456 | 14.3% |
| 45 to 54 Years | 256 | 8.0% |
| 55 to 64 Years | 658 | 20.6% |
| 65 to 74 Years | 514 | 16.1% |
| 75 to 84 Years | 363 | 11.4% |
| 85 Years and Over | 147 | 4.6% |
| Total | 3,188 | 100.0% |
Housing Finances in Southport
Median Income by Occupancy in Southport
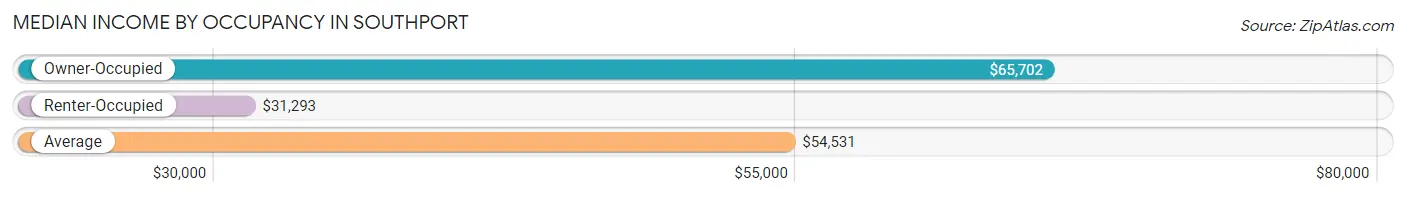
| Occupancy Type | # Households | Median Income |
| Owner-Occupied | 2,164 (67.9%) | $65,702 |
| Renter-Occupied | 1,024 (32.1%) | $31,293 |
| Average | 3,188 (100.0%) | $54,531 |
Occupancy by Householder Income Bracket in Southport
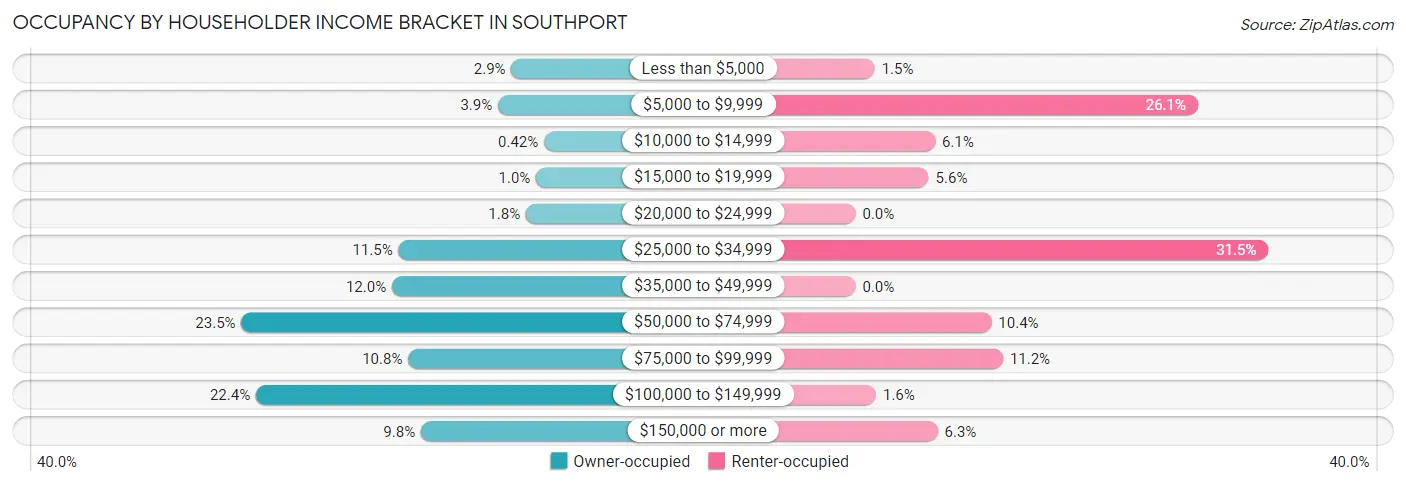
| Income Bracket | Owner-occupied | Renter-occupied |
| Less than $5,000 | 63 (2.9%) | 15 (1.5%) |
| $5,000 to $9,999 | 85 (3.9%) | 267 (26.1%) |
| $10,000 to $14,999 | 9 (0.4%) | 62 (6.0%) |
| $15,000 to $19,999 | 22 (1.0%) | 57 (5.6%) |
| $20,000 to $24,999 | 39 (1.8%) | 0 (0.0%) |
| $25,000 to $34,999 | 249 (11.5%) | 322 (31.5%) |
| $35,000 to $49,999 | 260 (12.0%) | 0 (0.0%) |
| $50,000 to $74,999 | 508 (23.5%) | 106 (10.3%) |
| $75,000 to $99,999 | 233 (10.8%) | 115 (11.2%) |
| $100,000 to $149,999 | 484 (22.4%) | 16 (1.6%) |
| $150,000 or more | 212 (9.8%) | 64 (6.2%) |
| Total | 2,164 (100.0%) | 1,024 (100.0%) |
Monthly Housing Cost Tiers in Southport
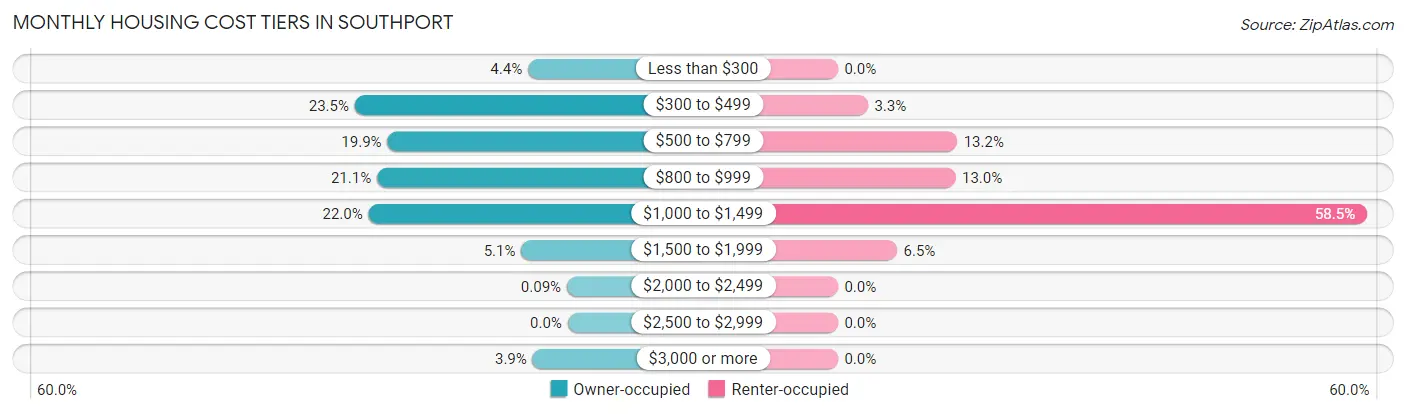
| Monthly Cost | Owner-occupied | Renter-occupied |
| Less than $300 | 95 (4.4%) | 0 (0.0%) |
| $300 to $499 | 509 (23.5%) | 34 (3.3%) |
| $500 to $799 | 431 (19.9%) | 135 (13.2%) |
| $800 to $999 | 456 (21.1%) | 133 (13.0%) |
| $1,000 to $1,499 | 476 (22.0%) | 599 (58.5%) |
| $1,500 to $1,999 | 111 (5.1%) | 67 (6.5%) |
| $2,000 to $2,499 | 2 (0.1%) | 0 (0.0%) |
| $2,500 to $2,999 | 0 (0.0%) | 0 (0.0%) |
| $3,000 or more | 84 (3.9%) | 0 (0.0%) |
| Total | 2,164 (100.0%) | 1,024 (100.0%) |
Physical Housing Characteristics in Southport
Housing Structures in Southport
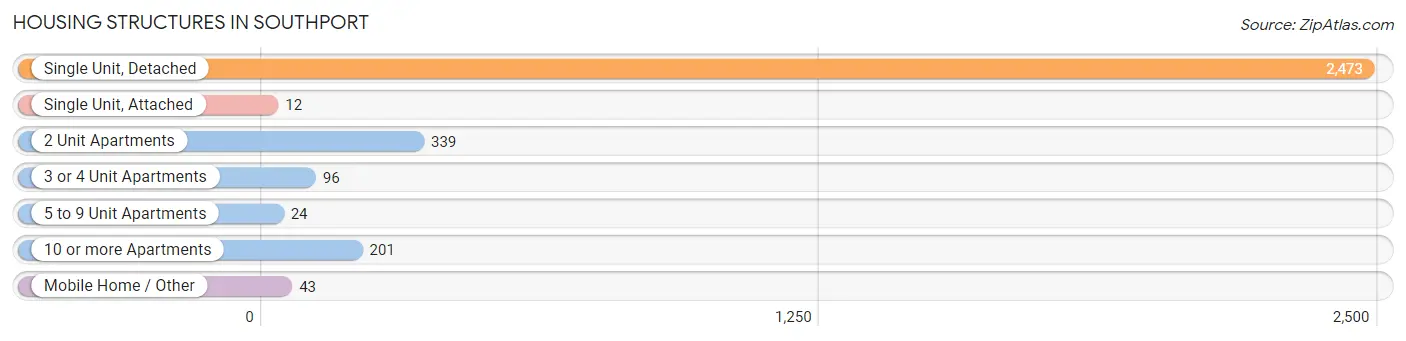
| Structure Type | # Housing Units | % Housing Units |
| Single Unit, Detached | 2,473 | 77.6% |
| Single Unit, Attached | 12 | 0.4% |
| 2 Unit Apartments | 339 | 10.6% |
| 3 or 4 Unit Apartments | 96 | 3.0% |
| 5 to 9 Unit Apartments | 24 | 0.7% |
| 10 or more Apartments | 201 | 6.3% |
| Mobile Home / Other | 43 | 1.3% |
| Total | 3,188 | 100.0% |
Housing Structures by Occupancy in Southport
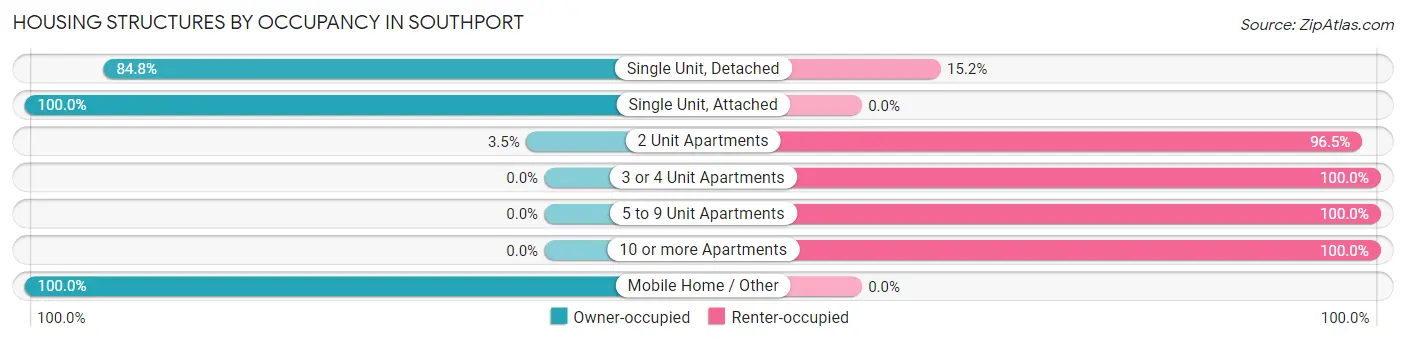
| Structure Type | Owner-occupied | Renter-occupied |
| Single Unit, Detached | 2,097 (84.8%) | 376 (15.2%) |
| Single Unit, Attached | 12 (100.0%) | 0 (0.0%) |
| 2 Unit Apartments | 12 (3.5%) | 327 (96.5%) |
| 3 or 4 Unit Apartments | 0 (0.0%) | 96 (100.0%) |
| 5 to 9 Unit Apartments | 0 (0.0%) | 24 (100.0%) |
| 10 or more Apartments | 0 (0.0%) | 201 (100.0%) |
| Mobile Home / Other | 43 (100.0%) | 0 (0.0%) |
| Total | 2,164 (67.9%) | 1,024 (32.1%) |
Housing Structures by Number of Rooms in Southport
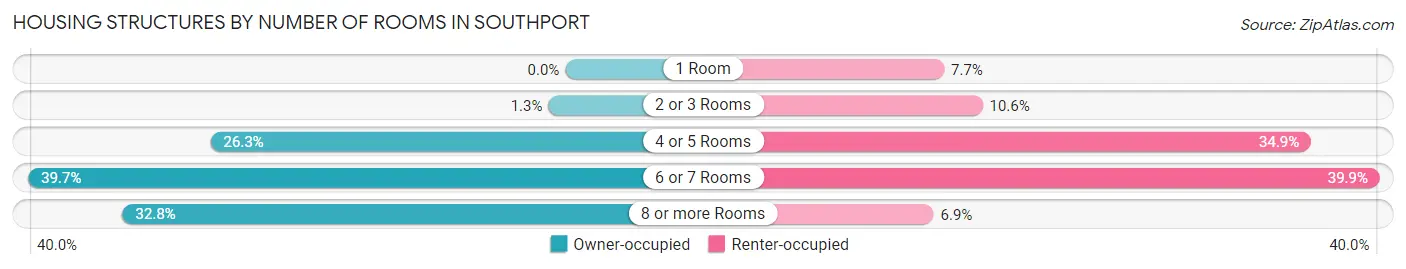
| Number of Rooms | Owner-occupied | Renter-occupied |
| 1 Room | 0 (0.0%) | 79 (7.7%) |
| 2 or 3 Rooms | 27 (1.3%) | 108 (10.5%) |
| 4 or 5 Rooms | 568 (26.3%) | 357 (34.9%) |
| 6 or 7 Rooms | 860 (39.7%) | 409 (39.9%) |
| 8 or more Rooms | 709 (32.8%) | 71 (6.9%) |
| Total | 2,164 (100.0%) | 1,024 (100.0%) |
Housing Structure by Heating Type in Southport
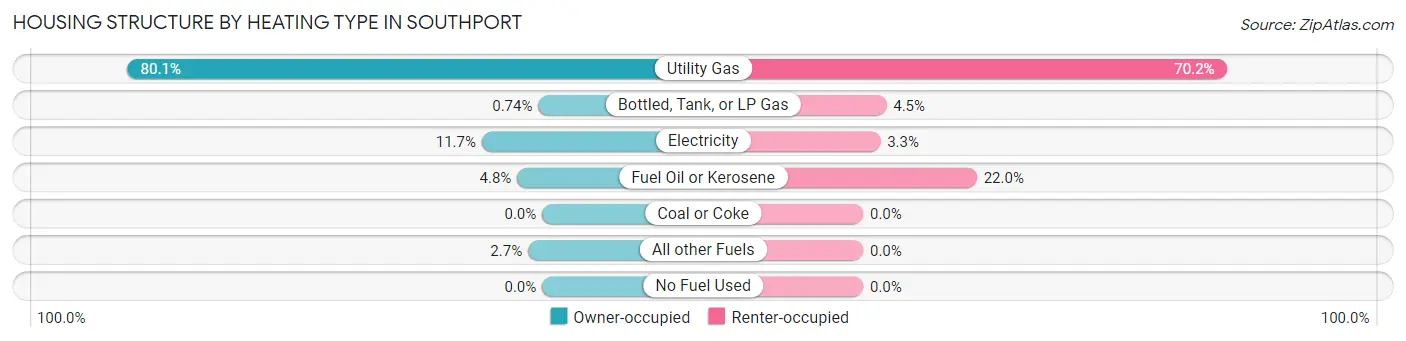
| Heating Type | Owner-occupied | Renter-occupied |
| Utility Gas | 1,733 (80.1%) | 719 (70.2%) |
| Bottled, Tank, or LP Gas | 16 (0.7%) | 46 (4.5%) |
| Electricity | 252 (11.7%) | 34 (3.3%) |
| Fuel Oil or Kerosene | 104 (4.8%) | 225 (22.0%) |
| Coal or Coke | 0 (0.0%) | 0 (0.0%) |
| All other Fuels | 59 (2.7%) | 0 (0.0%) |
| No Fuel Used | 0 (0.0%) | 0 (0.0%) |
| Total | 2,164 (100.0%) | 1,024 (100.0%) |
Household Vehicle Usage in Southport
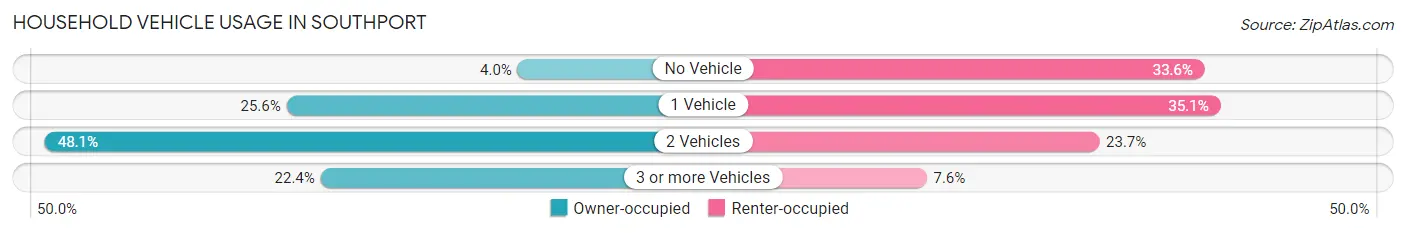
| Vehicles per Household | Owner-occupied | Renter-occupied |
| No Vehicle | 86 (4.0%) | 344 (33.6%) |
| 1 Vehicle | 553 (25.6%) | 359 (35.1%) |
| 2 Vehicles | 1,041 (48.1%) | 243 (23.7%) |
| 3 or more Vehicles | 484 (22.4%) | 78 (7.6%) |
| Total | 2,164 (100.0%) | 1,024 (100.0%) |
Real Estate & Mortgages in Southport
Real Estate and Mortgage Overview in Southport
| Characteristic | Without Mortgage | With Mortgage |
| Housing Units | 846 | 1,318 |
| Median Property Value | $90,900 | $85,800 |
| Median Household Income | $60,357 | $106 |
| Monthly Housing Costs | $441 | $84 |
| Real Estate Taxes | $2,176 | $51 |
Property Value by Mortgage Status in Southport
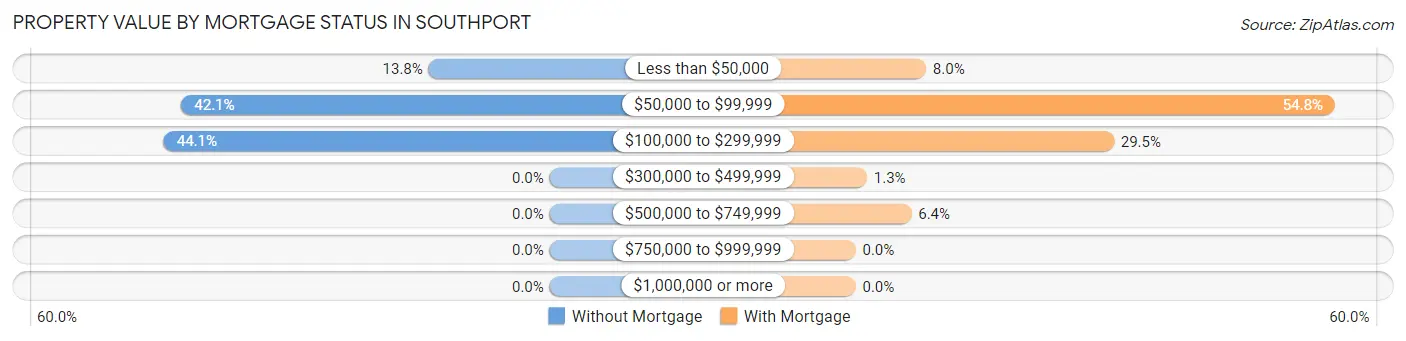
| Property Value | Without Mortgage | With Mortgage |
| Less than $50,000 | 117 (13.8%) | 106 (8.0%) |
| $50,000 to $99,999 | 356 (42.1%) | 722 (54.8%) |
| $100,000 to $299,999 | 373 (44.1%) | 389 (29.5%) |
| $300,000 to $499,999 | 0 (0.0%) | 17 (1.3%) |
| $500,000 to $749,999 | 0 (0.0%) | 84 (6.4%) |
| $750,000 to $999,999 | 0 (0.0%) | 0 (0.0%) |
| $1,000,000 or more | 0 (0.0%) | 0 (0.0%) |
| Total | 846 (100.0%) | 1,318 (100.0%) |
Household Income by Mortgage Status in Southport
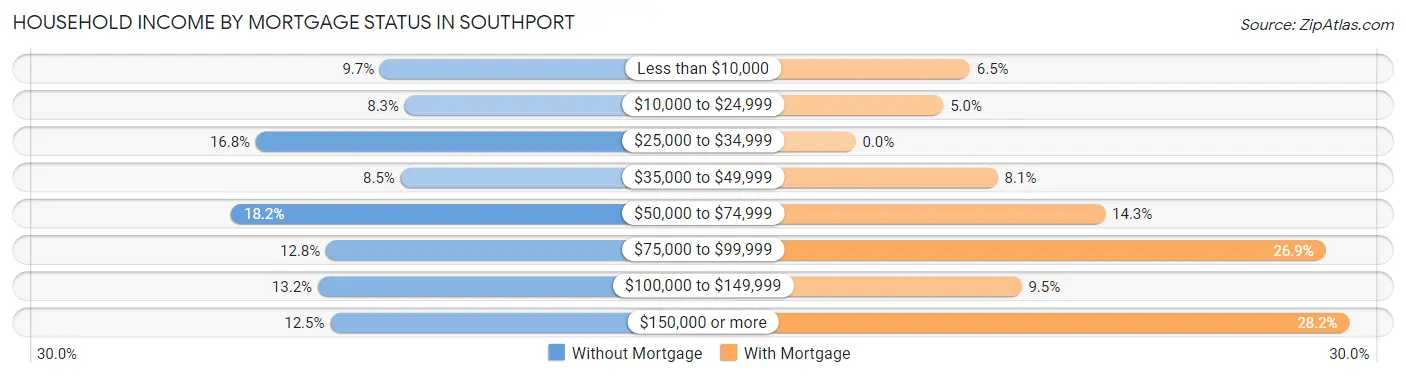
| Household Income | Without Mortgage | With Mortgage |
| Less than $10,000 | 82 (9.7%) | 86 (6.5%) |
| $10,000 to $24,999 | 70 (8.3%) | 66 (5.0%) |
| $25,000 to $34,999 | 142 (16.8%) | 0 (0.0%) |
| $35,000 to $49,999 | 72 (8.5%) | 107 (8.1%) |
| $50,000 to $74,999 | 154 (18.2%) | 188 (14.3%) |
| $75,000 to $99,999 | 108 (12.8%) | 354 (26.9%) |
| $100,000 to $149,999 | 112 (13.2%) | 125 (9.5%) |
| $150,000 or more | 106 (12.5%) | 372 (28.2%) |
| Total | 846 (100.0%) | 1,318 (100.0%) |
Property Value to Household Income Ratio in Southport
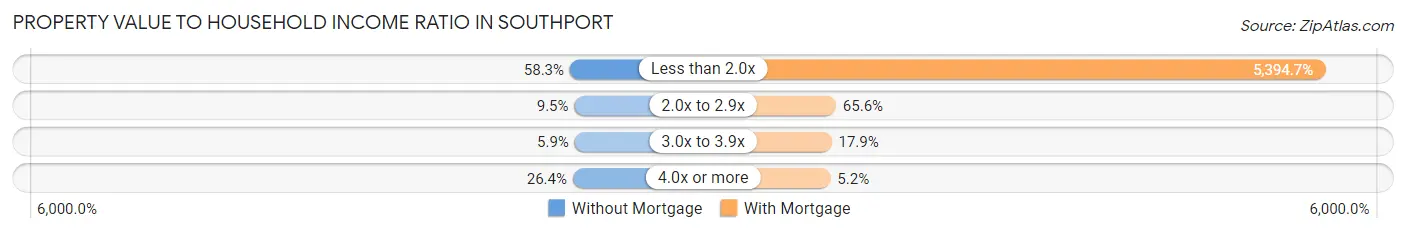
| Value-to-Income Ratio | Without Mortgage | With Mortgage |
| Less than 2.0x | 493 (58.3%) | 71,102 (5,394.7%) |
| 2.0x to 2.9x | 80 (9.5%) | 864 (65.5%) |
| 3.0x to 3.9x | 50 (5.9%) | 236 (17.9%) |
| 4.0x or more | 223 (26.4%) | 68 (5.2%) |
| Total | 846 (100.0%) | 1,318 (100.0%) |
Real Estate Taxes by Mortgage Status in Southport
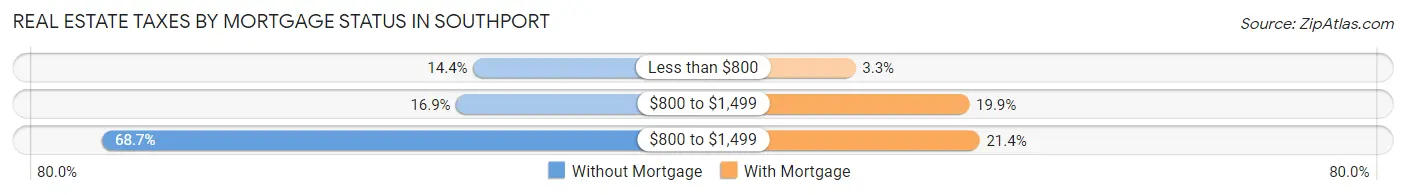
| Property Taxes | Without Mortgage | With Mortgage |
| Less than $800 | 122 (14.4%) | 43 (3.3%) |
| $800 to $1,499 | 143 (16.9%) | 262 (19.9%) |
| $800 to $1,499 | 581 (68.7%) | 282 (21.4%) |
| Total | 846 (100.0%) | 1,318 (100.0%) |
Health & Disability in Southport
Health Insurance Coverage by Age in Southport
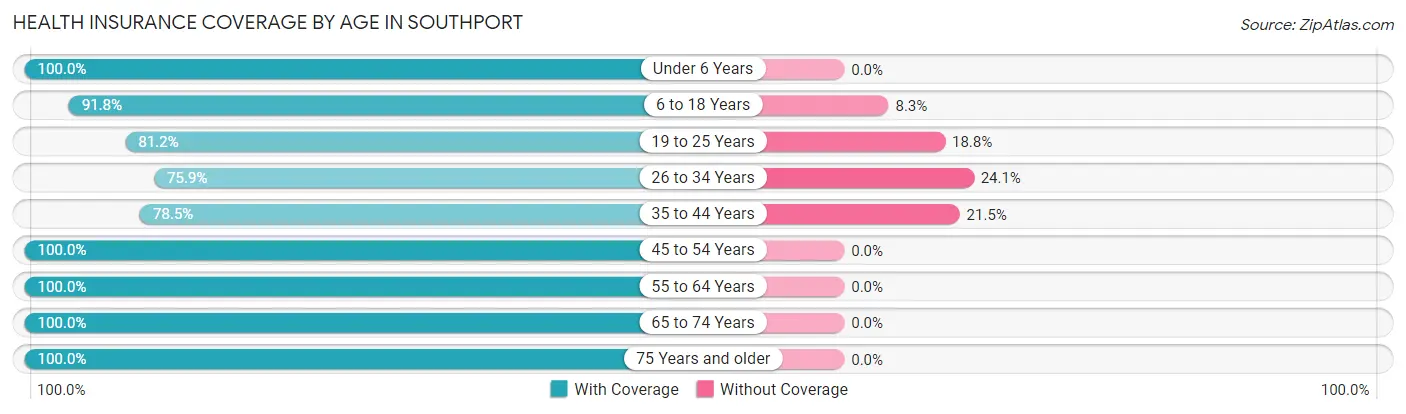
| Age Bracket | With Coverage | Without Coverage |
| Under 6 Years | 168 (100.0%) | 0 (0.0%) |
| 6 to 18 Years | 956 (91.7%) | 86 (8.3%) |
| 19 to 25 Years | 307 (81.2%) | 71 (18.8%) |
| 26 to 34 Years | 761 (75.9%) | 242 (24.1%) |
| 35 to 44 Years | 562 (78.5%) | 154 (21.5%) |
| 45 to 54 Years | 608 (100.0%) | 0 (0.0%) |
| 55 to 64 Years | 1,198 (100.0%) | 0 (0.0%) |
| 65 to 74 Years | 754 (100.0%) | 0 (0.0%) |
| 75 Years and older | 792 (100.0%) | 0 (0.0%) |
| Total | 6,106 (91.7%) | 553 (8.3%) |
Health Insurance Coverage by Citizenship Status in Southport
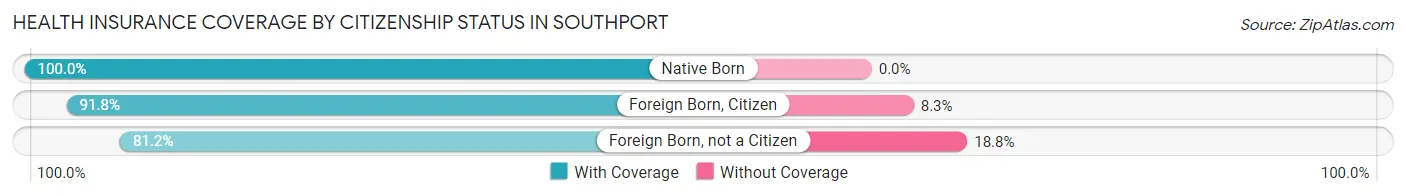
| Citizenship Status | With Coverage | Without Coverage |
| Native Born | 168 (100.0%) | 0 (0.0%) |
| Foreign Born, Citizen | 956 (91.7%) | 86 (8.3%) |
| Foreign Born, not a Citizen | 307 (81.2%) | 71 (18.8%) |
Health Insurance Coverage by Household Income in Southport
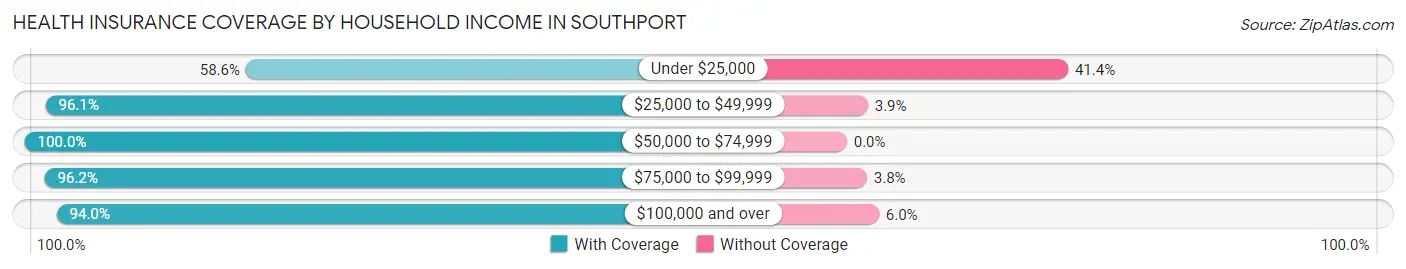
| Household Income | With Coverage | Without Coverage |
| Under $25,000 | 462 (58.6%) | 327 (41.4%) |
| $25,000 to $49,999 | 1,514 (96.1%) | 62 (3.9%) |
| $50,000 to $74,999 | 1,313 (100.0%) | 0 (0.0%) |
| $75,000 to $99,999 | 691 (96.2%) | 27 (3.8%) |
| $100,000 and over | 2,114 (94.0%) | 135 (6.0%) |
Public vs Private Health Insurance Coverage by Age in Southport
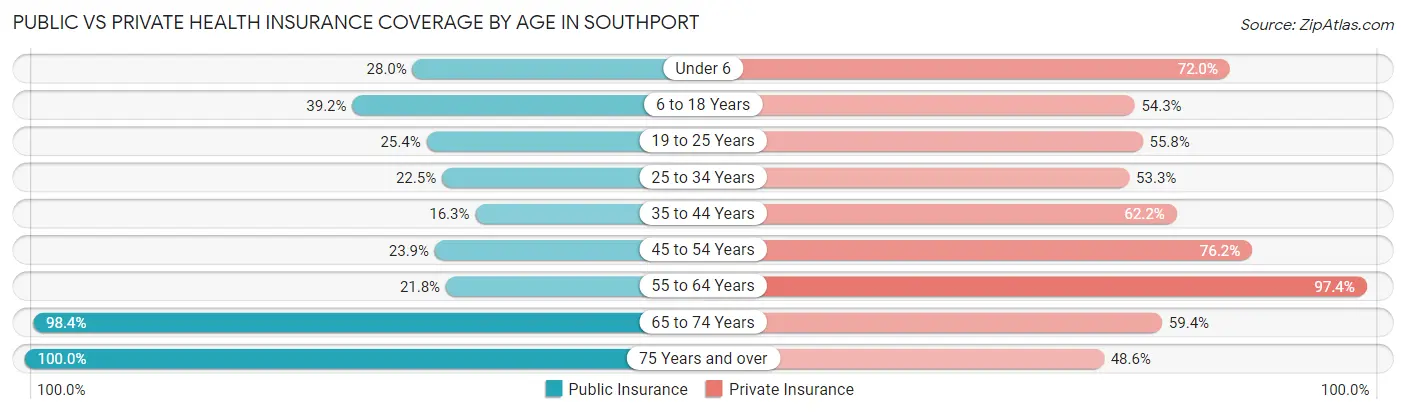
| Age Bracket | Public Insurance | Private Insurance |
| Under 6 | 47 (28.0%) | 121 (72.0%) |
| 6 to 18 Years | 408 (39.2%) | 566 (54.3%) |
| 19 to 25 Years | 96 (25.4%) | 211 (55.8%) |
| 25 to 34 Years | 226 (22.5%) | 535 (53.3%) |
| 35 to 44 Years | 117 (16.3%) | 445 (62.2%) |
| 45 to 54 Years | 145 (23.8%) | 463 (76.1%) |
| 55 to 64 Years | 261 (21.8%) | 1,167 (97.4%) |
| 65 to 74 Years | 742 (98.4%) | 448 (59.4%) |
| 75 Years and over | 792 (100.0%) | 385 (48.6%) |
| Total | 2,834 (42.6%) | 4,341 (65.2%) |
Disability Status by Sex by Age in Southport
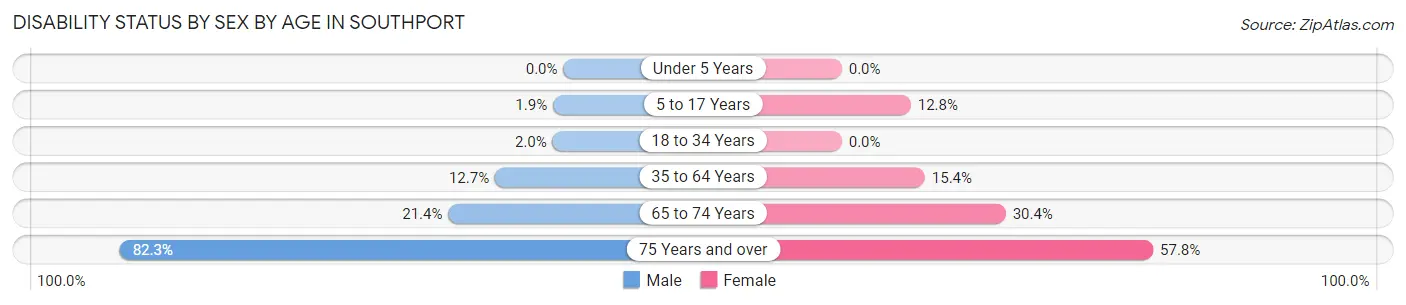
| Age Bracket | Male | Female |
| Under 5 Years | 0 (0.0%) | 0 (0.0%) |
| 5 to 17 Years | 7 (1.9%) | 73 (12.8%) |
| 18 to 34 Years | 18 (2.0%) | 0 (0.0%) |
| 35 to 64 Years | 171 (12.7%) | 181 (15.4%) |
| 65 to 74 Years | 95 (21.3%) | 94 (30.4%) |
| 75 Years and over | 303 (82.3%) | 245 (57.8%) |
Disability Class by Sex by Age in Southport
Disability Class: Hearing Difficulty
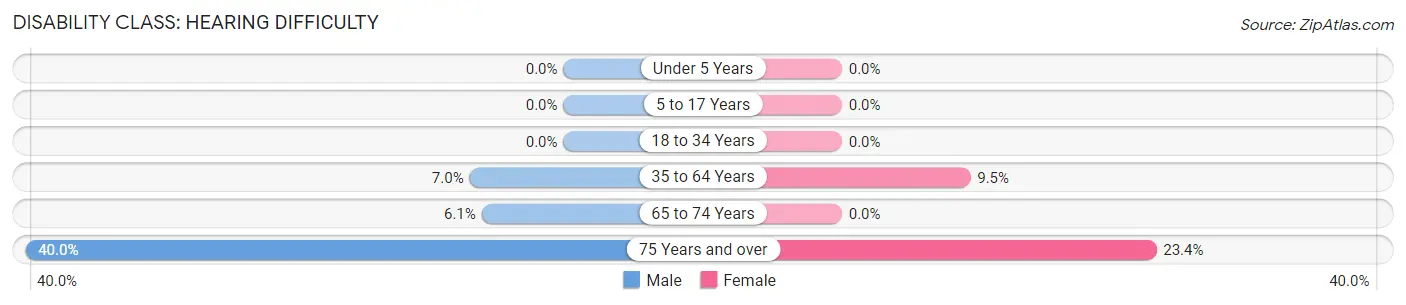
| Age Bracket | Male | Female |
| Under 5 Years | 0 (0.0%) | 0 (0.0%) |
| 5 to 17 Years | 0 (0.0%) | 0 (0.0%) |
| 18 to 34 Years | 0 (0.0%) | 0 (0.0%) |
| 35 to 64 Years | 94 (7.0%) | 112 (9.5%) |
| 65 to 74 Years | 27 (6.1%) | 0 (0.0%) |
| 75 Years and over | 147 (40.0%) | 99 (23.4%) |
Disability Class: Vision Difficulty
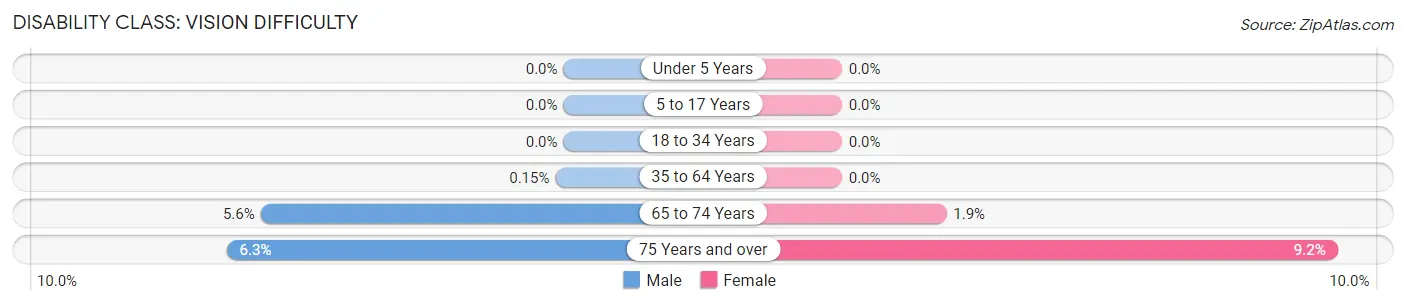
| Age Bracket | Male | Female |
| Under 5 Years | 0 (0.0%) | 0 (0.0%) |
| 5 to 17 Years | 0 (0.0%) | 0 (0.0%) |
| 18 to 34 Years | 0 (0.0%) | 0 (0.0%) |
| 35 to 64 Years | 2 (0.2%) | 0 (0.0%) |
| 65 to 74 Years | 25 (5.6%) | 6 (1.9%) |
| 75 Years and over | 23 (6.2%) | 39 (9.2%) |
Disability Class: Cognitive Difficulty
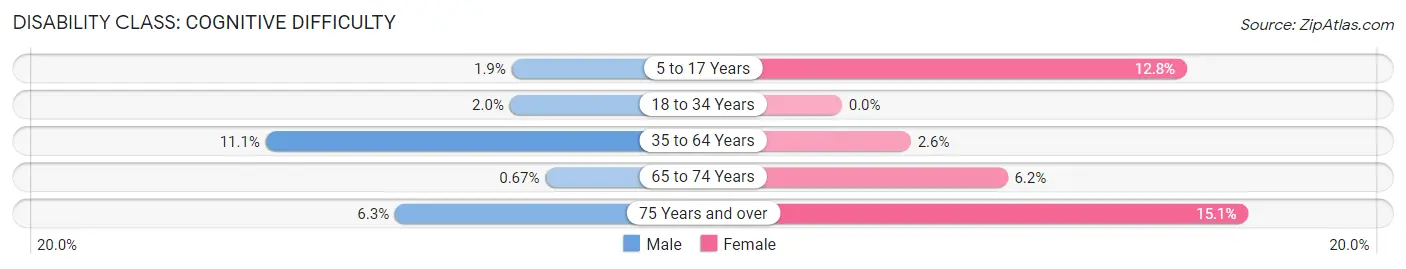
| Age Bracket | Male | Female |
| 5 to 17 Years | 7 (1.9%) | 73 (12.8%) |
| 18 to 34 Years | 18 (2.0%) | 0 (0.0%) |
| 35 to 64 Years | 149 (11.1%) | 30 (2.6%) |
| 65 to 74 Years | 3 (0.7%) | 19 (6.1%) |
| 75 Years and over | 23 (6.2%) | 64 (15.1%) |
Disability Class: Ambulatory Difficulty
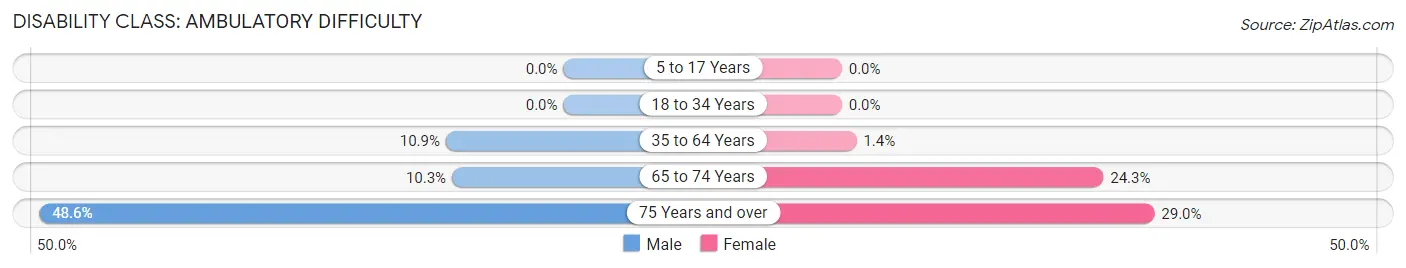
| Age Bracket | Male | Female |
| 5 to 17 Years | 0 (0.0%) | 0 (0.0%) |
| 18 to 34 Years | 0 (0.0%) | 0 (0.0%) |
| 35 to 64 Years | 147 (10.9%) | 16 (1.4%) |
| 65 to 74 Years | 46 (10.3%) | 75 (24.3%) |
| 75 Years and over | 179 (48.6%) | 123 (29.0%) |
Disability Class: Self-Care Difficulty
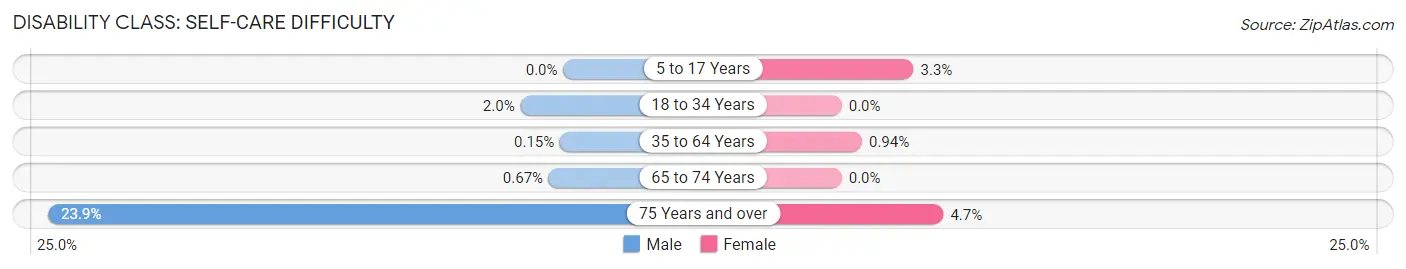
| Age Bracket | Male | Female |
| 5 to 17 Years | 0 (0.0%) | 19 (3.3%) |
| 18 to 34 Years | 18 (2.0%) | 0 (0.0%) |
| 35 to 64 Years | 2 (0.2%) | 11 (0.9%) |
| 65 to 74 Years | 3 (0.7%) | 0 (0.0%) |
| 75 Years and over | 88 (23.9%) | 20 (4.7%) |
Technology Access in Southport
Computing Device Access in Southport
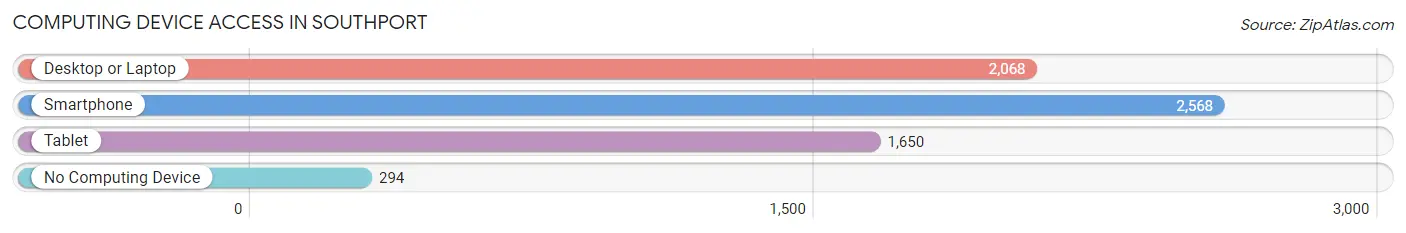
| Device Type | # Households | % Households |
| Desktop or Laptop | 2,068 | 64.9% |
| Smartphone | 2,568 | 80.5% |
| Tablet | 1,650 | 51.8% |
| No Computing Device | 294 | 9.2% |
| Total | 3,188 | 100.0% |
Internet Access in Southport
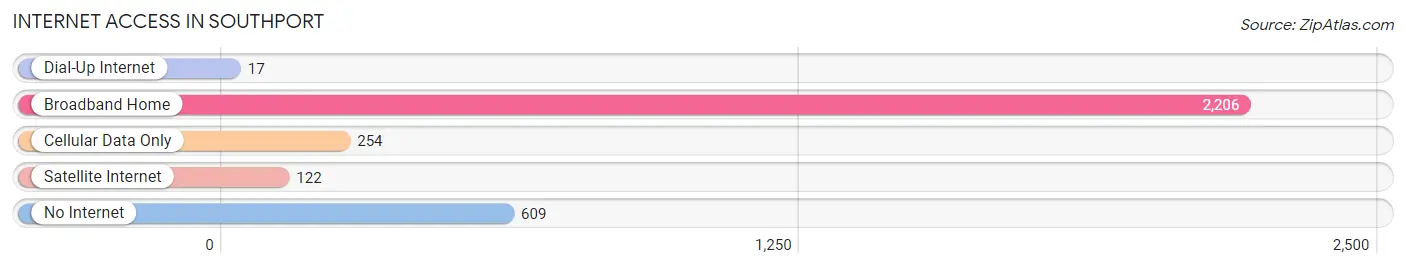
| Internet Type | # Households | % Households |
| Dial-Up Internet | 17 | 0.5% |
| Broadband Home | 2,206 | 69.2% |
| Cellular Data Only | 254 | 8.0% |
| Satellite Internet | 122 | 3.8% |
| No Internet | 609 | 19.1% |
| Total | 3,188 | 100.0% |
Southport Summary
Southport is a small town located in Chemung County, New York. It is situated on the south bank of the Chemung River, approximately 10 miles south of Elmira. The town was first settled in 1786 and was incorporated in 1822. Southport is a rural community with a population of approximately 1,500 people.
Geography
Southport is located in the Southern Tier region of New York State. It is situated on the south bank of the Chemung River, approximately 10 miles south of Elmira. The town is bordered by the towns of Big Flats to the north, Catlin to the east, and Horseheads to the south. The town has a total area of 8.2 square miles, all of which is land.
The terrain of Southport is mostly flat, with some rolling hills in the northern part of the town. The highest point in the town is located at an elevation of 1,400 feet. The town is located in a temperate climate zone, with four distinct seasons. The average annual temperature is around 50 degrees Fahrenheit.
Economy
Southport’s economy is largely based on agriculture and tourism. The town is home to several farms, which produce a variety of crops, including corn, soybeans, hay, and apples. The town also has several wineries and breweries, which attract tourists from all over the region.
In addition to agriculture and tourism, Southport is home to several small businesses, including a hardware store, a grocery store, and a few restaurants. The town also has a post office and a library.
Demographics
As of the 2010 census, Southport had a population of 1,521 people. The racial makeup of the town was 97.2% White, 0.7% African American, 0.2% Native American, 0.3% Asian, 0.1% Pacific Islander, 0.3% from other races, and 1.3% from two or more races. Hispanic or Latino of any race were 1.3% of the population.
The median household income in Southport was $45,000, and the median family income was $50,000. The per capita income for the town was $20,000. About 8.3% of families and 10.2% of the population were below the poverty line, including 14.3% of those under age 18 and 5.2% of those age 65 or over.
History
Southport was first settled in 1786 by a group of settlers from Connecticut. The town was originally known as “Southport Landing”, and was later renamed “Southport”. The town was officially incorporated in 1822.
In the 19th century, Southport was a thriving agricultural community. The town was home to several mills, which produced flour, lumber, and other products. The town also had several stores, a post office, and a school.
In the 20th century, Southport’s economy shifted from agriculture to tourism. The town is now home to several wineries and breweries, which attract visitors from all over the region. The town also has several small businesses, including a hardware store, a grocery store, and a few restaurants.
Common Questions
What is Per Capita Income in Southport?
Per Capita income in Southport is $32,414.
What is the Median Family Income in Southport?
Median Family Income in Southport is $66,948.
What is the Median Household income in Southport?
Median Household Income in Southport is $54,531.
What is Income or Wage Gap in Southport?
Income or Wage Gap in Southport is 13.3%.
Women in Southport earn 86.7 cents for every dollar earned by a man.
What is Inequality or Gini Index in Southport?
Inequality or Gini Index in Southport is 0.42.
What is the Total Population of Southport?
Total Population of Southport is 6,661.
What is the Total Male Population of Southport?
Total Male Population of Southport is 3,510.
What is the Total Female Population of Southport?
Total Female Population of Southport is 3,151.
What is the Ratio of Males per 100 Females in Southport?
There are 111.39 Males per 100 Females in Southport.
What is the Ratio of Females per 100 Males in Southport?
There are 89.77 Females per 100 Males in Southport.
What is the Median Population Age in Southport?
Median Population Age in Southport is 45.5 Years.
What is the Average Family Size in Southport
Average Family Size in Southport is 2.6 People.
What is the Average Household Size in Southport
Average Household Size in Southport is 2.1 People.
How Large is the Labor Force in Southport?
There are 3,640 People in the Labor Forcein in Southport.
What is the Percentage of People in the Labor Force in Southport?
64.5% of People are in the Labor Force in Southport.
What is the Unemployment Rate in Southport?
Unemployment Rate in Southport is 6.3%.