South Dayton, NY Map & Demographics
South Dayton Map
South Dayton Overview
$22,914
PER CAPITA INCOME
$58,333
AVG FAMILY INCOME
$54,583
AVG HOUSEHOLD INCOME
50.1%
WAGE / INCOME GAP [ % ]
49.9¢/ $1
WAGE / INCOME GAP [ $ ]
$15,190
FAMILY INCOME DEFICIT
0.40
INEQUALITY / GINI INDEX
606
TOTAL POPULATION
303
MALE POPULATION
303
FEMALE POPULATION
100.00
MALES / 100 FEMALES
100.00
FEMALES / 100 MALES
37.2
MEDIAN AGE
3.0
AVG FAMILY SIZE
2.5
AVG HOUSEHOLD SIZE
258
LABOR FORCE [ PEOPLE ]
55.1%
PERCENT IN LABOR FORCE
1.6%
UNEMPLOYMENT RATE
South Dayton Zip Codes
South Dayton Area Codes
Income in South Dayton
Income Overview in South Dayton
Per Capita Income in South Dayton is $22,914, while median incomes of families and households are $58,333 and $54,583 respectively.
| Characteristic | Number | Measure |
| Per Capita Income | 606 | $22,914 |
| Median Family Income | 162 | $58,333 |
| Mean Family Income | 162 | $62,081 |
| Median Household Income | 243 | $54,583 |
| Mean Household Income | 243 | $56,578 |
| Income Deficit | 162 | $15,190 |
| Wage / Income Gap (%) | 606 | 50.10% |
| Wage / Income Gap ($) | 606 | 49.90¢ per $1 |
| Gini / Inequality Index | 606 | 0.40 |
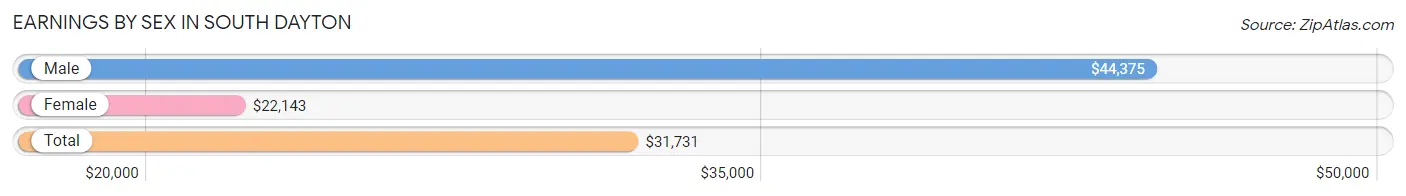
Earnings by Sex in South Dayton
Average Earnings in South Dayton are $31,731, $44,375 for men and $22,143 for women, a difference of 50.1%.
| Sex | Number | Average Earnings |
| Male | 134 (46.5%) | $44,375 |
| Female | 154 (53.5%) | $22,143 |
| Total | 288 (100.0%) | $31,731 |
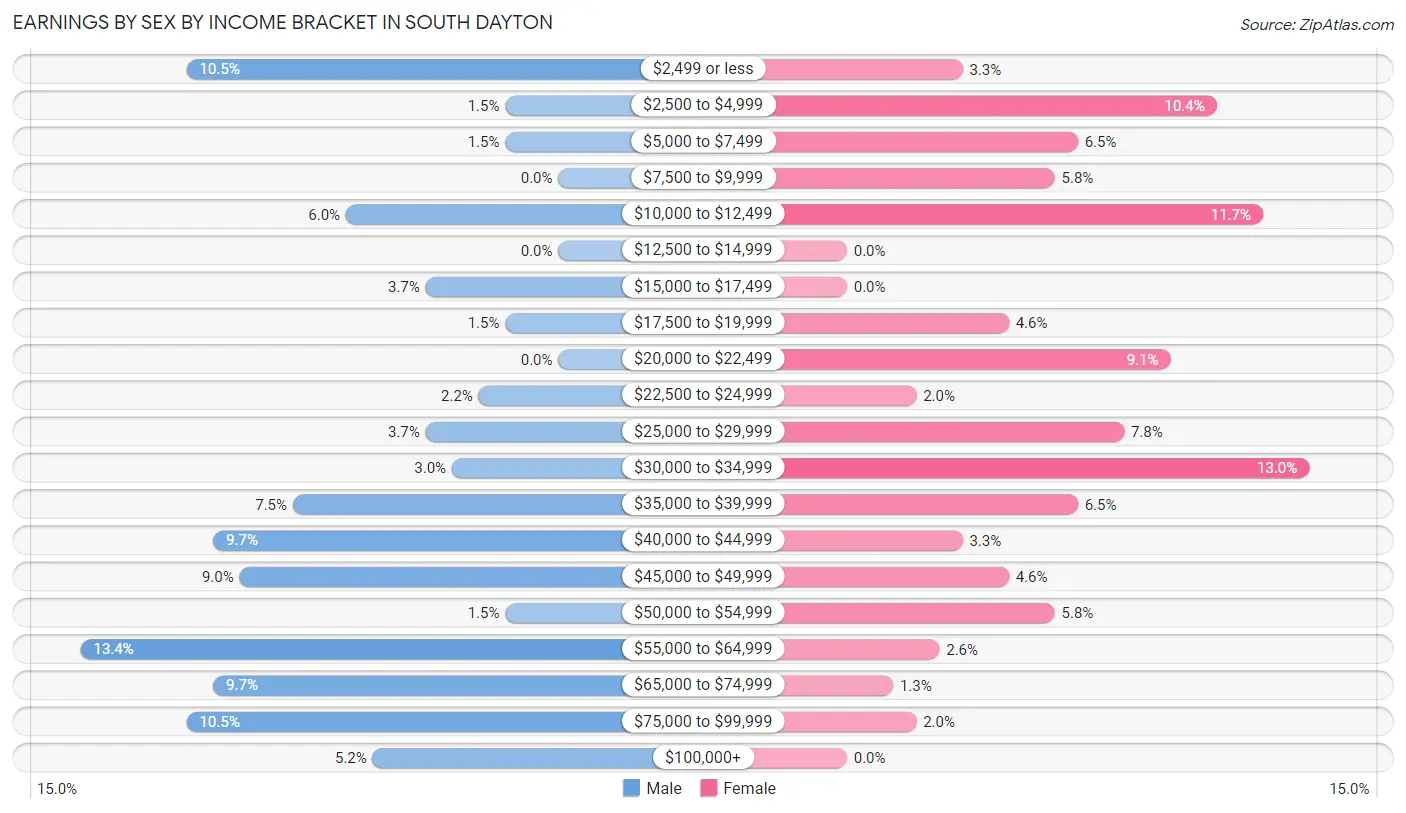
Earnings by Sex by Income Bracket in South Dayton
The most common earnings brackets in South Dayton are $55,000 to $64,999 for men (18 | 13.4%) and $30,000 to $34,999 for women (20 | 13.0%).
| Income | Male | Female |
| $2,499 or less | 14 (10.4%) | 5 (3.3%) |
| $2,500 to $4,999 | 2 (1.5%) | 16 (10.4%) |
| $5,000 to $7,499 | 2 (1.5%) | 10 (6.5%) |
| $7,500 to $9,999 | 0 (0.0%) | 9 (5.8%) |
| $10,000 to $12,499 | 8 (6.0%) | 18 (11.7%) |
| $12,500 to $14,999 | 0 (0.0%) | 0 (0.0%) |
| $15,000 to $17,499 | 5 (3.7%) | 0 (0.0%) |
| $17,500 to $19,999 | 2 (1.5%) | 7 (4.5%) |
| $20,000 to $22,499 | 0 (0.0%) | 14 (9.1%) |
| $22,500 to $24,999 | 3 (2.2%) | 3 (1.9%) |
| $25,000 to $29,999 | 5 (3.7%) | 12 (7.8%) |
| $30,000 to $34,999 | 4 (3.0%) | 20 (13.0%) |
| $35,000 to $39,999 | 10 (7.5%) | 10 (6.5%) |
| $40,000 to $44,999 | 13 (9.7%) | 5 (3.3%) |
| $45,000 to $49,999 | 12 (9.0%) | 7 (4.5%) |
| $50,000 to $54,999 | 2 (1.5%) | 9 (5.8%) |
| $55,000 to $64,999 | 18 (13.4%) | 4 (2.6%) |
| $65,000 to $74,999 | 13 (9.7%) | 2 (1.3%) |
| $75,000 to $99,999 | 14 (10.4%) | 3 (1.9%) |
| $100,000+ | 7 (5.2%) | 0 (0.0%) |
| Total | 134 (100.0%) | 154 (100.0%) |
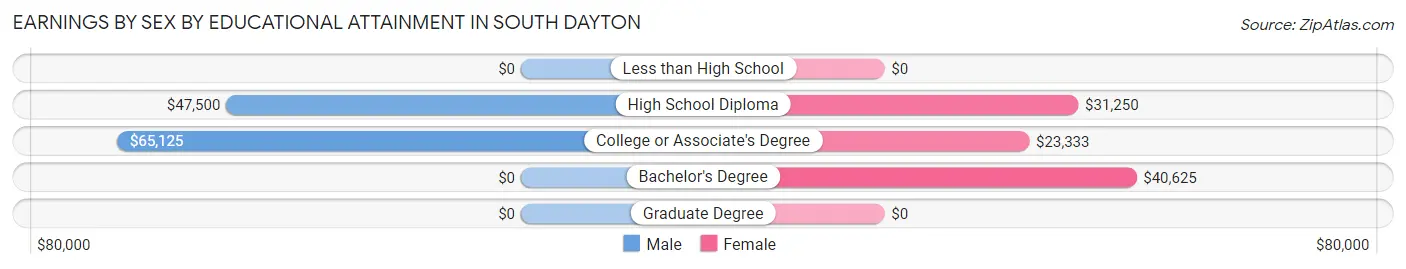
Earnings by Sex by Educational Attainment in South Dayton
Average earnings in South Dayton are $43,125 for men and $28,438 for women, a difference of 34.1%. Men with an educational attainment of college or associate's degree enjoy the highest average annual earnings of $65,125, while those with high school diploma education earn the least with $47,500. Women with an educational attainment of bachelor's degree earn the most with the average annual earnings of $40,625, while those with college or associate's degree education have the smallest earnings of $23,333.
| Educational Attainment | Male Income | Female Income |
| Less than High School | - | - |
| High School Diploma | $47,500 | $31,250 |
| College or Associate's Degree | $65,125 | $23,333 |
| Bachelor's Degree | - | - |
| Graduate Degree | - | - |
| Total | $43,125 | $28,438 |
Family Income in South Dayton
Family Income Brackets in South Dayton
According to the South Dayton family income data, there are 33 families falling into the $75,000 to $99,999 income range, which is the most common income bracket and makes up 20.4% of all families. Conversely, the $200,000+ income bracket is the least frequent group with only 3 families (1.8%) belonging to this category.
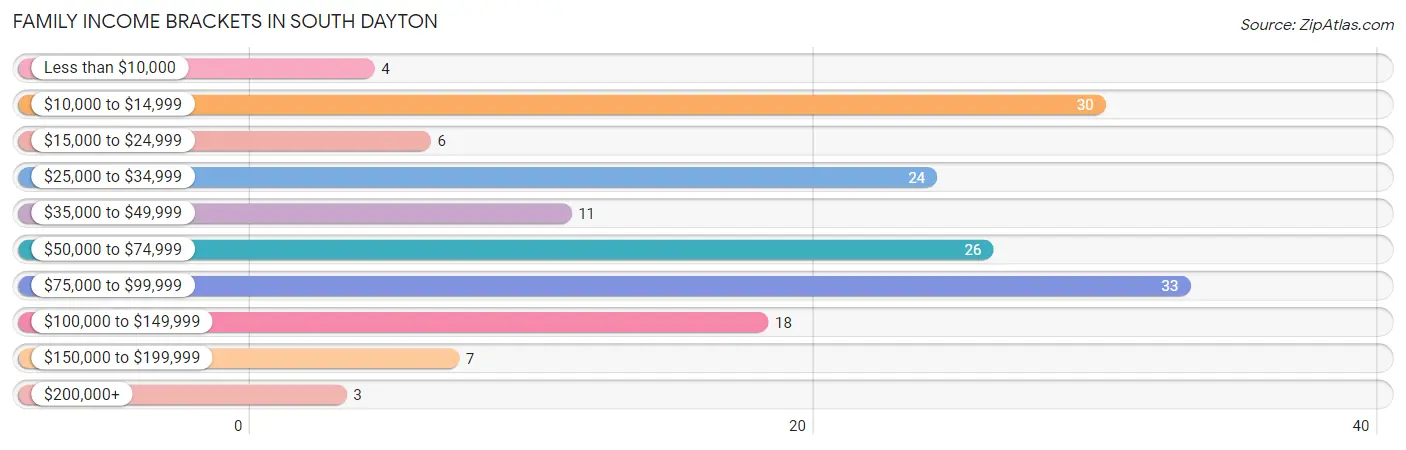
| Income Bracket | # Families | % Families |
| Less than $10,000 | 4 | 2.5% |
| $10,000 to $14,999 | 30 | 18.5% |
| $15,000 to $24,999 | 6 | 3.7% |
| $25,000 to $34,999 | 24 | 14.8% |
| $35,000 to $49,999 | 11 | 6.8% |
| $50,000 to $74,999 | 26 | 16.0% |
| $75,000 to $99,999 | 33 | 20.4% |
| $100,000 to $149,999 | 18 | 11.1% |
| $150,000 to $199,999 | 7 | 4.3% |
| $200,000+ | 3 | 1.9% |
Family Income by Famaliy Size in South Dayton
3-person families (40 | 24.7%) account for the highest median family income in South Dayton with $62,500 per family, while 2-person families (77 | 47.5%) have the highest median income of $29,375 per family member.
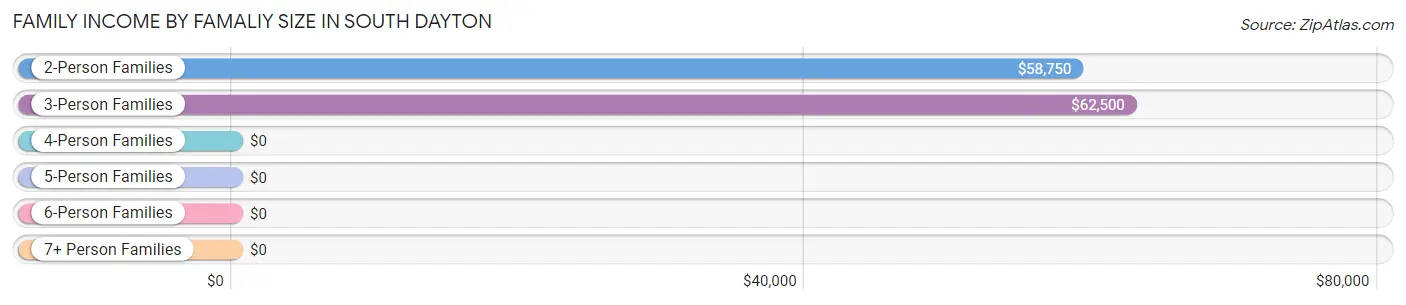
| Income Bracket | # Families | Median Income |
| 2-Person Families | 77 (47.5%) | $58,750 |
| 3-Person Families | 40 (24.7%) | $62,500 |
| 4-Person Families | 25 (15.4%) | $0 |
| 5-Person Families | 5 (3.1%) | $0 |
| 6-Person Families | 2 (1.2%) | $0 |
| 7+ Person Families | 13 (8.0%) | $0 |
| Total | 162 (100.0%) | $58,333 |
Family Income by Number of Earners in South Dayton
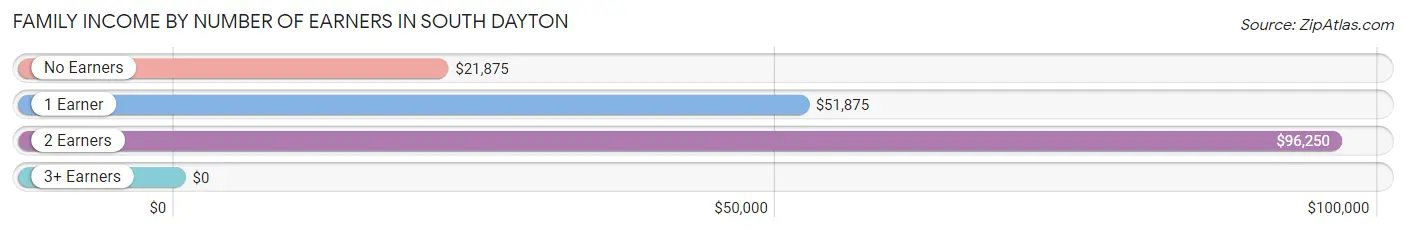
| Number of Earners | # Families | Median Income |
| No Earners | 37 (22.8%) | $21,875 |
| 1 Earner | 55 (34.0%) | $51,875 |
| 2 Earners | 40 (24.7%) | $96,250 |
| 3+ Earners | 30 (18.5%) | $0 |
| Total | 162 (100.0%) | $58,333 |
Household Income in South Dayton
Household Income Brackets in South Dayton
With 59 households falling in the category, the $50,000 to $74,999 income range is the most frequent in South Dayton, accounting for 24.3% of all households. In contrast, only 3 households (1.2%) fall into the $200,000+ income bracket, making it the least populous group.
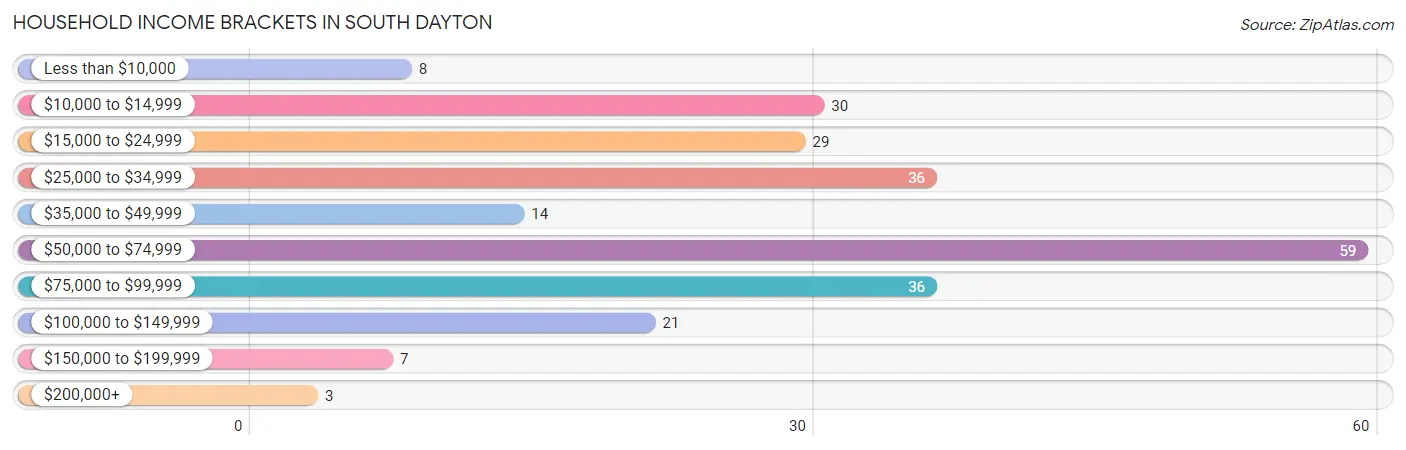
| Income Bracket | # Households | % Households |
| Less than $10,000 | 8 | 3.3% |
| $10,000 to $14,999 | 30 | 12.3% |
| $15,000 to $24,999 | 29 | 11.9% |
| $25,000 to $34,999 | 36 | 14.8% |
| $35,000 to $49,999 | 14 | 5.8% |
| $50,000 to $74,999 | 59 | 24.3% |
| $75,000 to $99,999 | 36 | 14.8% |
| $100,000 to $149,999 | 21 | 8.6% |
| $150,000 to $199,999 | 7 | 2.9% |
| $200,000+ | 3 | 1.2% |
Household Income by Householder Age in South Dayton
The median household income in South Dayton is $54,583, with the highest median household income of $60,625 found in the 45 to 64 years age bracket for the primary householder. A total of 94 households (38.7%) fall into this category. Meanwhile, the 65+ years age bracket for the primary householder has the lowest median household income of $0, with 69 households (28.4%) in this group.
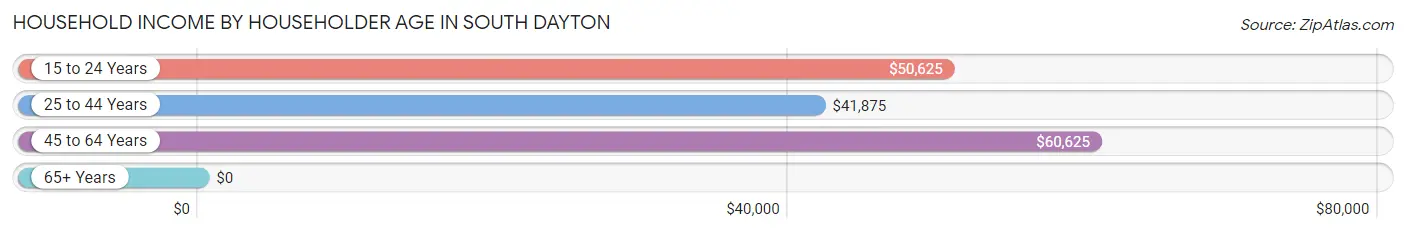
| Income Bracket | # Households | Median Income |
| 15 to 24 Years | 9 (3.7%) | $50,625 |
| 25 to 44 Years | 71 (29.2%) | $41,875 |
| 45 to 64 Years | 94 (38.7%) | $60,625 |
| 65+ Years | 69 (28.4%) | $0 |
| Total | 243 (100.0%) | $54,583 |
Poverty in South Dayton
Income Below Poverty by Sex and Age in South Dayton
With 19.8% poverty level for males and 35.6% for females among the residents of South Dayton, under 5 year old males and 12 to 14 year old females are the most vulnerable to poverty, with 5 males (83.3%) and 8 females (100.0%) in their respective age groups living below the poverty level.
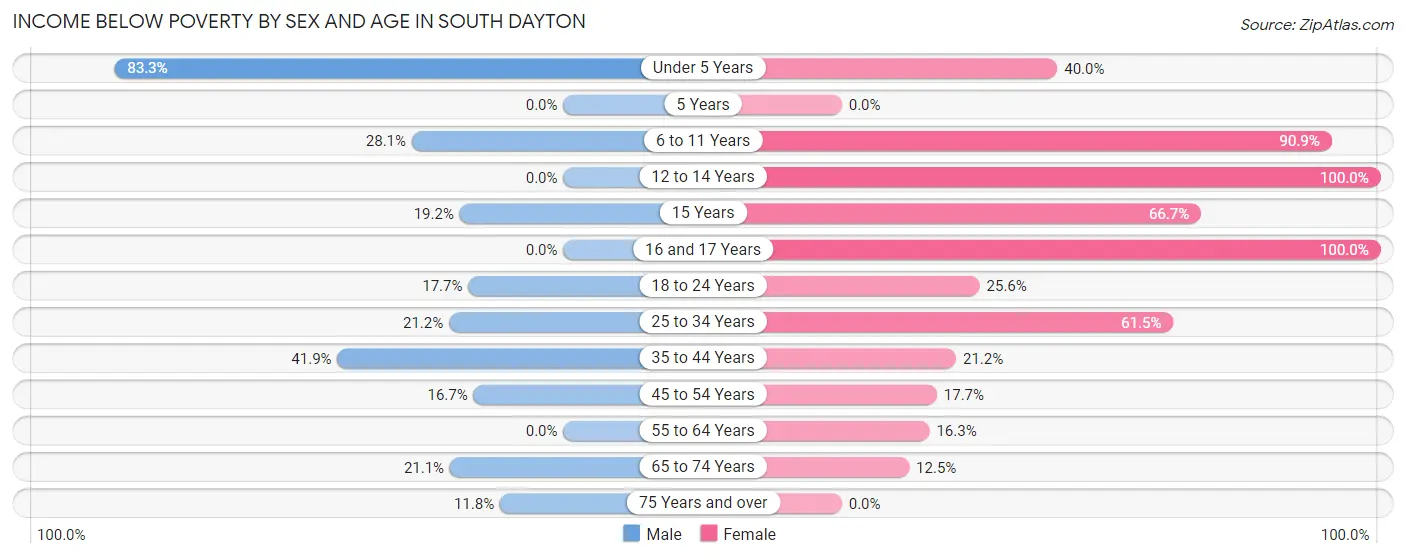
| Age Bracket | Male | Female |
| Under 5 Years | 5 (83.3%) | 8 (40.0%) |
| 5 Years | 0 (0.0%) | 0 (0.0%) |
| 6 to 11 Years | 9 (28.1%) | 10 (90.9%) |
| 12 to 14 Years | 0 (0.0%) | 8 (100.0%) |
| 15 Years | 5 (19.2%) | 2 (66.7%) |
| 16 and 17 Years | 0 (0.0%) | 20 (100.0%) |
| 18 to 24 Years | 3 (17.6%) | 11 (25.6%) |
| 25 to 34 Years | 7 (21.2%) | 24 (61.5%) |
| 35 to 44 Years | 13 (41.9%) | 7 (21.2%) |
| 45 to 54 Years | 6 (16.7%) | 9 (17.6%) |
| 55 to 64 Years | 0 (0.0%) | 7 (16.3%) |
| 65 to 74 Years | 8 (21.0%) | 2 (12.5%) |
| 75 Years and over | 2 (11.8%) | 0 (0.0%) |
| Total | 58 (19.8%) | 108 (35.6%) |
Income Above Poverty by Sex and Age in South Dayton
According to the poverty statistics in South Dayton, males aged 5 years and females aged 5 years are the age groups that are most secure financially, with 100.0% of males and 100.0% of females in these age groups living above the poverty line.
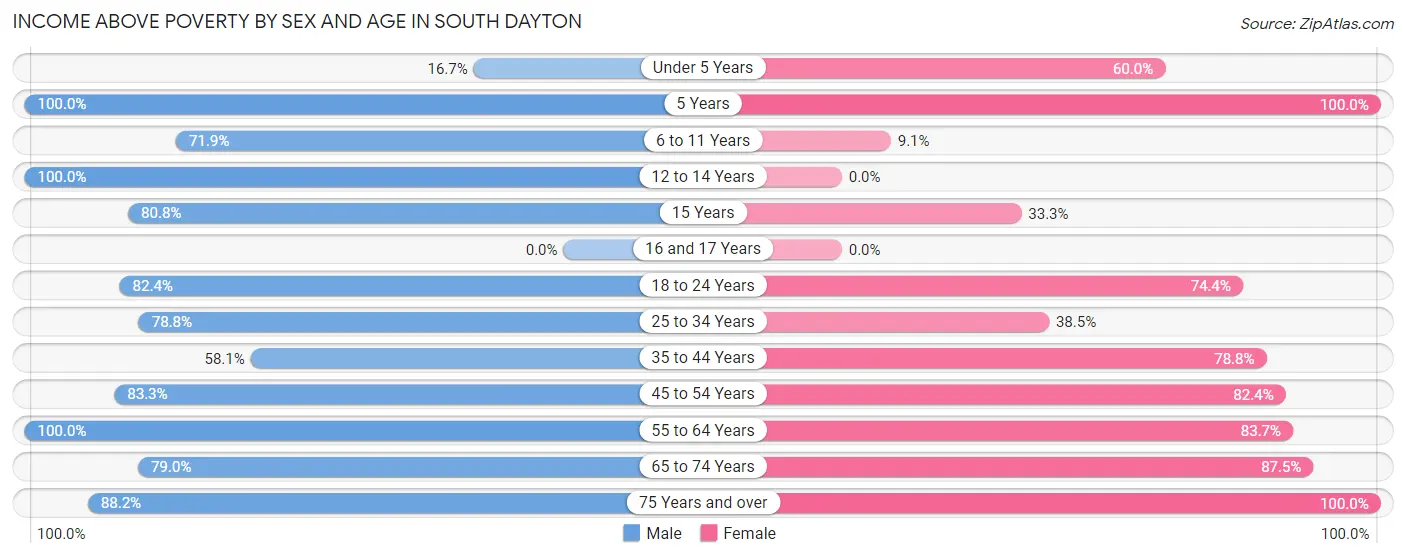
| Age Bracket | Male | Female |
| Under 5 Years | 1 (16.7%) | 12 (60.0%) |
| 5 Years | 6 (100.0%) | 2 (100.0%) |
| 6 to 11 Years | 23 (71.9%) | 1 (9.1%) |
| 12 to 14 Years | 14 (100.0%) | 0 (0.0%) |
| 15 Years | 21 (80.8%) | 1 (33.3%) |
| 16 and 17 Years | 0 (0.0%) | 0 (0.0%) |
| 18 to 24 Years | 14 (82.4%) | 32 (74.4%) |
| 25 to 34 Years | 26 (78.8%) | 15 (38.5%) |
| 35 to 44 Years | 18 (58.1%) | 26 (78.8%) |
| 45 to 54 Years | 30 (83.3%) | 42 (82.4%) |
| 55 to 64 Years | 37 (100.0%) | 36 (83.7%) |
| 65 to 74 Years | 30 (78.9%) | 14 (87.5%) |
| 75 Years and over | 15 (88.2%) | 14 (100.0%) |
| Total | 235 (80.2%) | 195 (64.4%) |
Income Below Poverty Among Married-Couple Families in South Dayton
The poverty statistics for married-couple families in South Dayton show that 19.5% or 15 of the total 77 families live below the poverty line. Families with 3 or 4 children have the highest poverty rate of 75.0%, comprising of 3 families. On the other hand, families with no children have the lowest poverty rate of 15.4%, which includes 8 families.
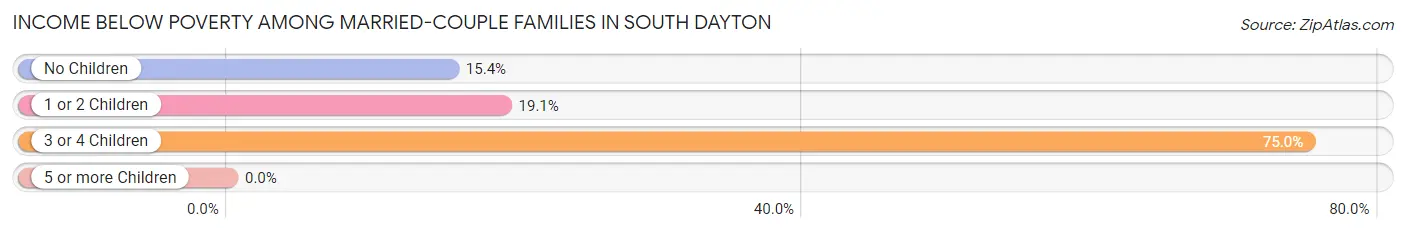
| Children | Above Poverty | Below Poverty |
| No Children | 44 (84.6%) | 8 (15.4%) |
| 1 or 2 Children | 17 (80.9%) | 4 (19.1%) |
| 3 or 4 Children | 1 (25.0%) | 3 (75.0%) |
| 5 or more Children | 0 (0.0%) | 0 (0.0%) |
| Total | 62 (80.5%) | 15 (19.5%) |
Income Below Poverty Among Single-Parent Households in South Dayton
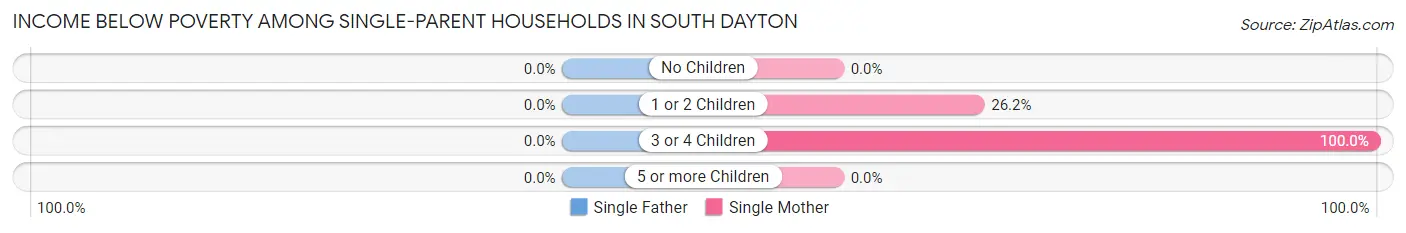
| Children | Single Father | Single Mother |
| No Children | 0 (0.0%) | 0 (0.0%) |
| 1 or 2 Children | 0 (0.0%) | 11 (26.2%) |
| 3 or 4 Children | 0 (0.0%) | 16 (100.0%) |
| 5 or more Children | 0 (0.0%) | 0 (0.0%) |
| Total | 0 (0.0%) | 27 (40.9%) |
Income Below Poverty Among Married-Couple vs Single-Parent Households in South Dayton
The poverty data for South Dayton shows that 15 of the married-couple family households (19.5%) and 27 of the single-parent households (31.8%) are living below the poverty level. Within the married-couple family households, those with 3 or 4 children have the highest poverty rate, with 3 households (75.0%) falling below the poverty line. Among the single-parent households, those with 3 or 4 children have the highest poverty rate, with 16 household (100.0%) living below poverty.
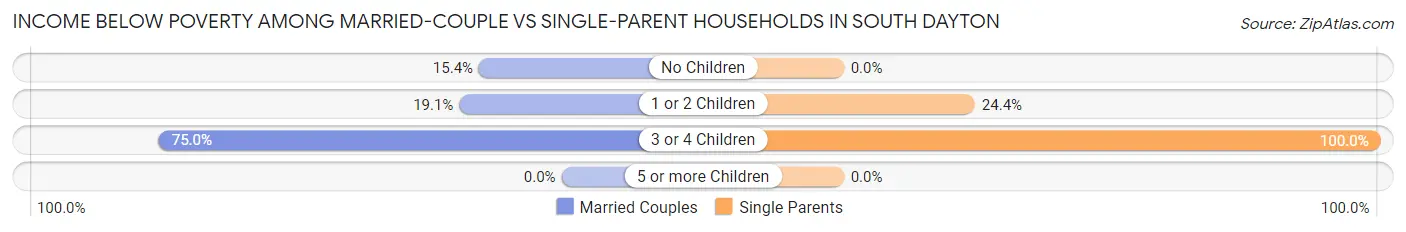
| Children | Married-Couple Families | Single-Parent Households |
| No Children | 8 (15.4%) | 0 (0.0%) |
| 1 or 2 Children | 4 (19.1%) | 11 (24.4%) |
| 3 or 4 Children | 3 (75.0%) | 16 (100.0%) |
| 5 or more Children | 0 (0.0%) | 0 (0.0%) |
| Total | 15 (19.5%) | 27 (31.8%) |
Race in South Dayton
The most populous races in South Dayton are White / Caucasian (571 | 94.2%), Black / African American (18 | 3.0%), and Two or more Races (17 | 2.8%).
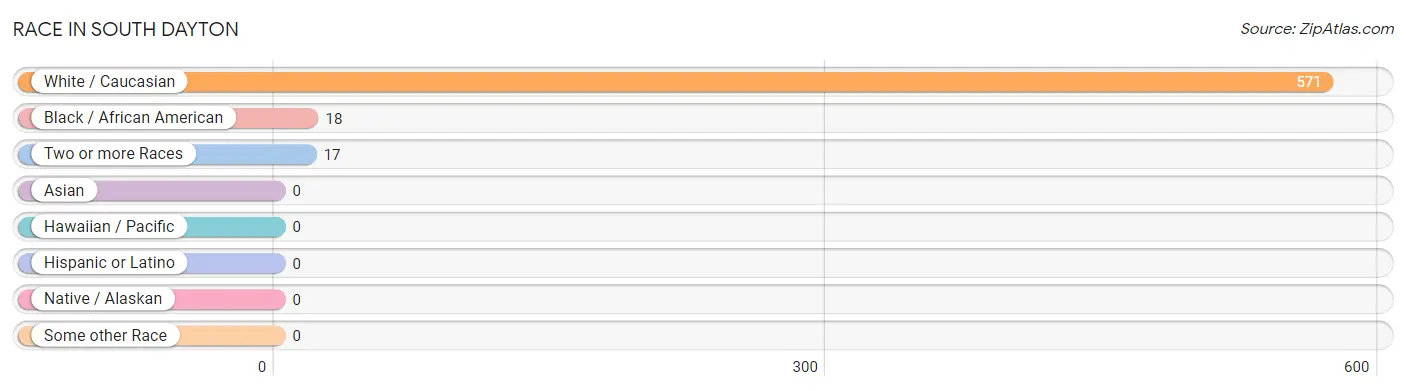
| Race | # Population | % Population |
| Asian | 0 | 0.0% |
| Black / African American | 18 | 3.0% |
| Hawaiian / Pacific | 0 | 0.0% |
| Hispanic or Latino | 0 | 0.0% |
| Native / Alaskan | 0 | 0.0% |
| White / Caucasian | 571 | 94.2% |
| Two or more Races | 17 | 2.8% |
| Some other Race | 0 | 0.0% |
| Total | 606 | 100.0% |
Ancestry in South Dayton
The most populous ancestries reported in South Dayton are German (170 | 28.1%), Polish (106 | 17.5%), English (82 | 13.5%), Irish (63 | 10.4%), and Italian (34 | 5.6%), together accounting for 75.1% of all South Dayton residents.
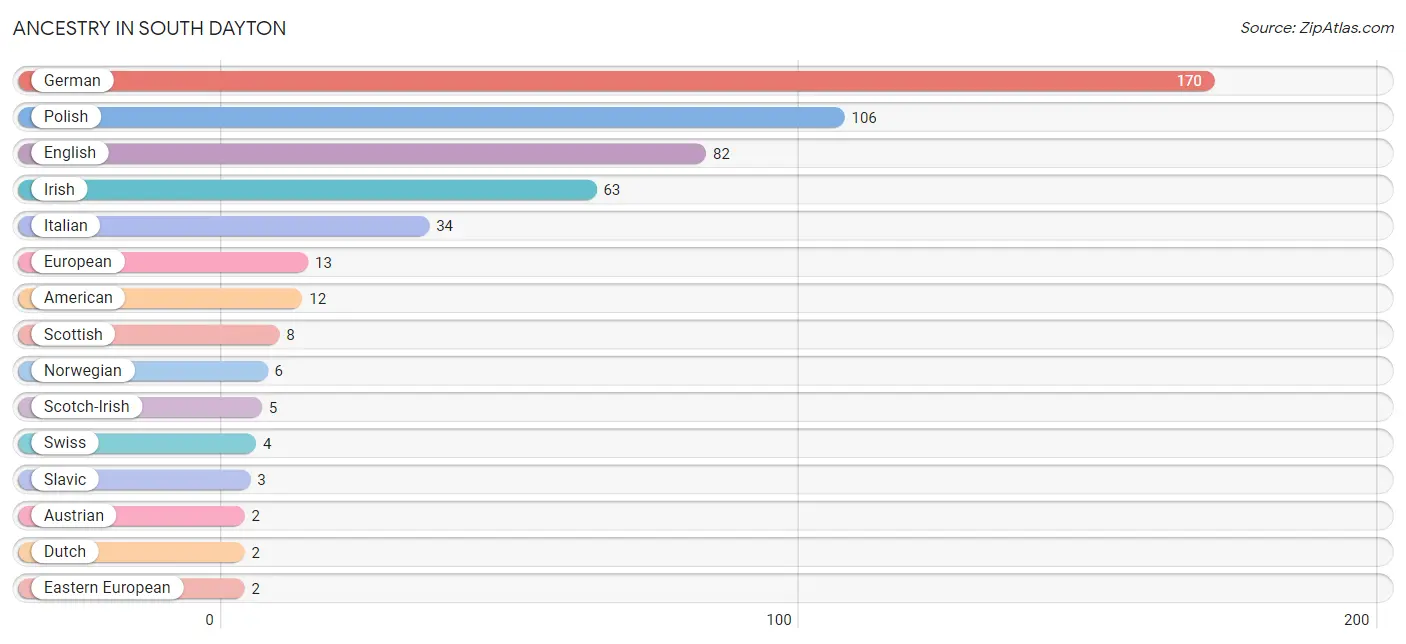
| Ancestry | # Population | % Population |
| American | 12 | 2.0% |
| Austrian | 2 | 0.3% |
| Dutch | 2 | 0.3% |
| Eastern European | 2 | 0.3% |
| English | 82 | 13.5% |
| European | 13 | 2.1% |
| French | 2 | 0.3% |
| French Canadian | 1 | 0.2% |
| German | 170 | 28.1% |
| Irish | 63 | 10.4% |
| Italian | 34 | 5.6% |
| Norwegian | 6 | 1.0% |
| Polish | 106 | 17.5% |
| Portuguese | 2 | 0.3% |
| Russian | 2 | 0.3% |
| Scotch-Irish | 5 | 0.8% |
| Scottish | 8 | 1.3% |
| Slavic | 3 | 0.5% |
| Swedish | 2 | 0.3% |
| Swiss | 4 | 0.7% |
| Welsh | 2 | 0.3% | View All 21 Rows |
Immigrants in South Dayton

| Immigration Origin | # Population | % Population | View All 0 Rows |
Sex and Age in South Dayton
Sex and Age in South Dayton
The most populous age groups in South Dayton are 5 to 9 Years (42 | 13.9%) for men and 15 to 19 Years (36 | 11.9%) for women.
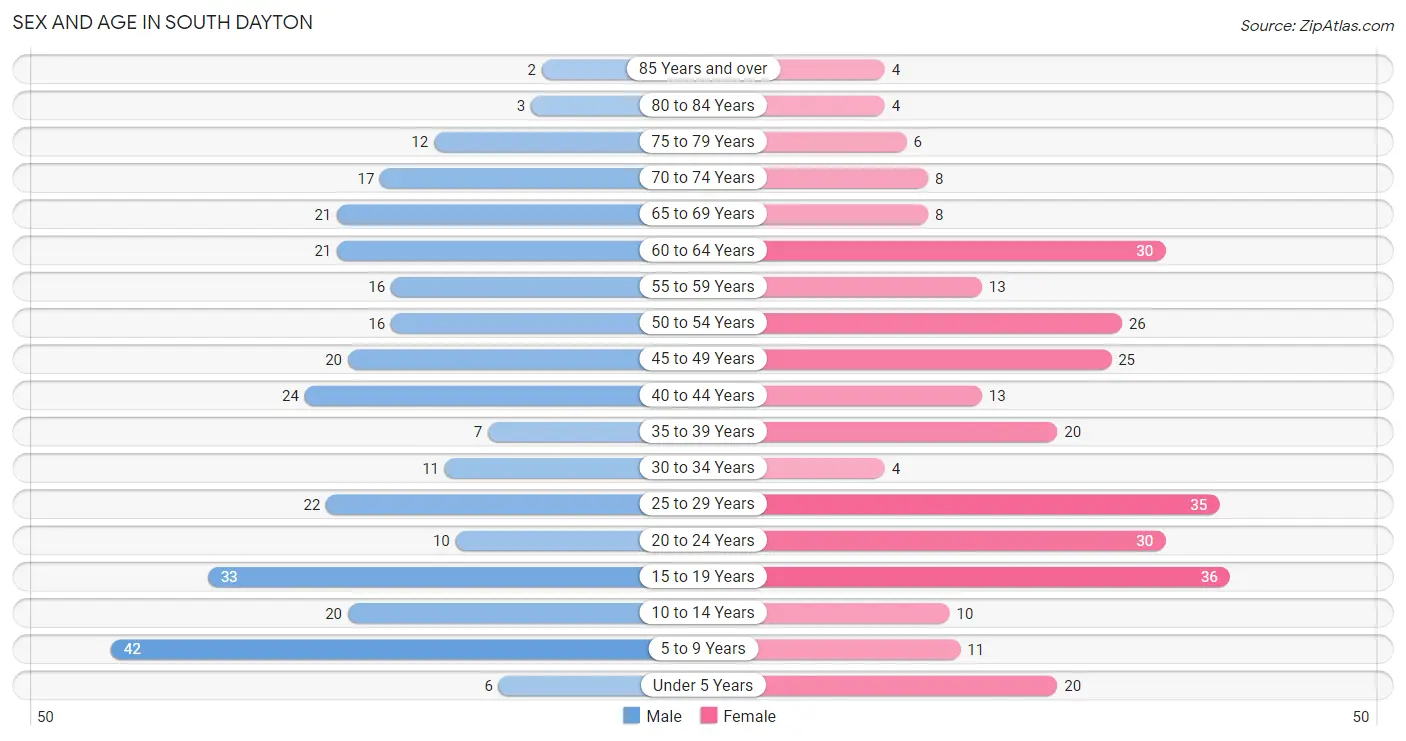
| Age Bracket | Male | Female |
| Under 5 Years | 6 (2.0%) | 20 (6.6%) |
| 5 to 9 Years | 42 (13.9%) | 11 (3.6%) |
| 10 to 14 Years | 20 (6.6%) | 10 (3.3%) |
| 15 to 19 Years | 33 (10.9%) | 36 (11.9%) |
| 20 to 24 Years | 10 (3.3%) | 30 (9.9%) |
| 25 to 29 Years | 22 (7.3%) | 35 (11.6%) |
| 30 to 34 Years | 11 (3.6%) | 4 (1.3%) |
| 35 to 39 Years | 7 (2.3%) | 20 (6.6%) |
| 40 to 44 Years | 24 (7.9%) | 13 (4.3%) |
| 45 to 49 Years | 20 (6.6%) | 25 (8.3%) |
| 50 to 54 Years | 16 (5.3%) | 26 (8.6%) |
| 55 to 59 Years | 16 (5.3%) | 13 (4.3%) |
| 60 to 64 Years | 21 (6.9%) | 30 (9.9%) |
| 65 to 69 Years | 21 (6.9%) | 8 (2.6%) |
| 70 to 74 Years | 17 (5.6%) | 8 (2.6%) |
| 75 to 79 Years | 12 (4.0%) | 6 (2.0%) |
| 80 to 84 Years | 3 (1.0%) | 4 (1.3%) |
| 85 Years and over | 2 (0.7%) | 4 (1.3%) |
| Total | 303 (100.0%) | 303 (100.0%) |
Families and Households in South Dayton
Median Family Size in South Dayton
The median family size in South Dayton is 2.97 persons per family, with single female/mother families (66 | 40.7%) accounting for the largest median family size of 3.68 persons per family. On the other hand, single male/father families (19 | 11.7%) represent the smallest median family size with 1.74 persons per family.
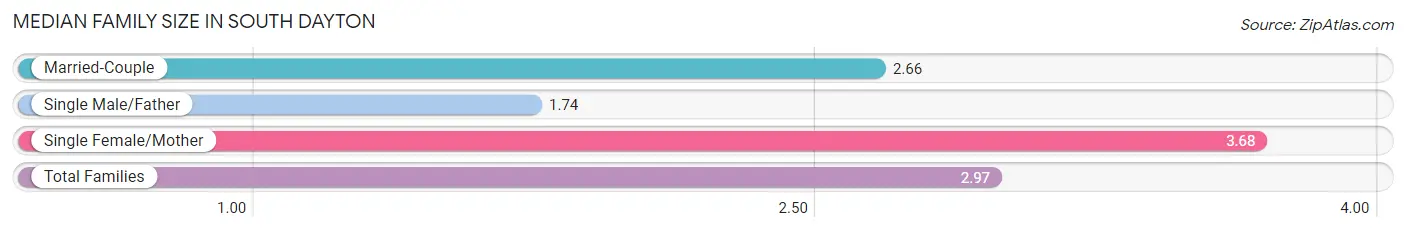
| Family Type | # Families | Family Size |
| Married-Couple | 77 (47.5%) | 2.66 |
| Single Male/Father | 19 (11.7%) | 1.74 |
| Single Female/Mother | 66 (40.7%) | 3.68 |
| Total Families | 162 (100.0%) | 2.97 |
Median Household Size in South Dayton
The median household size in South Dayton is 2.49 persons per household, with single female/mother households (66 | 27.2%) accounting for the largest median household size of 3.79 persons per household. non-family households (81 | 33.3%) represent the smallest median household size with 1.46 persons per household.
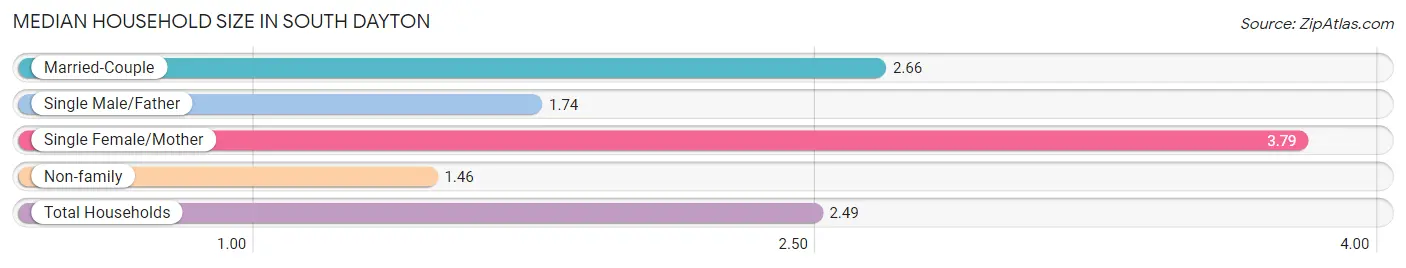
| Household Type | # Households | Household Size |
| Married-Couple | 77 (31.7%) | 2.66 |
| Single Male/Father | 19 (7.8%) | 1.74 |
| Single Female/Mother | 66 (27.2%) | 3.79 |
| Non-family | 81 (33.3%) | 1.46 |
| Total Households | 243 (100.0%) | 2.49 |
Household Size by Marriage Status in South Dayton
Out of a total of 243 households in South Dayton, 162 (66.7%) are family households, while 81 (33.3%) are nonfamily households. The most numerous type of family households are 2-person households, comprising 75, and the most common type of nonfamily households are 1-person households, comprising 56.
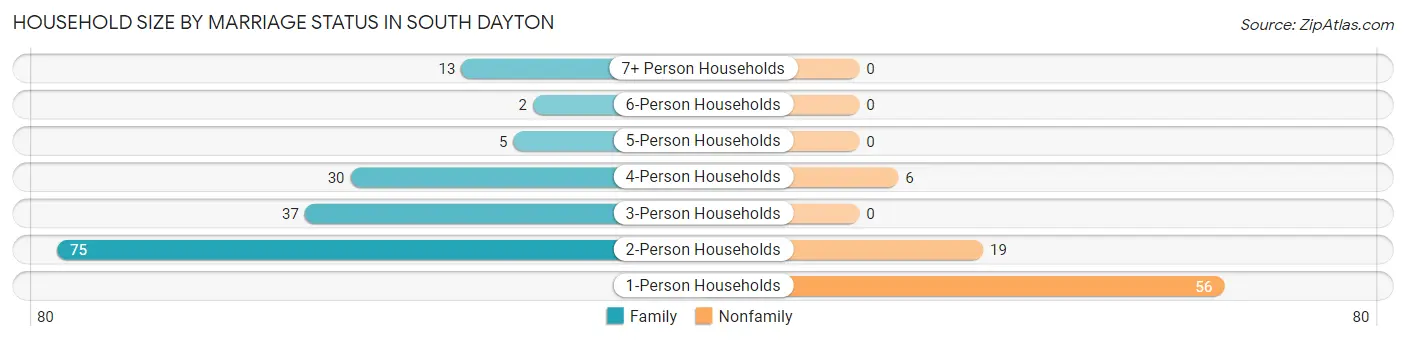
| Household Size | Family Households | Nonfamily Households |
| 1-Person Households | - | 56 (23.1%) |
| 2-Person Households | 75 (30.9%) | 19 (7.8%) |
| 3-Person Households | 37 (15.2%) | 0 (0.0%) |
| 4-Person Households | 30 (12.3%) | 6 (2.5%) |
| 5-Person Households | 5 (2.1%) | 0 (0.0%) |
| 6-Person Households | 2 (0.8%) | 0 (0.0%) |
| 7+ Person Households | 13 (5.3%) | 0 (0.0%) |
| Total | 162 (66.7%) | 81 (33.3%) |
Female Fertility in South Dayton
Fertility by Age in South Dayton
Average fertility rate in South Dayton is 72.0 births per 1,000 women. Women in the age bracket of 35 to 50 years have the highest fertility rate with 113.0 births per 1,000 women. Women in the age bracket of 35 to 50 years acount for 58.3% of all women with births.
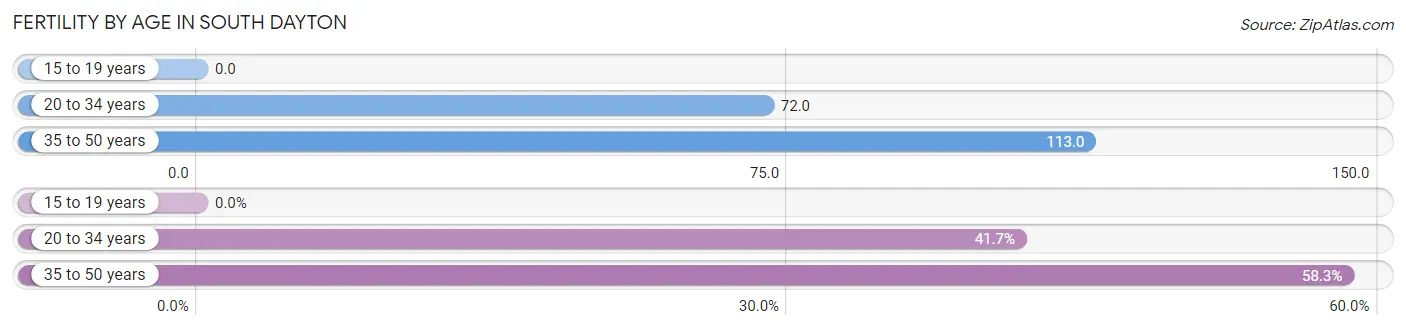
| Age Bracket | Women with Births | Births / 1,000 Women |
| 15 to 19 years | 0 (0.0%) | 0.0 |
| 20 to 34 years | 5 (41.7%) | 72.0 |
| 35 to 50 years | 7 (58.3%) | 113.0 |
| Total | 12 (100.0%) | 72.0 |
Fertility by Age by Marriage Status in South Dayton
83.3% of women with births (12) in South Dayton are married. The highest percentage of unmarried women with births falls into 20 to 34 years age bracket with 40.0% of them unmarried at the time of birth, while the lowest percentage of unmarried women with births belong to 35 to 50 years age bracket with 0.0% of them unmarried.
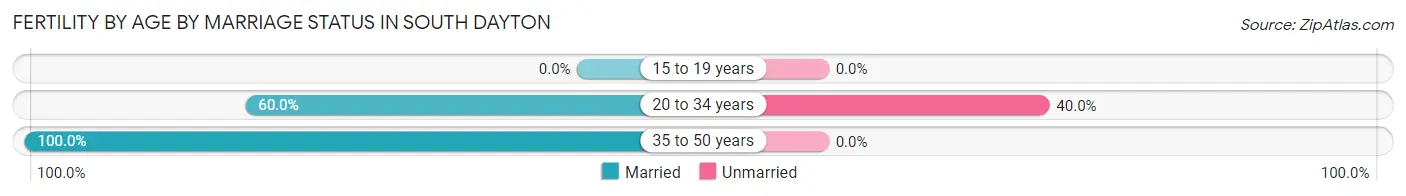
| Age Bracket | Married | Unmarried |
| 15 to 19 years | 0 (0.0%) | 0 (0.0%) |
| 20 to 34 years | 3 (60.0%) | 2 (40.0%) |
| 35 to 50 years | 7 (100.0%) | 0 (0.0%) |
| Total | 10 (83.3%) | 2 (16.7%) |
Fertility by Education in South Dayton
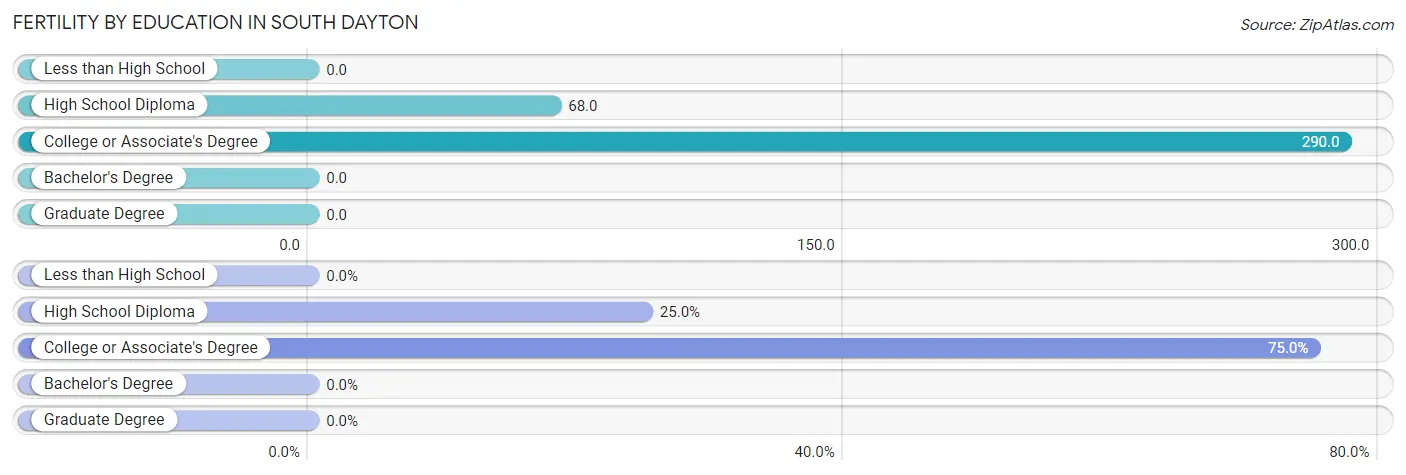
| Educational Attainment | Women with Births | Births / 1,000 Women |
| Less than High School | 0 (0.0%) | 0.0 |
| High School Diploma | 3 (25.0%) | 68.0 |
| College or Associate's Degree | 9 (75.0%) | 290.0 |
| Bachelor's Degree | 0 (0.0%) | 0.0 |
| Graduate Degree | 0 (0.0%) | 0.0 |
| Total | 12 (100.0%) | 72.0 |
Fertility by Education by Marriage Status in South Dayton
16.7% of women with births in South Dayton are unmarried. Women with the educational attainment of high school diploma are most likely to be married with 100.0% of them married at childbirth, while women with the educational attainment of college or associate's degree are least likely to be married with 22.2% of them unmarried at childbirth.
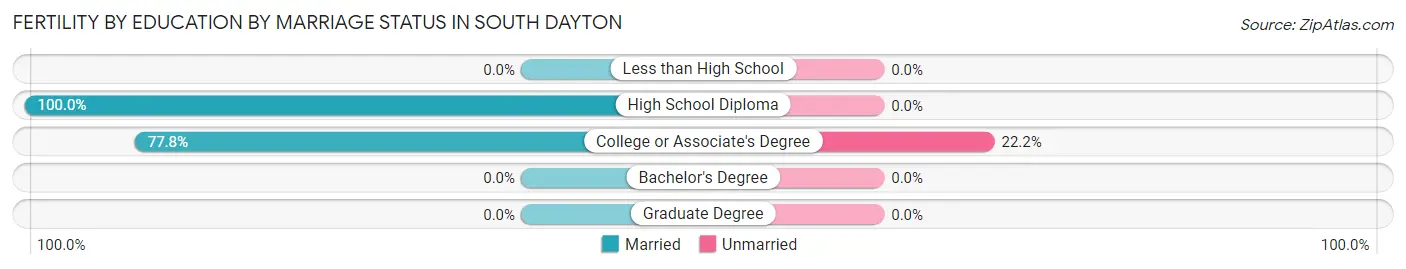
| Educational Attainment | Married | Unmarried |
| Less than High School | 0 (0.0%) | 0 (0.0%) |
| High School Diploma | 3 (100.0%) | 0 (0.0%) |
| College or Associate's Degree | 7 (77.8%) | 2 (22.2%) |
| Bachelor's Degree | 0 (0.0%) | 0 (0.0%) |
| Graduate Degree | 0 (0.0%) | 0 (0.0%) |
| Total | 10 (83.3%) | 2 (16.7%) |
Employment Characteristics in South Dayton
Employment by Class of Employer in South Dayton
Among the 248 employed individuals in South Dayton, private company employees (162 | 65.3%), state government employees (42 | 16.9%), and local government employees (16 | 6.5%) make up the most common classes of employment.
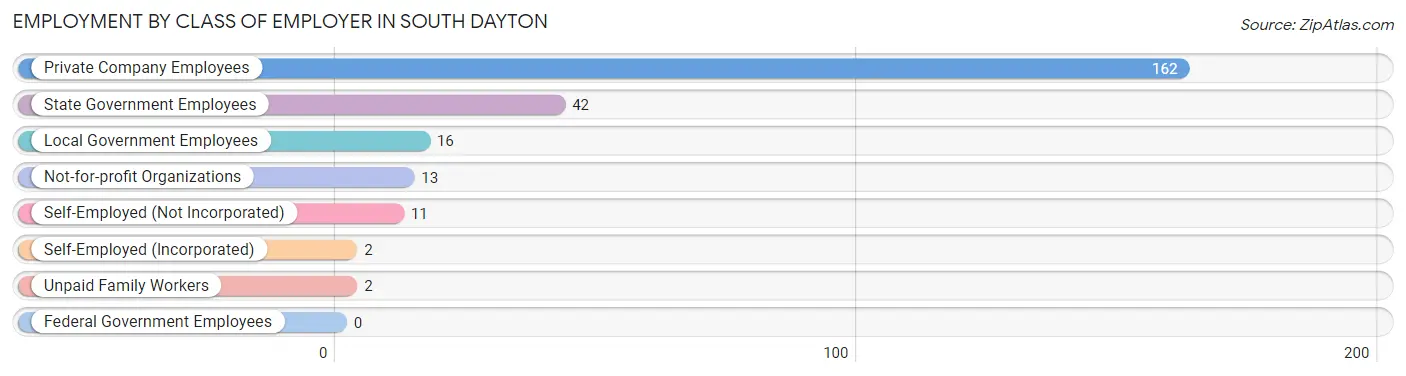
| Employer Class | # Employees | % Employees |
| Private Company Employees | 162 | 65.3% |
| Self-Employed (Incorporated) | 2 | 0.8% |
| Self-Employed (Not Incorporated) | 11 | 4.4% |
| Not-for-profit Organizations | 13 | 5.2% |
| Local Government Employees | 16 | 6.5% |
| State Government Employees | 42 | 16.9% |
| Federal Government Employees | 0 | 0.0% |
| Unpaid Family Workers | 2 | 0.8% |
| Total | 248 | 100.0% |
Employment Status by Age in South Dayton
According to the labor force statistics for South Dayton, out of the total population over 16 years of age (468), 55.1% or 258 individuals are in the labor force, with 1.6% or 4 of them unemployed. The age group with the highest labor force participation rate is 20 to 24 years, with 87.5% or 35 individuals in the labor force. Within the labor force, the 60 to 64 years age range has the highest percentage of unemployed individuals, with 11.1% or 2 of them being unemployed.
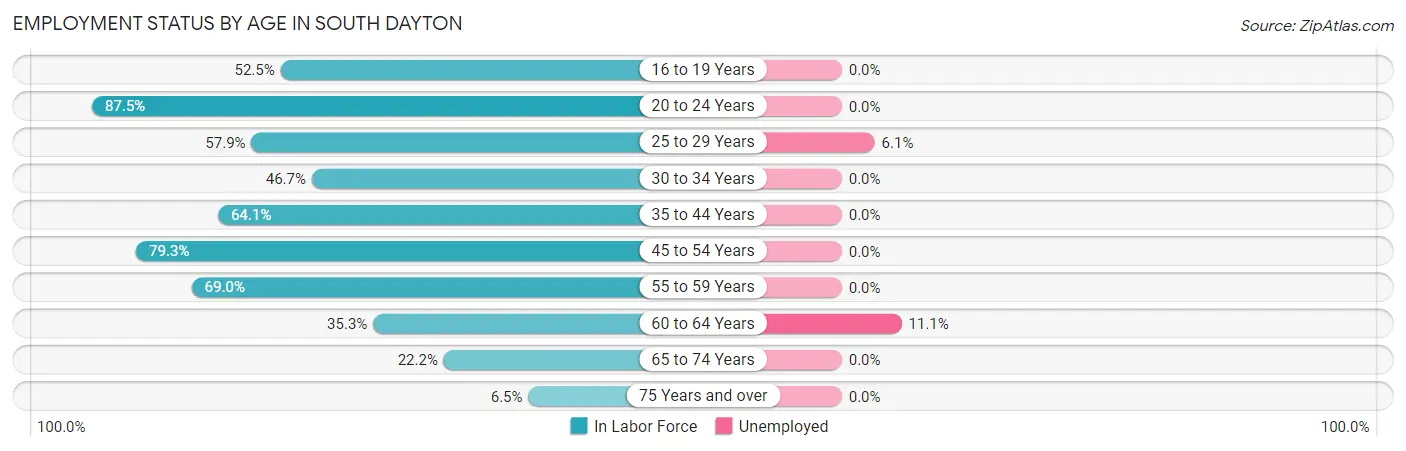
| Age Bracket | In Labor Force | Unemployed |
| 16 to 19 Years | 21 (52.5%) | 0 (0.0%) |
| 20 to 24 Years | 35 (87.5%) | 0 (0.0%) |
| 25 to 29 Years | 33 (57.9%) | 2 (6.1%) |
| 30 to 34 Years | 7 (46.7%) | 0 (0.0%) |
| 35 to 44 Years | 41 (64.1%) | 0 (0.0%) |
| 45 to 54 Years | 69 (79.3%) | 0 (0.0%) |
| 55 to 59 Years | 20 (69.0%) | 0 (0.0%) |
| 60 to 64 Years | 18 (35.3%) | 2 (11.1%) |
| 65 to 74 Years | 12 (22.2%) | 0 (0.0%) |
| 75 Years and over | 2 (6.5%) | 0 (0.0%) |
| Total | 258 (55.1%) | 4 (1.6%) |
Employment Status by Educational Attainment in South Dayton
According to labor force statistics for South Dayton, 62.0% of individuals (188) out of the total population between 25 and 64 years of age (303) are in the labor force, with 2.1% or 4 of them being unemployed. The group with the highest labor force participation rate are those with the educational attainment of college / associate degree, with 76.6% or 49 individuals in the labor force. Within the labor force, individuals with high school diploma education have the highest percentage of unemployment, with 4.7% or 4 of them being unemployed.
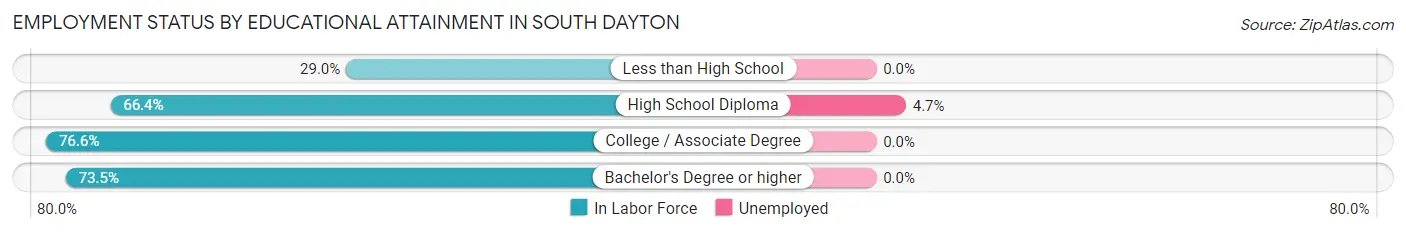
| Educational Attainment | In Labor Force | Unemployed |
| Less than High School | 18 (29.0%) | 0 (0.0%) |
| High School Diploma | 85 (66.4%) | 6 (4.7%) |
| College / Associate Degree | 49 (76.6%) | 0 (0.0%) |
| Bachelor's Degree or higher | 36 (73.5%) | 0 (0.0%) |
| Total | 188 (62.0%) | 6 (2.1%) |
Employment Occupations by Sex in South Dayton
Management, Business, Science and Arts Occupations
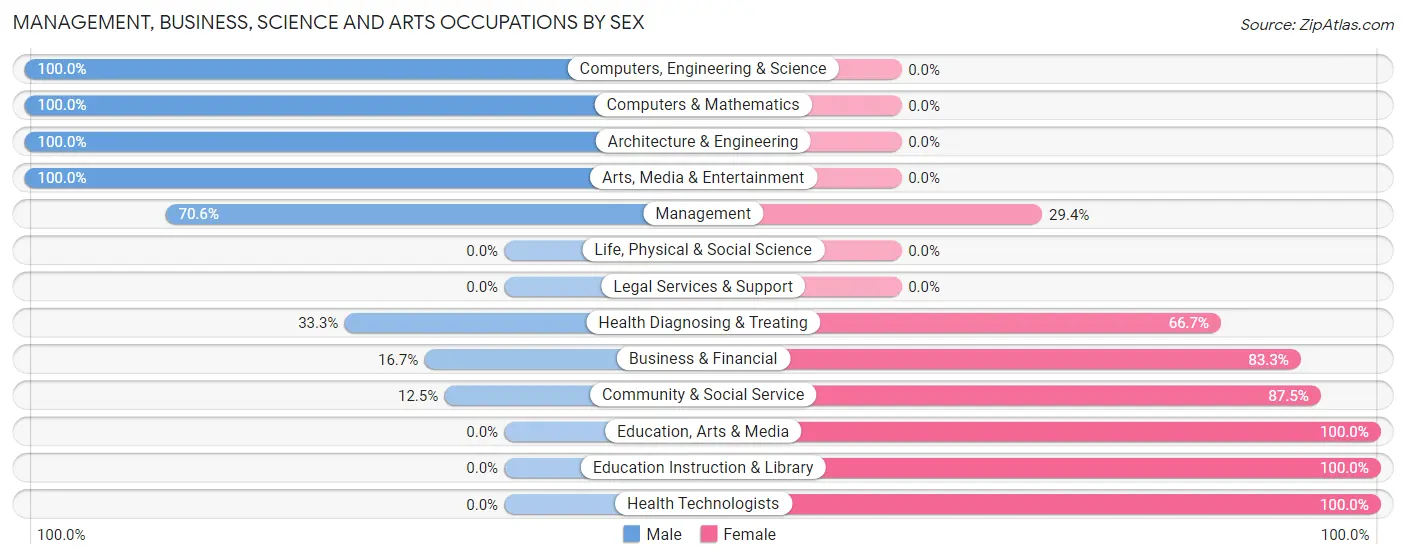
The most common Management, Business, Science and Arts occupations in South Dayton are Business & Financial (18 | 7.1%), Management (17 | 6.7%), Community & Social Service (16 | 6.3%), Education Instruction & Library (11 | 4.3%), and Health Diagnosing & Treating (9 | 3.5%).
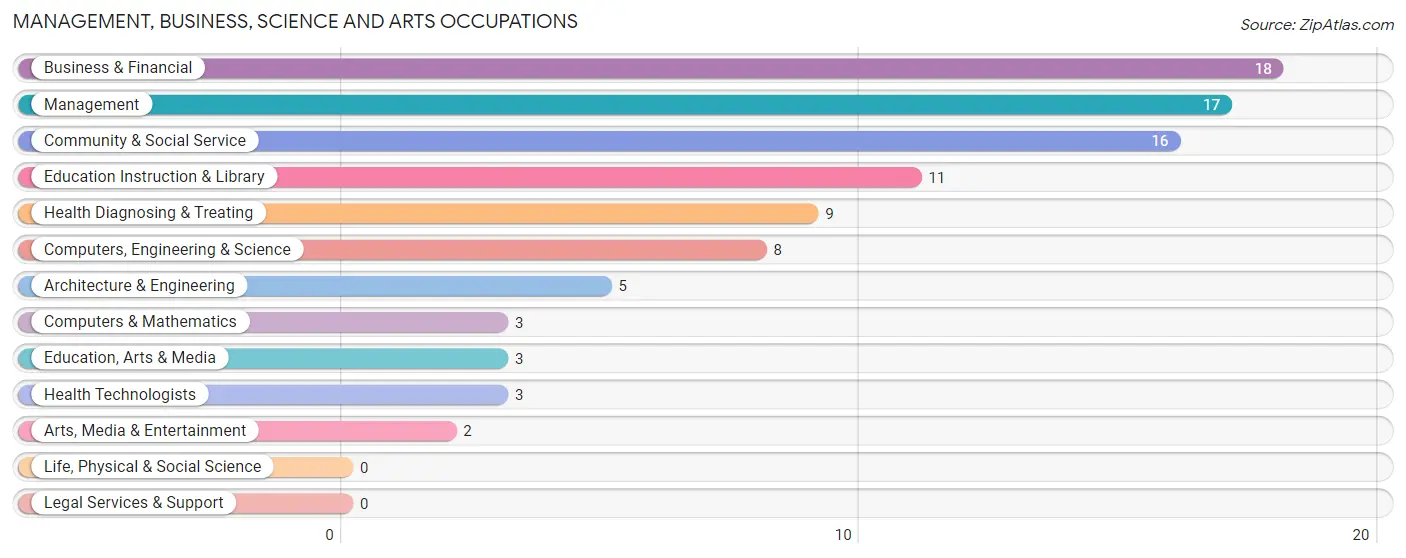
Management, Business, Science and Arts Occupations by Sex
Within the Management, Business, Science and Arts occupations in South Dayton, the most male-oriented occupations are Computers, Engineering & Science (100.0%), Computers & Mathematics (100.0%), and Architecture & Engineering (100.0%), while the most female-oriented occupations are Education, Arts & Media (100.0%), Education Instruction & Library (100.0%), and Health Technologists (100.0%).
| Occupation | Male | Female |
| Management | 12 (70.6%) | 5 (29.4%) |
| Business & Financial | 3 (16.7%) | 15 (83.3%) |
| Computers, Engineering & Science | 8 (100.0%) | 0 (0.0%) |
| Computers & Mathematics | 3 (100.0%) | 0 (0.0%) |
| Architecture & Engineering | 5 (100.0%) | 0 (0.0%) |
| Life, Physical & Social Science | 0 (0.0%) | 0 (0.0%) |
| Community & Social Service | 2 (12.5%) | 14 (87.5%) |
| Education, Arts & Media | 0 (0.0%) | 3 (100.0%) |
| Legal Services & Support | 0 (0.0%) | 0 (0.0%) |
| Education Instruction & Library | 0 (0.0%) | 11 (100.0%) |
| Arts, Media & Entertainment | 2 (100.0%) | 0 (0.0%) |
| Health Diagnosing & Treating | 3 (33.3%) | 6 (66.7%) |
| Health Technologists | 0 (0.0%) | 3 (100.0%) |
| Total (Category) | 28 (41.2%) | 40 (58.8%) |
| Total (Overall) | 110 (43.3%) | 144 (56.7%) |
Services Occupations
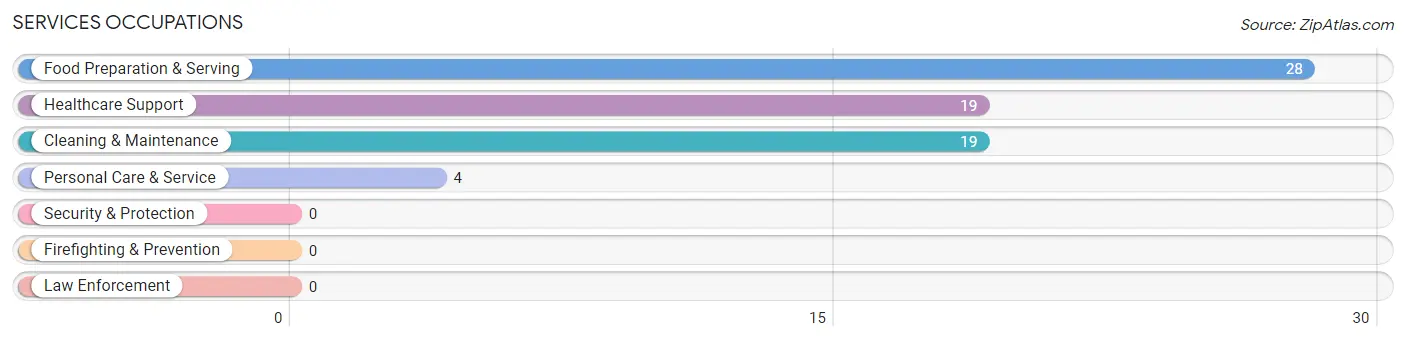
The most common Services occupations in South Dayton are Food Preparation & Serving (28 | 11.0%), Healthcare Support (19 | 7.5%), Cleaning & Maintenance (19 | 7.5%), and Personal Care & Service (4 | 1.6%).
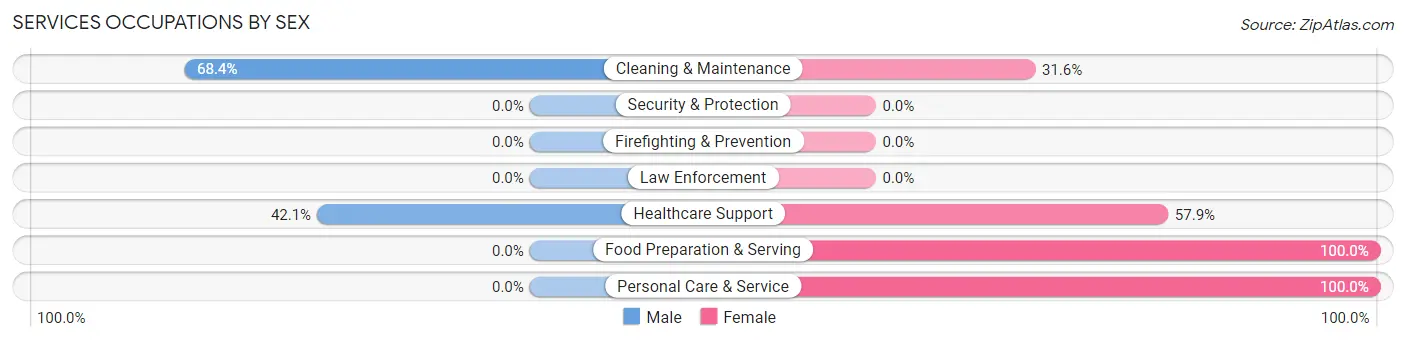
Services Occupations by Sex
Within the Services occupations in South Dayton, the most male-oriented occupations are Cleaning & Maintenance (68.4%), and Healthcare Support (42.1%), while the most female-oriented occupations are Food Preparation & Serving (100.0%), Personal Care & Service (100.0%), and Healthcare Support (57.9%).
| Occupation | Male | Female |
| Healthcare Support | 8 (42.1%) | 11 (57.9%) |
| Security & Protection | 0 (0.0%) | 0 (0.0%) |
| Firefighting & Prevention | 0 (0.0%) | 0 (0.0%) |
| Law Enforcement | 0 (0.0%) | 0 (0.0%) |
| Food Preparation & Serving | 0 (0.0%) | 28 (100.0%) |
| Cleaning & Maintenance | 13 (68.4%) | 6 (31.6%) |
| Personal Care & Service | 0 (0.0%) | 4 (100.0%) |
| Total (Category) | 21 (30.0%) | 49 (70.0%) |
| Total (Overall) | 110 (43.3%) | 144 (56.7%) |
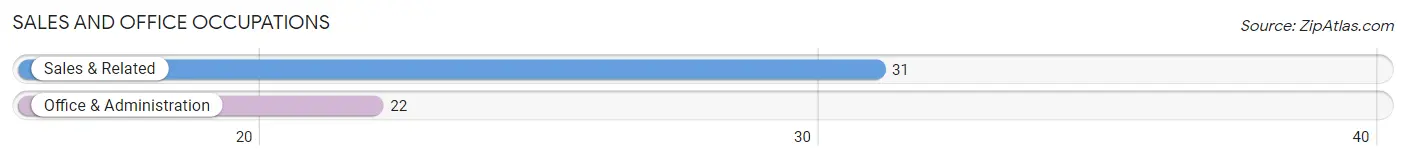
Sales and Office Occupations
The most common Sales and Office occupations in South Dayton are Sales & Related (31 | 12.2%), and Office & Administration (22 | 8.7%).
Sales and Office Occupations by Sex
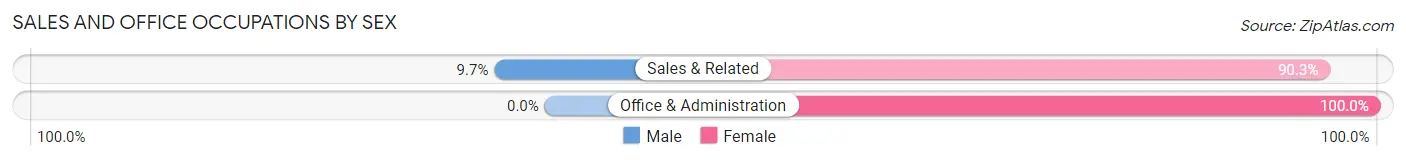
| Occupation | Male | Female |
| Sales & Related | 3 (9.7%) | 28 (90.3%) |
| Office & Administration | 0 (0.0%) | 22 (100.0%) |
| Total (Category) | 3 (5.7%) | 50 (94.3%) |
| Total (Overall) | 110 (43.3%) | 144 (56.7%) |
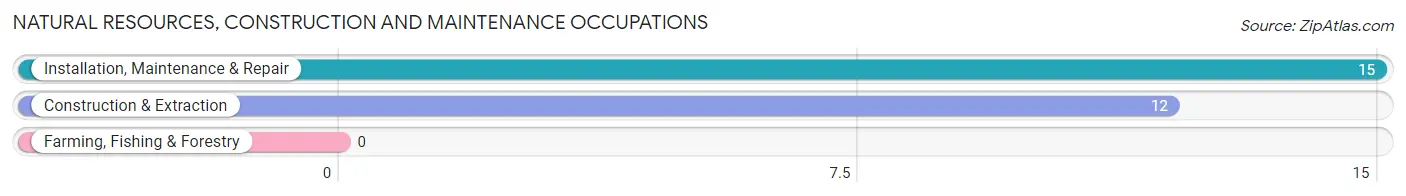
Natural Resources, Construction and Maintenance Occupations
The most common Natural Resources, Construction and Maintenance occupations in South Dayton are Installation, Maintenance & Repair (15 | 5.9%), and Construction & Extraction (12 | 4.7%).
Natural Resources, Construction and Maintenance Occupations by Sex
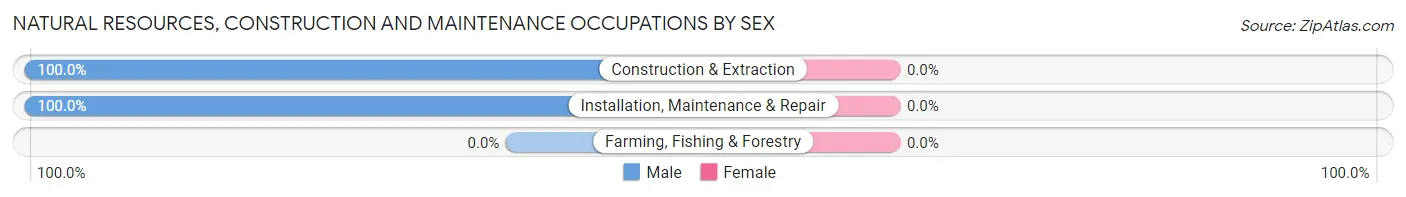
| Occupation | Male | Female |
| Farming, Fishing & Forestry | 0 (0.0%) | 0 (0.0%) |
| Construction & Extraction | 12 (100.0%) | 0 (0.0%) |
| Installation, Maintenance & Repair | 15 (100.0%) | 0 (0.0%) |
| Total (Category) | 27 (100.0%) | 0 (0.0%) |
| Total (Overall) | 110 (43.3%) | 144 (56.7%) |
Production, Transportation and Moving Occupations
The most common Production, Transportation and Moving occupations in South Dayton are Production (13 | 5.1%), Transportation (12 | 4.7%), and Material Moving (11 | 4.3%).
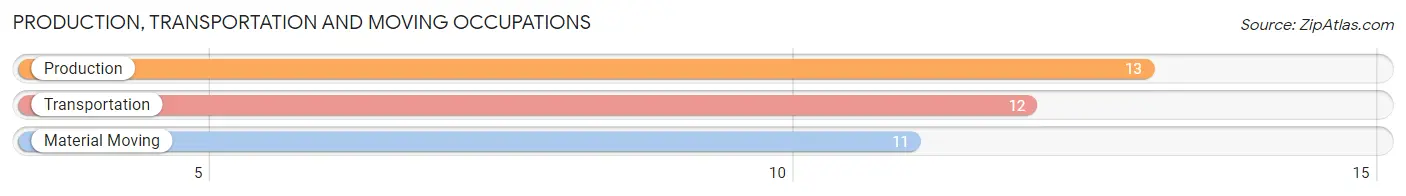
Production, Transportation and Moving Occupations by Sex
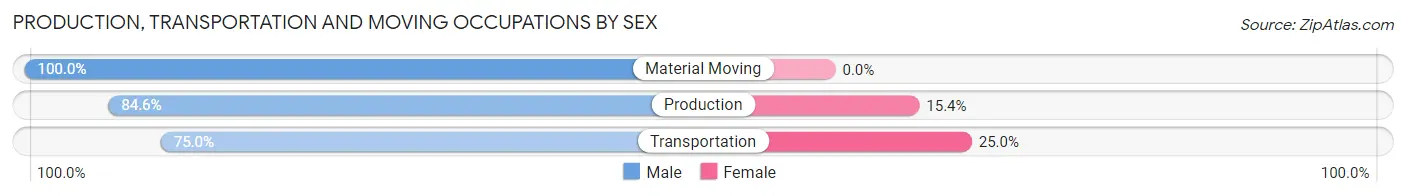
| Occupation | Male | Female |
| Production | 11 (84.6%) | 2 (15.4%) |
| Transportation | 9 (75.0%) | 3 (25.0%) |
| Material Moving | 11 (100.0%) | 0 (0.0%) |
| Total (Category) | 31 (86.1%) | 5 (13.9%) |
| Total (Overall) | 110 (43.3%) | 144 (56.7%) |
Employment Industries by Sex in South Dayton
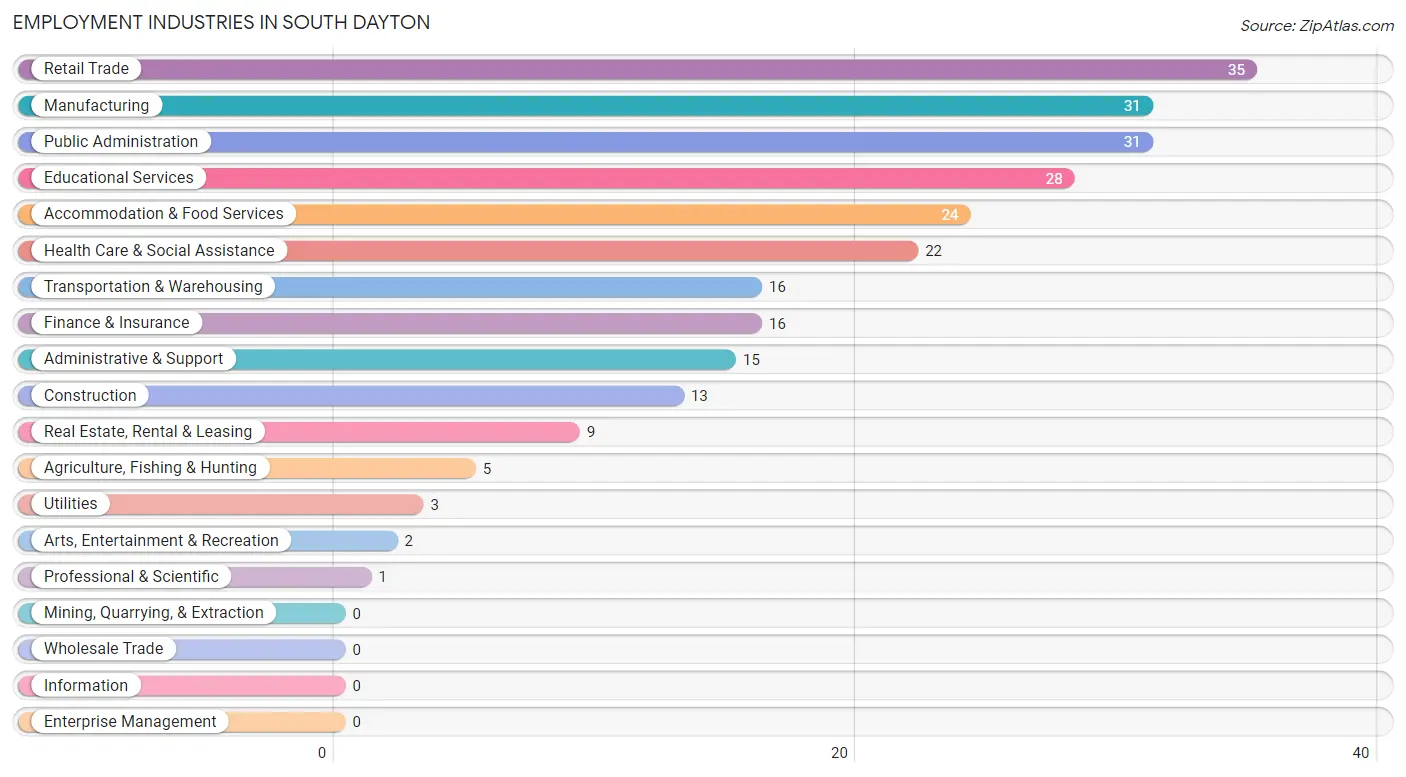
Employment Industries in South Dayton
The major employment industries in South Dayton include Retail Trade (35 | 13.8%), Manufacturing (31 | 12.2%), Public Administration (31 | 12.2%), Educational Services (28 | 11.0%), and Accommodation & Food Services (24 | 9.5%).
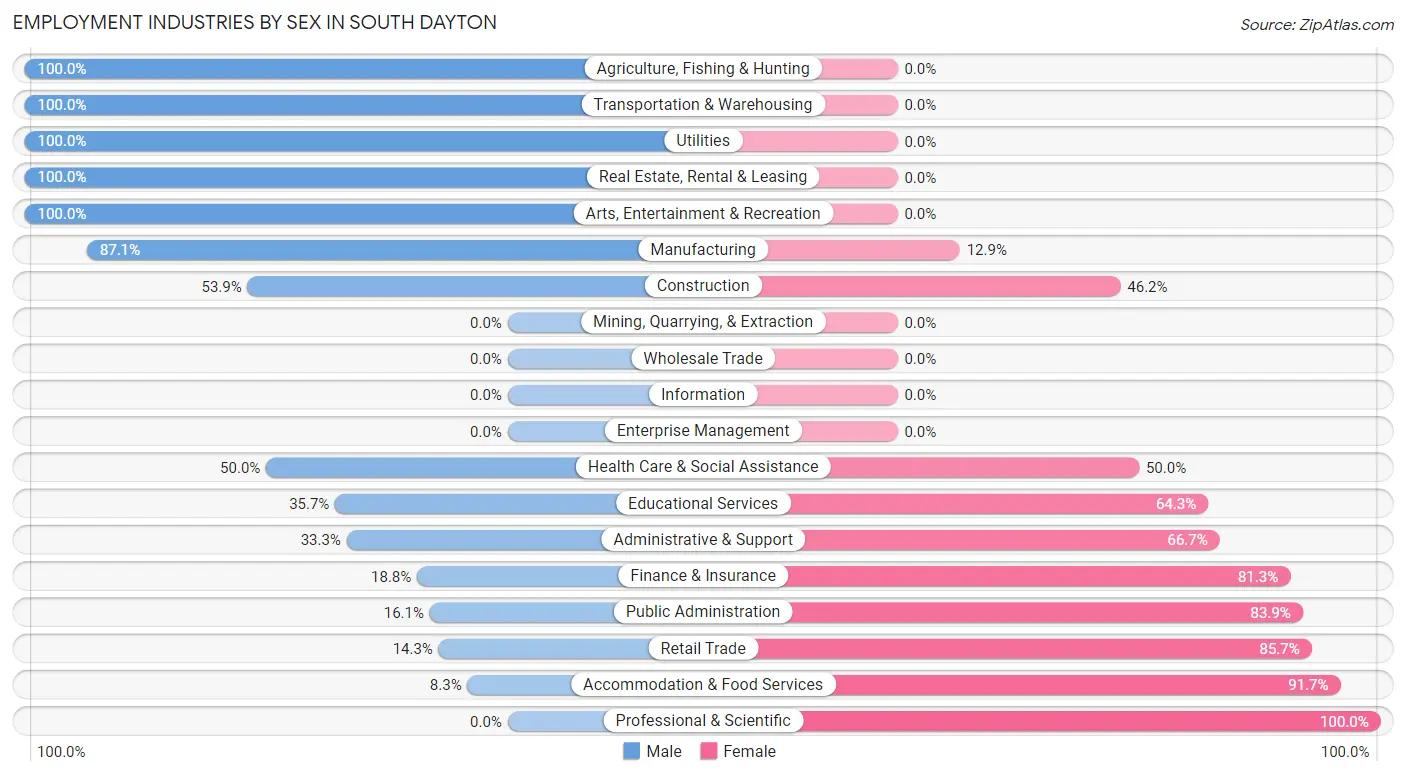
Employment Industries by Sex in South Dayton
The South Dayton industries that see more men than women are Agriculture, Fishing & Hunting (100.0%), Transportation & Warehousing (100.0%), and Utilities (100.0%), whereas the industries that tend to have a higher number of women are Professional & Scientific (100.0%), Accommodation & Food Services (91.7%), and Retail Trade (85.7%).
| Industry | Male | Female |
| Agriculture, Fishing & Hunting | 5 (100.0%) | 0 (0.0%) |
| Mining, Quarrying, & Extraction | 0 (0.0%) | 0 (0.0%) |
| Construction | 7 (53.8%) | 6 (46.2%) |
| Manufacturing | 27 (87.1%) | 4 (12.9%) |
| Wholesale Trade | 0 (0.0%) | 0 (0.0%) |
| Retail Trade | 5 (14.3%) | 30 (85.7%) |
| Transportation & Warehousing | 16 (100.0%) | 0 (0.0%) |
| Utilities | 3 (100.0%) | 0 (0.0%) |
| Information | 0 (0.0%) | 0 (0.0%) |
| Finance & Insurance | 3 (18.8%) | 13 (81.2%) |
| Real Estate, Rental & Leasing | 9 (100.0%) | 0 (0.0%) |
| Professional & Scientific | 0 (0.0%) | 1 (100.0%) |
| Enterprise Management | 0 (0.0%) | 0 (0.0%) |
| Administrative & Support | 5 (33.3%) | 10 (66.7%) |
| Educational Services | 10 (35.7%) | 18 (64.3%) |
| Health Care & Social Assistance | 11 (50.0%) | 11 (50.0%) |
| Arts, Entertainment & Recreation | 2 (100.0%) | 0 (0.0%) |
| Accommodation & Food Services | 2 (8.3%) | 22 (91.7%) |
| Public Administration | 5 (16.1%) | 26 (83.9%) |
| Total | 110 (43.3%) | 144 (56.7%) |
Education in South Dayton
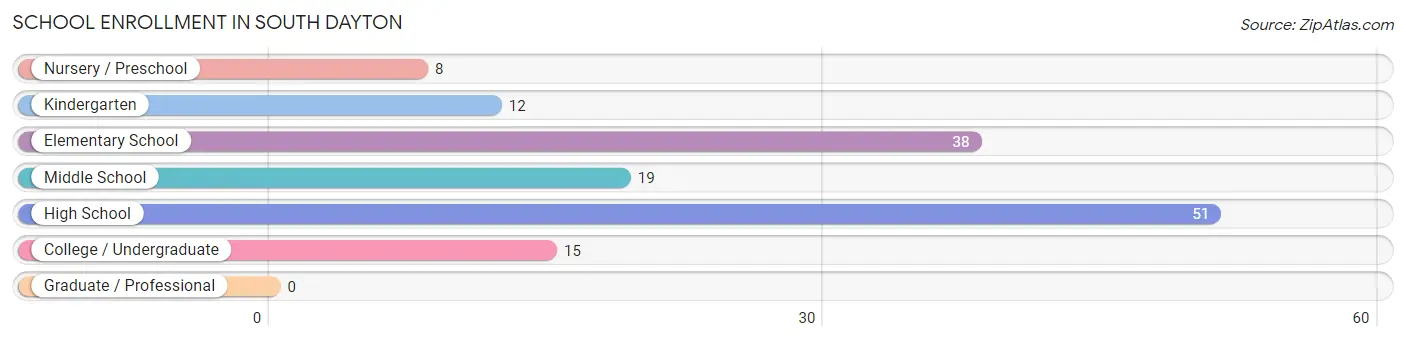
School Enrollment in South Dayton
The most common levels of schooling among the 143 students in South Dayton are high school (51 | 35.7%), elementary school (38 | 26.6%), and middle school (19 | 13.3%).
| School Level | # Students | % Students |
| Nursery / Preschool | 8 | 5.6% |
| Kindergarten | 12 | 8.4% |
| Elementary School | 38 | 26.6% |
| Middle School | 19 | 13.3% |
| High School | 51 | 35.7% |
| College / Undergraduate | 15 | 10.5% |
| Graduate / Professional | 0 | 0.0% |
| Total | 143 | 100.0% |
School Enrollment by Age by Funding Source in South Dayton
Out of a total of 143 students who are enrolled in schools in South Dayton, 19 (13.3%) attend a private institution, while the remaining 124 (86.7%) are enrolled in public schools. The age group of 20 to 24 year olds has the highest likelihood of being enrolled in private schools, with 3 (100.0% in the age bracket) enrolled. Conversely, the age group of 3 to 4 year olds has the lowest likelihood of being enrolled in a private school, with 2 (100.0% in the age bracket) attending a public institution.
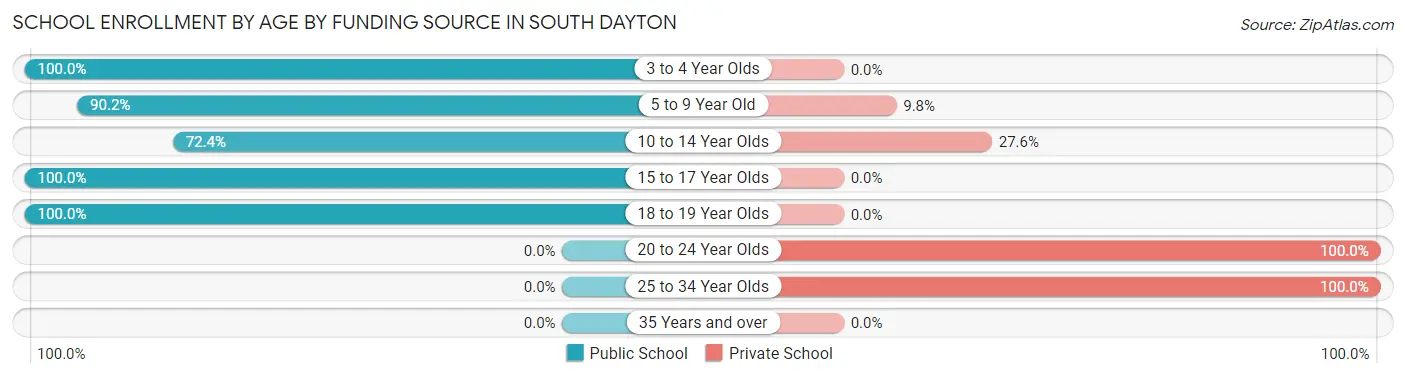
| Age Bracket | Public School | Private School |
| 3 to 4 Year Olds | 2 (100.0%) | 0 (0.0%) |
| 5 to 9 Year Old | 46 (90.2%) | 5 (9.8%) |
| 10 to 14 Year Olds | 21 (72.4%) | 8 (27.6%) |
| 15 to 17 Year Olds | 42 (100.0%) | 0 (0.0%) |
| 18 to 19 Year Olds | 13 (100.0%) | 0 (0.0%) |
| 20 to 24 Year Olds | 0 (0.0%) | 3 (100.0%) |
| 25 to 34 Year Olds | 0 (0.0%) | 3 (100.0%) |
| 35 Years and over | 0 (0.0%) | 0 (0.0%) |
| Total | 124 (86.7%) | 19 (13.3%) |
Educational Attainment by Field of Study in South Dayton
Education (15 | 20.3%), business (11 | 14.9%), arts & humanities (11 | 14.9%), social sciences (9 | 12.2%), and visual & performing arts (8 | 10.8%) are the most common fields of study among 74 individuals in South Dayton who have obtained a bachelor's degree or higher.
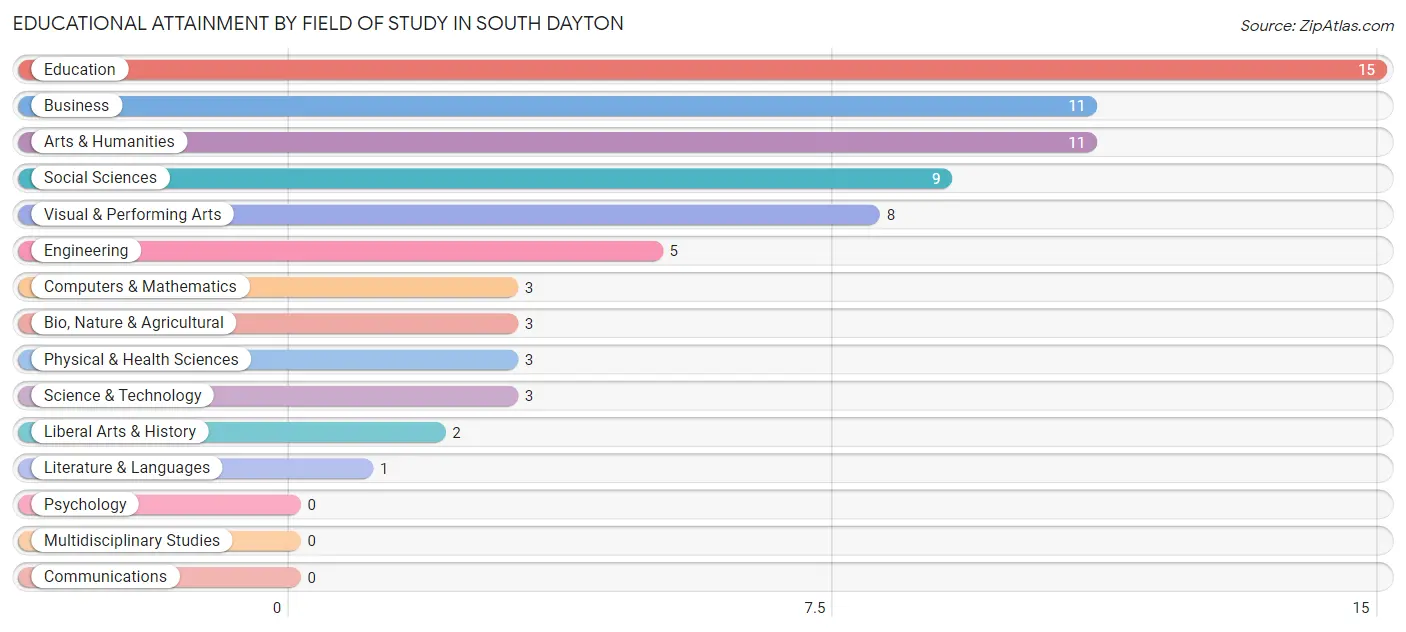
| Field of Study | # Graduates | % Graduates |
| Computers & Mathematics | 3 | 4.1% |
| Bio, Nature & Agricultural | 3 | 4.1% |
| Physical & Health Sciences | 3 | 4.1% |
| Psychology | 0 | 0.0% |
| Social Sciences | 9 | 12.2% |
| Engineering | 5 | 6.8% |
| Multidisciplinary Studies | 0 | 0.0% |
| Science & Technology | 3 | 4.1% |
| Business | 11 | 14.9% |
| Education | 15 | 20.3% |
| Literature & Languages | 1 | 1.3% |
| Liberal Arts & History | 2 | 2.7% |
| Visual & Performing Arts | 8 | 10.8% |
| Communications | 0 | 0.0% |
| Arts & Humanities | 11 | 14.9% |
| Total | 74 | 100.0% |
Transportation & Commute in South Dayton
Vehicle Availability by Sex in South Dayton
The most prevalent vehicle ownership categories in South Dayton are males with 2 vehicles (60, accounting for 54.5%) and females with 2 vehicles (83, making up 43.5%).
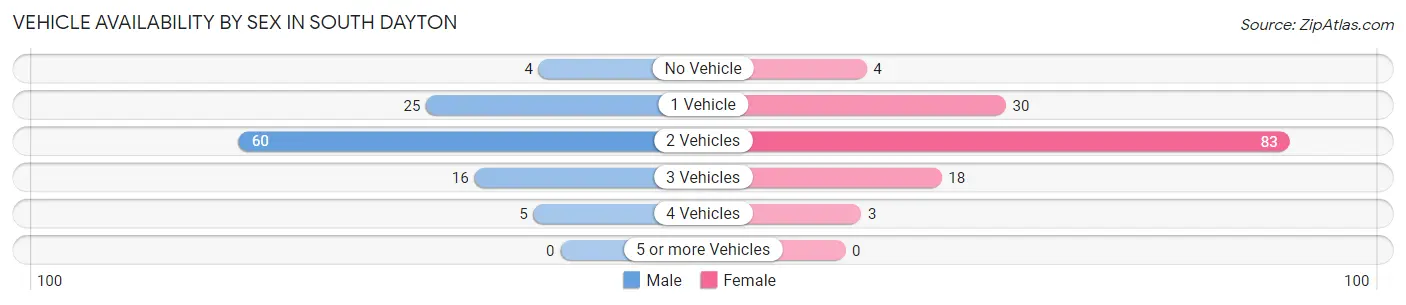
| Vehicles Available | Male | Female |
| No Vehicle | 4 (3.6%) | 4 (2.9%) |
| 1 Vehicle | 25 (22.7%) | 30 (21.7%) |
| 2 Vehicles | 60 (54.5%) | 83 (60.1%) |
| 3 Vehicles | 16 (14.5%) | 18 (13.0%) |
| 4 Vehicles | 5 (4.5%) | 3 (2.2%) |
| 5 or more Vehicles | 0 (0.0%) | 0 (0.0%) |
| Total | 110 (100.0%) | 138 (100.0%) |
Commute Time in South Dayton
The most frequently occuring commute durations in South Dayton are 20 to 24 minutes (39 commuters, 16.5%), 45 to 59 minutes (35 commuters, 14.8%), and 30 to 34 minutes (28 commuters, 11.8%).
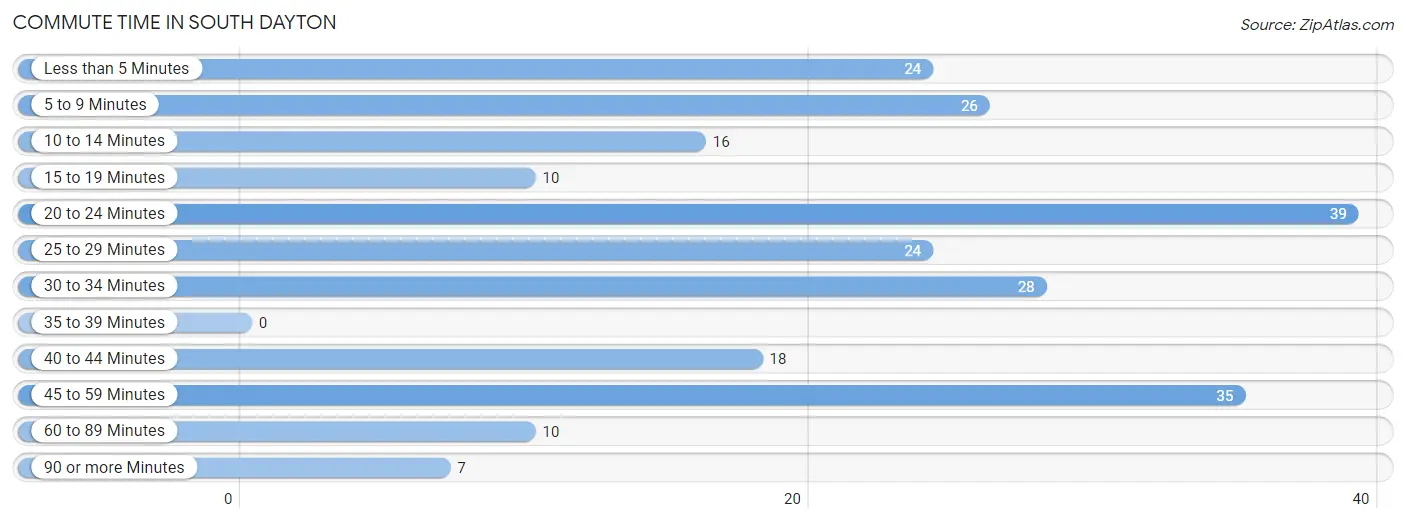
| Commute Time | # Commuters | % Commuters |
| Less than 5 Minutes | 24 | 10.1% |
| 5 to 9 Minutes | 26 | 11.0% |
| 10 to 14 Minutes | 16 | 6.8% |
| 15 to 19 Minutes | 10 | 4.2% |
| 20 to 24 Minutes | 39 | 16.5% |
| 25 to 29 Minutes | 24 | 10.1% |
| 30 to 34 Minutes | 28 | 11.8% |
| 35 to 39 Minutes | 0 | 0.0% |
| 40 to 44 Minutes | 18 | 7.6% |
| 45 to 59 Minutes | 35 | 14.8% |
| 60 to 89 Minutes | 10 | 4.2% |
| 90 or more Minutes | 7 | 2.9% |
Commute Time by Sex in South Dayton
The most common commute times in South Dayton are 45 to 59 minutes (30 commuters, 28.0%) for males and 20 to 24 minutes (28 commuters, 21.5%) for females.
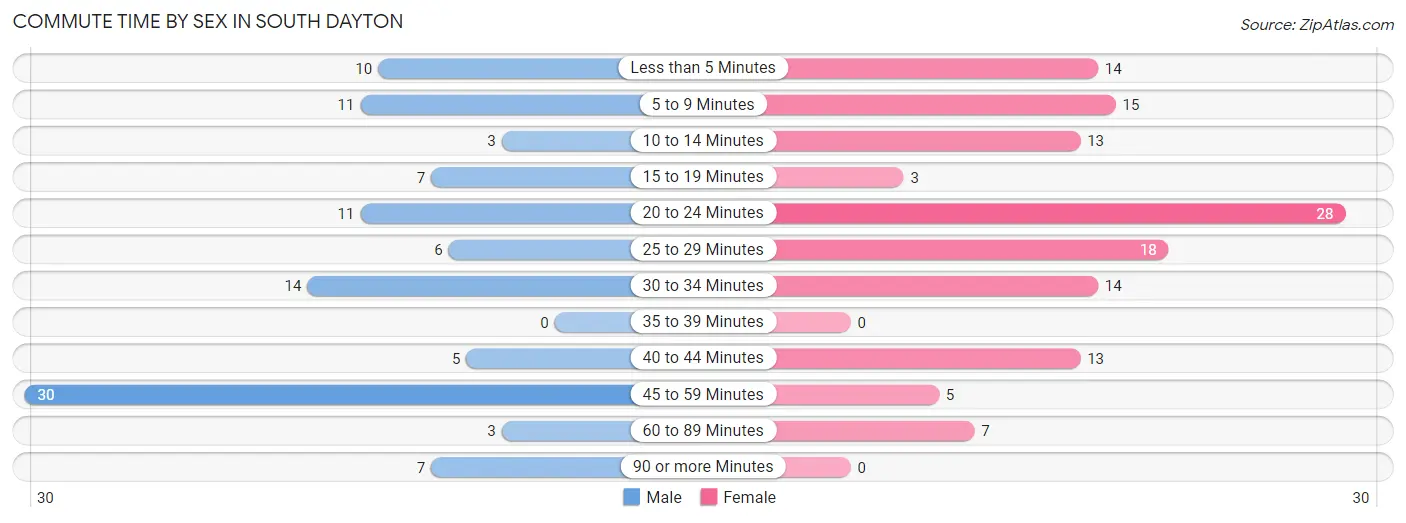
| Commute Time | Male | Female |
| Less than 5 Minutes | 10 (9.3%) | 14 (10.8%) |
| 5 to 9 Minutes | 11 (10.3%) | 15 (11.5%) |
| 10 to 14 Minutes | 3 (2.8%) | 13 (10.0%) |
| 15 to 19 Minutes | 7 (6.5%) | 3 (2.3%) |
| 20 to 24 Minutes | 11 (10.3%) | 28 (21.5%) |
| 25 to 29 Minutes | 6 (5.6%) | 18 (13.9%) |
| 30 to 34 Minutes | 14 (13.1%) | 14 (10.8%) |
| 35 to 39 Minutes | 0 (0.0%) | 0 (0.0%) |
| 40 to 44 Minutes | 5 (4.7%) | 13 (10.0%) |
| 45 to 59 Minutes | 30 (28.0%) | 5 (3.8%) |
| 60 to 89 Minutes | 3 (2.8%) | 7 (5.4%) |
| 90 or more Minutes | 7 (6.5%) | 0 (0.0%) |
Time of Departure to Work by Sex in South Dayton
The most frequent times of departure to work in South Dayton are 7:30 AM to 7:59 AM (23, 21.5%) for males and 7:30 AM to 7:59 AM (41, 31.5%) for females.
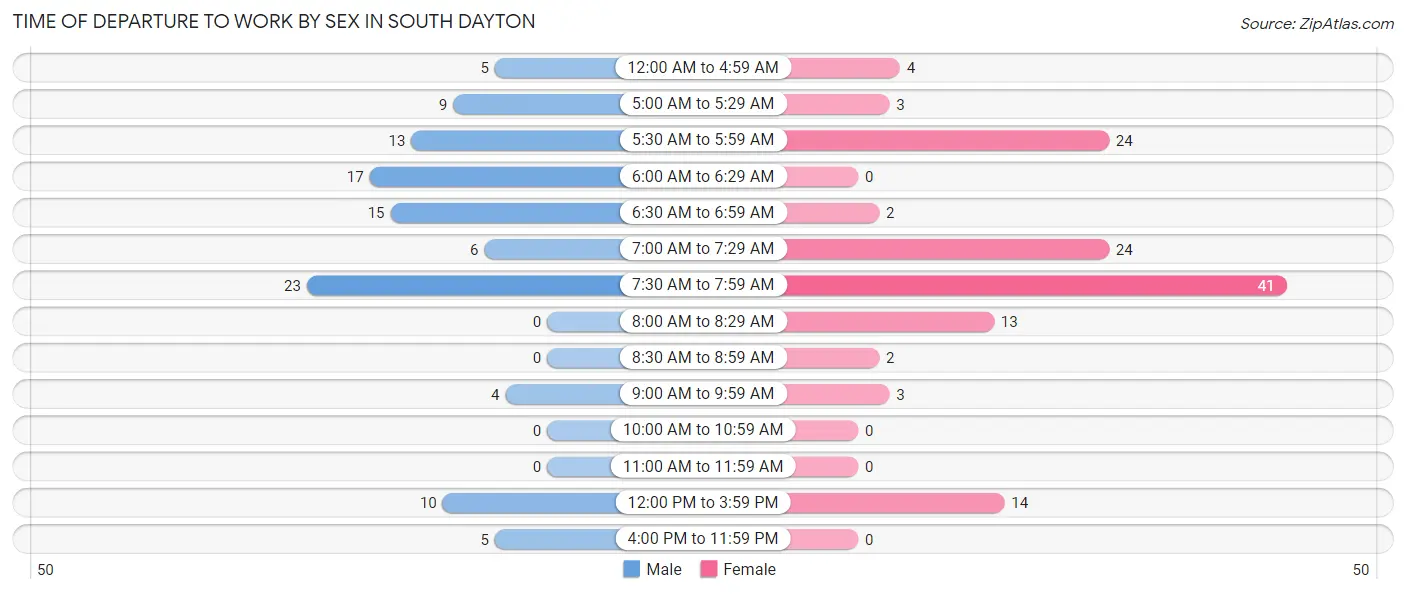
| Time of Departure | Male | Female |
| 12:00 AM to 4:59 AM | 5 (4.7%) | 4 (3.1%) |
| 5:00 AM to 5:29 AM | 9 (8.4%) | 3 (2.3%) |
| 5:30 AM to 5:59 AM | 13 (12.1%) | 24 (18.5%) |
| 6:00 AM to 6:29 AM | 17 (15.9%) | 0 (0.0%) |
| 6:30 AM to 6:59 AM | 15 (14.0%) | 2 (1.5%) |
| 7:00 AM to 7:29 AM | 6 (5.6%) | 24 (18.5%) |
| 7:30 AM to 7:59 AM | 23 (21.5%) | 41 (31.5%) |
| 8:00 AM to 8:29 AM | 0 (0.0%) | 13 (10.0%) |
| 8:30 AM to 8:59 AM | 0 (0.0%) | 2 (1.5%) |
| 9:00 AM to 9:59 AM | 4 (3.7%) | 3 (2.3%) |
| 10:00 AM to 10:59 AM | 0 (0.0%) | 0 (0.0%) |
| 11:00 AM to 11:59 AM | 0 (0.0%) | 0 (0.0%) |
| 12:00 PM to 3:59 PM | 10 (9.3%) | 14 (10.8%) |
| 4:00 PM to 11:59 PM | 5 (4.7%) | 0 (0.0%) |
| Total | 107 (100.0%) | 130 (100.0%) |
Housing Occupancy in South Dayton
Occupancy by Ownership in South Dayton
Of the total 243 dwellings in South Dayton, owner-occupied units account for 181 (74.5%), while renter-occupied units make up 62 (25.5%).
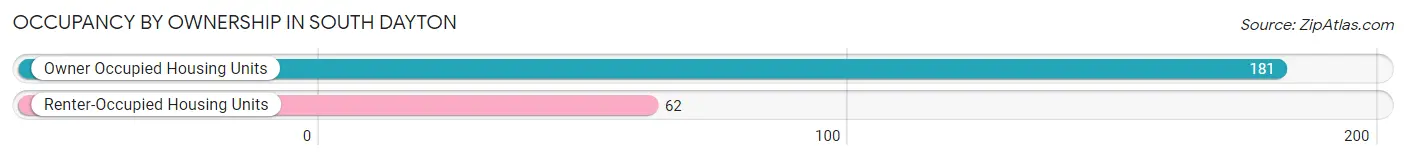
| Occupancy | # Housing Units | % Housing Units |
| Owner Occupied Housing Units | 181 | 74.5% |
| Renter-Occupied Housing Units | 62 | 25.5% |
| Total Occupied Housing Units | 243 | 100.0% |
Occupancy by Household Size in South Dayton
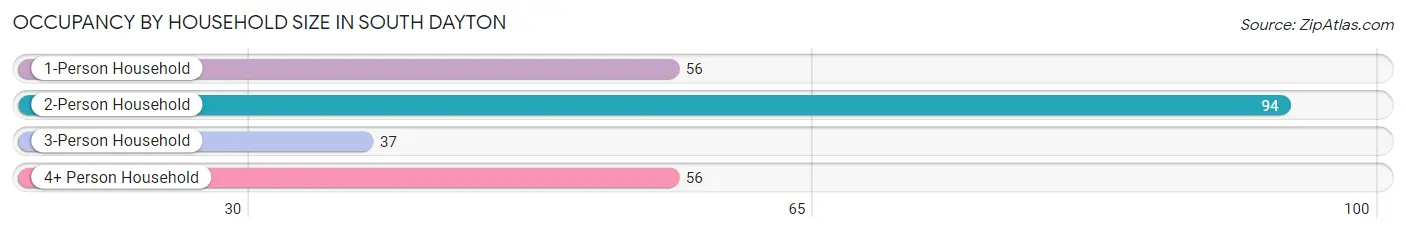
| Household Size | # Housing Units | % Housing Units |
| 1-Person Household | 56 | 23.1% |
| 2-Person Household | 94 | 38.7% |
| 3-Person Household | 37 | 15.2% |
| 4+ Person Household | 56 | 23.1% |
| Total Housing Units | 243 | 100.0% |
Occupancy by Ownership by Household Size in South Dayton
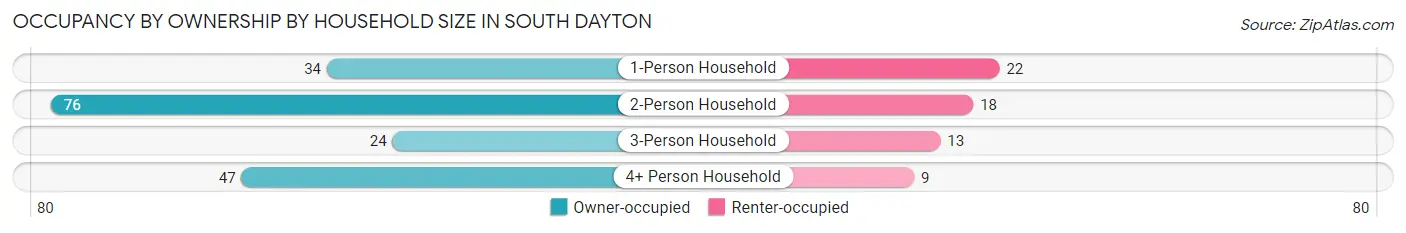
| Household Size | Owner-occupied | Renter-occupied |
| 1-Person Household | 34 (60.7%) | 22 (39.3%) |
| 2-Person Household | 76 (80.8%) | 18 (19.2%) |
| 3-Person Household | 24 (64.9%) | 13 (35.1%) |
| 4+ Person Household | 47 (83.9%) | 9 (16.1%) |
| Total Housing Units | 181 (74.5%) | 62 (25.5%) |
Occupancy by Educational Attainment in South Dayton
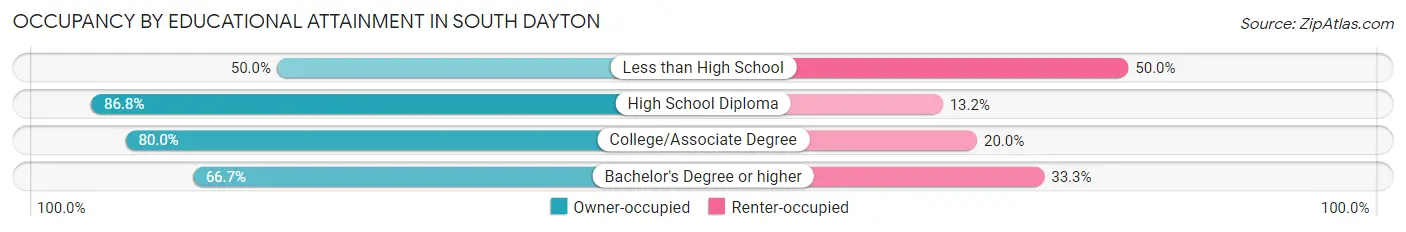
| Household Size | Owner-occupied | Renter-occupied |
| Less than High School | 24 (50.0%) | 24 (50.0%) |
| High School Diploma | 79 (86.8%) | 12 (13.2%) |
| College/Associate Degree | 52 (80.0%) | 13 (20.0%) |
| Bachelor's Degree or higher | 26 (66.7%) | 13 (33.3%) |
Occupancy by Age of Householder in South Dayton
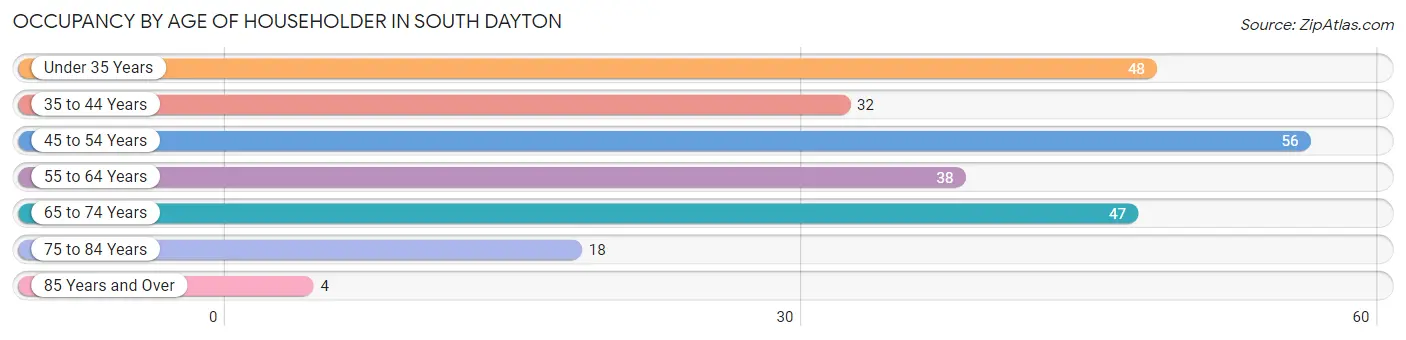
| Age Bracket | # Households | % Households |
| Under 35 Years | 48 | 19.8% |
| 35 to 44 Years | 32 | 13.2% |
| 45 to 54 Years | 56 | 23.1% |
| 55 to 64 Years | 38 | 15.6% |
| 65 to 74 Years | 47 | 19.3% |
| 75 to 84 Years | 18 | 7.4% |
| 85 Years and Over | 4 | 1.7% |
| Total | 243 | 100.0% |
Housing Finances in South Dayton
Median Income by Occupancy in South Dayton
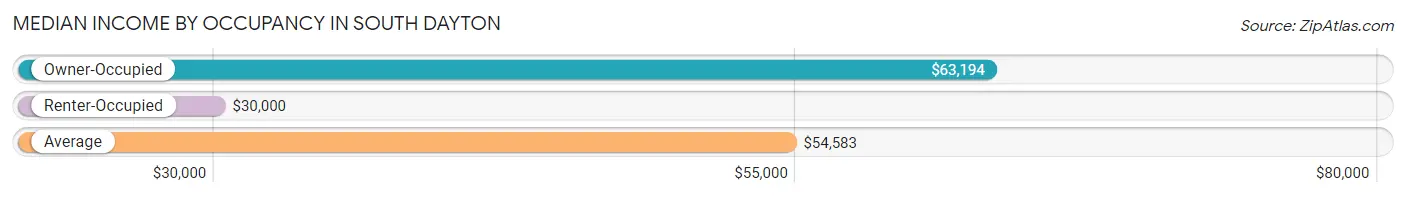
| Occupancy Type | # Households | Median Income |
| Owner-Occupied | 181 (74.5%) | $63,194 |
| Renter-Occupied | 62 (25.5%) | $30,000 |
| Average | 243 (100.0%) | $54,583 |
Occupancy by Householder Income Bracket in South Dayton
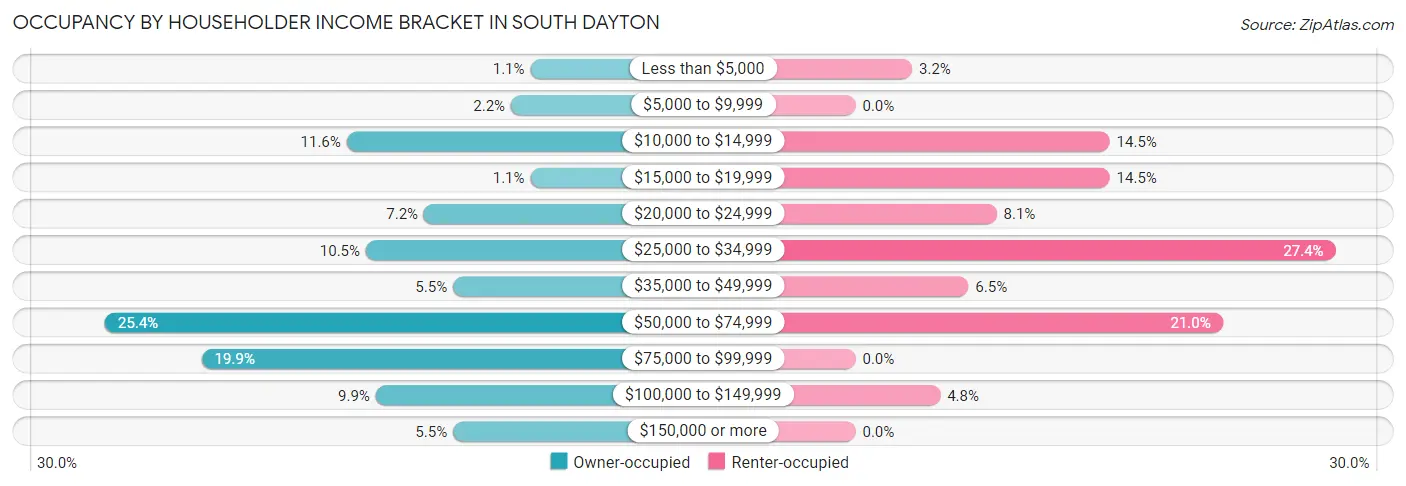
| Income Bracket | Owner-occupied | Renter-occupied |
| Less than $5,000 | 2 (1.1%) | 2 (3.2%) |
| $5,000 to $9,999 | 4 (2.2%) | 0 (0.0%) |
| $10,000 to $14,999 | 21 (11.6%) | 9 (14.5%) |
| $15,000 to $19,999 | 2 (1.1%) | 9 (14.5%) |
| $20,000 to $24,999 | 13 (7.2%) | 5 (8.1%) |
| $25,000 to $34,999 | 19 (10.5%) | 17 (27.4%) |
| $35,000 to $49,999 | 10 (5.5%) | 4 (6.5%) |
| $50,000 to $74,999 | 46 (25.4%) | 13 (21.0%) |
| $75,000 to $99,999 | 36 (19.9%) | 0 (0.0%) |
| $100,000 to $149,999 | 18 (9.9%) | 3 (4.8%) |
| $150,000 or more | 10 (5.5%) | 0 (0.0%) |
| Total | 181 (100.0%) | 62 (100.0%) |
Monthly Housing Cost Tiers in South Dayton
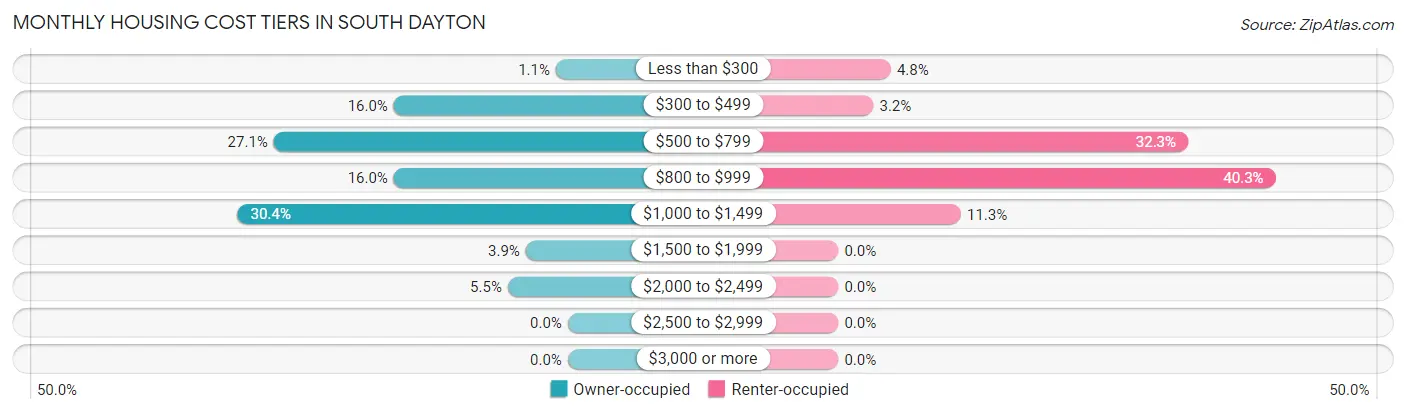
| Monthly Cost | Owner-occupied | Renter-occupied |
| Less than $300 | 2 (1.1%) | 3 (4.8%) |
| $300 to $499 | 29 (16.0%) | 2 (3.2%) |
| $500 to $799 | 49 (27.1%) | 20 (32.3%) |
| $800 to $999 | 29 (16.0%) | 25 (40.3%) |
| $1,000 to $1,499 | 55 (30.4%) | 7 (11.3%) |
| $1,500 to $1,999 | 7 (3.9%) | 0 (0.0%) |
| $2,000 to $2,499 | 10 (5.5%) | 0 (0.0%) |
| $2,500 to $2,999 | 0 (0.0%) | 0 (0.0%) |
| $3,000 or more | 0 (0.0%) | 0 (0.0%) |
| Total | 181 (100.0%) | 62 (100.0%) |
Physical Housing Characteristics in South Dayton
Housing Structures in South Dayton
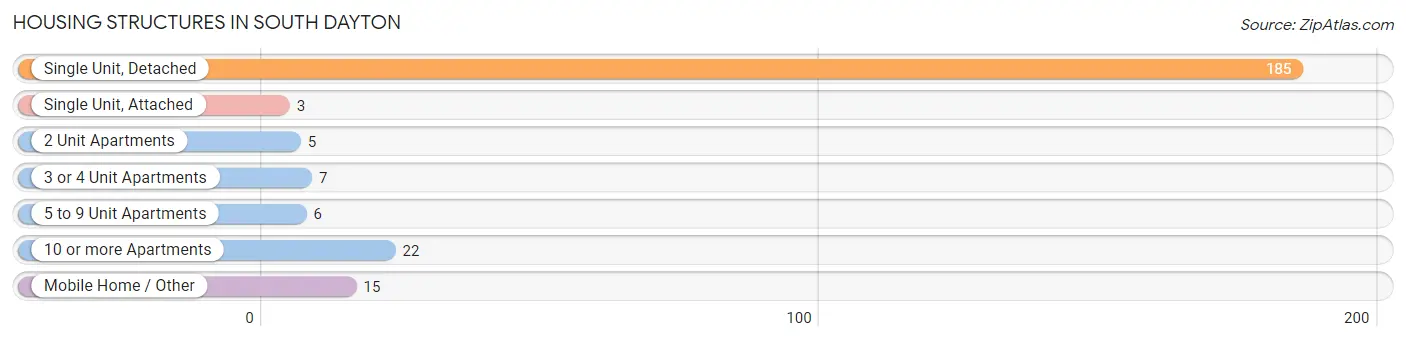
| Structure Type | # Housing Units | % Housing Units |
| Single Unit, Detached | 185 | 76.1% |
| Single Unit, Attached | 3 | 1.2% |
| 2 Unit Apartments | 5 | 2.1% |
| 3 or 4 Unit Apartments | 7 | 2.9% |
| 5 to 9 Unit Apartments | 6 | 2.5% |
| 10 or more Apartments | 22 | 9.0% |
| Mobile Home / Other | 15 | 6.2% |
| Total | 243 | 100.0% |
Housing Structures by Occupancy in South Dayton
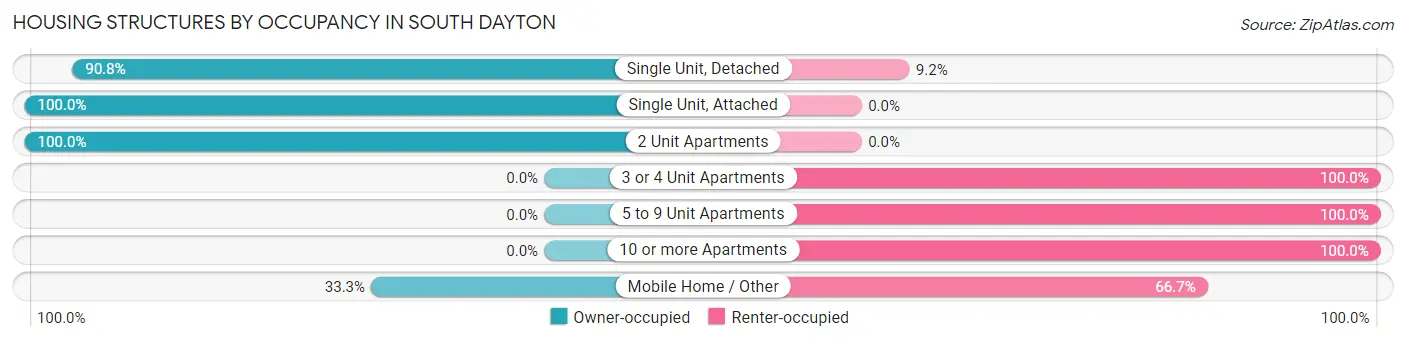
| Structure Type | Owner-occupied | Renter-occupied |
| Single Unit, Detached | 168 (90.8%) | 17 (9.2%) |
| Single Unit, Attached | 3 (100.0%) | 0 (0.0%) |
| 2 Unit Apartments | 5 (100.0%) | 0 (0.0%) |
| 3 or 4 Unit Apartments | 0 (0.0%) | 7 (100.0%) |
| 5 to 9 Unit Apartments | 0 (0.0%) | 6 (100.0%) |
| 10 or more Apartments | 0 (0.0%) | 22 (100.0%) |
| Mobile Home / Other | 5 (33.3%) | 10 (66.7%) |
| Total | 181 (74.5%) | 62 (25.5%) |
Housing Structures by Number of Rooms in South Dayton
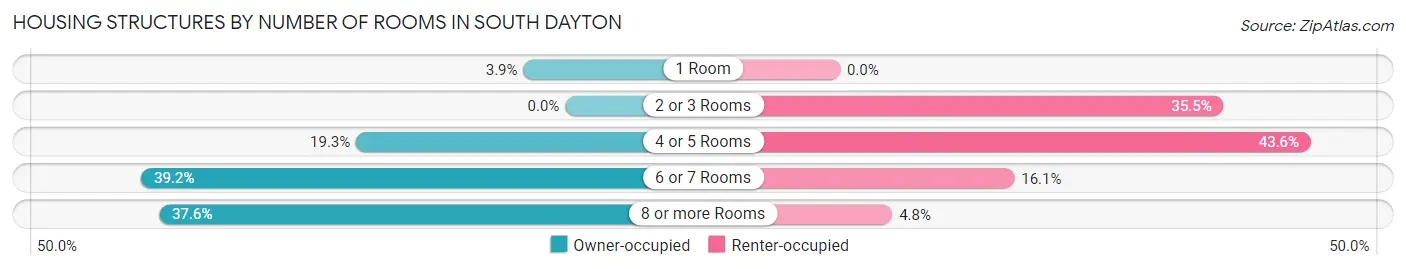
| Number of Rooms | Owner-occupied | Renter-occupied |
| 1 Room | 7 (3.9%) | 0 (0.0%) |
| 2 or 3 Rooms | 0 (0.0%) | 22 (35.5%) |
| 4 or 5 Rooms | 35 (19.3%) | 27 (43.5%) |
| 6 or 7 Rooms | 71 (39.2%) | 10 (16.1%) |
| 8 or more Rooms | 68 (37.6%) | 3 (4.8%) |
| Total | 181 (100.0%) | 62 (100.0%) |
Housing Structure by Heating Type in South Dayton
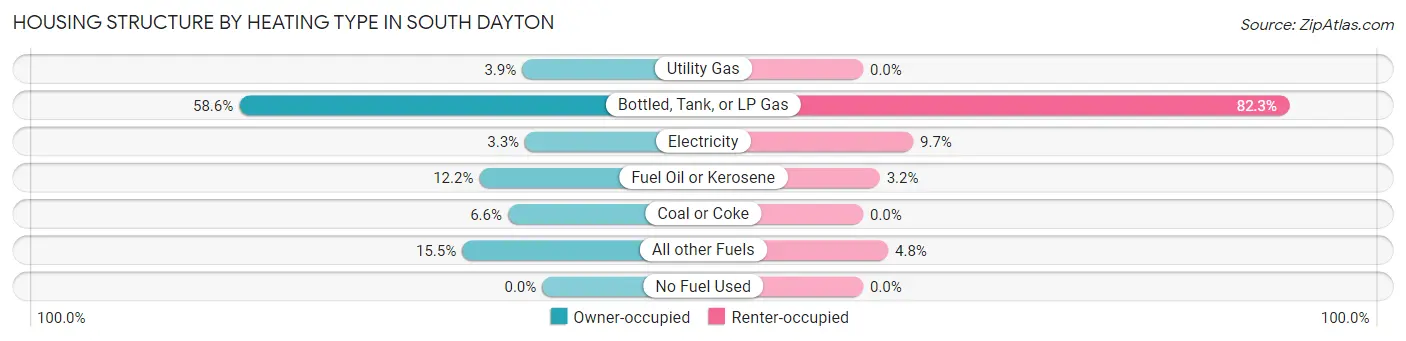
| Heating Type | Owner-occupied | Renter-occupied |
| Utility Gas | 7 (3.9%) | 0 (0.0%) |
| Bottled, Tank, or LP Gas | 106 (58.6%) | 51 (82.3%) |
| Electricity | 6 (3.3%) | 6 (9.7%) |
| Fuel Oil or Kerosene | 22 (12.1%) | 2 (3.2%) |
| Coal or Coke | 12 (6.6%) | 0 (0.0%) |
| All other Fuels | 28 (15.5%) | 3 (4.8%) |
| No Fuel Used | 0 (0.0%) | 0 (0.0%) |
| Total | 181 (100.0%) | 62 (100.0%) |
Household Vehicle Usage in South Dayton
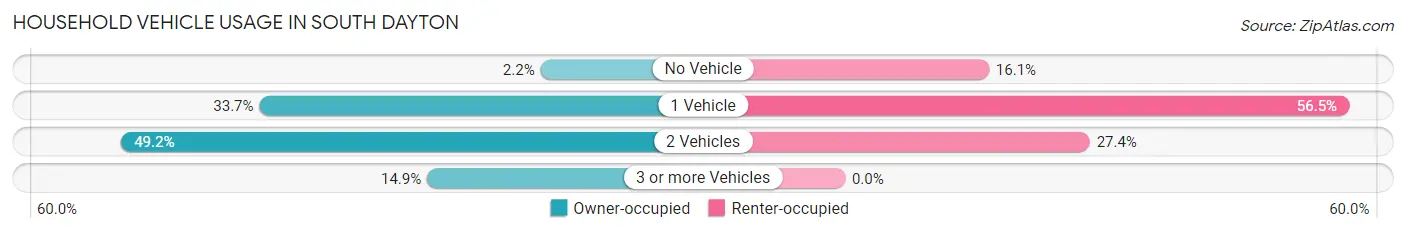
| Vehicles per Household | Owner-occupied | Renter-occupied |
| No Vehicle | 4 (2.2%) | 10 (16.1%) |
| 1 Vehicle | 61 (33.7%) | 35 (56.5%) |
| 2 Vehicles | 89 (49.2%) | 17 (27.4%) |
| 3 or more Vehicles | 27 (14.9%) | 0 (0.0%) |
| Total | 181 (100.0%) | 62 (100.0%) |
Real Estate & Mortgages in South Dayton
Real Estate and Mortgage Overview in South Dayton
| Characteristic | Without Mortgage | With Mortgage |
| Housing Units | 101 | 80 |
| Median Property Value | $61,700 | $85,700 |
| Median Household Income | $59,688 | $6 |
| Monthly Housing Costs | $650 | $0 |
| Real Estate Taxes | $2,439 | $7 |
Property Value by Mortgage Status in South Dayton
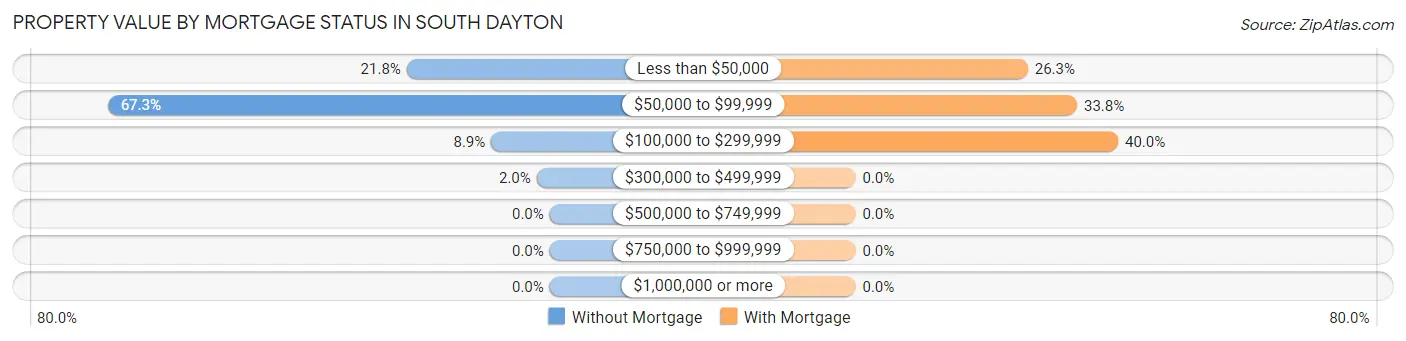
| Property Value | Without Mortgage | With Mortgage |
| Less than $50,000 | 22 (21.8%) | 21 (26.3%) |
| $50,000 to $99,999 | 68 (67.3%) | 27 (33.8%) |
| $100,000 to $299,999 | 9 (8.9%) | 32 (40.0%) |
| $300,000 to $499,999 | 2 (2.0%) | 0 (0.0%) |
| $500,000 to $749,999 | 0 (0.0%) | 0 (0.0%) |
| $750,000 to $999,999 | 0 (0.0%) | 0 (0.0%) |
| $1,000,000 or more | 0 (0.0%) | 0 (0.0%) |
| Total | 101 (100.0%) | 80 (100.0%) |
Household Income by Mortgage Status in South Dayton
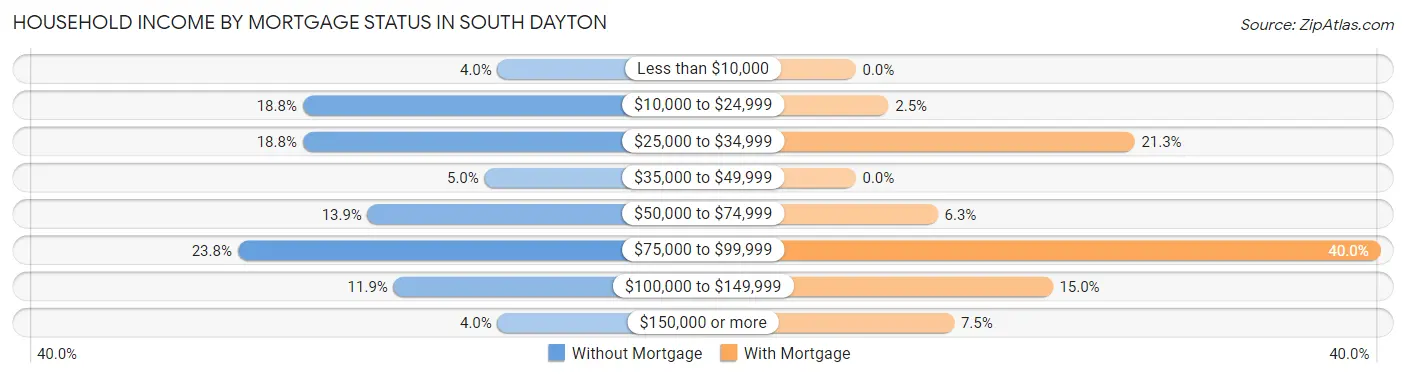
| Household Income | Without Mortgage | With Mortgage |
| Less than $10,000 | 4 (4.0%) | 0 (0.0%) |
| $10,000 to $24,999 | 19 (18.8%) | 2 (2.5%) |
| $25,000 to $34,999 | 19 (18.8%) | 17 (21.2%) |
| $35,000 to $49,999 | 5 (5.0%) | 0 (0.0%) |
| $50,000 to $74,999 | 14 (13.9%) | 5 (6.2%) |
| $75,000 to $99,999 | 24 (23.8%) | 32 (40.0%) |
| $100,000 to $149,999 | 12 (11.9%) | 12 (15.0%) |
| $150,000 or more | 4 (4.0%) | 6 (7.5%) |
| Total | 101 (100.0%) | 80 (100.0%) |
Property Value to Household Income Ratio in South Dayton
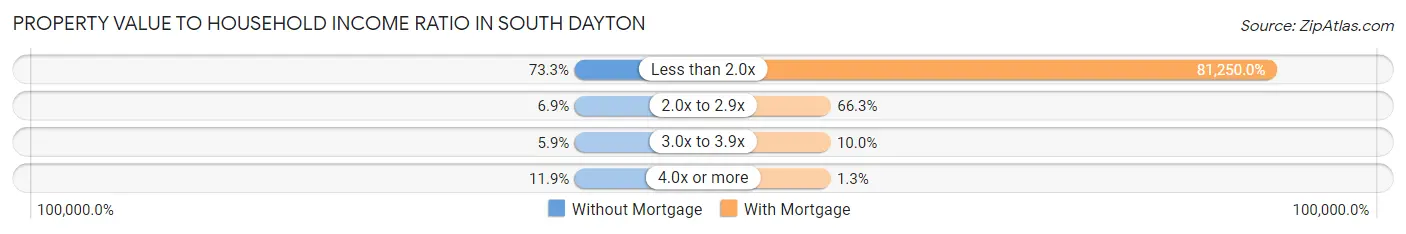
| Value-to-Income Ratio | Without Mortgage | With Mortgage |
| Less than 2.0x | 74 (73.3%) | 65,000 (81,250.0%) |
| 2.0x to 2.9x | 7 (6.9%) | 53 (66.2%) |
| 3.0x to 3.9x | 6 (5.9%) | 8 (10.0%) |
| 4.0x or more | 12 (11.9%) | 1 (1.3%) |
| Total | 101 (100.0%) | 80 (100.0%) |
Real Estate Taxes by Mortgage Status in South Dayton
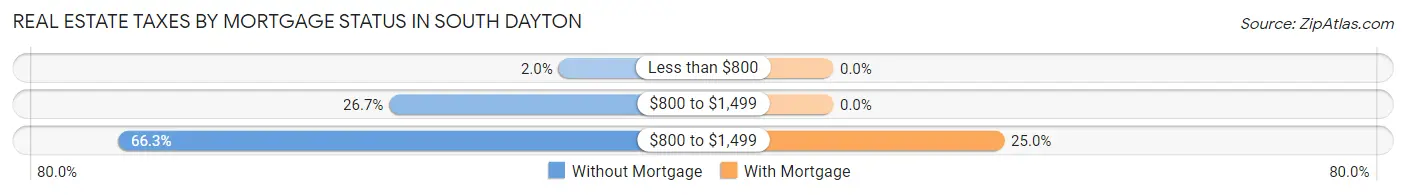
| Property Taxes | Without Mortgage | With Mortgage |
| Less than $800 | 2 (2.0%) | 0 (0.0%) |
| $800 to $1,499 | 27 (26.7%) | 0 (0.0%) |
| $800 to $1,499 | 67 (66.3%) | 20 (25.0%) |
| Total | 101 (100.0%) | 80 (100.0%) |
Health & Disability in South Dayton
Health Insurance Coverage by Age in South Dayton
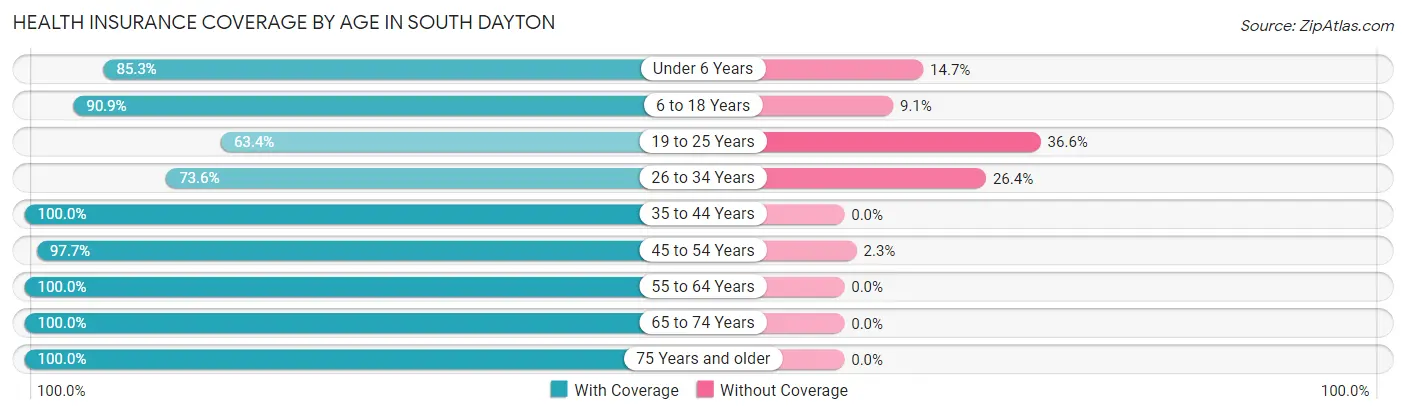
| Age Bracket | With Coverage | Without Coverage |
| Under 6 Years | 29 (85.3%) | 5 (14.7%) |
| 6 to 18 Years | 120 (90.9%) | 12 (9.1%) |
| 19 to 25 Years | 45 (63.4%) | 26 (36.6%) |
| 26 to 34 Years | 39 (73.6%) | 14 (26.4%) |
| 35 to 44 Years | 64 (100.0%) | 0 (0.0%) |
| 45 to 54 Years | 85 (97.7%) | 2 (2.3%) |
| 55 to 64 Years | 80 (100.0%) | 0 (0.0%) |
| 65 to 74 Years | 54 (100.0%) | 0 (0.0%) |
| 75 Years and older | 31 (100.0%) | 0 (0.0%) |
| Total | 547 (90.3%) | 59 (9.7%) |
Health Insurance Coverage by Citizenship Status in South Dayton
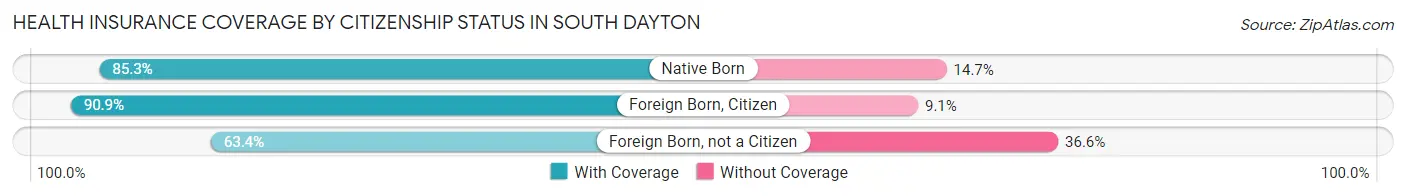
| Citizenship Status | With Coverage | Without Coverage |
| Native Born | 29 (85.3%) | 5 (14.7%) |
| Foreign Born, Citizen | 120 (90.9%) | 12 (9.1%) |
| Foreign Born, not a Citizen | 45 (63.4%) | 26 (36.6%) |
Health Insurance Coverage by Household Income in South Dayton
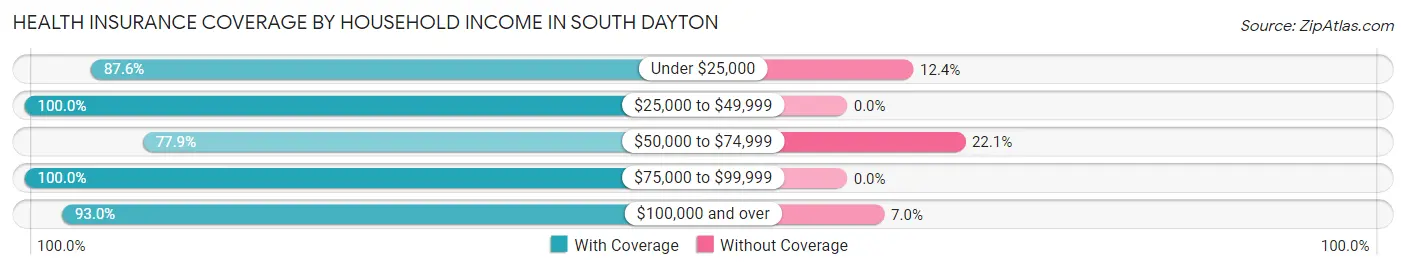
| Household Income | With Coverage | Without Coverage |
| Under $25,000 | 148 (87.6%) | 21 (12.4%) |
| $25,000 to $49,999 | 123 (100.0%) | 0 (0.0%) |
| $50,000 to $74,999 | 109 (77.9%) | 31 (22.1%) |
| $75,000 to $99,999 | 74 (100.0%) | 0 (0.0%) |
| $100,000 and over | 93 (93.0%) | 7 (7.0%) |
Public vs Private Health Insurance Coverage by Age in South Dayton
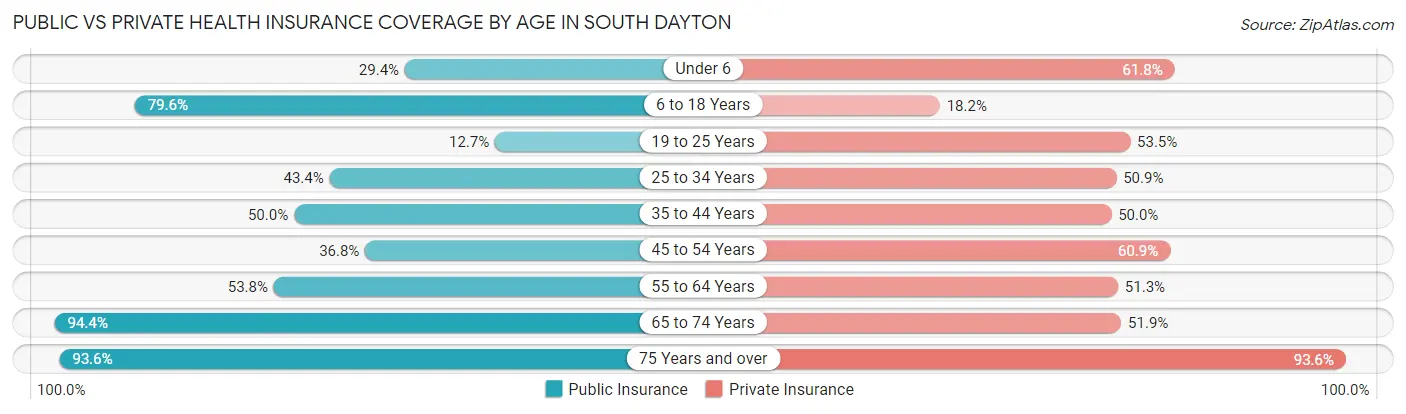
| Age Bracket | Public Insurance | Private Insurance |
| Under 6 | 10 (29.4%) | 21 (61.8%) |
| 6 to 18 Years | 105 (79.5%) | 24 (18.2%) |
| 19 to 25 Years | 9 (12.7%) | 38 (53.5%) |
| 25 to 34 Years | 23 (43.4%) | 27 (50.9%) |
| 35 to 44 Years | 32 (50.0%) | 32 (50.0%) |
| 45 to 54 Years | 32 (36.8%) | 53 (60.9%) |
| 55 to 64 Years | 43 (53.7%) | 41 (51.2%) |
| 65 to 74 Years | 51 (94.4%) | 28 (51.8%) |
| 75 Years and over | 29 (93.5%) | 29 (93.5%) |
| Total | 334 (55.1%) | 293 (48.3%) |
Disability Status by Sex by Age in South Dayton
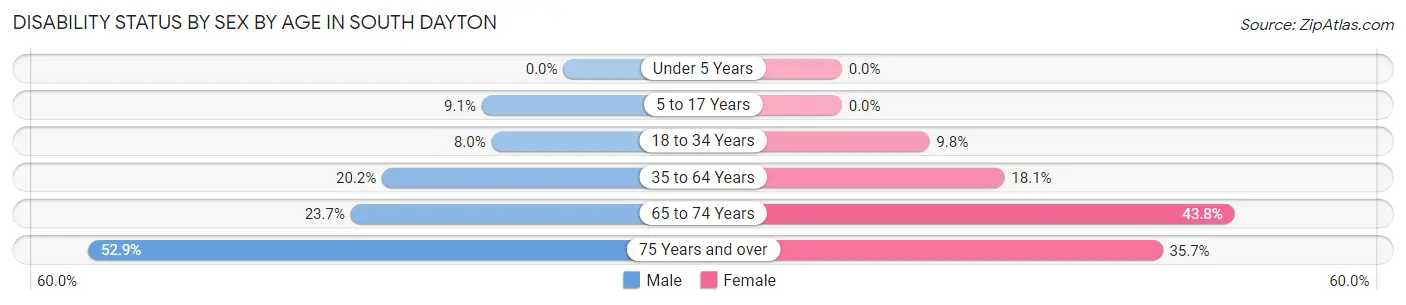
| Age Bracket | Male | Female |
| Under 5 Years | 0 (0.0%) | 0 (0.0%) |
| 5 to 17 Years | 8 (9.1%) | 0 (0.0%) |
| 18 to 34 Years | 4 (8.0%) | 8 (9.8%) |
| 35 to 64 Years | 21 (20.2%) | 23 (18.1%) |
| 65 to 74 Years | 9 (23.7%) | 7 (43.8%) |
| 75 Years and over | 9 (52.9%) | 5 (35.7%) |
Disability Class by Sex by Age in South Dayton
Disability Class: Hearing Difficulty
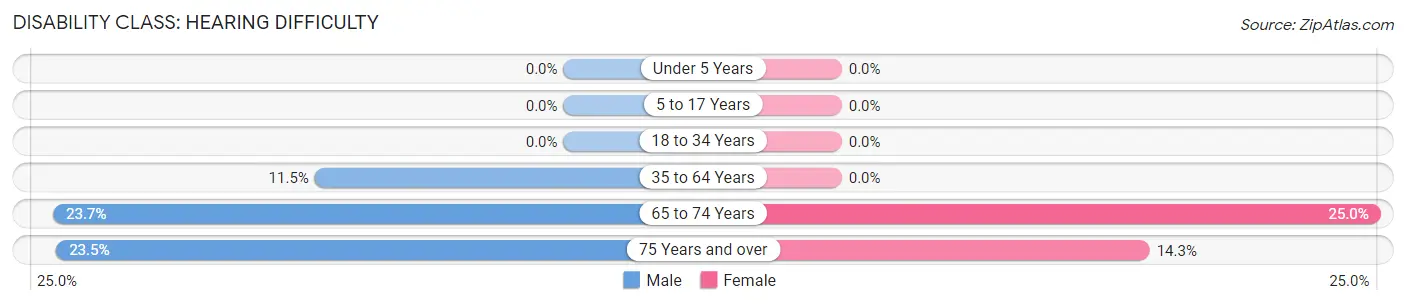
| Age Bracket | Male | Female |
| Under 5 Years | 0 (0.0%) | 0 (0.0%) |
| 5 to 17 Years | 0 (0.0%) | 0 (0.0%) |
| 18 to 34 Years | 0 (0.0%) | 0 (0.0%) |
| 35 to 64 Years | 12 (11.5%) | 0 (0.0%) |
| 65 to 74 Years | 9 (23.7%) | 4 (25.0%) |
| 75 Years and over | 4 (23.5%) | 2 (14.3%) |
Disability Class: Vision Difficulty
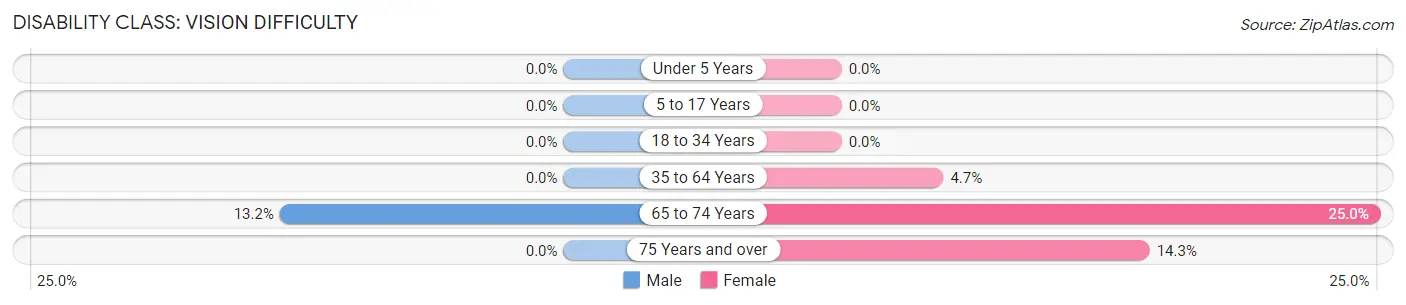
| Age Bracket | Male | Female |
| Under 5 Years | 0 (0.0%) | 0 (0.0%) |
| 5 to 17 Years | 0 (0.0%) | 0 (0.0%) |
| 18 to 34 Years | 0 (0.0%) | 0 (0.0%) |
| 35 to 64 Years | 0 (0.0%) | 6 (4.7%) |
| 65 to 74 Years | 5 (13.2%) | 4 (25.0%) |
| 75 Years and over | 0 (0.0%) | 2 (14.3%) |
Disability Class: Cognitive Difficulty
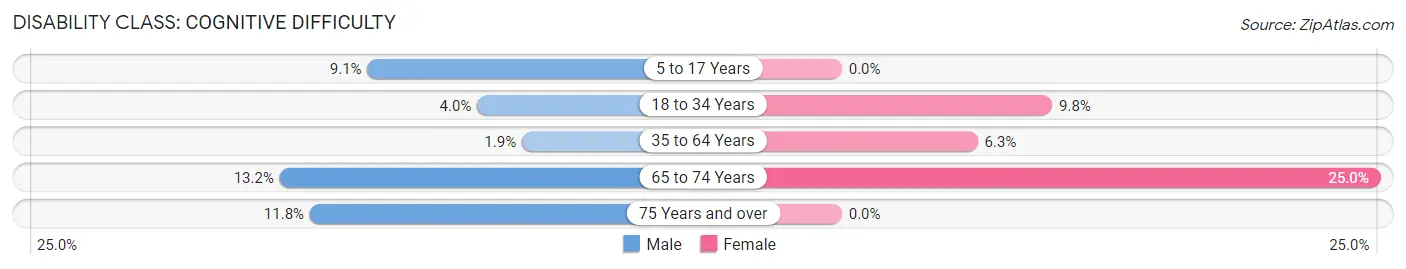
| Age Bracket | Male | Female |
| 5 to 17 Years | 8 (9.1%) | 0 (0.0%) |
| 18 to 34 Years | 2 (4.0%) | 8 (9.8%) |
| 35 to 64 Years | 2 (1.9%) | 8 (6.3%) |
| 65 to 74 Years | 5 (13.2%) | 4 (25.0%) |
| 75 Years and over | 2 (11.8%) | 0 (0.0%) |
Disability Class: Ambulatory Difficulty
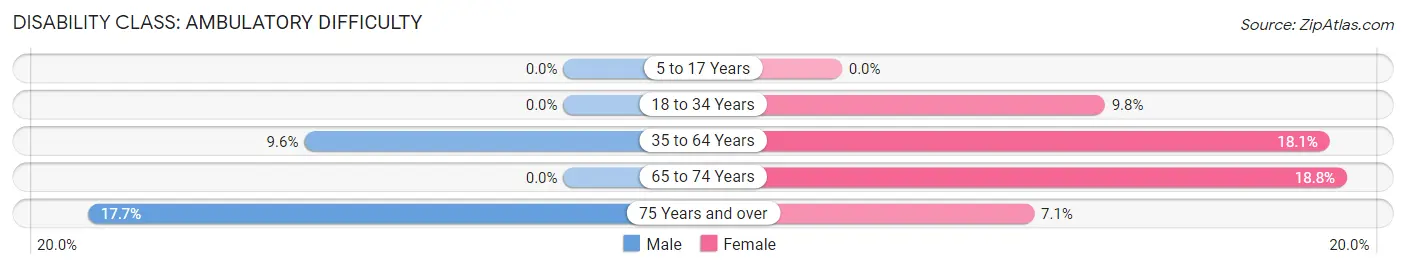
| Age Bracket | Male | Female |
| 5 to 17 Years | 0 (0.0%) | 0 (0.0%) |
| 18 to 34 Years | 0 (0.0%) | 8 (9.8%) |
| 35 to 64 Years | 10 (9.6%) | 23 (18.1%) |
| 65 to 74 Years | 0 (0.0%) | 3 (18.8%) |
| 75 Years and over | 3 (17.6%) | 1 (7.1%) |
Disability Class: Self-Care Difficulty
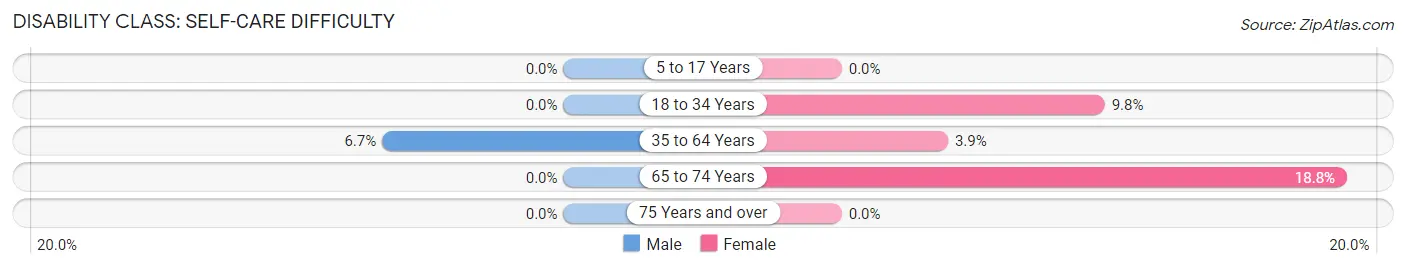
| Age Bracket | Male | Female |
| 5 to 17 Years | 0 (0.0%) | 0 (0.0%) |
| 18 to 34 Years | 0 (0.0%) | 8 (9.8%) |
| 35 to 64 Years | 7 (6.7%) | 5 (3.9%) |
| 65 to 74 Years | 0 (0.0%) | 3 (18.8%) |
| 75 Years and over | 0 (0.0%) | 0 (0.0%) |
Technology Access in South Dayton
Computing Device Access in South Dayton
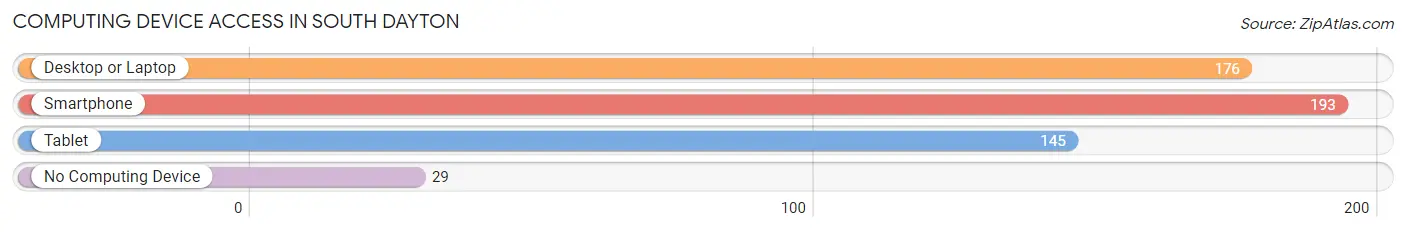
| Device Type | # Households | % Households |
| Desktop or Laptop | 176 | 72.4% |
| Smartphone | 193 | 79.4% |
| Tablet | 145 | 59.7% |
| No Computing Device | 29 | 11.9% |
| Total | 243 | 100.0% |
Internet Access in South Dayton
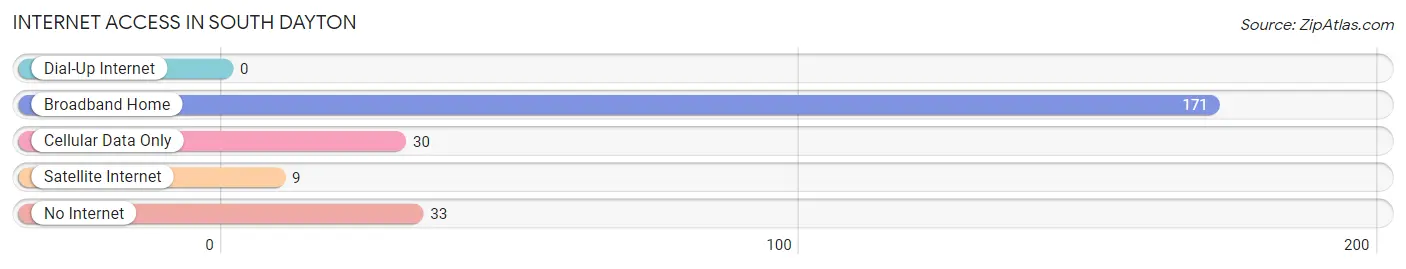
| Internet Type | # Households | % Households |
| Dial-Up Internet | 0 | 0.0% |
| Broadband Home | 171 | 70.4% |
| Cellular Data Only | 30 | 12.3% |
| Satellite Internet | 9 | 3.7% |
| No Internet | 33 | 13.6% |
| Total | 243 | 100.0% |
South Dayton Summary
South Dayton is a small village located in the town of Dayton, Cattaraugus County, New York. It is situated on the south bank of the Cattaraugus Creek, approximately 25 miles south of Buffalo. The village has a population of approximately 1,000 people and is part of the Buffalo-Niagara Falls metropolitan area.
History
The area that is now South Dayton was first settled in 1812 by a group of settlers from Connecticut. The village was originally known as “Daytonville” and was incorporated in 1848. The village was named after William Dayton, a prominent local landowner.
The village grew rapidly in the late 19th century, with the construction of the Buffalo and Southwestern Railroad in 1881. This allowed for the transportation of goods and people to and from the village. The railroad also allowed for the development of the village’s first industries, including a sawmill, a grist mill, and a tannery.
In the early 20th century, the village experienced a period of growth and prosperity. The population increased from 1,000 in 1900 to 1,500 in 1910. The village also saw the construction of several new businesses, including a hotel, a bank, and a movie theater.
Geography
South Dayton is located in the southwestern corner of Cattaraugus County, approximately 25 miles south of Buffalo. The village is situated on the south bank of the Cattaraugus Creek, which flows through the village. The village is surrounded by rolling hills and farmland.
The village has a total area of 0.7 square miles, all of which is land. The village is located in the humid continental climate zone, with cold winters and warm summers. The average annual temperature is 48°F, and the average annual precipitation is 37 inches.
Economy
The economy of South Dayton is largely based on agriculture and tourism. The village is home to several farms, which produce a variety of crops, including corn, soybeans, and hay. The village also has several small businesses, including a grocery store, a hardware store, and a restaurant.
The village is also a popular tourist destination, with several attractions, including the Cattaraugus Creek, the South Dayton Historical Society Museum, and the South Dayton Country Club. The village also hosts several annual events, including the South Dayton Summer Festival and the South Dayton Fall Festival.
Demographics
As of the 2010 census, the population of South Dayton was 1,000. The racial makeup of the village was 97.2% White, 0.7% African American, 0.3% Native American, 0.3% Asian, and 1.5% from other races. The median household income was $41,250, and the median family income was $50,000.
The village has a high rate of homeownership, with approximately 75% of the population owning their own homes. The village also has a high rate of educational attainment, with approximately 90% of the population having at least a high school diploma.
Conclusion
South Dayton is a small village located in the town of Dayton, Cattaraugus County, New York. It is situated on the south bank of the Cattaraugus Creek, approximately 25 miles south of Buffalo. The village has a population of approximately 1,000 people and is part of the Buffalo-Niagara Falls metropolitan area. The village has a long history, and its economy is largely based on agriculture and tourism. The village has a high rate of homeownership and educational attainment, and it is a popular tourist destination.
Common Questions
What is Per Capita Income in South Dayton?
Per Capita income in South Dayton is $22,914.
What is the Median Family Income in South Dayton?
Median Family Income in South Dayton is $58,333.
What is the Median Household income in South Dayton?
Median Household Income in South Dayton is $54,583.
What is Income or Wage Gap in South Dayton?
Income or Wage Gap in South Dayton is 50.1%.
Women in South Dayton earn 49.9 cents for every dollar earned by a man.
What is Family Income Deficit in South Dayton?
Family Income Deficit in South Dayton is $15,190.
Families that are below poverty line in South Dayton earn $15,190 less on average than the poverty threshold level.
What is Inequality or Gini Index in South Dayton?
Inequality or Gini Index in South Dayton is 0.40.
What is the Total Population of South Dayton?
Total Population of South Dayton is 606.
What is the Total Male Population of South Dayton?
Total Male Population of South Dayton is 303.
What is the Total Female Population of South Dayton?
Total Female Population of South Dayton is 303.
What is the Ratio of Males per 100 Females in South Dayton?
There are 100.00 Males per 100 Females in South Dayton.
What is the Ratio of Females per 100 Males in South Dayton?
There are 100.00 Females per 100 Males in South Dayton.
What is the Median Population Age in South Dayton?
Median Population Age in South Dayton is 37.2 Years.
What is the Average Family Size in South Dayton
Average Family Size in South Dayton is 3.0 People.
What is the Average Household Size in South Dayton
Average Household Size in South Dayton is 2.5 People.
How Large is the Labor Force in South Dayton?
There are 258 People in the Labor Forcein in South Dayton.
What is the Percentage of People in the Labor Force in South Dayton?
55.1% of People are in the Labor Force in South Dayton.
What is the Unemployment Rate in South Dayton?
Unemployment Rate in South Dayton is 1.6%.