Sloan, NY Map & Demographics
Sloan Map
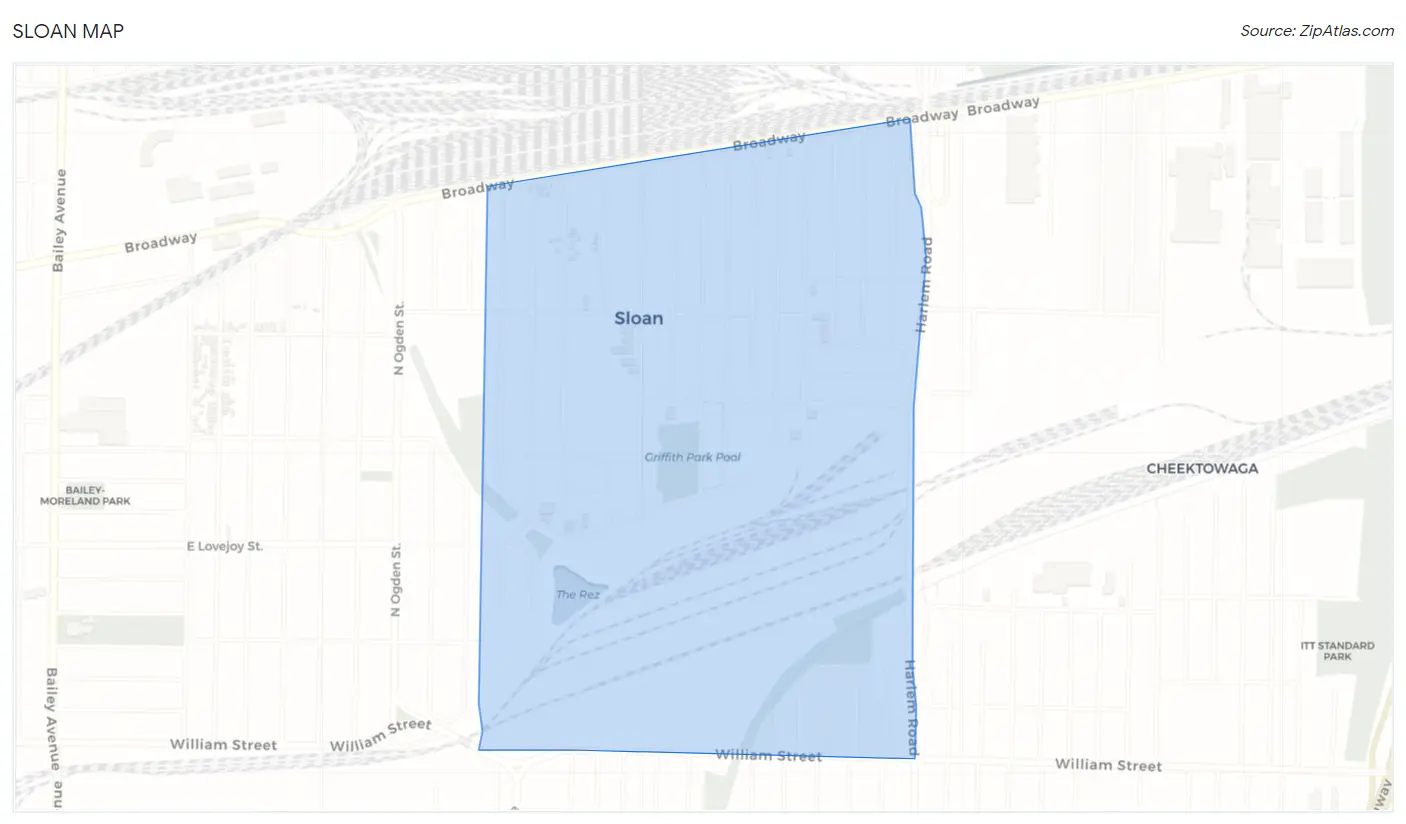
Sloan Overview
$33,817
PER CAPITA INCOME
$67,373
AVG FAMILY INCOME
$65,717
AVG HOUSEHOLD INCOME
2.4%
WAGE / INCOME GAP [ % ]
97.6¢/ $1
WAGE / INCOME GAP [ $ ]
0.43
INEQUALITY / GINI INDEX
3,762
TOTAL POPULATION
1,917
MALE POPULATION
1,845
FEMALE POPULATION
103.90
MALES / 100 FEMALES
96.24
FEMALES / 100 MALES
43.1
MEDIAN AGE
2.7
AVG FAMILY SIZE
2.3
AVG HOUSEHOLD SIZE
1,914
LABOR FORCE [ PEOPLE ]
60.2%
PERCENT IN LABOR FORCE
3.2%
UNEMPLOYMENT RATE
Sloan Area Codes
Income in Sloan
Income Overview in Sloan
Per Capita Income in Sloan is $33,817, while median incomes of families and households are $67,373 and $65,717 respectively.
| Characteristic | Number | Measure |
| Per Capita Income | 3,762 | $33,817 |
| Median Family Income | 1,021 | $67,373 |
| Mean Family Income | 1,021 | $86,819 |
| Median Household Income | 1,667 | $65,717 |
| Mean Household Income | 1,667 | $75,169 |
| Income Deficit | 1,021 | $0 |
| Wage / Income Gap (%) | 3,762 | 2.40% |
| Wage / Income Gap ($) | 3,762 | 97.60¢ per $1 |
| Gini / Inequality Index | 3,762 | 0.43 |
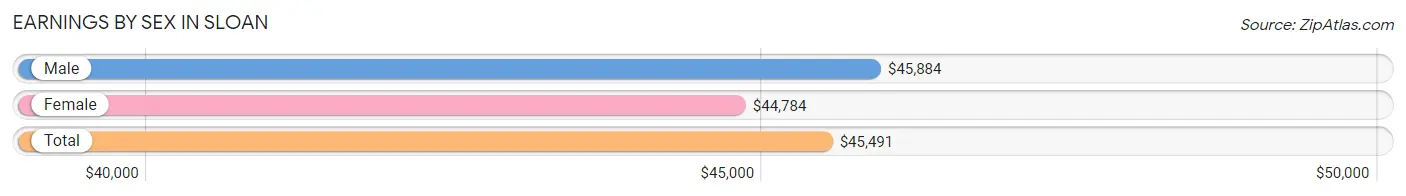
Earnings by Sex in Sloan
Average Earnings in Sloan are $45,491, $45,884 for men and $44,784 for women, a difference of 2.4%.
| Sex | Number | Average Earnings |
| Male | 1,076 (54.9%) | $45,884 |
| Female | 885 (45.1%) | $44,784 |
| Total | 1,961 (100.0%) | $45,491 |
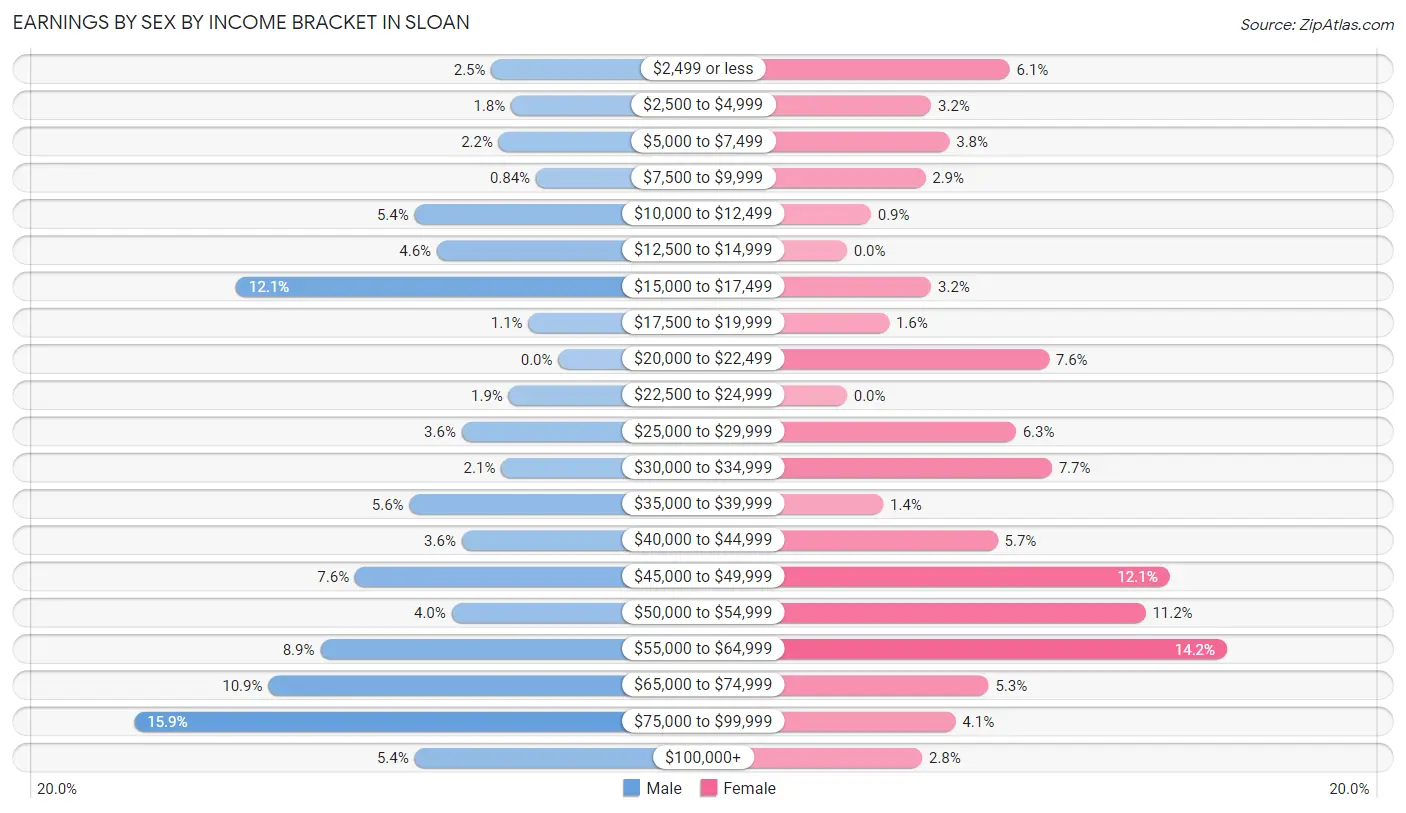
Earnings by Sex by Income Bracket in Sloan
The most common earnings brackets in Sloan are $75,000 to $99,999 for men (171 | 15.9%) and $55,000 to $64,999 for women (126 | 14.2%).
| Income | Male | Female |
| $2,499 or less | 27 (2.5%) | 54 (6.1%) |
| $2,500 to $4,999 | 19 (1.8%) | 28 (3.2%) |
| $5,000 to $7,499 | 24 (2.2%) | 34 (3.8%) |
| $7,500 to $9,999 | 9 (0.8%) | 26 (2.9%) |
| $10,000 to $12,499 | 58 (5.4%) | 8 (0.9%) |
| $12,500 to $14,999 | 49 (4.5%) | 0 (0.0%) |
| $15,000 to $17,499 | 130 (12.1%) | 28 (3.2%) |
| $17,500 to $19,999 | 12 (1.1%) | 14 (1.6%) |
| $20,000 to $22,499 | 0 (0.0%) | 67 (7.6%) |
| $22,500 to $24,999 | 20 (1.9%) | 0 (0.0%) |
| $25,000 to $29,999 | 39 (3.6%) | 56 (6.3%) |
| $30,000 to $34,999 | 23 (2.1%) | 68 (7.7%) |
| $35,000 to $39,999 | 60 (5.6%) | 12 (1.4%) |
| $40,000 to $44,999 | 39 (3.6%) | 50 (5.7%) |
| $45,000 to $49,999 | 82 (7.6%) | 107 (12.1%) |
| $50,000 to $54,999 | 43 (4.0%) | 99 (11.2%) |
| $55,000 to $64,999 | 96 (8.9%) | 126 (14.2%) |
| $65,000 to $74,999 | 117 (10.9%) | 47 (5.3%) |
| $75,000 to $99,999 | 171 (15.9%) | 36 (4.1%) |
| $100,000+ | 58 (5.4%) | 25 (2.8%) |
| Total | 1,076 (100.0%) | 885 (100.0%) |
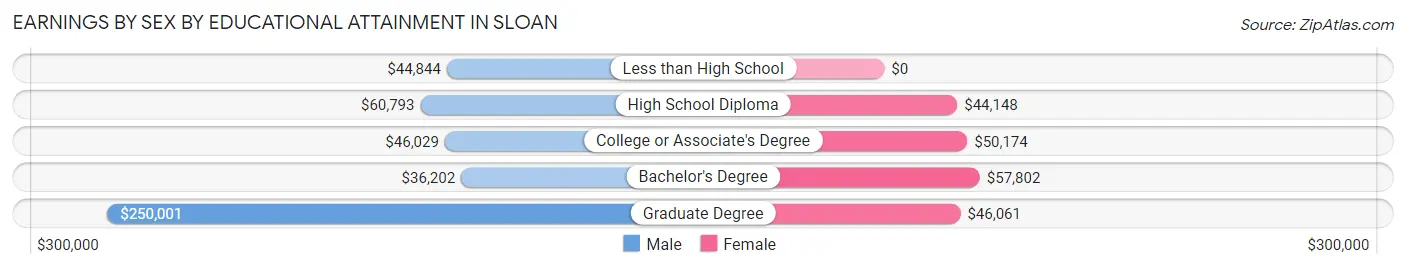
Earnings by Sex by Educational Attainment in Sloan
Average earnings in Sloan are $47,278 for men and $46,722 for women, a difference of 1.2%. Men with an educational attainment of graduate degree enjoy the highest average annual earnings of $250,001, while those with bachelor's degree education earn the least with $36,202. Women with an educational attainment of bachelor's degree earn the most with the average annual earnings of $57,802, while those with high school diploma education have the smallest earnings of $44,148.
| Educational Attainment | Male Income | Female Income |
| Less than High School | $44,844 | $0 |
| High School Diploma | $60,793 | $44,148 |
| College or Associate's Degree | $46,029 | $50,174 |
| Bachelor's Degree | $36,202 | $57,802 |
| Graduate Degree | $250,001 | $46,061 |
| Total | $47,278 | $46,722 |
Family Income in Sloan
Family Income Brackets in Sloan
According to the Sloan family income data, there are 260 families falling into the $50,000 to $74,999 income range, which is the most common income bracket and makes up 25.5% of all families. Conversely, the $15,000 to $24,999 income bracket is the least frequent group with only 30 families (2.9%) belonging to this category.
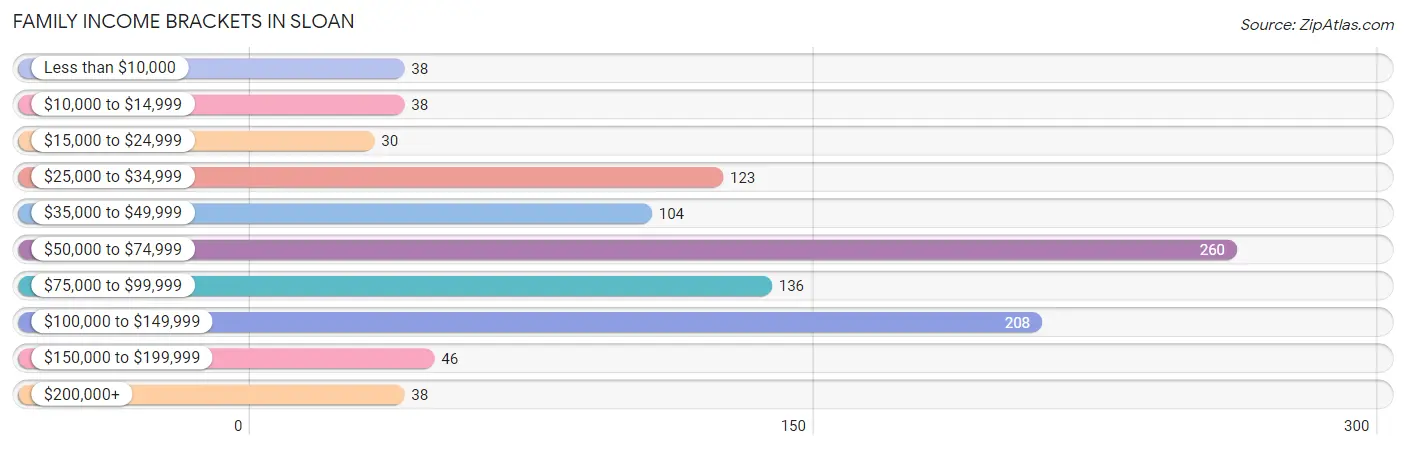
| Income Bracket | # Families | % Families |
| Less than $10,000 | 38 | 3.7% |
| $10,000 to $14,999 | 38 | 3.7% |
| $15,000 to $24,999 | 30 | 2.9% |
| $25,000 to $34,999 | 123 | 12.0% |
| $35,000 to $49,999 | 104 | 10.2% |
| $50,000 to $74,999 | 260 | 25.5% |
| $75,000 to $99,999 | 136 | 13.3% |
| $100,000 to $149,999 | 208 | 20.4% |
| $150,000 to $199,999 | 46 | 4.5% |
| $200,000+ | 38 | 3.7% |
Family Income by Famaliy Size in Sloan
4-person families (176 | 17.2%) account for the highest median family income in Sloan with $90,577 per family, while 2-person families (598 | 58.6%) have the highest median income of $31,098 per family member.
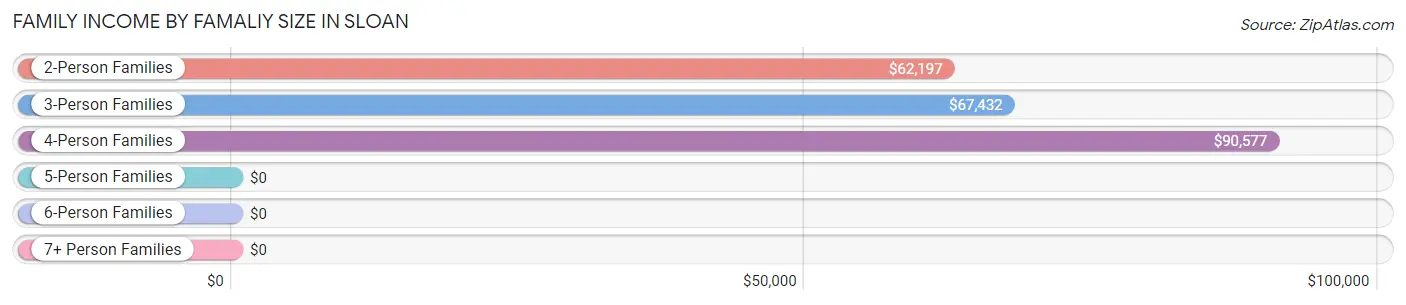
| Income Bracket | # Families | Median Income |
| 2-Person Families | 598 (58.6%) | $62,197 |
| 3-Person Families | 184 (18.0%) | $67,432 |
| 4-Person Families | 176 (17.2%) | $90,577 |
| 5-Person Families | 51 (5.0%) | $0 |
| 6-Person Families | 0 (0.0%) | $0 |
| 7+ Person Families | 12 (1.2%) | $0 |
| Total | 1,021 (100.0%) | $67,373 |
Family Income by Number of Earners in Sloan
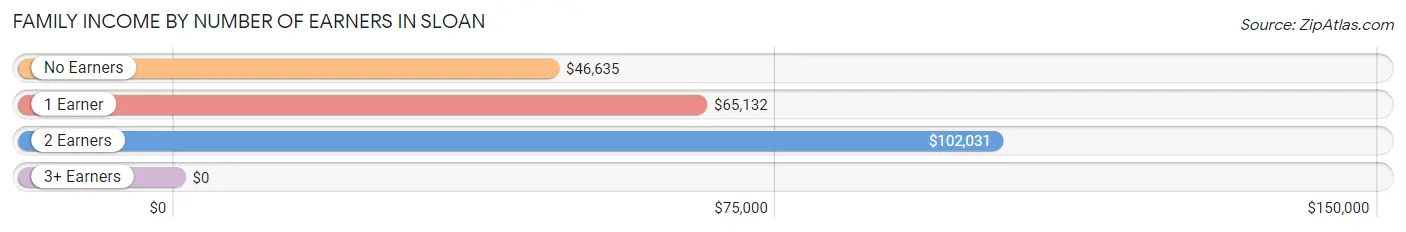
| Number of Earners | # Families | Median Income |
| No Earners | 161 (15.8%) | $46,635 |
| 1 Earner | 470 (46.0%) | $65,132 |
| 2 Earners | 315 (30.8%) | $102,031 |
| 3+ Earners | 75 (7.3%) | $0 |
| Total | 1,021 (100.0%) | $67,373 |
Household Income in Sloan
Household Income Brackets in Sloan
With 352 households falling in the category, the $50,000 to $74,999 income range is the most frequent in Sloan, accounting for 21.1% of all households. In contrast, only 38 households (2.3%) fall into the $200,000+ income bracket, making it the least populous group.
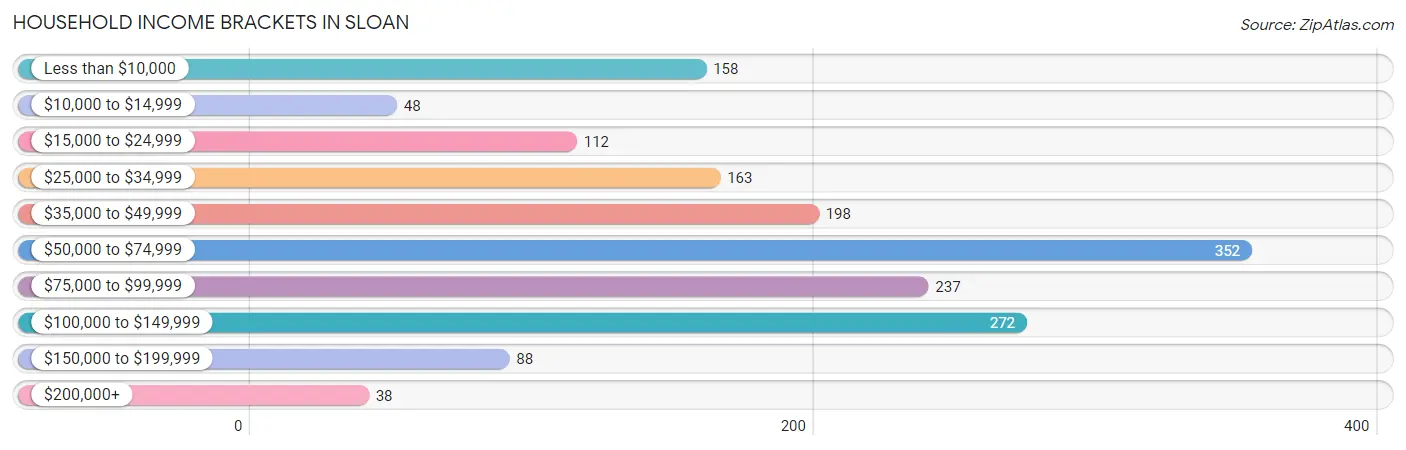
| Income Bracket | # Households | % Households |
| Less than $10,000 | 158 | 9.5% |
| $10,000 to $14,999 | 48 | 2.9% |
| $15,000 to $24,999 | 112 | 6.7% |
| $25,000 to $34,999 | 163 | 9.8% |
| $35,000 to $49,999 | 198 | 11.9% |
| $50,000 to $74,999 | 352 | 21.1% |
| $75,000 to $99,999 | 237 | 14.2% |
| $100,000 to $149,999 | 272 | 16.3% |
| $150,000 to $199,999 | 88 | 5.3% |
| $200,000+ | 38 | 2.3% |
Household Income by Householder Age in Sloan
The median household income in Sloan is $65,717, with the highest median household income of $67,838 found in the 25 to 44 years age bracket for the primary householder. A total of 510 households (30.6%) fall into this category. Meanwhile, the 15 to 24 years age bracket for the primary householder has the lowest median household income of $0, with 57 households (3.4%) in this group.
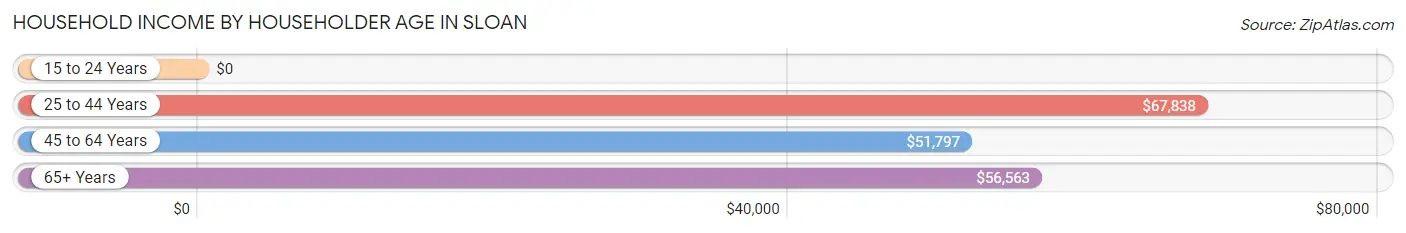
| Income Bracket | # Households | Median Income |
| 15 to 24 Years | 57 (3.4%) | $0 |
| 25 to 44 Years | 510 (30.6%) | $67,838 |
| 45 to 64 Years | 749 (44.9%) | $51,797 |
| 65+ Years | 351 (21.1%) | $56,563 |
| Total | 1,667 (100.0%) | $65,717 |
Poverty in Sloan
Income Below Poverty by Sex and Age in Sloan
With 11.4% poverty level for males and 18.5% for females among the residents of Sloan, 5 year old males and 6 to 11 year old females are the most vulnerable to poverty, with 17 males (50.0%) and 80 females (44.0%) in their respective age groups living below the poverty level.
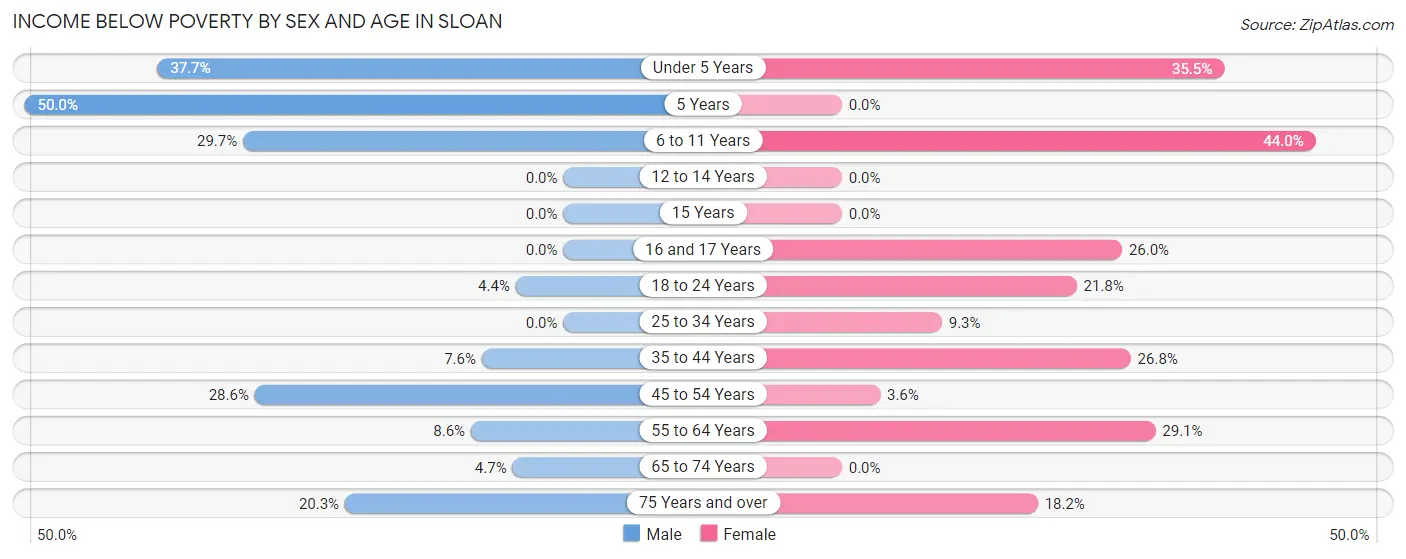
| Age Bracket | Male | Female |
| Under 5 Years | 26 (37.7%) | 33 (35.5%) |
| 5 Years | 17 (50.0%) | 0 (0.0%) |
| 6 to 11 Years | 22 (29.7%) | 80 (44.0%) |
| 12 to 14 Years | 0 (0.0%) | 0 (0.0%) |
| 15 Years | 0 (0.0%) | 0 (0.0%) |
| 16 and 17 Years | 0 (0.0%) | 13 (26.0%) |
| 18 to 24 Years | 10 (4.4%) | 17 (21.8%) |
| 25 to 34 Years | 0 (0.0%) | 18 (9.3%) |
| 35 to 44 Years | 23 (7.6%) | 63 (26.8%) |
| 45 to 54 Years | 63 (28.6%) | 12 (3.5%) |
| 55 to 64 Years | 29 (8.6%) | 94 (29.1%) |
| 65 to 74 Years | 11 (4.7%) | 0 (0.0%) |
| 75 Years and over | 15 (20.3%) | 12 (18.2%) |
| Total | 216 (11.4%) | 342 (18.5%) |
Income Above Poverty by Sex and Age in Sloan
According to the poverty statistics in Sloan, males aged 12 to 14 years and females aged 12 to 14 years are the age groups that are most secure financially, with 100.0% of males and 100.0% of females in these age groups living above the poverty line.
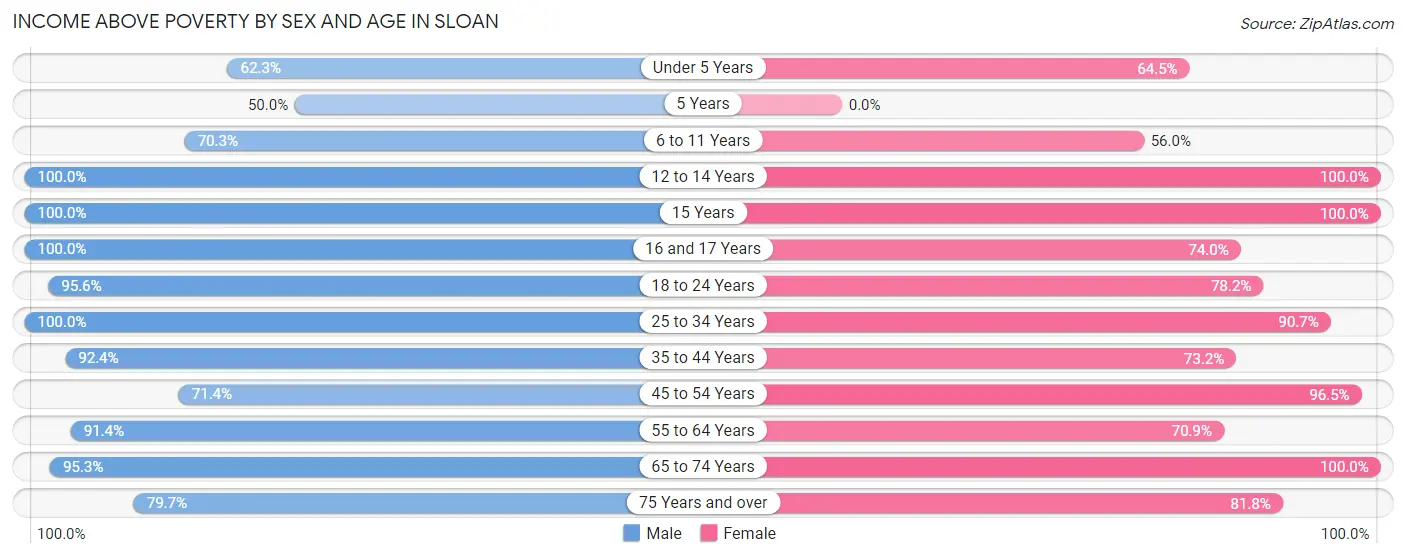
| Age Bracket | Male | Female |
| Under 5 Years | 43 (62.3%) | 60 (64.5%) |
| 5 Years | 17 (50.0%) | 0 (0.0%) |
| 6 to 11 Years | 52 (70.3%) | 102 (56.0%) |
| 12 to 14 Years | 41 (100.0%) | 29 (100.0%) |
| 15 Years | 13 (100.0%) | 32 (100.0%) |
| 16 and 17 Years | 14 (100.0%) | 37 (74.0%) |
| 18 to 24 Years | 216 (95.6%) | 61 (78.2%) |
| 25 to 34 Years | 262 (100.0%) | 176 (90.7%) |
| 35 to 44 Years | 281 (92.4%) | 172 (73.2%) |
| 45 to 54 Years | 157 (71.4%) | 326 (96.5%) |
| 55 to 64 Years | 309 (91.4%) | 229 (70.9%) |
| 65 to 74 Years | 222 (95.3%) | 225 (100.0%) |
| 75 Years and over | 59 (79.7%) | 54 (81.8%) |
| Total | 1,686 (88.6%) | 1,503 (81.5%) |
Income Below Poverty Among Married-Couple Families in Sloan
The poverty statistics for married-couple families in Sloan show that 3.9% or 23 of the total 587 families live below the poverty line. Families with 1 or 2 children have the highest poverty rate of 13.5%, comprising of 23 families. On the other hand, families with no children have the lowest poverty rate of 0.0%, which includes 0 families.
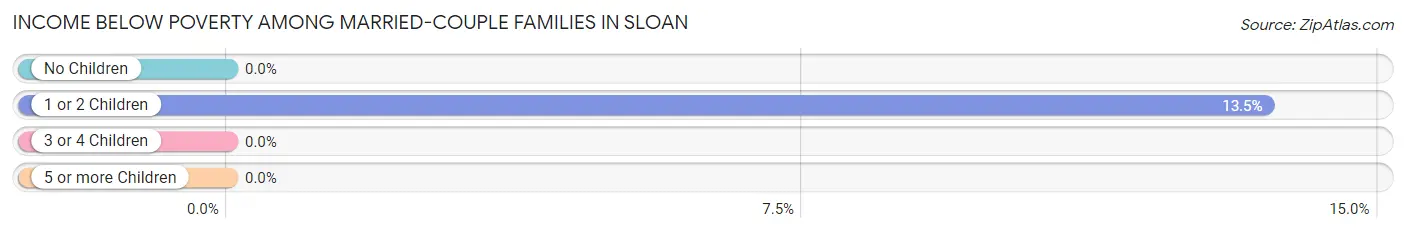
| Children | Above Poverty | Below Poverty |
| No Children | 405 (100.0%) | 0 (0.0%) |
| 1 or 2 Children | 147 (86.5%) | 23 (13.5%) |
| 3 or 4 Children | 12 (100.0%) | 0 (0.0%) |
| 5 or more Children | 0 (0.0%) | 0 (0.0%) |
| Total | 564 (96.1%) | 23 (3.9%) |
Income Below Poverty Among Single-Parent Households in Sloan
According to the poverty data in Sloan, 6.8% or 11 single-father households and 37.1% or 101 single-mother households are living below the poverty line. Among single-father households, those with no children have the highest poverty rate, with 11 households (12.4%) experiencing poverty. Likewise, among single-mother households, those with 3 or 4 children have the highest poverty rate, with 36 households (100.0%) falling below the poverty line.
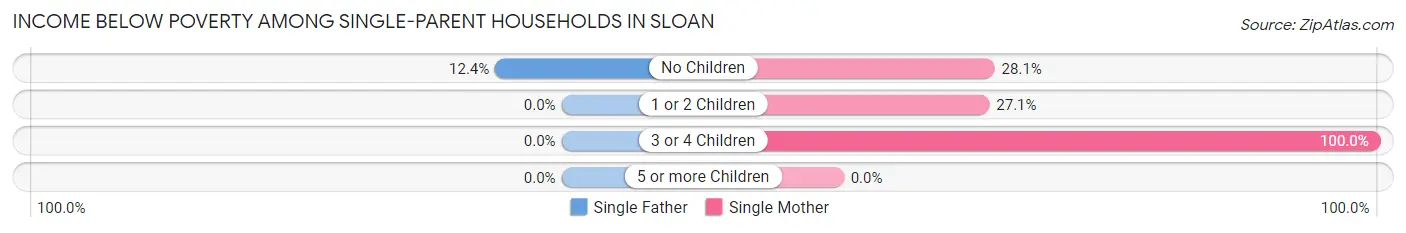
| Children | Single Father | Single Mother |
| No Children | 11 (12.4%) | 27 (28.1%) |
| 1 or 2 Children | 0 (0.0%) | 38 (27.1%) |
| 3 or 4 Children | 0 (0.0%) | 36 (100.0%) |
| 5 or more Children | 0 (0.0%) | 0 (0.0%) |
| Total | 11 (6.8%) | 101 (37.1%) |
Income Below Poverty Among Married-Couple vs Single-Parent Households in Sloan
The poverty data for Sloan shows that 23 of the married-couple family households (3.9%) and 112 of the single-parent households (25.8%) are living below the poverty level. Within the married-couple family households, those with 1 or 2 children have the highest poverty rate, with 23 households (13.5%) falling below the poverty line. Among the single-parent households, those with 3 or 4 children have the highest poverty rate, with 36 household (100.0%) living below poverty.
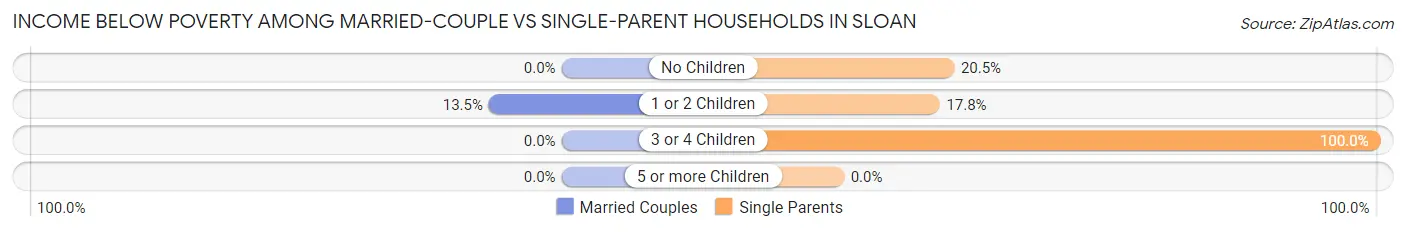
| Children | Married-Couple Families | Single-Parent Households |
| No Children | 0 (0.0%) | 38 (20.5%) |
| 1 or 2 Children | 23 (13.5%) | 38 (17.8%) |
| 3 or 4 Children | 0 (0.0%) | 36 (100.0%) |
| 5 or more Children | 0 (0.0%) | 0 (0.0%) |
| Total | 23 (3.9%) | 112 (25.8%) |
Race in Sloan
The most populous races in Sloan are White / Caucasian (3,179 | 84.5%), Two or more Races (288 | 7.7%), and Black / African American (185 | 4.9%).
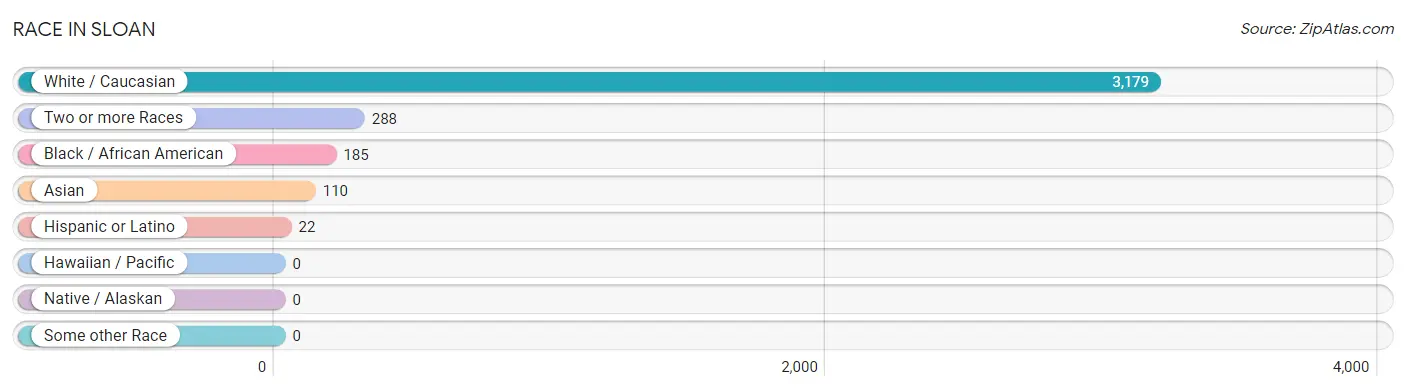
| Race | # Population | % Population |
| Asian | 110 | 2.9% |
| Black / African American | 185 | 4.9% |
| Hawaiian / Pacific | 0 | 0.0% |
| Hispanic or Latino | 22 | 0.6% |
| Native / Alaskan | 0 | 0.0% |
| White / Caucasian | 3,179 | 84.5% |
| Two or more Races | 288 | 7.7% |
| Some other Race | 0 | 0.0% |
| Total | 3,762 | 100.0% |
Ancestry in Sloan
The most populous ancestries reported in Sloan are Polish (1,145 | 30.4%), German (776 | 20.6%), Italian (673 | 17.9%), Irish (487 | 13.0%), and French (205 | 5.4%), together accounting for 87.4% of all Sloan residents.
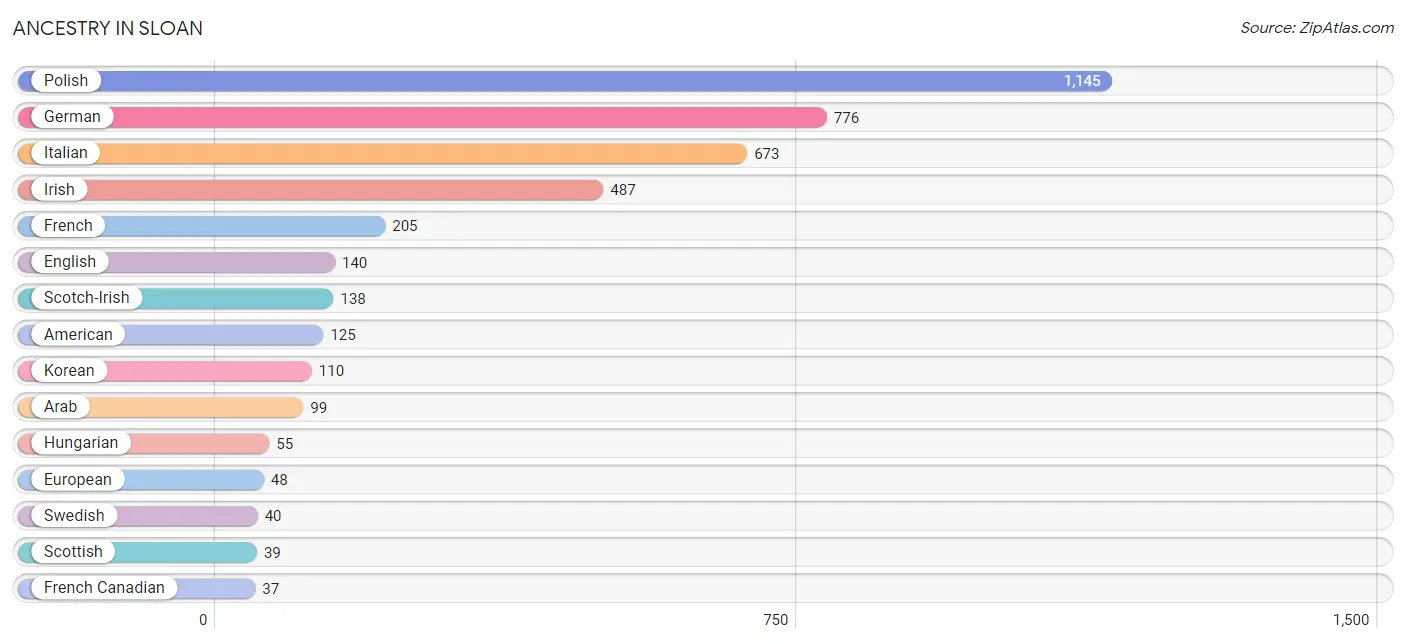
| Ancestry | # Population | % Population |
| American | 125 | 3.3% |
| Arab | 99 | 2.6% |
| Austrian | 13 | 0.4% |
| Canadian | 13 | 0.4% |
| Colombian | 8 | 0.2% |
| Czechoslovakian | 7 | 0.2% |
| Dutch | 31 | 0.8% |
| English | 140 | 3.7% |
| European | 48 | 1.3% |
| French | 205 | 5.4% |
| French Canadian | 37 | 1.0% |
| German | 776 | 20.6% |
| Hungarian | 55 | 1.5% |
| Irish | 487 | 13.0% |
| Italian | 673 | 17.9% |
| Korean | 110 | 2.9% |
| Lebanese | 36 | 1.0% |
| Norwegian | 7 | 0.2% |
| Polish | 1,145 | 30.4% |
| Puerto Rican | 14 | 0.4% |
| Russian | 24 | 0.6% |
| Scotch-Irish | 138 | 3.7% |
| Scottish | 39 | 1.0% |
| South American | 8 | 0.2% |
| Swedish | 40 | 1.1% |
| Ukrainian | 6 | 0.2% | View All 26 Rows |
Immigrants in Sloan
The most numerous immigrant groups reported in Sloan came from Asia (62 | 1.7%), Philippines (62 | 1.7%), South Eastern Asia (62 | 1.7%), Canada (31 | 0.8%), and Europe (23 | 0.6%), together accounting for 6.4% of all Sloan residents.
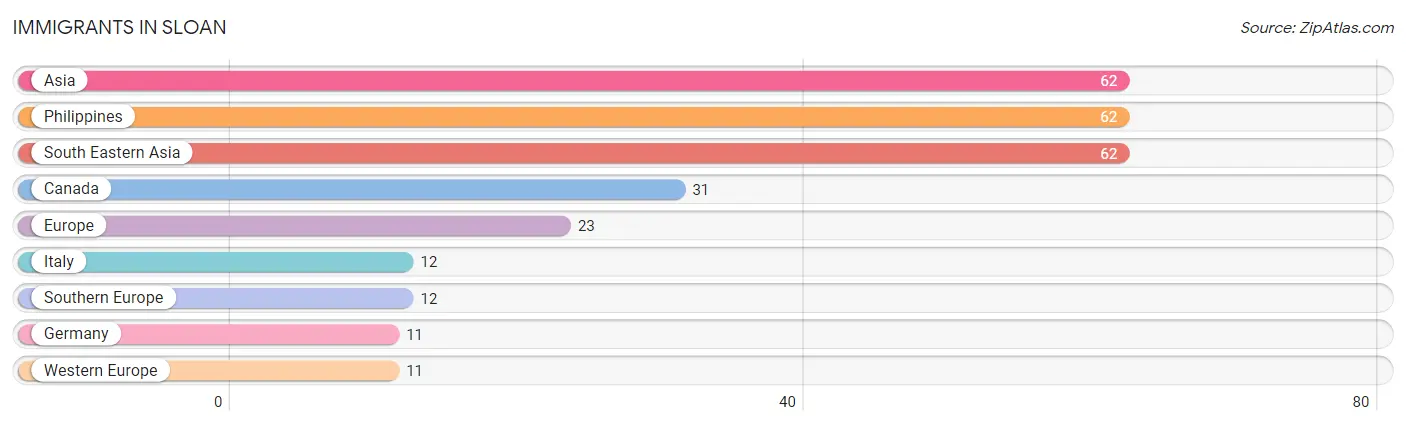
| Immigration Origin | # Population | % Population |
| Asia | 62 | 1.7% |
| Canada | 31 | 0.8% |
| Europe | 23 | 0.6% |
| Germany | 11 | 0.3% |
| Italy | 12 | 0.3% |
| Philippines | 62 | 1.7% |
| South Eastern Asia | 62 | 1.7% |
| Southern Europe | 12 | 0.3% |
| Western Europe | 11 | 0.3% | View All 9 Rows |
Sex and Age in Sloan
Sex and Age in Sloan
The most populous age groups in Sloan are 35 to 39 Years (226 | 11.8%) for men and 55 to 59 Years (214 | 11.6%) for women.
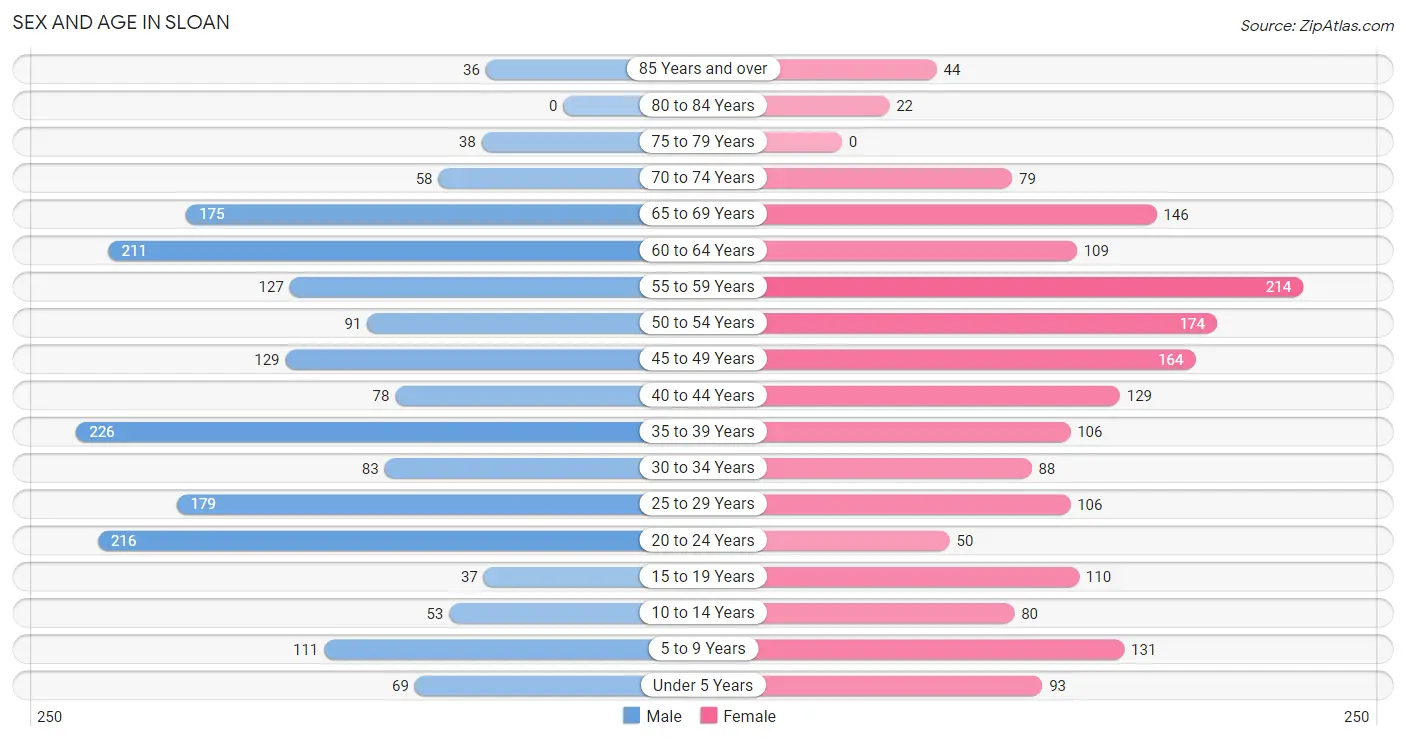
| Age Bracket | Male | Female |
| Under 5 Years | 69 (3.6%) | 93 (5.0%) |
| 5 to 9 Years | 111 (5.8%) | 131 (7.1%) |
| 10 to 14 Years | 53 (2.8%) | 80 (4.3%) |
| 15 to 19 Years | 37 (1.9%) | 110 (6.0%) |
| 20 to 24 Years | 216 (11.3%) | 50 (2.7%) |
| 25 to 29 Years | 179 (9.3%) | 106 (5.8%) |
| 30 to 34 Years | 83 (4.3%) | 88 (4.8%) |
| 35 to 39 Years | 226 (11.8%) | 106 (5.8%) |
| 40 to 44 Years | 78 (4.1%) | 129 (7.0%) |
| 45 to 49 Years | 129 (6.7%) | 164 (8.9%) |
| 50 to 54 Years | 91 (4.8%) | 174 (9.4%) |
| 55 to 59 Years | 127 (6.6%) | 214 (11.6%) |
| 60 to 64 Years | 211 (11.0%) | 109 (5.9%) |
| 65 to 69 Years | 175 (9.1%) | 146 (7.9%) |
| 70 to 74 Years | 58 (3.0%) | 79 (4.3%) |
| 75 to 79 Years | 38 (2.0%) | 0 (0.0%) |
| 80 to 84 Years | 0 (0.0%) | 22 (1.2%) |
| 85 Years and over | 36 (1.9%) | 44 (2.4%) |
| Total | 1,917 (100.0%) | 1,845 (100.0%) |
Families and Households in Sloan
Median Family Size in Sloan
The median family size in Sloan is 2.72 persons per family, with married-couple families (587 | 57.5%) accounting for the largest median family size of 2.88 persons per family. On the other hand, single female/mother families (272 | 26.6%) represent the smallest median family size with 2.45 persons per family.
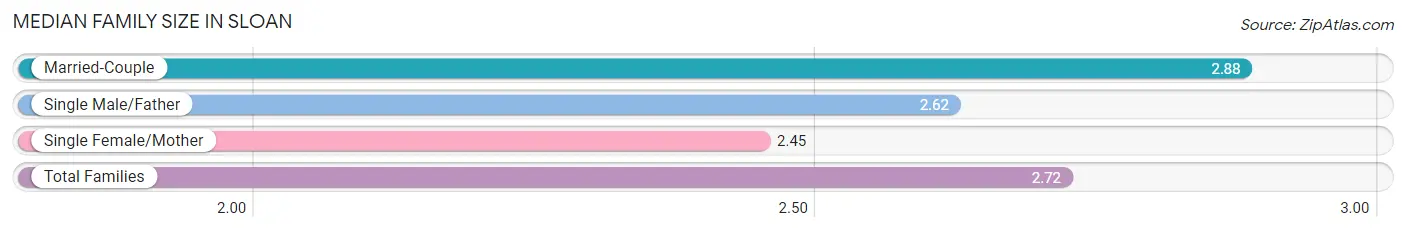
| Family Type | # Families | Family Size |
| Married-Couple | 587 (57.5%) | 2.88 |
| Single Male/Father | 162 (15.9%) | 2.62 |
| Single Female/Mother | 272 (26.6%) | 2.45 |
| Total Families | 1,021 (100.0%) | 2.72 |
Median Household Size in Sloan
The median household size in Sloan is 2.26 persons per household, with single male/father households (162 | 9.7%) accounting for the largest median household size of 2.97 persons per household. non-family households (646 | 38.8%) represent the smallest median household size with 1.33 persons per household.
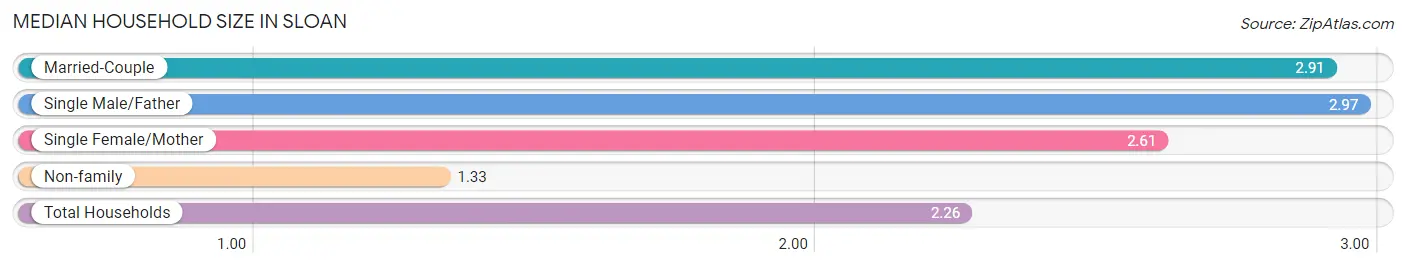
| Household Type | # Households | Household Size |
| Married-Couple | 587 (35.2%) | 2.91 |
| Single Male/Father | 162 (9.7%) | 2.97 |
| Single Female/Mother | 272 (16.3%) | 2.61 |
| Non-family | 646 (38.8%) | 1.33 |
| Total Households | 1,667 (100.0%) | 2.26 |
Household Size by Marriage Status in Sloan
Out of a total of 1,667 households in Sloan, 1,021 (61.3%) are family households, while 646 (38.8%) are nonfamily households. The most numerous type of family households are 2-person households, comprising 571, and the most common type of nonfamily households are 1-person households, comprising 483.
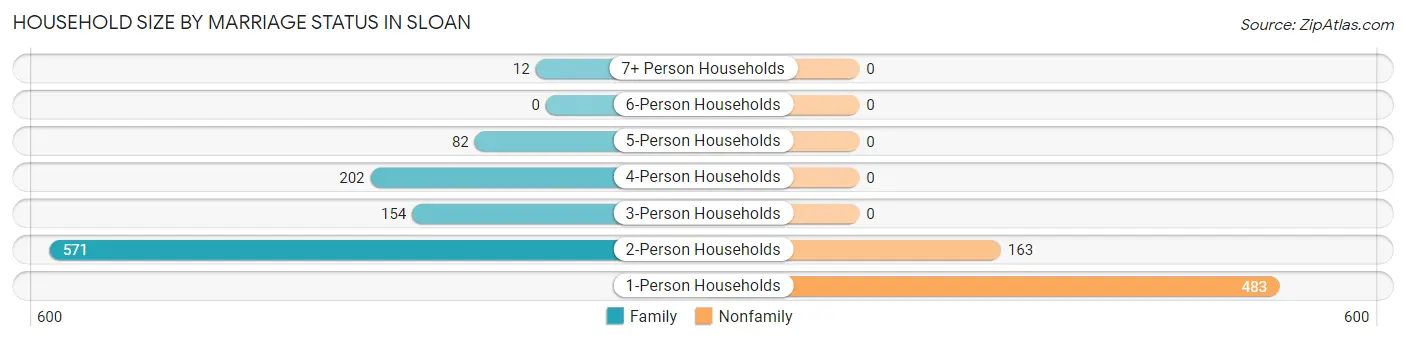
| Household Size | Family Households | Nonfamily Households |
| 1-Person Households | - | 483 (29.0%) |
| 2-Person Households | 571 (34.3%) | 163 (9.8%) |
| 3-Person Households | 154 (9.2%) | 0 (0.0%) |
| 4-Person Households | 202 (12.1%) | 0 (0.0%) |
| 5-Person Households | 82 (4.9%) | 0 (0.0%) |
| 6-Person Households | 0 (0.0%) | 0 (0.0%) |
| 7+ Person Households | 12 (0.7%) | 0 (0.0%) |
| Total | 1,021 (61.3%) | 646 (38.8%) |
Female Fertility in Sloan
Fertility by Age in Sloan
Average fertility rate in Sloan is 16.0 births per 1,000 women. Women in the age bracket of 20 to 34 years have the highest fertility rate with 53.0 births per 1,000 women. Women in the age bracket of 20 to 34 years acount for 100.0% of all women with births.
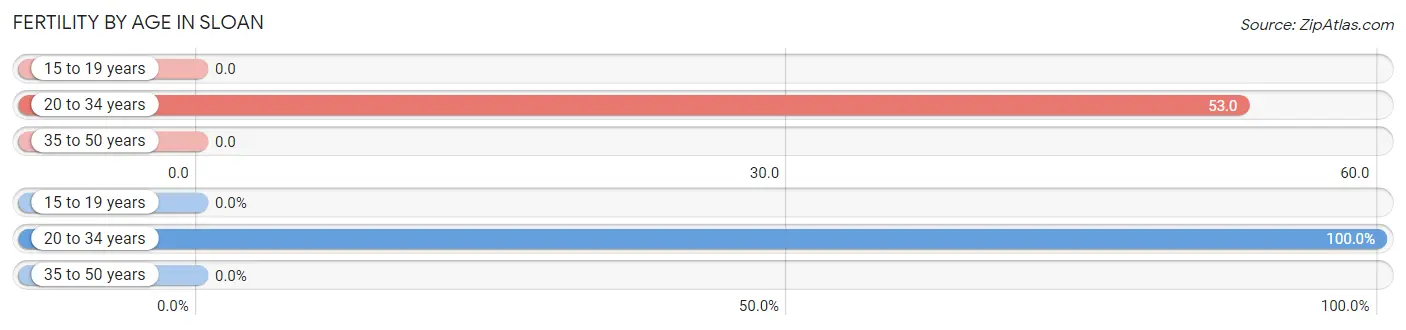
| Age Bracket | Women with Births | Births / 1,000 Women |
| 15 to 19 years | 0 (0.0%) | 0.0 |
| 20 to 34 years | 13 (100.0%) | 53.0 |
| 35 to 50 years | 0 (0.0%) | 0.0 |
| Total | 13 (100.0%) | 16.0 |
Fertility by Age by Marriage Status in Sloan
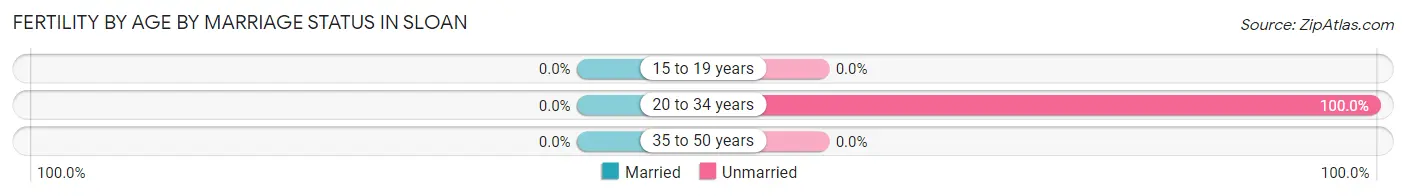
| Age Bracket | Married | Unmarried |
| 15 to 19 years | 0 (0.0%) | 0 (0.0%) |
| 20 to 34 years | 0 (0.0%) | 13 (100.0%) |
| 35 to 50 years | 0 (0.0%) | 0 (0.0%) |
| Total | 0 (0.0%) | 13 (100.0%) |
Fertility by Education in Sloan
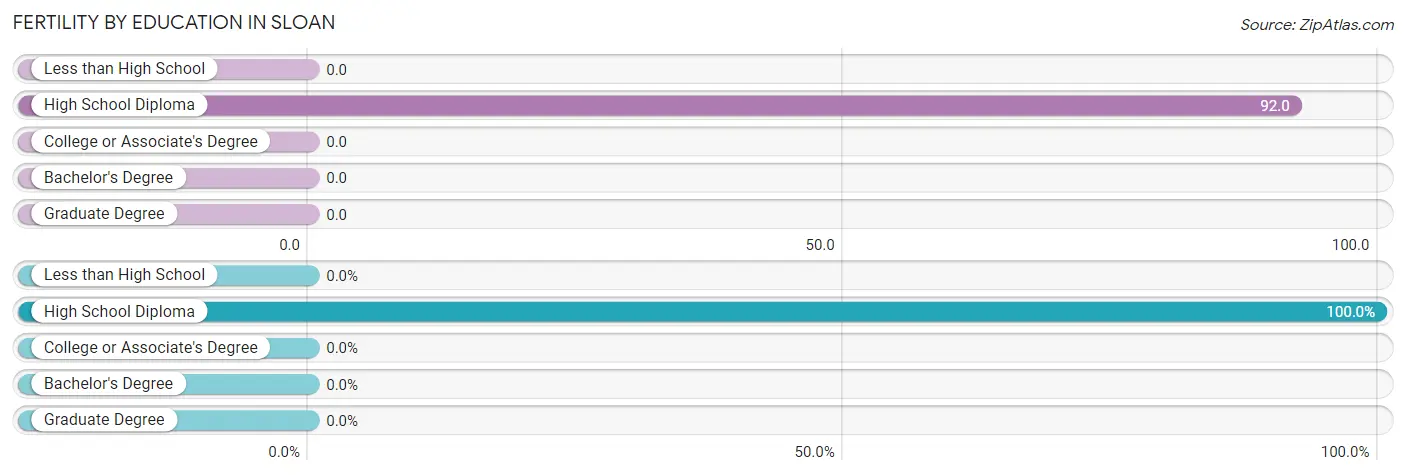
| Educational Attainment | Women with Births | Births / 1,000 Women |
| Less than High School | 0 (0.0%) | 0.0 |
| High School Diploma | 13 (100.0%) | 92.0 |
| College or Associate's Degree | 0 (0.0%) | 0.0 |
| Bachelor's Degree | 0 (0.0%) | 0.0 |
| Graduate Degree | 0 (0.0%) | 0.0 |
| Total | 13 (100.0%) | 16.0 |
Fertility by Education by Marriage Status in Sloan
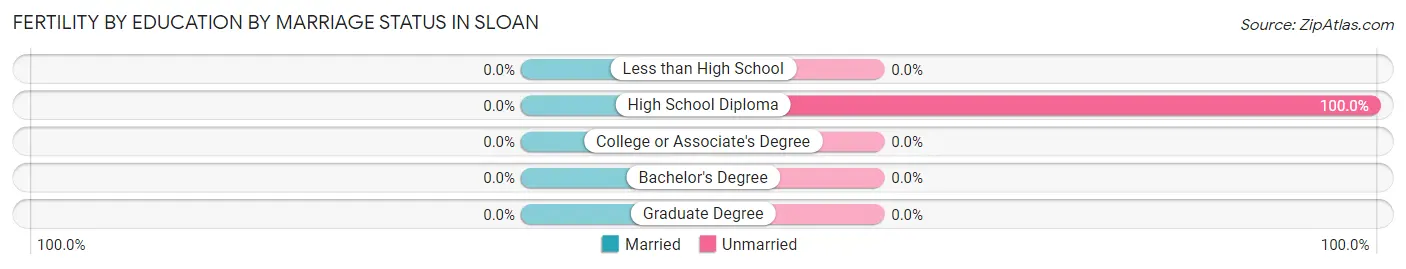
| Educational Attainment | Married | Unmarried |
| Less than High School | 0 (0.0%) | 0 (0.0%) |
| High School Diploma | 0 (0.0%) | 13 (100.0%) |
| College or Associate's Degree | 0 (0.0%) | 0 (0.0%) |
| Bachelor's Degree | 0 (0.0%) | 0 (0.0%) |
| Graduate Degree | 0 (0.0%) | 0 (0.0%) |
| Total | 0 (0.0%) | 13 (100.0%) |
Employment Characteristics in Sloan
Employment by Class of Employer in Sloan
Among the 1,659 employed individuals in Sloan, private company employees (1,019 | 61.4%), not-for-profit organizations (167 | 10.1%), and local government employees (144 | 8.7%) make up the most common classes of employment.
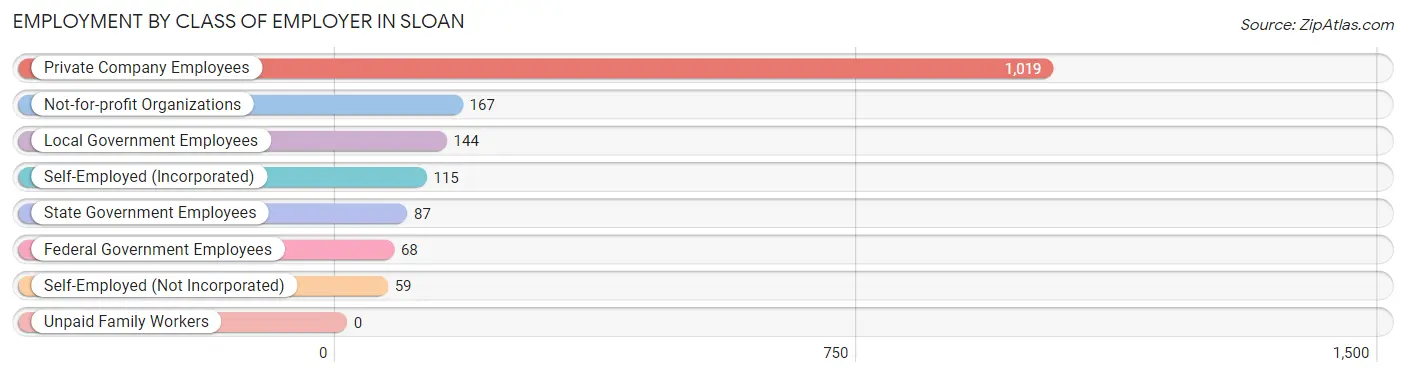
| Employer Class | # Employees | % Employees |
| Private Company Employees | 1,019 | 61.4% |
| Self-Employed (Incorporated) | 115 | 6.9% |
| Self-Employed (Not Incorporated) | 59 | 3.6% |
| Not-for-profit Organizations | 167 | 10.1% |
| Local Government Employees | 144 | 8.7% |
| State Government Employees | 87 | 5.2% |
| Federal Government Employees | 68 | 4.1% |
| Unpaid Family Workers | 0 | 0.0% |
| Total | 1,659 | 100.0% |
Employment Status by Age in Sloan
According to the labor force statistics for Sloan, out of the total population over 16 years of age (3,180), 60.2% or 1,914 individuals are in the labor force, with 3.2% or 61 of them unemployed. The age group with the highest labor force participation rate is 30 to 34 years, with 100.0% or 171 individuals in the labor force. Within the labor force, the 65 to 74 years age range has the highest percentage of unemployed individuals, with 10.0% or 12 of them being unemployed.
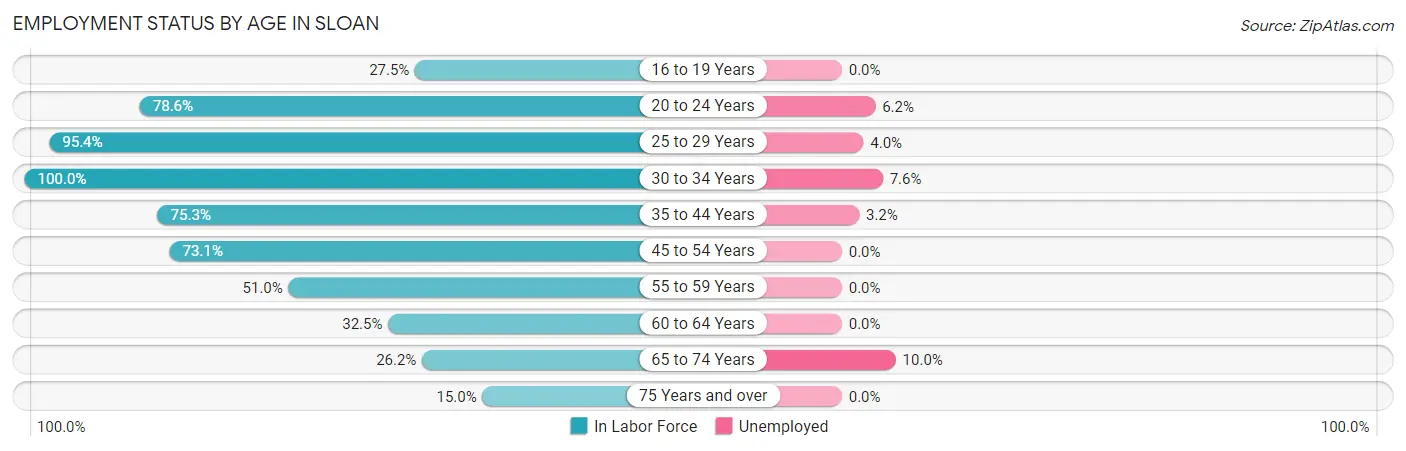
| Age Bracket | In Labor Force | Unemployed |
| 16 to 19 Years | 28 (27.5%) | 0 (0.0%) |
| 20 to 24 Years | 209 (78.6%) | 13 (6.2%) |
| 25 to 29 Years | 272 (95.4%) | 11 (4.0%) |
| 30 to 34 Years | 171 (100.0%) | 13 (7.6%) |
| 35 to 44 Years | 406 (75.3%) | 13 (3.2%) |
| 45 to 54 Years | 408 (73.1%) | 0 (0.0%) |
| 55 to 59 Years | 174 (51.0%) | 0 (0.0%) |
| 60 to 64 Years | 104 (32.5%) | 0 (0.0%) |
| 65 to 74 Years | 120 (26.2%) | 12 (10.0%) |
| 75 Years and over | 21 (15.0%) | 0 (0.0%) |
| Total | 1,914 (60.2%) | 61 (3.2%) |
Employment Status by Educational Attainment in Sloan
According to labor force statistics for Sloan, 69.3% of individuals (1,534) out of the total population between 25 and 64 years of age (2,214) are in the labor force, with 2.4% or 37 of them being unemployed. The group with the highest labor force participation rate are those with the educational attainment of bachelor's degree or higher, with 92.3% or 350 individuals in the labor force. Within the labor force, individuals with less than high school education have the highest percentage of unemployment, with 19.4% or 13 of them being unemployed.
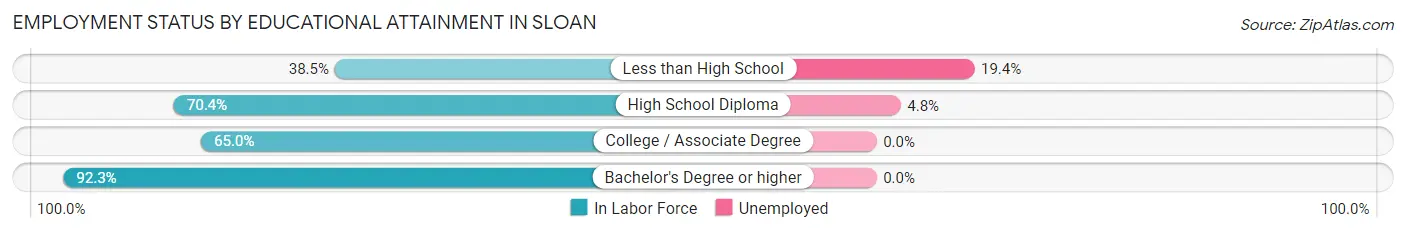
| Educational Attainment | In Labor Force | Unemployed |
| Less than High School | 67 (38.5%) | 34 (19.4%) |
| High School Diploma | 497 (70.4%) | 34 (4.8%) |
| College / Associate Degree | 621 (65.0%) | 0 (0.0%) |
| Bachelor's Degree or higher | 350 (92.3%) | 0 (0.0%) |
| Total | 1,534 (69.3%) | 53 (2.4%) |
Employment Occupations by Sex in Sloan
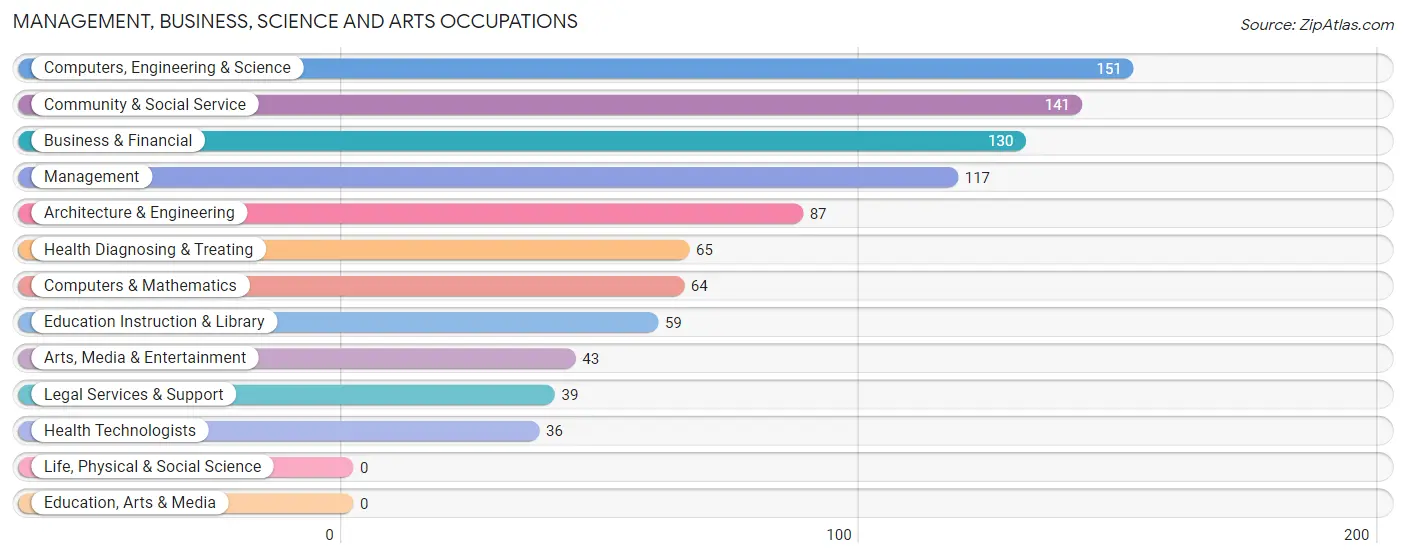
Management, Business, Science and Arts Occupations
The most common Management, Business, Science and Arts occupations in Sloan are Computers, Engineering & Science (151 | 8.2%), Community & Social Service (141 | 7.6%), Business & Financial (130 | 7.0%), Management (117 | 6.3%), and Architecture & Engineering (87 | 4.7%).
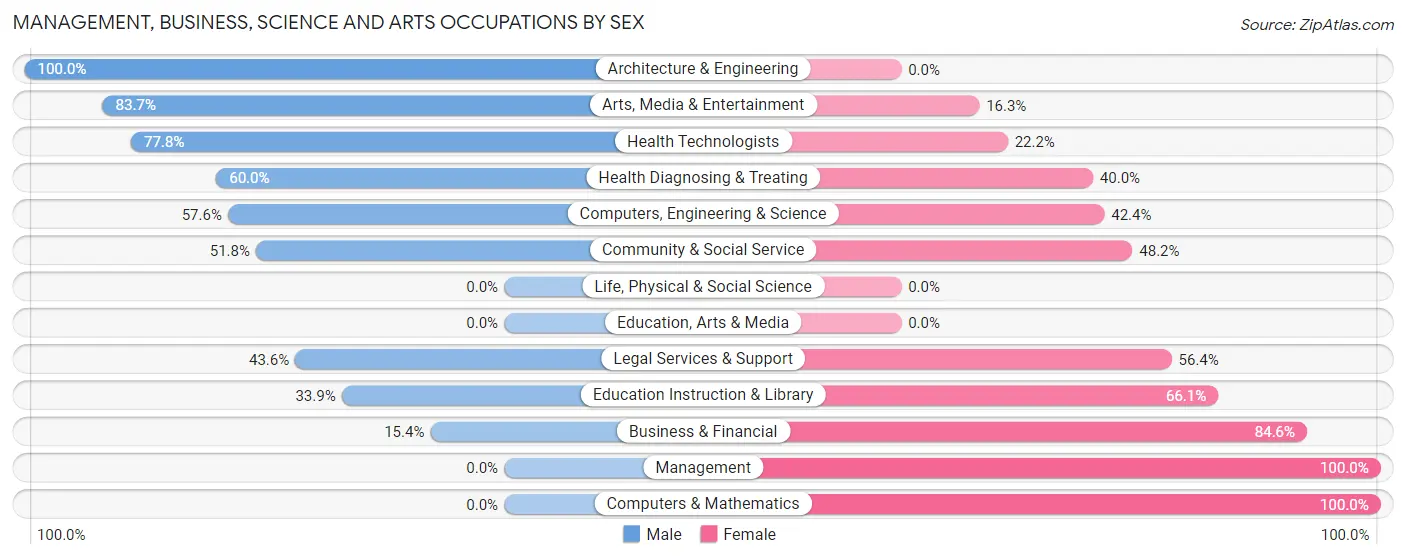
Management, Business, Science and Arts Occupations by Sex
Within the Management, Business, Science and Arts occupations in Sloan, the most male-oriented occupations are Architecture & Engineering (100.0%), Arts, Media & Entertainment (83.7%), and Health Technologists (77.8%), while the most female-oriented occupations are Management (100.0%), Computers & Mathematics (100.0%), and Business & Financial (84.6%).
| Occupation | Male | Female |
| Management | 0 (0.0%) | 117 (100.0%) |
| Business & Financial | 20 (15.4%) | 110 (84.6%) |
| Computers, Engineering & Science | 87 (57.6%) | 64 (42.4%) |
| Computers & Mathematics | 0 (0.0%) | 64 (100.0%) |
| Architecture & Engineering | 87 (100.0%) | 0 (0.0%) |
| Life, Physical & Social Science | 0 (0.0%) | 0 (0.0%) |
| Community & Social Service | 73 (51.8%) | 68 (48.2%) |
| Education, Arts & Media | 0 (0.0%) | 0 (0.0%) |
| Legal Services & Support | 17 (43.6%) | 22 (56.4%) |
| Education Instruction & Library | 20 (33.9%) | 39 (66.1%) |
| Arts, Media & Entertainment | 36 (83.7%) | 7 (16.3%) |
| Health Diagnosing & Treating | 39 (60.0%) | 26 (40.0%) |
| Health Technologists | 28 (77.8%) | 8 (22.2%) |
| Total (Category) | 219 (36.3%) | 385 (63.7%) |
| Total (Overall) | 1,012 (54.7%) | 839 (45.3%) |
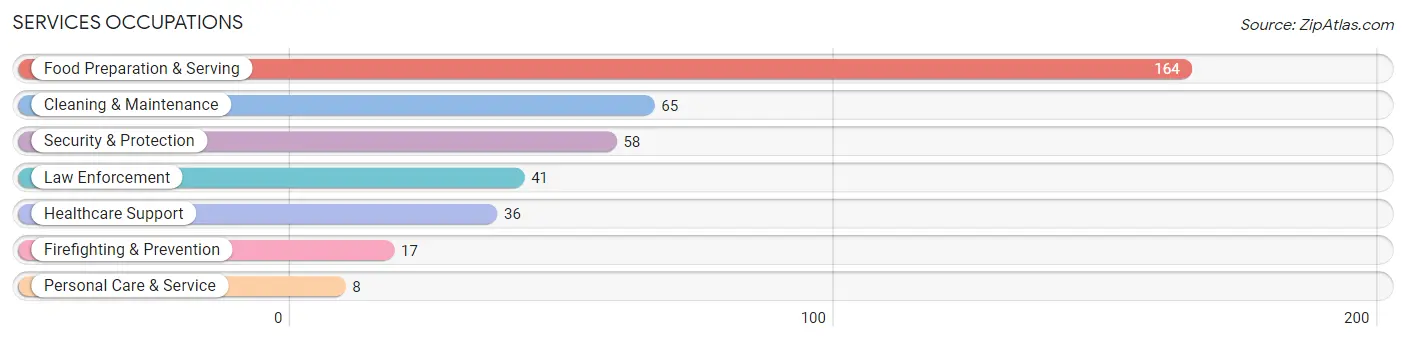
Services Occupations
The most common Services occupations in Sloan are Food Preparation & Serving (164 | 8.9%), Cleaning & Maintenance (65 | 3.5%), Security & Protection (58 | 3.1%), Law Enforcement (41 | 2.2%), and Healthcare Support (36 | 1.9%).
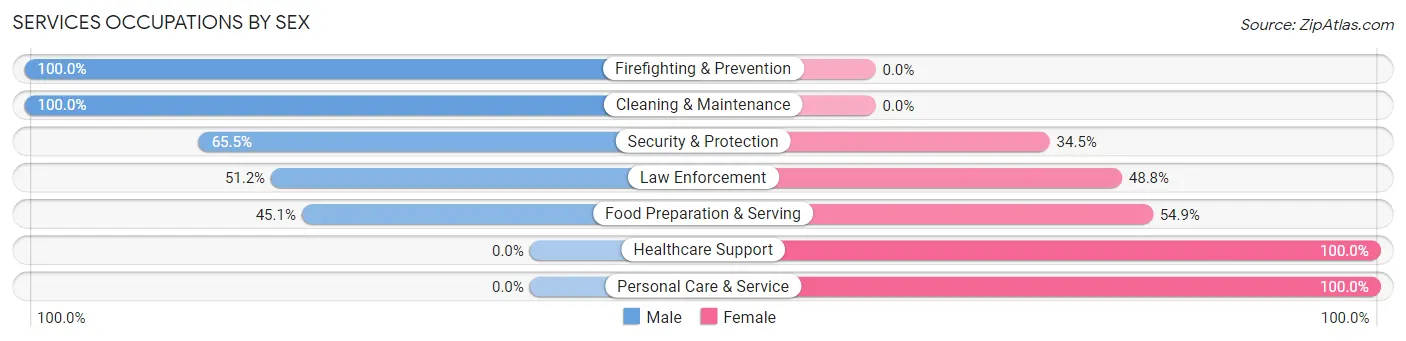
Services Occupations by Sex
Within the Services occupations in Sloan, the most male-oriented occupations are Firefighting & Prevention (100.0%), Cleaning & Maintenance (100.0%), and Security & Protection (65.5%), while the most female-oriented occupations are Healthcare Support (100.0%), Personal Care & Service (100.0%), and Food Preparation & Serving (54.9%).
| Occupation | Male | Female |
| Healthcare Support | 0 (0.0%) | 36 (100.0%) |
| Security & Protection | 38 (65.5%) | 20 (34.5%) |
| Firefighting & Prevention | 17 (100.0%) | 0 (0.0%) |
| Law Enforcement | 21 (51.2%) | 20 (48.8%) |
| Food Preparation & Serving | 74 (45.1%) | 90 (54.9%) |
| Cleaning & Maintenance | 65 (100.0%) | 0 (0.0%) |
| Personal Care & Service | 0 (0.0%) | 8 (100.0%) |
| Total (Category) | 177 (53.5%) | 154 (46.5%) |
| Total (Overall) | 1,012 (54.7%) | 839 (45.3%) |
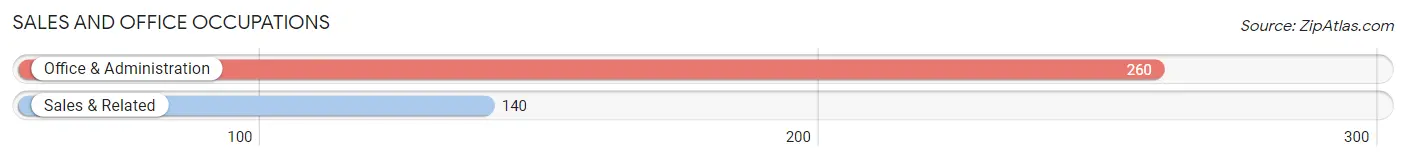
Sales and Office Occupations
The most common Sales and Office occupations in Sloan are Office & Administration (260 | 14.1%), and Sales & Related (140 | 7.6%).
Sales and Office Occupations by Sex
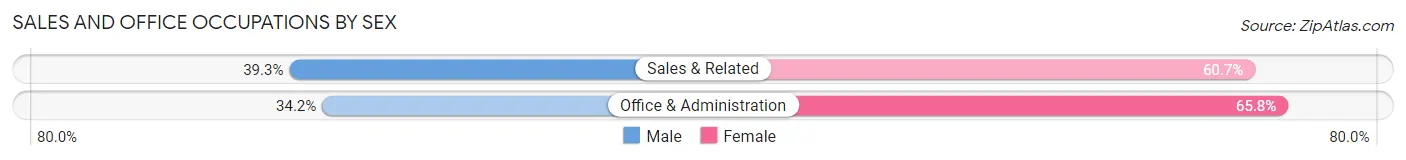
| Occupation | Male | Female |
| Sales & Related | 55 (39.3%) | 85 (60.7%) |
| Office & Administration | 89 (34.2%) | 171 (65.8%) |
| Total (Category) | 144 (36.0%) | 256 (64.0%) |
| Total (Overall) | 1,012 (54.7%) | 839 (45.3%) |
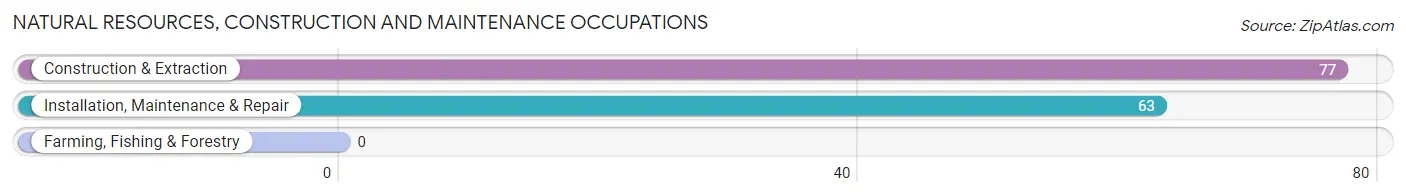
Natural Resources, Construction and Maintenance Occupations
The most common Natural Resources, Construction and Maintenance occupations in Sloan are Construction & Extraction (77 | 4.2%), and Installation, Maintenance & Repair (63 | 3.4%).
Natural Resources, Construction and Maintenance Occupations by Sex
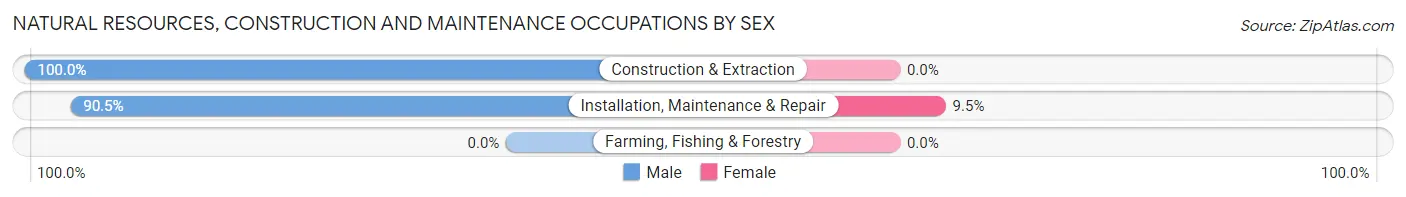
| Occupation | Male | Female |
| Farming, Fishing & Forestry | 0 (0.0%) | 0 (0.0%) |
| Construction & Extraction | 77 (100.0%) | 0 (0.0%) |
| Installation, Maintenance & Repair | 57 (90.5%) | 6 (9.5%) |
| Total (Category) | 134 (95.7%) | 6 (4.3%) |
| Total (Overall) | 1,012 (54.7%) | 839 (45.3%) |
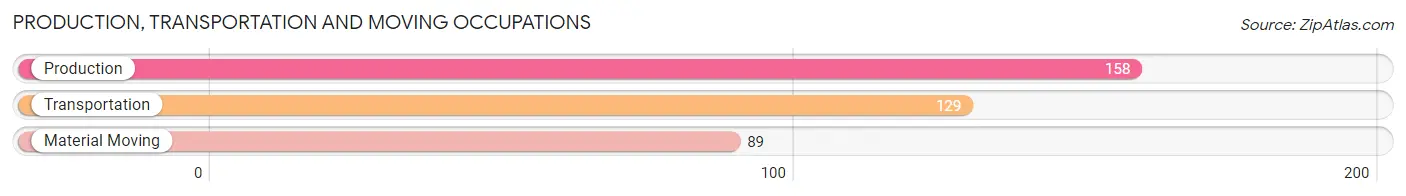
Production, Transportation and Moving Occupations
The most common Production, Transportation and Moving occupations in Sloan are Production (158 | 8.5%), Transportation (129 | 7.0%), and Material Moving (89 | 4.8%).
Production, Transportation and Moving Occupations by Sex
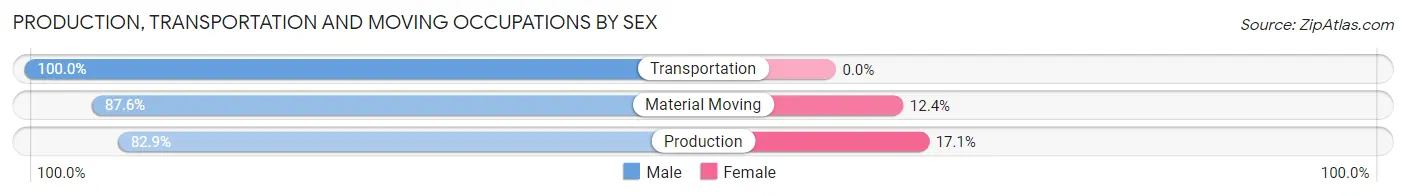
| Occupation | Male | Female |
| Production | 131 (82.9%) | 27 (17.1%) |
| Transportation | 129 (100.0%) | 0 (0.0%) |
| Material Moving | 78 (87.6%) | 11 (12.4%) |
| Total (Category) | 338 (89.9%) | 38 (10.1%) |
| Total (Overall) | 1,012 (54.7%) | 839 (45.3%) |
Employment Industries by Sex in Sloan
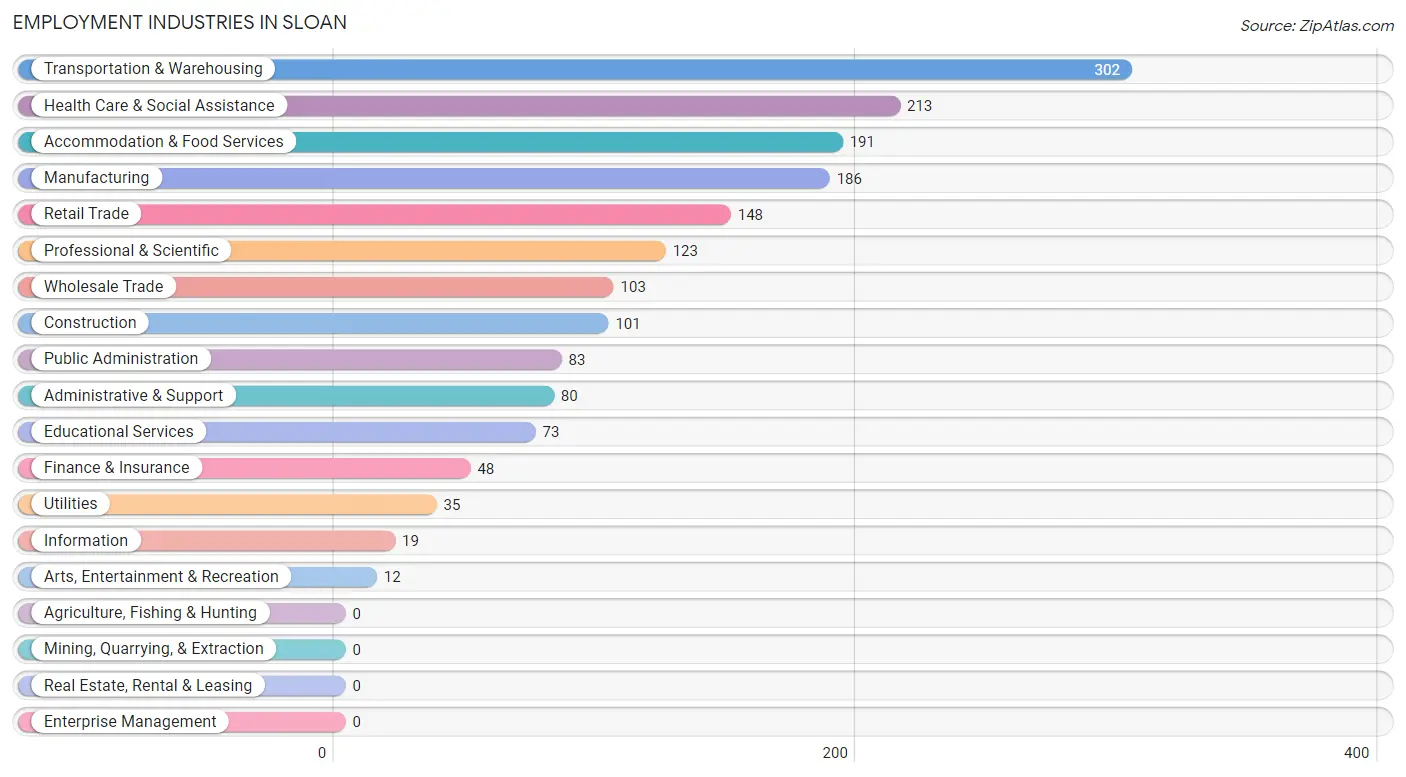
Employment Industries in Sloan
The major employment industries in Sloan include Transportation & Warehousing (302 | 16.3%), Health Care & Social Assistance (213 | 11.5%), Accommodation & Food Services (191 | 10.3%), Manufacturing (186 | 10.1%), and Retail Trade (148 | 8.0%).
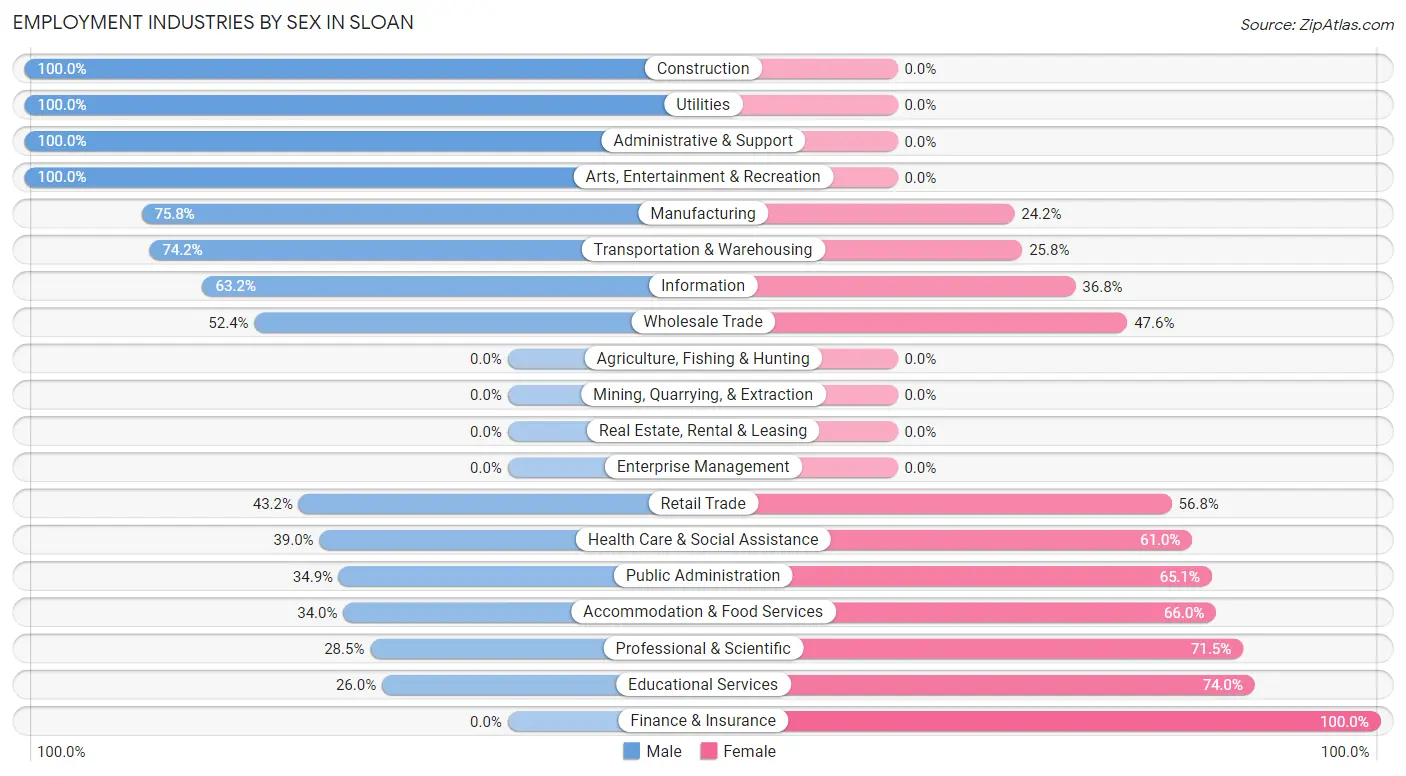
Employment Industries by Sex in Sloan
The Sloan industries that see more men than women are Construction (100.0%), Utilities (100.0%), and Administrative & Support (100.0%), whereas the industries that tend to have a higher number of women are Finance & Insurance (100.0%), Educational Services (74.0%), and Professional & Scientific (71.5%).
| Industry | Male | Female |
| Agriculture, Fishing & Hunting | 0 (0.0%) | 0 (0.0%) |
| Mining, Quarrying, & Extraction | 0 (0.0%) | 0 (0.0%) |
| Construction | 101 (100.0%) | 0 (0.0%) |
| Manufacturing | 141 (75.8%) | 45 (24.2%) |
| Wholesale Trade | 54 (52.4%) | 49 (47.6%) |
| Retail Trade | 64 (43.2%) | 84 (56.8%) |
| Transportation & Warehousing | 224 (74.2%) | 78 (25.8%) |
| Utilities | 35 (100.0%) | 0 (0.0%) |
| Information | 12 (63.2%) | 7 (36.8%) |
| Finance & Insurance | 0 (0.0%) | 48 (100.0%) |
| Real Estate, Rental & Leasing | 0 (0.0%) | 0 (0.0%) |
| Professional & Scientific | 35 (28.5%) | 88 (71.5%) |
| Enterprise Management | 0 (0.0%) | 0 (0.0%) |
| Administrative & Support | 80 (100.0%) | 0 (0.0%) |
| Educational Services | 19 (26.0%) | 54 (74.0%) |
| Health Care & Social Assistance | 83 (39.0%) | 130 (61.0%) |
| Arts, Entertainment & Recreation | 12 (100.0%) | 0 (0.0%) |
| Accommodation & Food Services | 65 (34.0%) | 126 (66.0%) |
| Public Administration | 29 (34.9%) | 54 (65.1%) |
| Total | 1,012 (54.7%) | 839 (45.3%) |
Education in Sloan
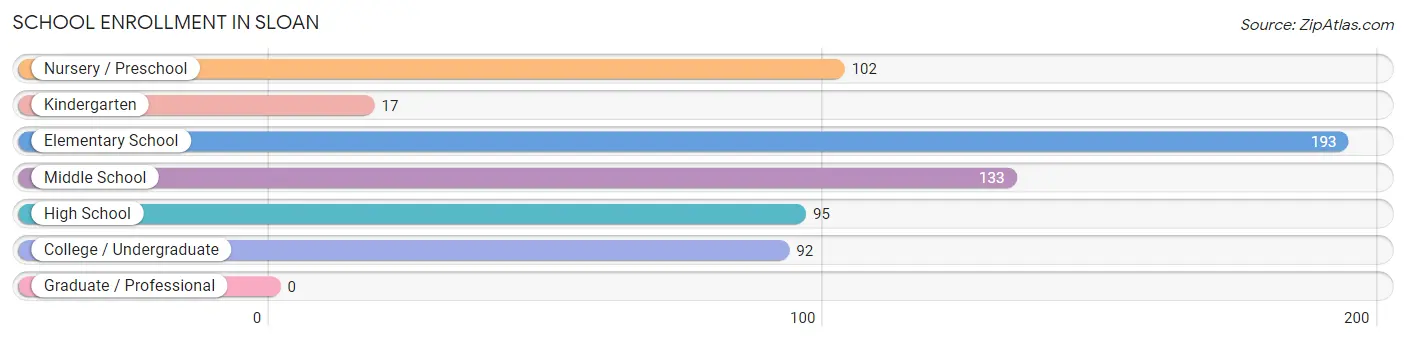
School Enrollment in Sloan
The most common levels of schooling among the 632 students in Sloan are elementary school (193 | 30.5%), middle school (133 | 21.0%), and nursery / preschool (102 | 16.1%).
| School Level | # Students | % Students |
| Nursery / Preschool | 102 | 16.1% |
| Kindergarten | 17 | 2.7% |
| Elementary School | 193 | 30.5% |
| Middle School | 133 | 21.0% |
| High School | 95 | 15.0% |
| College / Undergraduate | 92 | 14.6% |
| Graduate / Professional | 0 | 0.0% |
| Total | 632 | 100.0% |
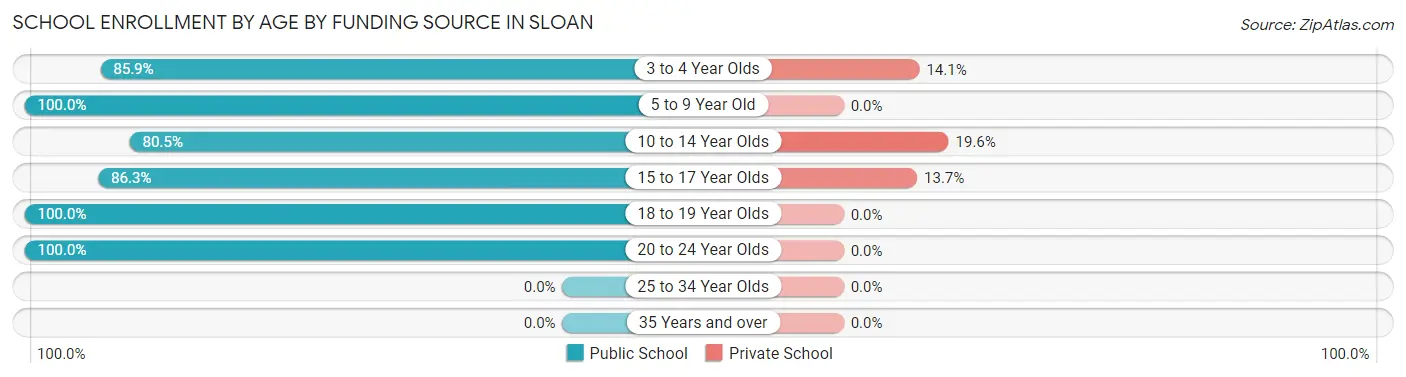
School Enrollment by Age by Funding Source in Sloan
Out of a total of 632 students who are enrolled in schools in Sloan, 51 (8.1%) attend a private institution, while the remaining 581 (91.9%) are enrolled in public schools. The age group of 10 to 14 year olds has the highest likelihood of being enrolled in private schools, with 26 (19.6% in the age bracket) enrolled. Conversely, the age group of 5 to 9 year old has the lowest likelihood of being enrolled in a private school, with 227 (100.0% in the age bracket) attending a public institution.
| Age Bracket | Public School | Private School |
| 3 to 4 Year Olds | 73 (85.9%) | 12 (14.1%) |
| 5 to 9 Year Old | 227 (100.0%) | 0 (0.0%) |
| 10 to 14 Year Olds | 107 (80.4%) | 26 (19.6%) |
| 15 to 17 Year Olds | 82 (86.3%) | 13 (13.7%) |
| 18 to 19 Year Olds | 38 (100.0%) | 0 (0.0%) |
| 20 to 24 Year Olds | 54 (100.0%) | 0 (0.0%) |
| 25 to 34 Year Olds | 0 (0.0%) | 0 (0.0%) |
| 35 Years and over | 0 (0.0%) | 0 (0.0%) |
| Total | 581 (91.9%) | 51 (8.1%) |
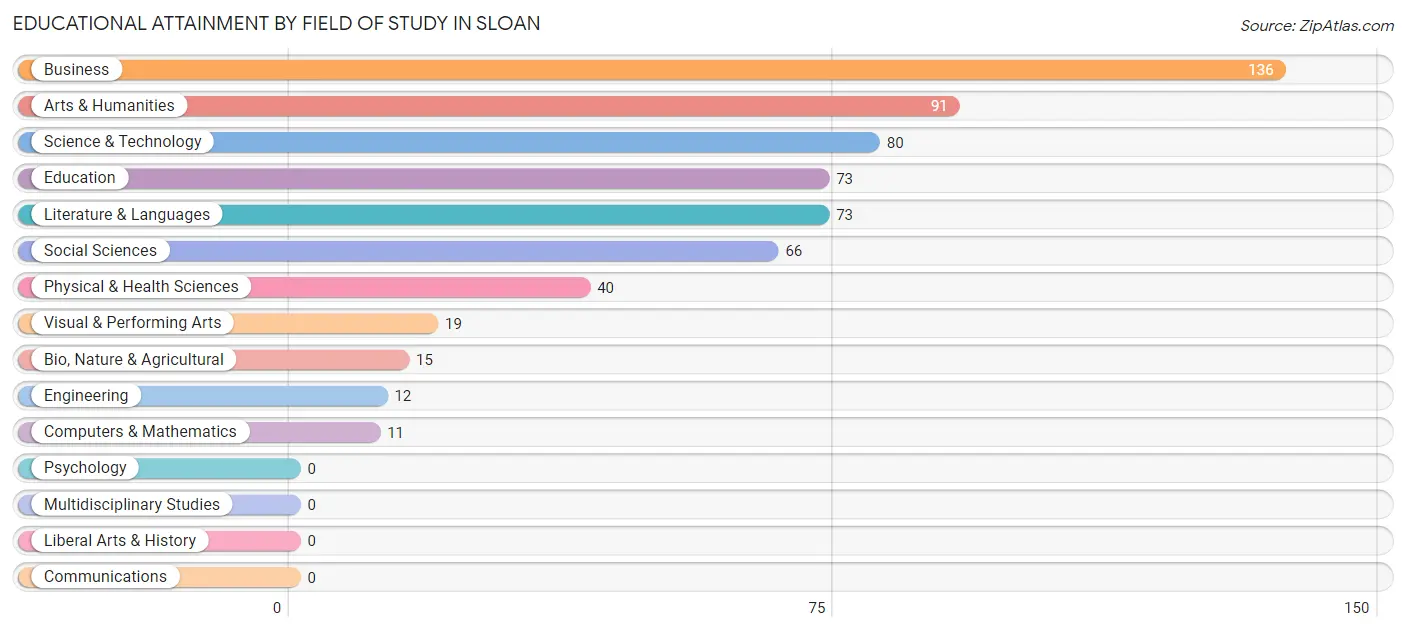
Educational Attainment by Field of Study in Sloan
Business (136 | 22.1%), arts & humanities (91 | 14.8%), science & technology (80 | 13.0%), education (73 | 11.8%), and literature & languages (73 | 11.8%) are the most common fields of study among 616 individuals in Sloan who have obtained a bachelor's degree or higher.
| Field of Study | # Graduates | % Graduates |
| Computers & Mathematics | 11 | 1.8% |
| Bio, Nature & Agricultural | 15 | 2.4% |
| Physical & Health Sciences | 40 | 6.5% |
| Psychology | 0 | 0.0% |
| Social Sciences | 66 | 10.7% |
| Engineering | 12 | 1.9% |
| Multidisciplinary Studies | 0 | 0.0% |
| Science & Technology | 80 | 13.0% |
| Business | 136 | 22.1% |
| Education | 73 | 11.8% |
| Literature & Languages | 73 | 11.8% |
| Liberal Arts & History | 0 | 0.0% |
| Visual & Performing Arts | 19 | 3.1% |
| Communications | 0 | 0.0% |
| Arts & Humanities | 91 | 14.8% |
| Total | 616 | 100.0% |
Transportation & Commute in Sloan
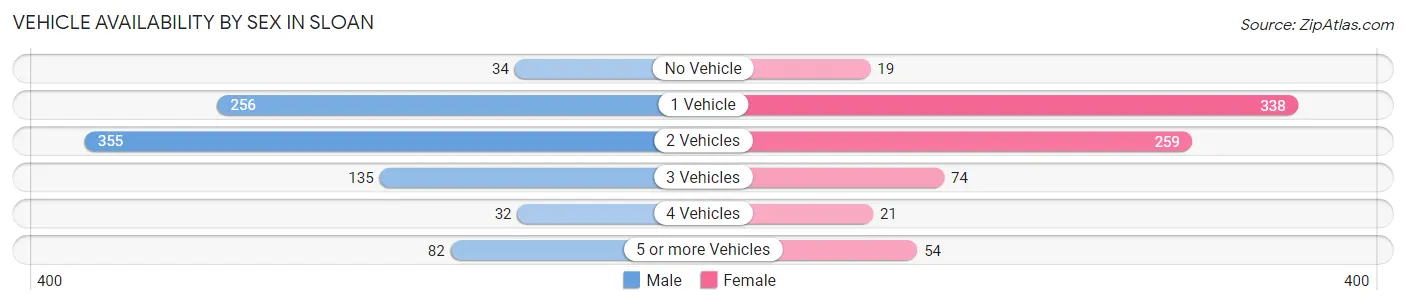
Vehicle Availability by Sex in Sloan
The most prevalent vehicle ownership categories in Sloan are males with 2 vehicles (355, accounting for 39.7%) and females with 2 vehicles (259, making up 46.4%).
| Vehicles Available | Male | Female |
| No Vehicle | 34 (3.8%) | 19 (2.5%) |
| 1 Vehicle | 256 (28.6%) | 338 (44.2%) |
| 2 Vehicles | 355 (39.7%) | 259 (33.9%) |
| 3 Vehicles | 135 (15.1%) | 74 (9.7%) |
| 4 Vehicles | 32 (3.6%) | 21 (2.8%) |
| 5 or more Vehicles | 82 (9.2%) | 54 (7.1%) |
| Total | 894 (100.0%) | 765 (100.0%) |
Commute Time in Sloan
The most frequently occuring commute durations in Sloan are 15 to 19 minutes (374 commuters, 25.4%), 20 to 24 minutes (274 commuters, 18.6%), and 10 to 14 minutes (250 commuters, 17.0%).
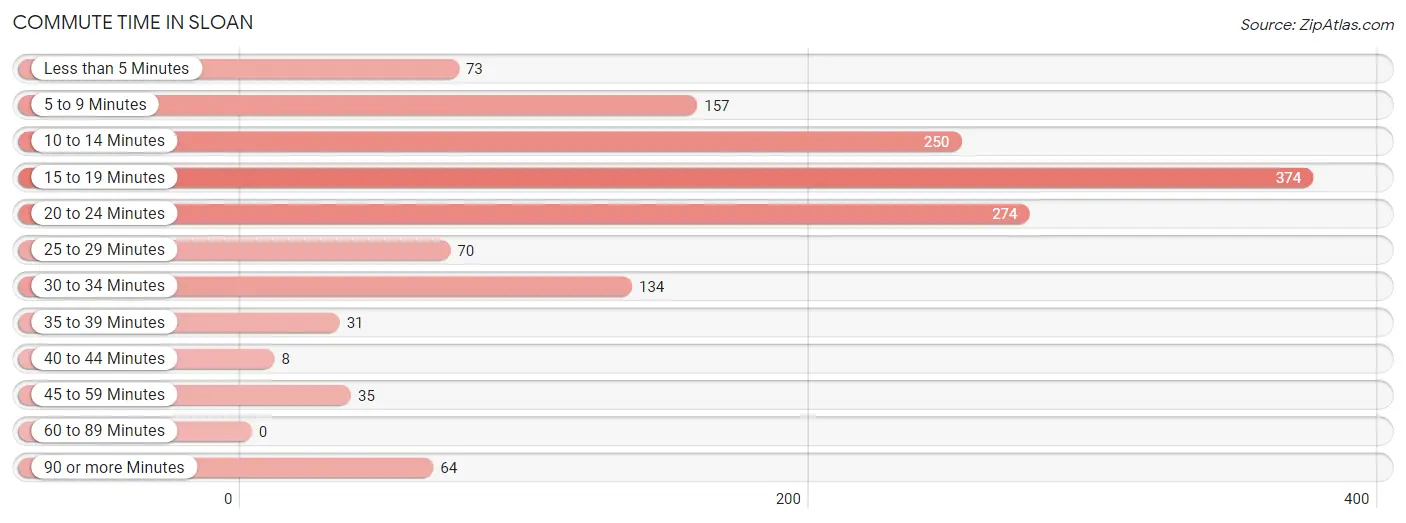
| Commute Time | # Commuters | % Commuters |
| Less than 5 Minutes | 73 | 5.0% |
| 5 to 9 Minutes | 157 | 10.7% |
| 10 to 14 Minutes | 250 | 17.0% |
| 15 to 19 Minutes | 374 | 25.4% |
| 20 to 24 Minutes | 274 | 18.6% |
| 25 to 29 Minutes | 70 | 4.8% |
| 30 to 34 Minutes | 134 | 9.1% |
| 35 to 39 Minutes | 31 | 2.1% |
| 40 to 44 Minutes | 8 | 0.5% |
| 45 to 59 Minutes | 35 | 2.4% |
| 60 to 89 Minutes | 0 | 0.0% |
| 90 or more Minutes | 64 | 4.3% |
Commute Time by Sex in Sloan
The most common commute times in Sloan are 15 to 19 minutes (190 commuters, 23.3%) for males and 15 to 19 minutes (184 commuters, 28.1%) for females.
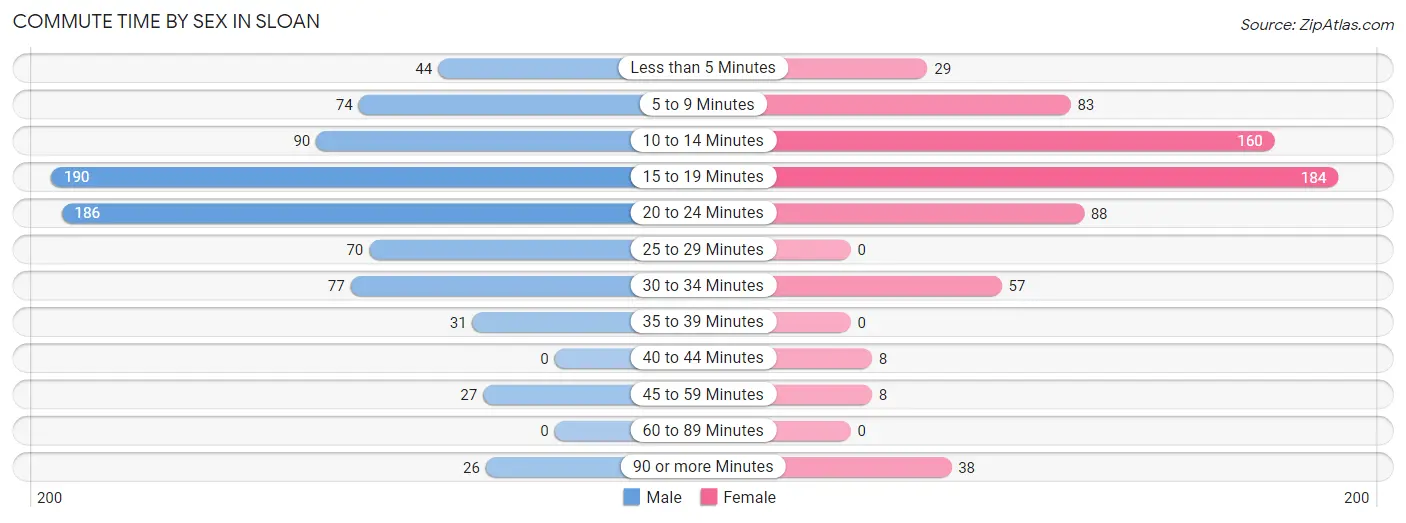
| Commute Time | Male | Female |
| Less than 5 Minutes | 44 (5.4%) | 29 (4.4%) |
| 5 to 9 Minutes | 74 (9.1%) | 83 (12.7%) |
| 10 to 14 Minutes | 90 (11.0%) | 160 (24.4%) |
| 15 to 19 Minutes | 190 (23.3%) | 184 (28.1%) |
| 20 to 24 Minutes | 186 (22.8%) | 88 (13.4%) |
| 25 to 29 Minutes | 70 (8.6%) | 0 (0.0%) |
| 30 to 34 Minutes | 77 (9.5%) | 57 (8.7%) |
| 35 to 39 Minutes | 31 (3.8%) | 0 (0.0%) |
| 40 to 44 Minutes | 0 (0.0%) | 8 (1.2%) |
| 45 to 59 Minutes | 27 (3.3%) | 8 (1.2%) |
| 60 to 89 Minutes | 0 (0.0%) | 0 (0.0%) |
| 90 or more Minutes | 26 (3.2%) | 38 (5.8%) |
Time of Departure to Work by Sex in Sloan
The most frequent times of departure to work in Sloan are 7:00 AM to 7:29 AM (207, 25.4%) for males and 7:30 AM to 7:59 AM (110, 16.8%) for females.
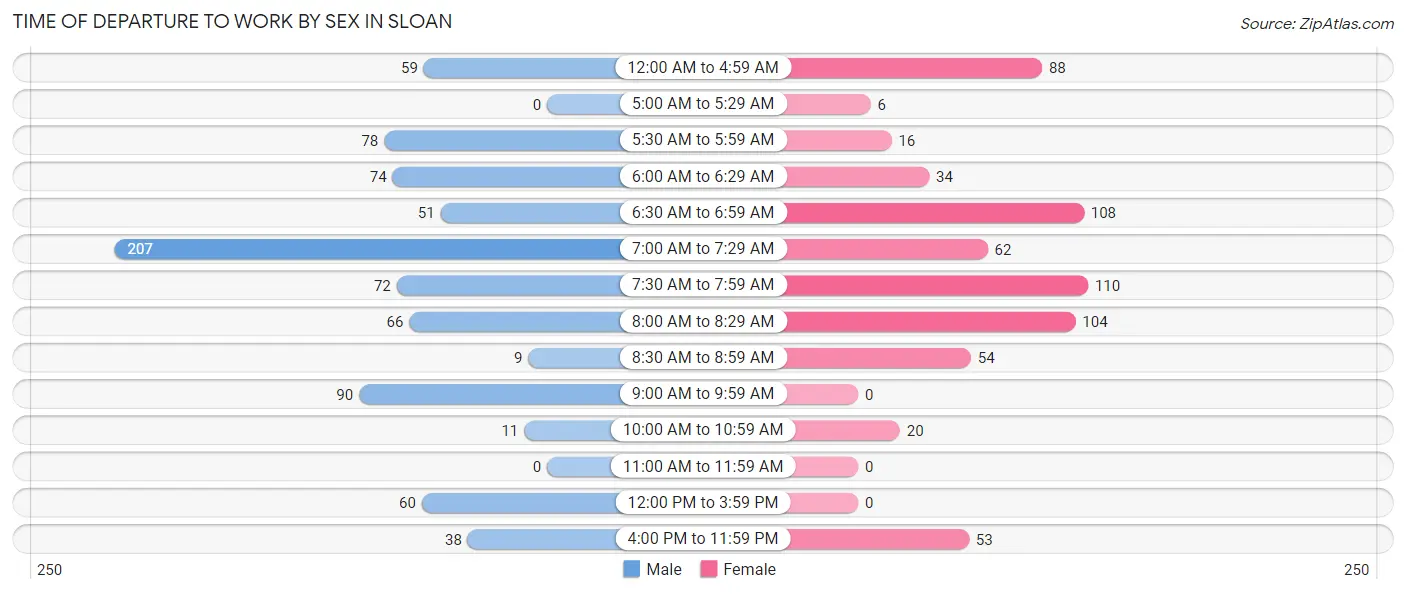
| Time of Departure | Male | Female |
| 12:00 AM to 4:59 AM | 59 (7.2%) | 88 (13.4%) |
| 5:00 AM to 5:29 AM | 0 (0.0%) | 6 (0.9%) |
| 5:30 AM to 5:59 AM | 78 (9.6%) | 16 (2.4%) |
| 6:00 AM to 6:29 AM | 74 (9.1%) | 34 (5.2%) |
| 6:30 AM to 6:59 AM | 51 (6.3%) | 108 (16.5%) |
| 7:00 AM to 7:29 AM | 207 (25.4%) | 62 (9.5%) |
| 7:30 AM to 7:59 AM | 72 (8.8%) | 110 (16.8%) |
| 8:00 AM to 8:29 AM | 66 (8.1%) | 104 (15.9%) |
| 8:30 AM to 8:59 AM | 9 (1.1%) | 54 (8.2%) |
| 9:00 AM to 9:59 AM | 90 (11.0%) | 0 (0.0%) |
| 10:00 AM to 10:59 AM | 11 (1.3%) | 20 (3.0%) |
| 11:00 AM to 11:59 AM | 0 (0.0%) | 0 (0.0%) |
| 12:00 PM to 3:59 PM | 60 (7.4%) | 0 (0.0%) |
| 4:00 PM to 11:59 PM | 38 (4.7%) | 53 (8.1%) |
| Total | 815 (100.0%) | 655 (100.0%) |
Housing Occupancy in Sloan
Occupancy by Ownership in Sloan
Of the total 1,667 dwellings in Sloan, owner-occupied units account for 1,209 (72.5%), while renter-occupied units make up 458 (27.5%).
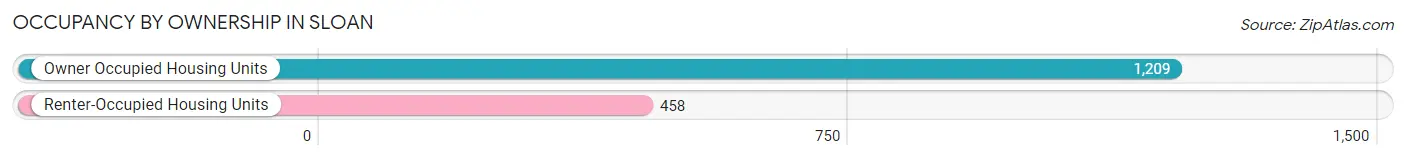
| Occupancy | # Housing Units | % Housing Units |
| Owner Occupied Housing Units | 1,209 | 72.5% |
| Renter-Occupied Housing Units | 458 | 27.5% |
| Total Occupied Housing Units | 1,667 | 100.0% |
Occupancy by Household Size in Sloan
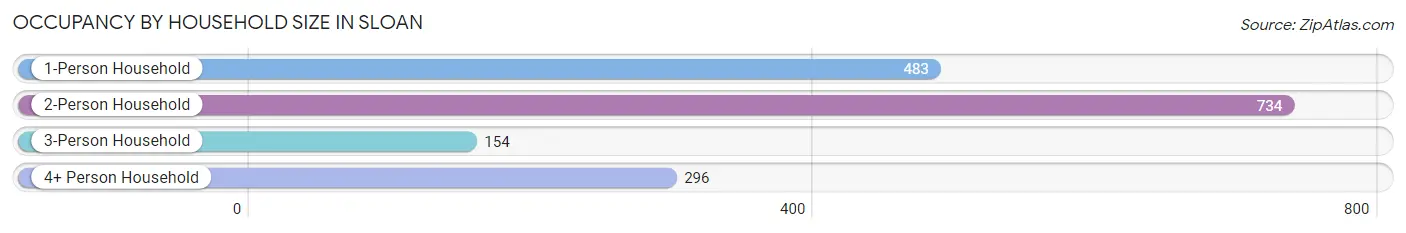
| Household Size | # Housing Units | % Housing Units |
| 1-Person Household | 483 | 29.0% |
| 2-Person Household | 734 | 44.0% |
| 3-Person Household | 154 | 9.2% |
| 4+ Person Household | 296 | 17.8% |
| Total Housing Units | 1,667 | 100.0% |
Occupancy by Ownership by Household Size in Sloan
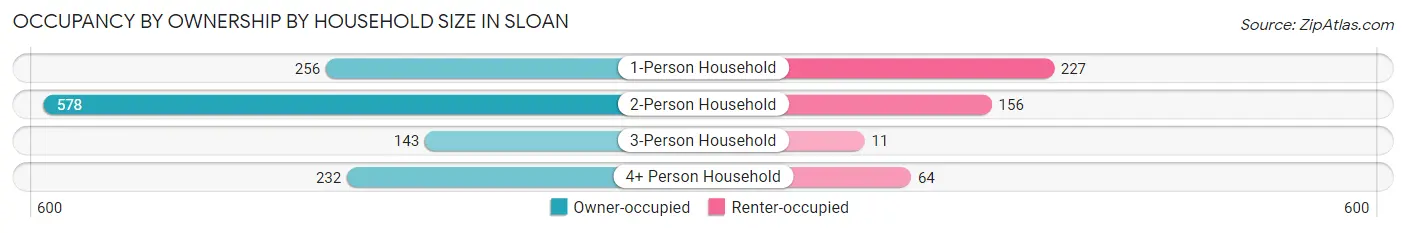
| Household Size | Owner-occupied | Renter-occupied |
| 1-Person Household | 256 (53.0%) | 227 (47.0%) |
| 2-Person Household | 578 (78.7%) | 156 (21.2%) |
| 3-Person Household | 143 (92.9%) | 11 (7.1%) |
| 4+ Person Household | 232 (78.4%) | 64 (21.6%) |
| Total Housing Units | 1,209 (72.5%) | 458 (27.5%) |
Occupancy by Educational Attainment in Sloan
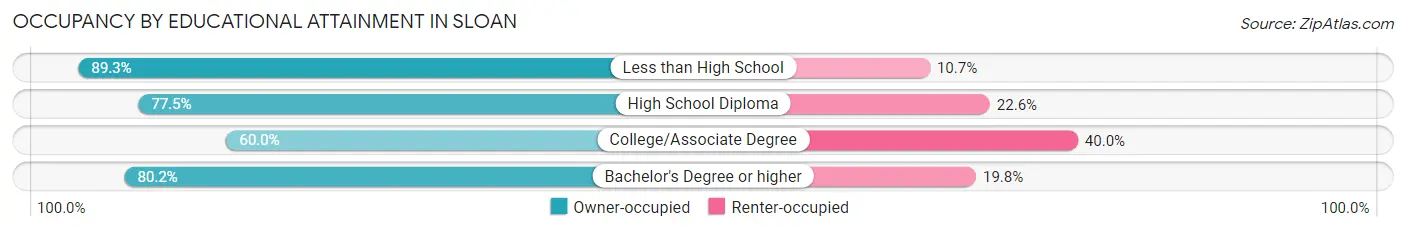
| Household Size | Owner-occupied | Renter-occupied |
| Less than High School | 67 (89.3%) | 8 (10.7%) |
| High School Diploma | 467 (77.4%) | 136 (22.6%) |
| College/Associate Degree | 351 (60.0%) | 234 (40.0%) |
| Bachelor's Degree or higher | 324 (80.2%) | 80 (19.8%) |
Occupancy by Age of Householder in Sloan
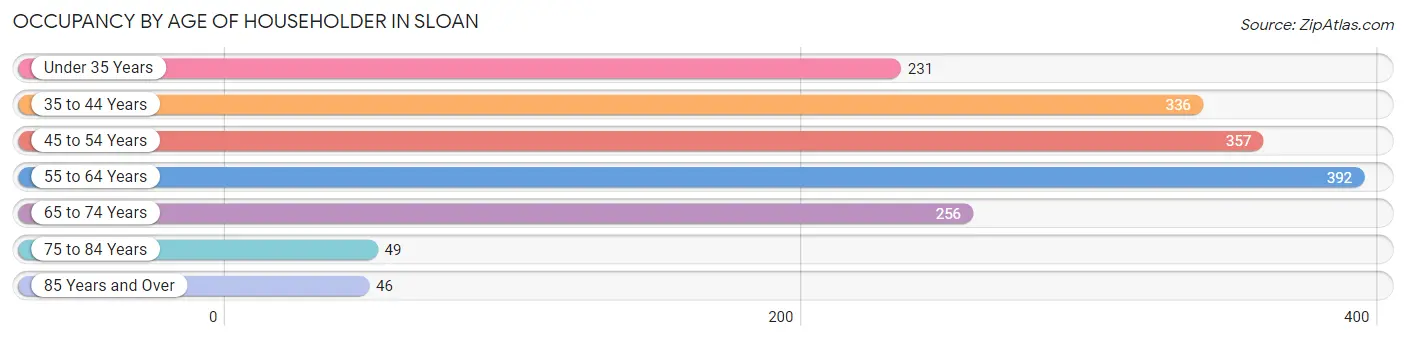
| Age Bracket | # Households | % Households |
| Under 35 Years | 231 | 13.9% |
| 35 to 44 Years | 336 | 20.2% |
| 45 to 54 Years | 357 | 21.4% |
| 55 to 64 Years | 392 | 23.5% |
| 65 to 74 Years | 256 | 15.4% |
| 75 to 84 Years | 49 | 2.9% |
| 85 Years and Over | 46 | 2.8% |
| Total | 1,667 | 100.0% |
Housing Finances in Sloan
Median Income by Occupancy in Sloan
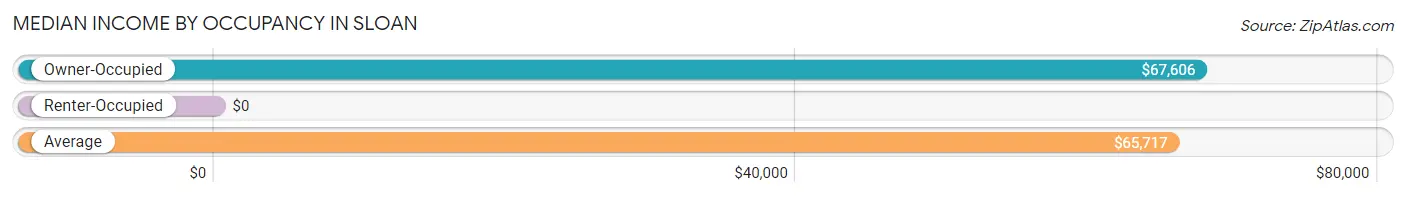
| Occupancy Type | # Households | Median Income |
| Owner-Occupied | 1,209 (72.5%) | $67,606 |
| Renter-Occupied | 458 (27.5%) | $0 |
| Average | 1,667 (100.0%) | $65,717 |
Occupancy by Householder Income Bracket in Sloan
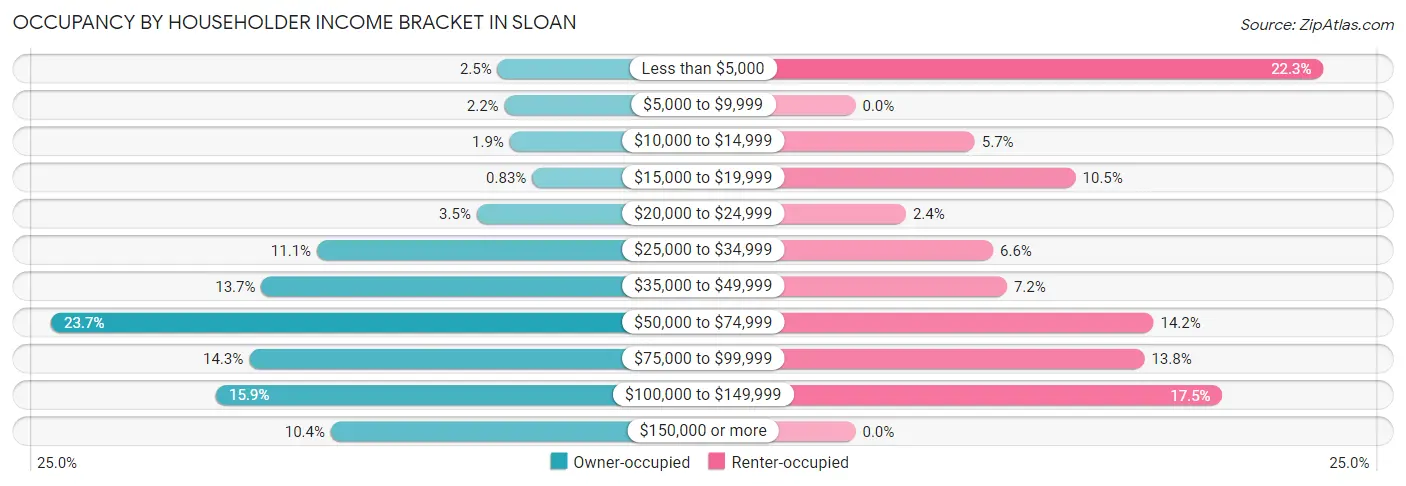
| Income Bracket | Owner-occupied | Renter-occupied |
| Less than $5,000 | 30 (2.5%) | 102 (22.3%) |
| $5,000 to $9,999 | 26 (2.1%) | 0 (0.0%) |
| $10,000 to $14,999 | 23 (1.9%) | 26 (5.7%) |
| $15,000 to $19,999 | 10 (0.8%) | 48 (10.5%) |
| $20,000 to $24,999 | 42 (3.5%) | 11 (2.4%) |
| $25,000 to $34,999 | 134 (11.1%) | 30 (6.6%) |
| $35,000 to $49,999 | 166 (13.7%) | 33 (7.2%) |
| $50,000 to $74,999 | 287 (23.7%) | 65 (14.2%) |
| $75,000 to $99,999 | 173 (14.3%) | 63 (13.8%) |
| $100,000 to $149,999 | 192 (15.9%) | 80 (17.5%) |
| $150,000 or more | 126 (10.4%) | 0 (0.0%) |
| Total | 1,209 (100.0%) | 458 (100.0%) |
Monthly Housing Cost Tiers in Sloan
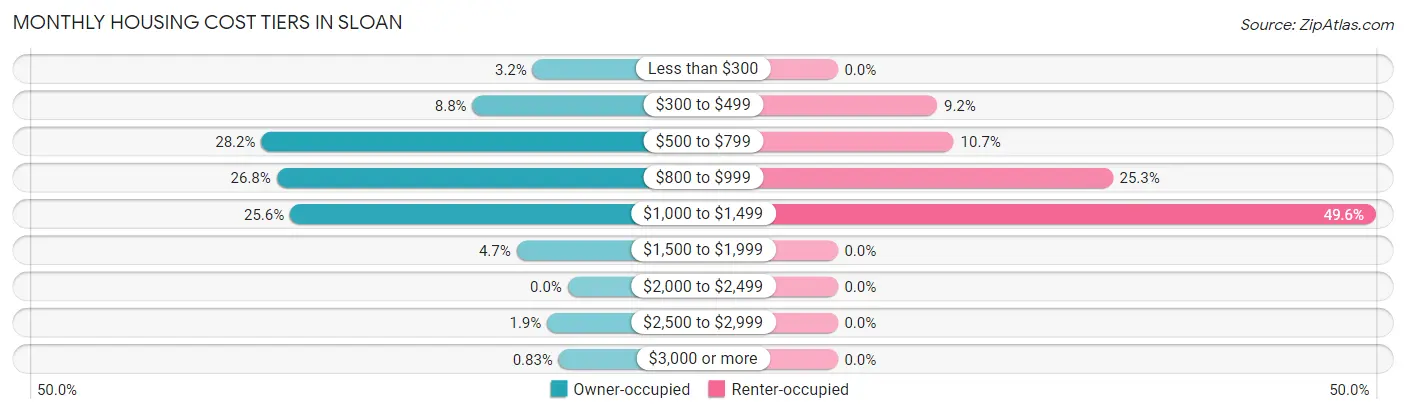
| Monthly Cost | Owner-occupied | Renter-occupied |
| Less than $300 | 39 (3.2%) | 0 (0.0%) |
| $300 to $499 | 106 (8.8%) | 42 (9.2%) |
| $500 to $799 | 341 (28.2%) | 49 (10.7%) |
| $800 to $999 | 324 (26.8%) | 116 (25.3%) |
| $1,000 to $1,499 | 309 (25.6%) | 227 (49.6%) |
| $1,500 to $1,999 | 57 (4.7%) | 0 (0.0%) |
| $2,000 to $2,499 | 0 (0.0%) | 0 (0.0%) |
| $2,500 to $2,999 | 23 (1.9%) | 0 (0.0%) |
| $3,000 or more | 10 (0.8%) | 0 (0.0%) |
| Total | 1,209 (100.0%) | 458 (100.0%) |
Physical Housing Characteristics in Sloan
Housing Structures in Sloan
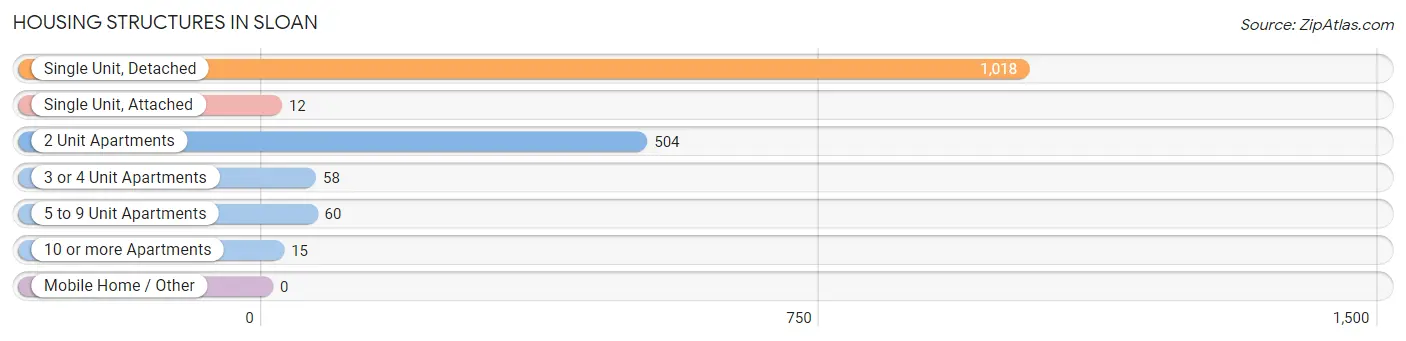
| Structure Type | # Housing Units | % Housing Units |
| Single Unit, Detached | 1,018 | 61.1% |
| Single Unit, Attached | 12 | 0.7% |
| 2 Unit Apartments | 504 | 30.2% |
| 3 or 4 Unit Apartments | 58 | 3.5% |
| 5 to 9 Unit Apartments | 60 | 3.6% |
| 10 or more Apartments | 15 | 0.9% |
| Mobile Home / Other | 0 | 0.0% |
| Total | 1,667 | 100.0% |
Housing Structures by Occupancy in Sloan
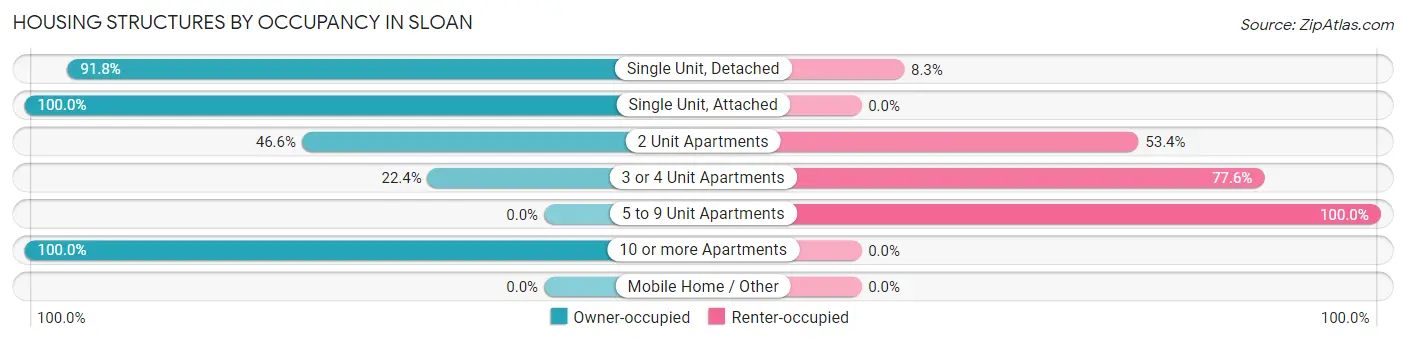
| Structure Type | Owner-occupied | Renter-occupied |
| Single Unit, Detached | 934 (91.7%) | 84 (8.3%) |
| Single Unit, Attached | 12 (100.0%) | 0 (0.0%) |
| 2 Unit Apartments | 235 (46.6%) | 269 (53.4%) |
| 3 or 4 Unit Apartments | 13 (22.4%) | 45 (77.6%) |
| 5 to 9 Unit Apartments | 0 (0.0%) | 60 (100.0%) |
| 10 or more Apartments | 15 (100.0%) | 0 (0.0%) |
| Mobile Home / Other | 0 (0.0%) | 0 (0.0%) |
| Total | 1,209 (72.5%) | 458 (27.5%) |
Housing Structures by Number of Rooms in Sloan
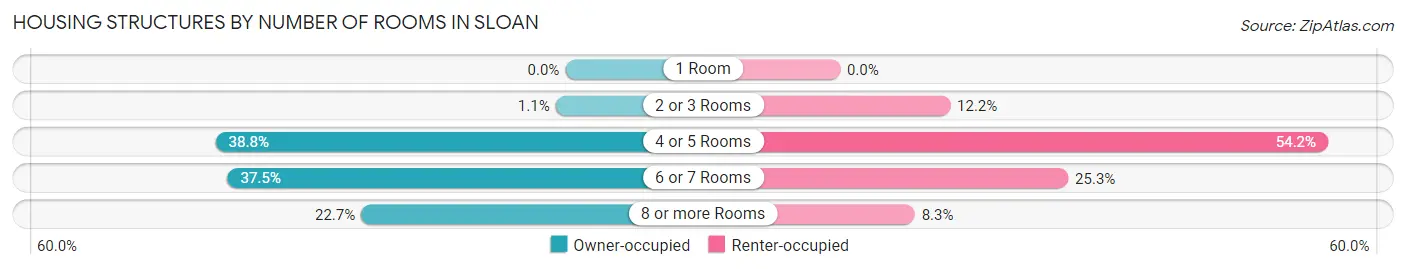
| Number of Rooms | Owner-occupied | Renter-occupied |
| 1 Room | 0 (0.0%) | 0 (0.0%) |
| 2 or 3 Rooms | 13 (1.1%) | 56 (12.2%) |
| 4 or 5 Rooms | 469 (38.8%) | 248 (54.1%) |
| 6 or 7 Rooms | 453 (37.5%) | 116 (25.3%) |
| 8 or more Rooms | 274 (22.7%) | 38 (8.3%) |
| Total | 1,209 (100.0%) | 458 (100.0%) |
Housing Structure by Heating Type in Sloan
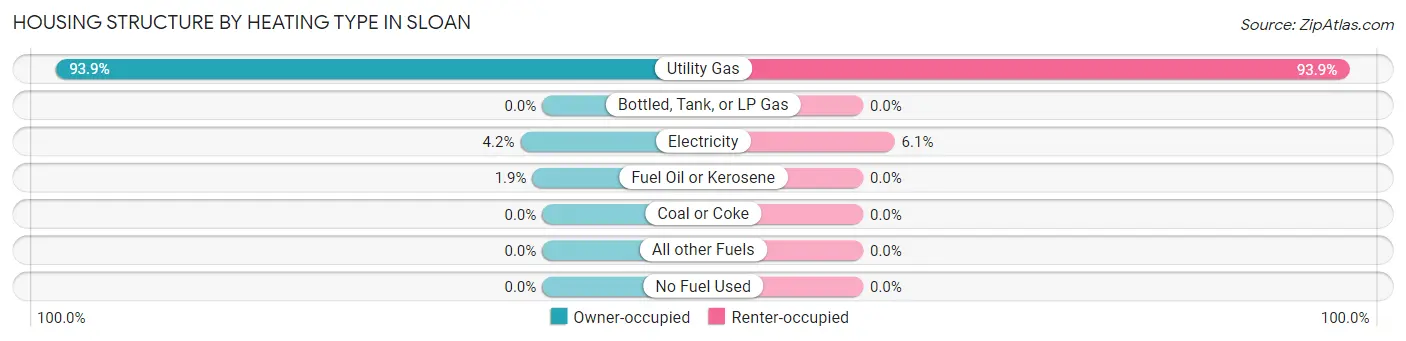
| Heating Type | Owner-occupied | Renter-occupied |
| Utility Gas | 1,135 (93.9%) | 430 (93.9%) |
| Bottled, Tank, or LP Gas | 0 (0.0%) | 0 (0.0%) |
| Electricity | 51 (4.2%) | 28 (6.1%) |
| Fuel Oil or Kerosene | 23 (1.9%) | 0 (0.0%) |
| Coal or Coke | 0 (0.0%) | 0 (0.0%) |
| All other Fuels | 0 (0.0%) | 0 (0.0%) |
| No Fuel Used | 0 (0.0%) | 0 (0.0%) |
| Total | 1,209 (100.0%) | 458 (100.0%) |
Household Vehicle Usage in Sloan
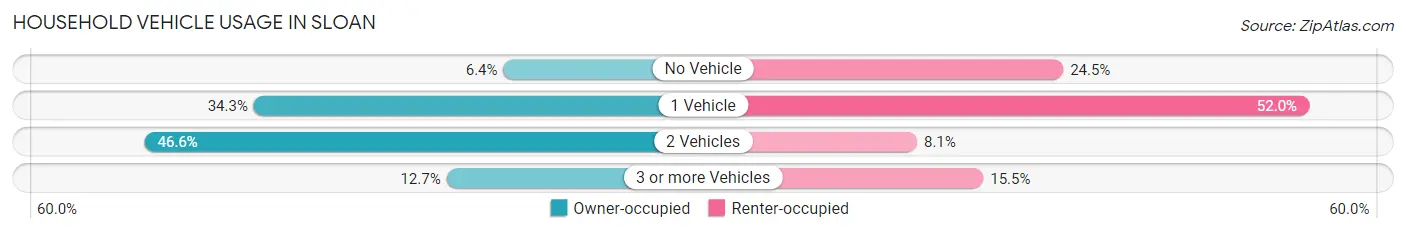
| Vehicles per Household | Owner-occupied | Renter-occupied |
| No Vehicle | 77 (6.4%) | 112 (24.4%) |
| 1 Vehicle | 415 (34.3%) | 238 (52.0%) |
| 2 Vehicles | 563 (46.6%) | 37 (8.1%) |
| 3 or more Vehicles | 154 (12.7%) | 71 (15.5%) |
| Total | 1,209 (100.0%) | 458 (100.0%) |
Real Estate & Mortgages in Sloan
Real Estate and Mortgage Overview in Sloan
| Characteristic | Without Mortgage | With Mortgage |
| Housing Units | 510 | 699 |
| Median Property Value | $112,400 | $103,900 |
| Median Household Income | $69,688 | $75 |
| Monthly Housing Costs | $624 | $10 |
| Real Estate Taxes | $3,513 | $0 |
Property Value by Mortgage Status in Sloan
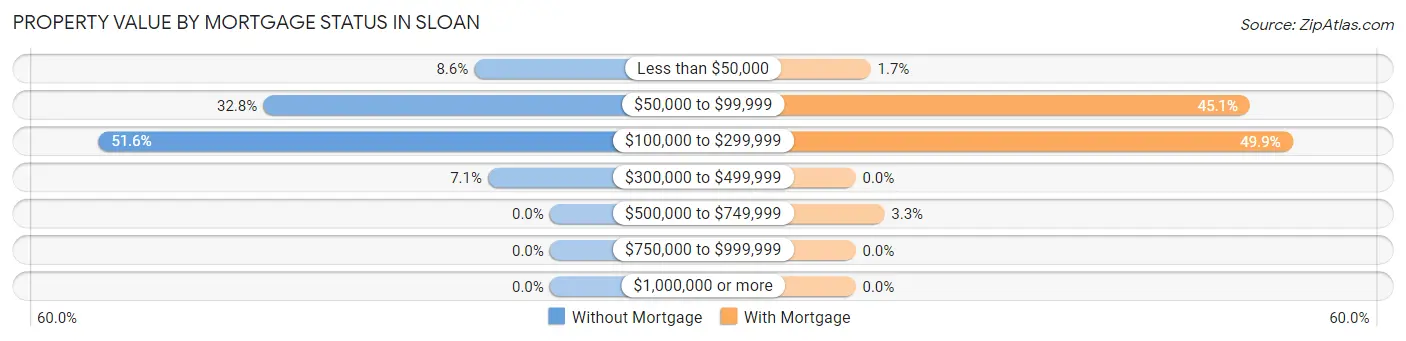
| Property Value | Without Mortgage | With Mortgage |
| Less than $50,000 | 44 (8.6%) | 12 (1.7%) |
| $50,000 to $99,999 | 167 (32.8%) | 315 (45.1%) |
| $100,000 to $299,999 | 263 (51.6%) | 349 (49.9%) |
| $300,000 to $499,999 | 36 (7.1%) | 0 (0.0%) |
| $500,000 to $749,999 | 0 (0.0%) | 23 (3.3%) |
| $750,000 to $999,999 | 0 (0.0%) | 0 (0.0%) |
| $1,000,000 or more | 0 (0.0%) | 0 (0.0%) |
| Total | 510 (100.0%) | 699 (100.0%) |
Household Income by Mortgage Status in Sloan
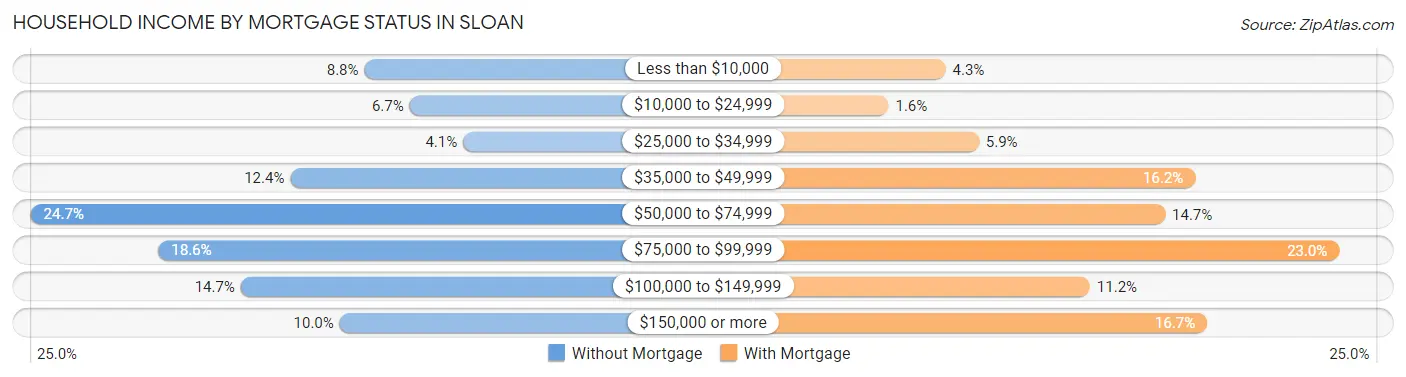
| Household Income | Without Mortgage | With Mortgage |
| Less than $10,000 | 45 (8.8%) | 30 (4.3%) |
| $10,000 to $24,999 | 34 (6.7%) | 11 (1.6%) |
| $25,000 to $34,999 | 21 (4.1%) | 41 (5.9%) |
| $35,000 to $49,999 | 63 (12.3%) | 113 (16.2%) |
| $50,000 to $74,999 | 126 (24.7%) | 103 (14.7%) |
| $75,000 to $99,999 | 95 (18.6%) | 161 (23.0%) |
| $100,000 to $149,999 | 75 (14.7%) | 78 (11.2%) |
| $150,000 or more | 51 (10.0%) | 117 (16.7%) |
| Total | 510 (100.0%) | 699 (100.0%) |
Property Value to Household Income Ratio in Sloan
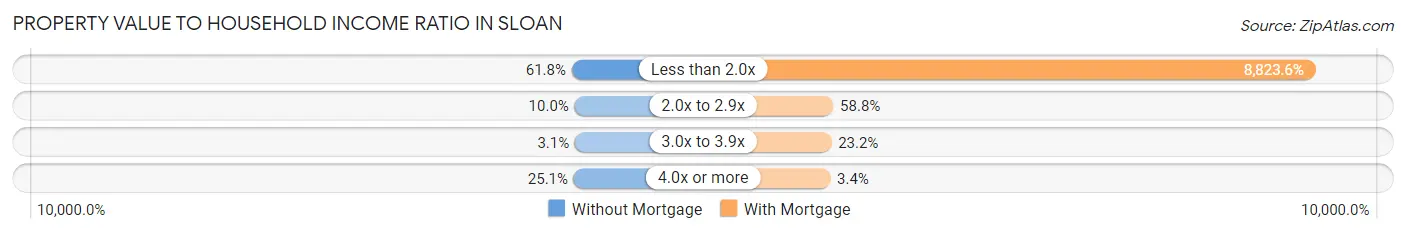
| Value-to-Income Ratio | Without Mortgage | With Mortgage |
| Less than 2.0x | 315 (61.8%) | 61,677 (8,823.6%) |
| 2.0x to 2.9x | 51 (10.0%) | 411 (58.8%) |
| 3.0x to 3.9x | 16 (3.1%) | 162 (23.2%) |
| 4.0x or more | 128 (25.1%) | 24 (3.4%) |
| Total | 510 (100.0%) | 699 (100.0%) |
Real Estate Taxes by Mortgage Status in Sloan
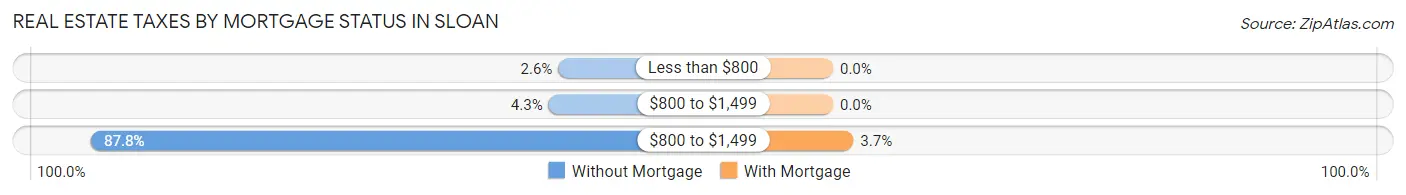
| Property Taxes | Without Mortgage | With Mortgage |
| Less than $800 | 13 (2.5%) | 0 (0.0%) |
| $800 to $1,499 | 22 (4.3%) | 0 (0.0%) |
| $800 to $1,499 | 448 (87.8%) | 26 (3.7%) |
| Total | 510 (100.0%) | 699 (100.0%) |
Health & Disability in Sloan
Health Insurance Coverage by Age in Sloan
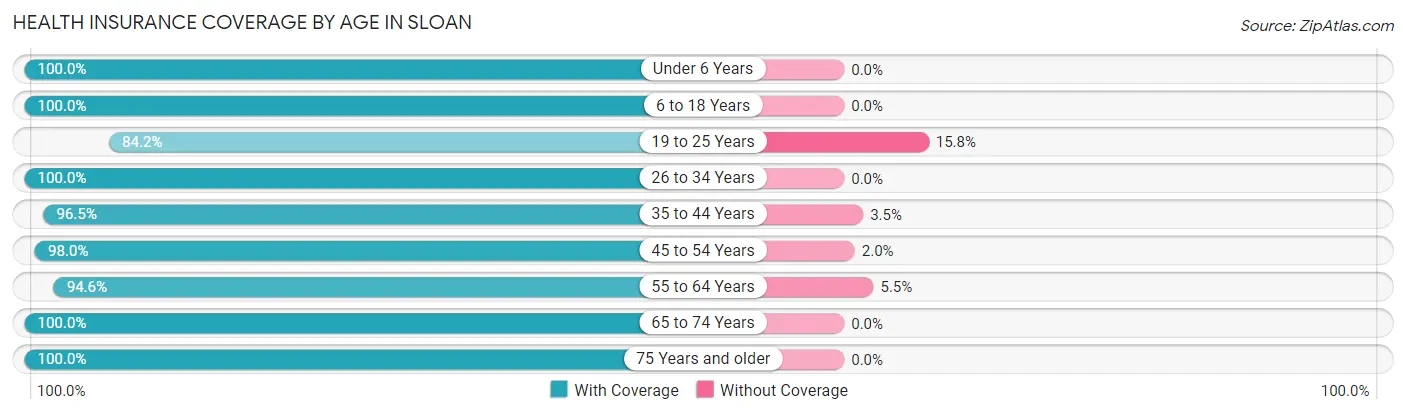
| Age Bracket | With Coverage | Without Coverage |
| Under 6 Years | 196 (100.0%) | 0 (0.0%) |
| 6 to 18 Years | 478 (100.0%) | 0 (0.0%) |
| 19 to 25 Years | 294 (84.2%) | 55 (15.8%) |
| 26 to 34 Years | 383 (100.0%) | 0 (0.0%) |
| 35 to 44 Years | 520 (96.5%) | 19 (3.5%) |
| 45 to 54 Years | 547 (98.0%) | 11 (2.0%) |
| 55 to 64 Years | 625 (94.6%) | 36 (5.4%) |
| 65 to 74 Years | 458 (100.0%) | 0 (0.0%) |
| 75 Years and older | 140 (100.0%) | 0 (0.0%) |
| Total | 3,641 (96.8%) | 121 (3.2%) |
Health Insurance Coverage by Citizenship Status in Sloan
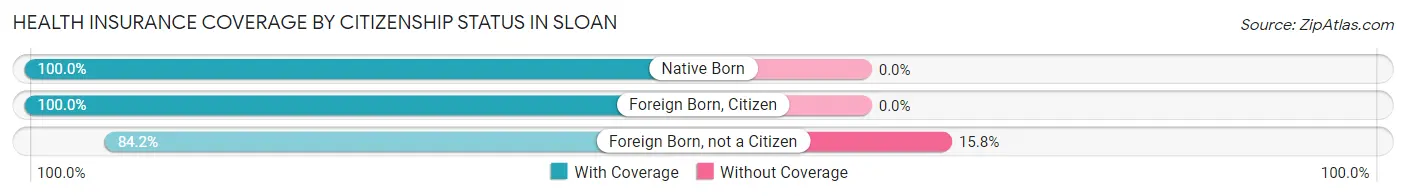
| Citizenship Status | With Coverage | Without Coverage |
| Native Born | 196 (100.0%) | 0 (0.0%) |
| Foreign Born, Citizen | 478 (100.0%) | 0 (0.0%) |
| Foreign Born, not a Citizen | 294 (84.2%) | 55 (15.8%) |
Health Insurance Coverage by Household Income in Sloan
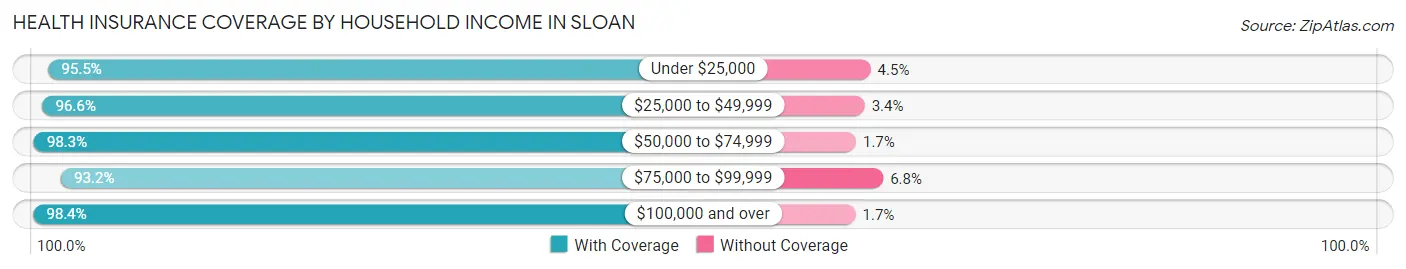
| Household Income | With Coverage | Without Coverage |
| Under $25,000 | 449 (95.5%) | 21 (4.5%) |
| $25,000 to $49,999 | 747 (96.6%) | 26 (3.4%) |
| $50,000 to $74,999 | 681 (98.3%) | 12 (1.7%) |
| $75,000 to $99,999 | 573 (93.2%) | 42 (6.8%) |
| $100,000 and over | 1,191 (98.4%) | 20 (1.7%) |
Public vs Private Health Insurance Coverage by Age in Sloan
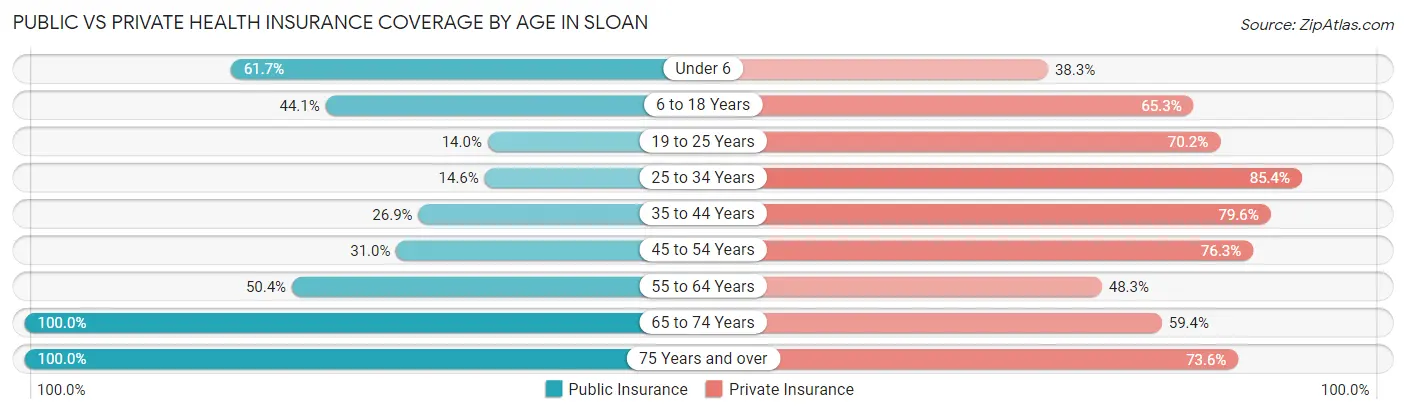
| Age Bracket | Public Insurance | Private Insurance |
| Under 6 | 121 (61.7%) | 75 (38.3%) |
| 6 to 18 Years | 211 (44.1%) | 312 (65.3%) |
| 19 to 25 Years | 49 (14.0%) | 245 (70.2%) |
| 25 to 34 Years | 56 (14.6%) | 327 (85.4%) |
| 35 to 44 Years | 145 (26.9%) | 429 (79.6%) |
| 45 to 54 Years | 173 (31.0%) | 426 (76.3%) |
| 55 to 64 Years | 333 (50.4%) | 319 (48.3%) |
| 65 to 74 Years | 458 (100.0%) | 272 (59.4%) |
| 75 Years and over | 140 (100.0%) | 103 (73.6%) |
| Total | 1,686 (44.8%) | 2,508 (66.7%) |
Disability Status by Sex by Age in Sloan
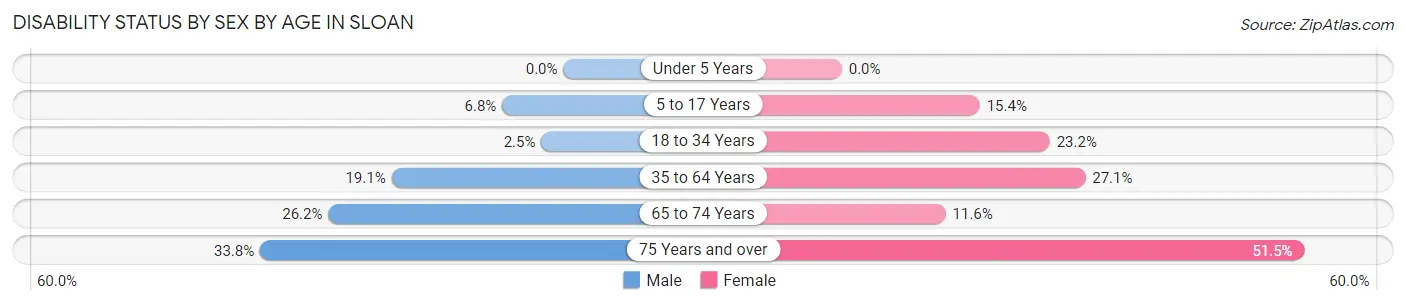
| Age Bracket | Male | Female |
| Under 5 Years | 0 (0.0%) | 0 (0.0%) |
| 5 to 17 Years | 13 (6.8%) | 45 (15.4%) |
| 18 to 34 Years | 12 (2.5%) | 63 (23.2%) |
| 35 to 64 Years | 165 (19.1%) | 243 (27.1%) |
| 65 to 74 Years | 61 (26.2%) | 26 (11.6%) |
| 75 Years and over | 25 (33.8%) | 34 (51.5%) |
Disability Class by Sex by Age in Sloan
Disability Class: Hearing Difficulty
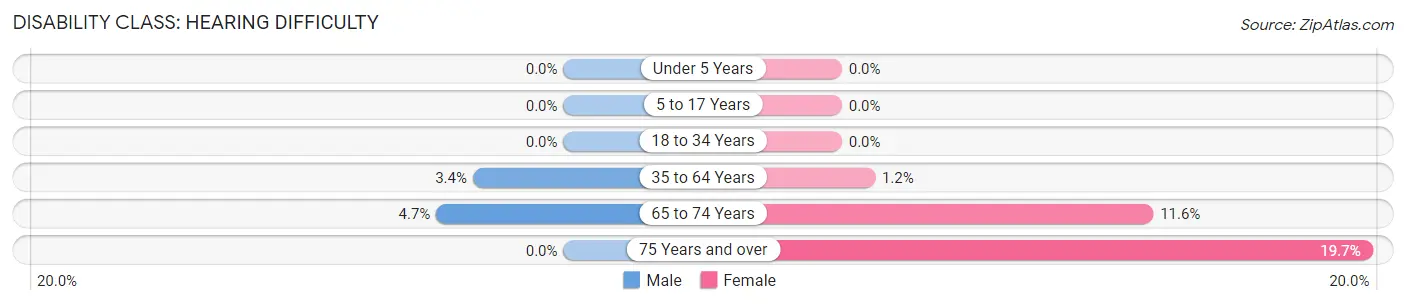
| Age Bracket | Male | Female |
| Under 5 Years | 0 (0.0%) | 0 (0.0%) |
| 5 to 17 Years | 0 (0.0%) | 0 (0.0%) |
| 18 to 34 Years | 0 (0.0%) | 0 (0.0%) |
| 35 to 64 Years | 29 (3.4%) | 11 (1.2%) |
| 65 to 74 Years | 11 (4.7%) | 26 (11.6%) |
| 75 Years and over | 0 (0.0%) | 13 (19.7%) |
Disability Class: Vision Difficulty
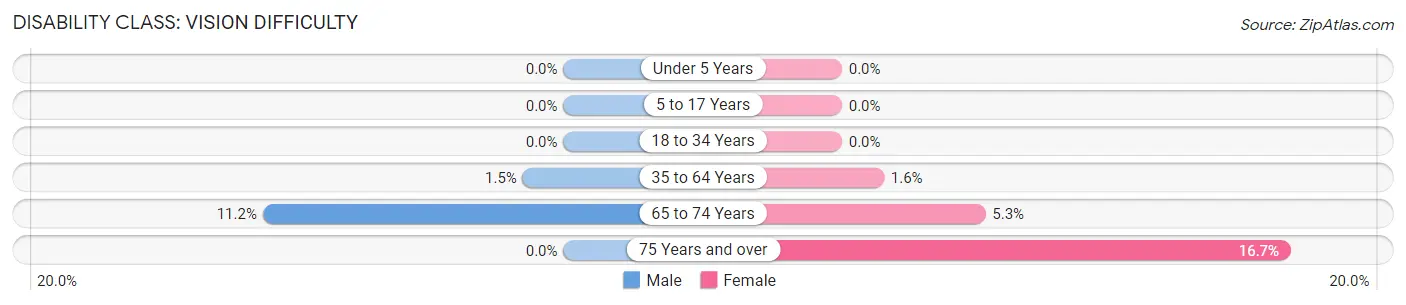
| Age Bracket | Male | Female |
| Under 5 Years | 0 (0.0%) | 0 (0.0%) |
| 5 to 17 Years | 0 (0.0%) | 0 (0.0%) |
| 18 to 34 Years | 0 (0.0%) | 0 (0.0%) |
| 35 to 64 Years | 13 (1.5%) | 14 (1.6%) |
| 65 to 74 Years | 26 (11.2%) | 12 (5.3%) |
| 75 Years and over | 0 (0.0%) | 11 (16.7%) |
Disability Class: Cognitive Difficulty
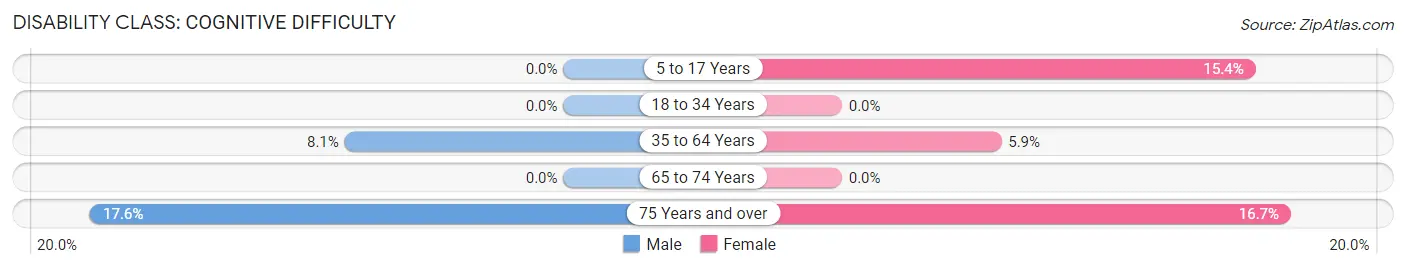
| Age Bracket | Male | Female |
| 5 to 17 Years | 0 (0.0%) | 45 (15.4%) |
| 18 to 34 Years | 0 (0.0%) | 0 (0.0%) |
| 35 to 64 Years | 70 (8.1%) | 53 (5.9%) |
| 65 to 74 Years | 0 (0.0%) | 0 (0.0%) |
| 75 Years and over | 13 (17.6%) | 11 (16.7%) |
Disability Class: Ambulatory Difficulty
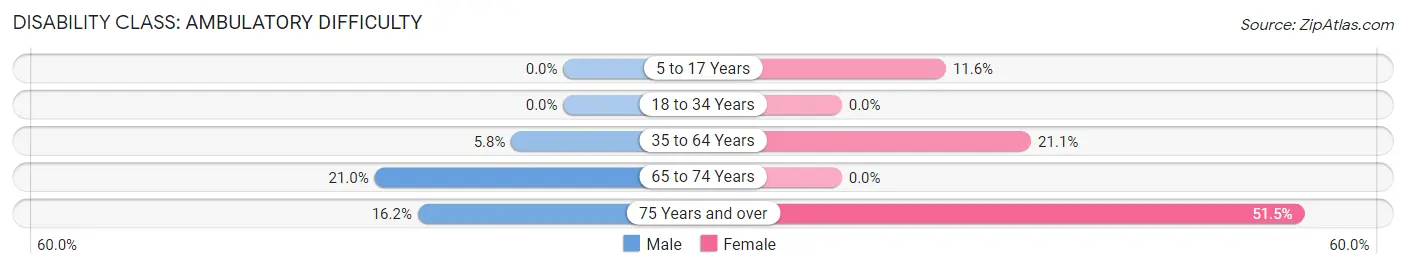
| Age Bracket | Male | Female |
| 5 to 17 Years | 0 (0.0%) | 34 (11.6%) |
| 18 to 34 Years | 0 (0.0%) | 0 (0.0%) |
| 35 to 64 Years | 50 (5.8%) | 189 (21.1%) |
| 65 to 74 Years | 49 (21.0%) | 0 (0.0%) |
| 75 Years and over | 12 (16.2%) | 34 (51.5%) |
Disability Class: Self-Care Difficulty
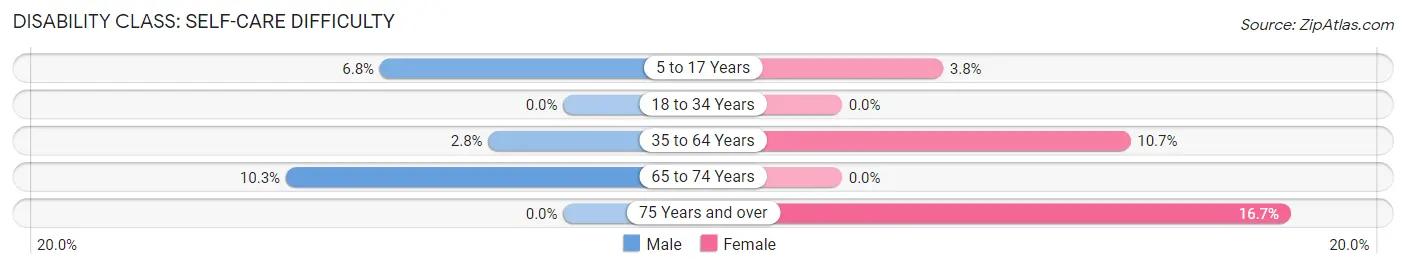
| Age Bracket | Male | Female |
| 5 to 17 Years | 13 (6.8%) | 11 (3.7%) |
| 18 to 34 Years | 0 (0.0%) | 0 (0.0%) |
| 35 to 64 Years | 24 (2.8%) | 96 (10.7%) |
| 65 to 74 Years | 24 (10.3%) | 0 (0.0%) |
| 75 Years and over | 0 (0.0%) | 11 (16.7%) |
Technology Access in Sloan
Computing Device Access in Sloan
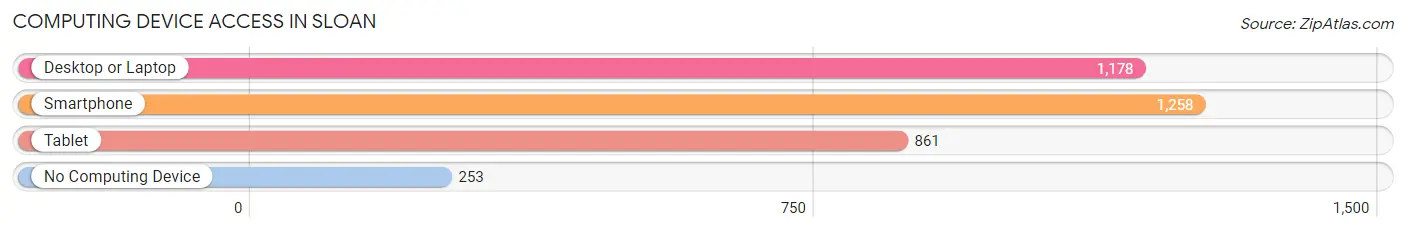
| Device Type | # Households | % Households |
| Desktop or Laptop | 1,178 | 70.7% |
| Smartphone | 1,258 | 75.5% |
| Tablet | 861 | 51.6% |
| No Computing Device | 253 | 15.2% |
| Total | 1,667 | 100.0% |
Internet Access in Sloan
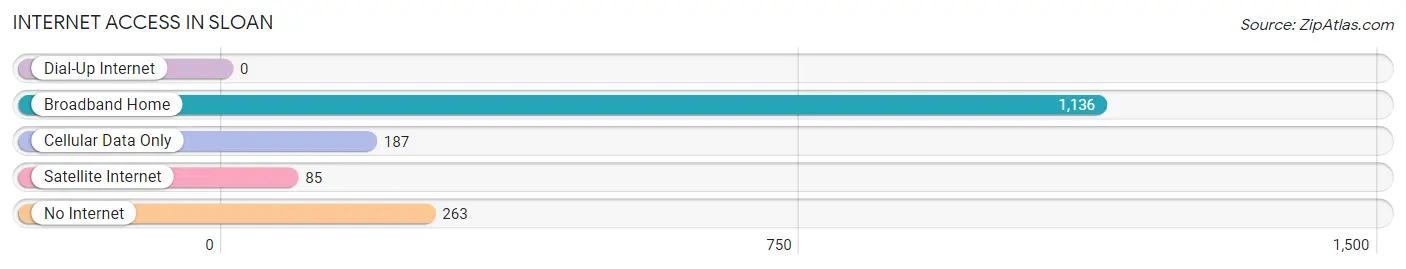
| Internet Type | # Households | % Households |
| Dial-Up Internet | 0 | 0.0% |
| Broadband Home | 1,136 | 68.1% |
| Cellular Data Only | 187 | 11.2% |
| Satellite Internet | 85 | 5.1% |
| No Internet | 263 | 15.8% |
| Total | 1,667 | 100.0% |
Sloan Summary
Sloan is a small town located in the state of New York. It is situated in the western part of the state, in the county of Erie. The town has a population of approximately 4,000 people, and is part of the Buffalo-Niagara Falls metropolitan area.
History
Sloan was first settled in 1820 by a group of settlers from Connecticut. The town was named after the family of William Sloan, who was one of the original settlers. The town was officially incorporated in 1851.
In the late 19th century, Sloan was a major center for the production of furniture. The town was also home to several factories that produced a variety of products, including paper, leather goods, and clothing.
Geography
Sloan is located in the western part of New York, in the county of Erie. The town is situated on the Niagara River, and is bordered by the towns of Amherst, Cheektowaga, and Tonawanda. The town has a total area of 4.2 square miles, all of which is land.
Economy
Sloan’s economy is largely based on manufacturing and retail. The town is home to several factories that produce a variety of products, including paper, leather goods, and clothing. The town also has several retail stores, including a grocery store, a hardware store, and a pharmacy.
Demographics
As of the 2010 census, the population of Sloan was 4,000. The racial makeup of the town was 94.3% White, 2.2% African American, 0.3% Native American, 0.7% Asian, 0.1% Pacific Islander, and 2.4% from other races. The median household income was $45,000, and the median family income was $50,000.
Conclusion
Sloan is a small town located in the western part of New York. It has a population of approximately 4,000 people, and is part of the Buffalo-Niagara Falls metropolitan area. The town’s economy is largely based on manufacturing and retail, and the town is home to several factories that produce a variety of products. The racial makeup of the town is 94.3% White, 2.2% African American, 0.3% Native American, 0.7% Asian, 0.1% Pacific Islander, and 2.4% from other races. The median household income was $45,000, and the median family income was $50,000.
Common Questions
What is Per Capita Income in Sloan?
Per Capita income in Sloan is $33,817.
What is the Median Family Income in Sloan?
Median Family Income in Sloan is $67,373.
What is the Median Household income in Sloan?
Median Household Income in Sloan is $65,717.
What is Income or Wage Gap in Sloan?
Income or Wage Gap in Sloan is 2.4%.
Women in Sloan earn 97.6 cents for every dollar earned by a man.
What is Inequality or Gini Index in Sloan?
Inequality or Gini Index in Sloan is 0.43.
What is the Total Population of Sloan?
Total Population of Sloan is 3,762.
What is the Total Male Population of Sloan?
Total Male Population of Sloan is 1,917.
What is the Total Female Population of Sloan?
Total Female Population of Sloan is 1,845.
What is the Ratio of Males per 100 Females in Sloan?
There are 103.90 Males per 100 Females in Sloan.
What is the Ratio of Females per 100 Males in Sloan?
There are 96.24 Females per 100 Males in Sloan.
What is the Median Population Age in Sloan?
Median Population Age in Sloan is 43.1 Years.
What is the Average Family Size in Sloan
Average Family Size in Sloan is 2.7 People.
What is the Average Household Size in Sloan
Average Household Size in Sloan is 2.3 People.
How Large is the Labor Force in Sloan?
There are 1,914 People in the Labor Forcein in Sloan.
What is the Percentage of People in the Labor Force in Sloan?
60.2% of People are in the Labor Force in Sloan.
What is the Unemployment Rate in Sloan?
Unemployment Rate in Sloan is 3.2%.