Sinclairville, NY Map & Demographics
Sinclairville Map
Sinclairville Overview
$22,415
PER CAPITA INCOME
$67,778
AVG FAMILY INCOME
$38,750
AVG HOUSEHOLD INCOME
20.0%
WAGE / INCOME GAP [ % ]
80.0¢/ $1
WAGE / INCOME GAP [ $ ]
0.46
INEQUALITY / GINI INDEX
595
TOTAL POPULATION
309
MALE POPULATION
286
FEMALE POPULATION
108.04
MALES / 100 FEMALES
92.56
FEMALES / 100 MALES
42.7
MEDIAN AGE
3.0
AVG FAMILY SIZE
2.2
AVG HOUSEHOLD SIZE
229
LABOR FORCE [ PEOPLE ]
48.3%
PERCENT IN LABOR FORCE
2.2%
UNEMPLOYMENT RATE
Sinclairville Zip Codes
Sinclairville Area Codes
Income in Sinclairville
Income Overview in Sinclairville
Per Capita Income in Sinclairville is $22,415, while median incomes of families and households are $67,778 and $38,750 respectively.
| Characteristic | Number | Measure |
| Per Capita Income | 595 | $22,415 |
| Median Family Income | 150 | $67,778 |
| Mean Family Income | 150 | $67,067 |
| Median Household Income | 274 | $38,750 |
| Mean Household Income | 274 | $47,431 |
| Income Deficit | 150 | $0 |
| Wage / Income Gap (%) | 595 | 20.04% |
| Wage / Income Gap ($) | 595 | 79.96¢ per $1 |
| Gini / Inequality Index | 595 | 0.46 |
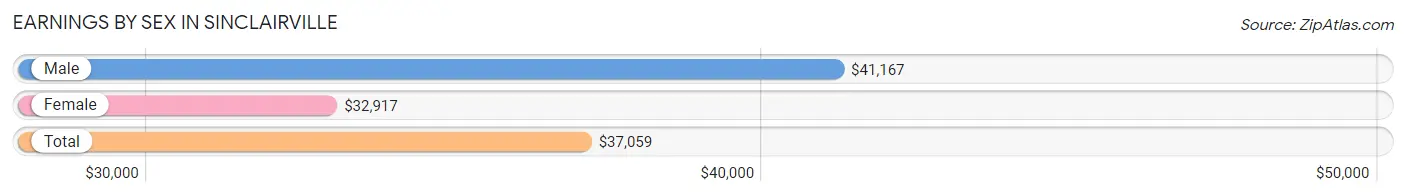
Earnings by Sex in Sinclairville
Average Earnings in Sinclairville are $37,059, $41,167 for men and $32,917 for women, a difference of 20.0%.
| Sex | Number | Average Earnings |
| Male | 130 (55.1%) | $41,167 |
| Female | 106 (44.9%) | $32,917 |
| Total | 236 (100.0%) | $37,059 |
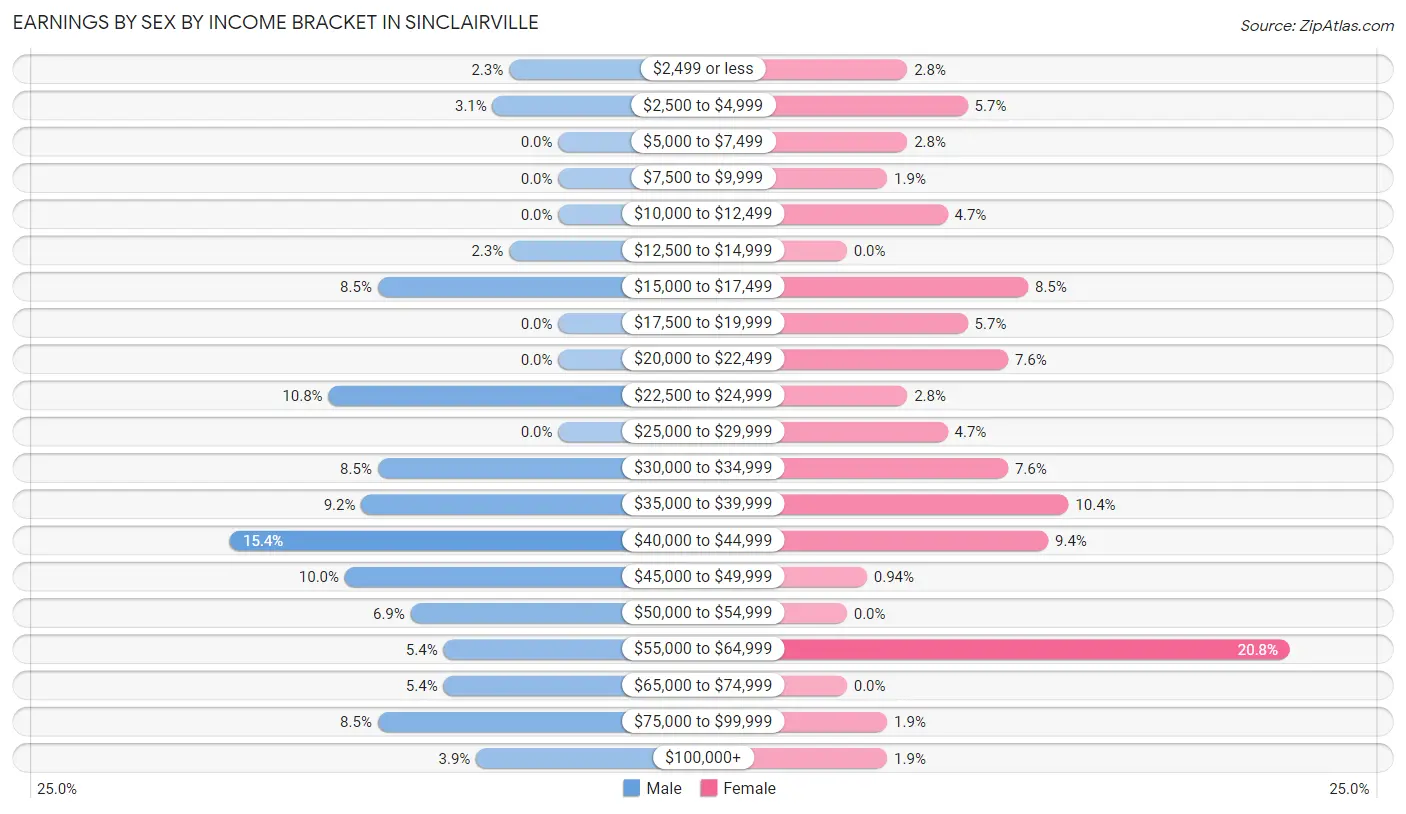
Earnings by Sex by Income Bracket in Sinclairville
The most common earnings brackets in Sinclairville are $40,000 to $44,999 for men (20 | 15.4%) and $55,000 to $64,999 for women (22 | 20.7%).
| Income | Male | Female |
| $2,499 or less | 3 (2.3%) | 3 (2.8%) |
| $2,500 to $4,999 | 4 (3.1%) | 6 (5.7%) |
| $5,000 to $7,499 | 0 (0.0%) | 3 (2.8%) |
| $7,500 to $9,999 | 0 (0.0%) | 2 (1.9%) |
| $10,000 to $12,499 | 0 (0.0%) | 5 (4.7%) |
| $12,500 to $14,999 | 3 (2.3%) | 0 (0.0%) |
| $15,000 to $17,499 | 11 (8.5%) | 9 (8.5%) |
| $17,500 to $19,999 | 0 (0.0%) | 6 (5.7%) |
| $20,000 to $22,499 | 0 (0.0%) | 8 (7.5%) |
| $22,500 to $24,999 | 14 (10.8%) | 3 (2.8%) |
| $25,000 to $29,999 | 0 (0.0%) | 5 (4.7%) |
| $30,000 to $34,999 | 11 (8.5%) | 8 (7.5%) |
| $35,000 to $39,999 | 12 (9.2%) | 11 (10.4%) |
| $40,000 to $44,999 | 20 (15.4%) | 10 (9.4%) |
| $45,000 to $49,999 | 13 (10.0%) | 1 (0.9%) |
| $50,000 to $54,999 | 9 (6.9%) | 0 (0.0%) |
| $55,000 to $64,999 | 7 (5.4%) | 22 (20.7%) |
| $65,000 to $74,999 | 7 (5.4%) | 0 (0.0%) |
| $75,000 to $99,999 | 11 (8.5%) | 2 (1.9%) |
| $100,000+ | 5 (3.8%) | 2 (1.9%) |
| Total | 130 (100.0%) | 106 (100.0%) |
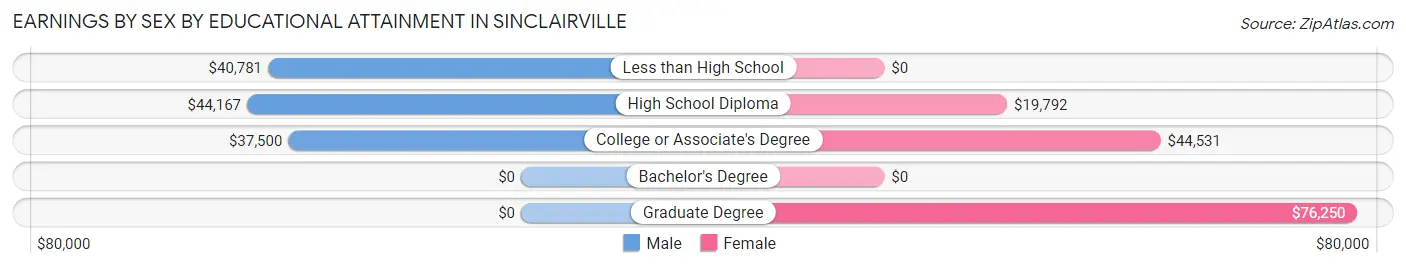
Earnings by Sex by Educational Attainment in Sinclairville
Average earnings in Sinclairville are $41,167 for men and $33,333 for women, a difference of 19.0%. Men with an educational attainment of high school diploma enjoy the highest average annual earnings of $44,167, while those with college or associate's degree education earn the least with $37,500. Women with an educational attainment of graduate degree earn the most with the average annual earnings of $76,250, while those with high school diploma education have the smallest earnings of $19,792.
| Educational Attainment | Male Income | Female Income |
| Less than High School | $40,781 | $0 |
| High School Diploma | $44,167 | $19,792 |
| College or Associate's Degree | $37,500 | $44,531 |
| Bachelor's Degree | - | - |
| Graduate Degree | - | - |
| Total | $41,167 | $33,333 |
Family Income in Sinclairville
Family Income Brackets in Sinclairville
According to the Sinclairville family income data, there are 35 families falling into the $50,000 to $74,999 income range, which is the most common income bracket and makes up 23.3% of all families.
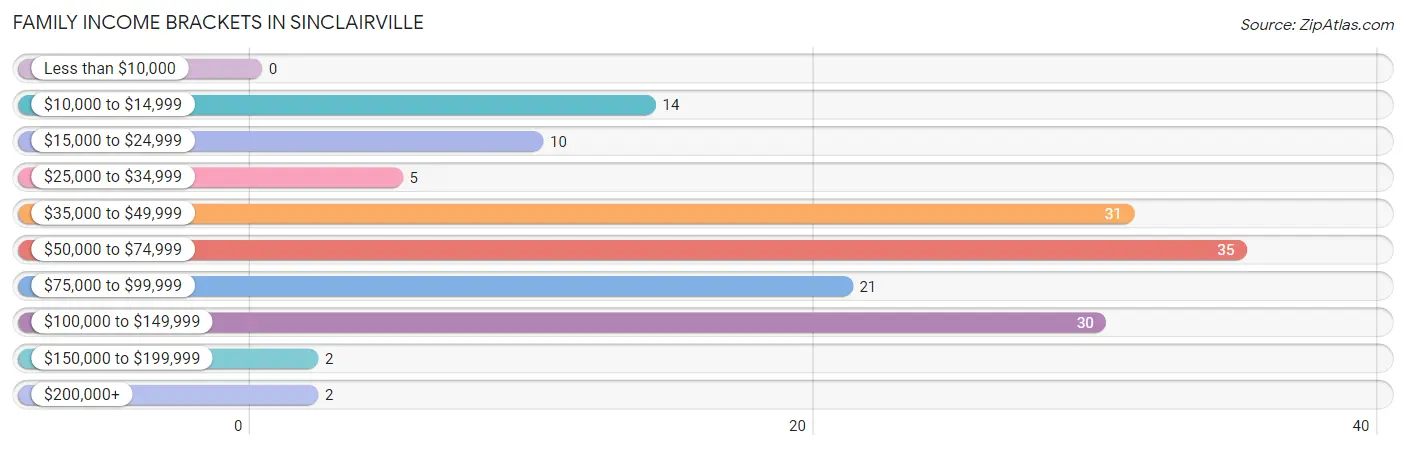
| Income Bracket | # Families | % Families |
| Less than $10,000 | 0 | 0.0% |
| $10,000 to $14,999 | 14 | 9.3% |
| $15,000 to $24,999 | 10 | 6.7% |
| $25,000 to $34,999 | 5 | 3.3% |
| $35,000 to $49,999 | 31 | 20.7% |
| $50,000 to $74,999 | 35 | 23.3% |
| $75,000 to $99,999 | 21 | 14.0% |
| $100,000 to $149,999 | 30 | 20.0% |
| $150,000 to $199,999 | 2 | 1.3% |
| $200,000+ | 2 | 1.3% |
Family Income by Famaliy Size in Sinclairville
5-person families (21 | 14.0%) account for the highest median family income in Sinclairville with $92,656 per family, while 2-person families (98 | 65.3%) have the highest median income of $31,250 per family member.
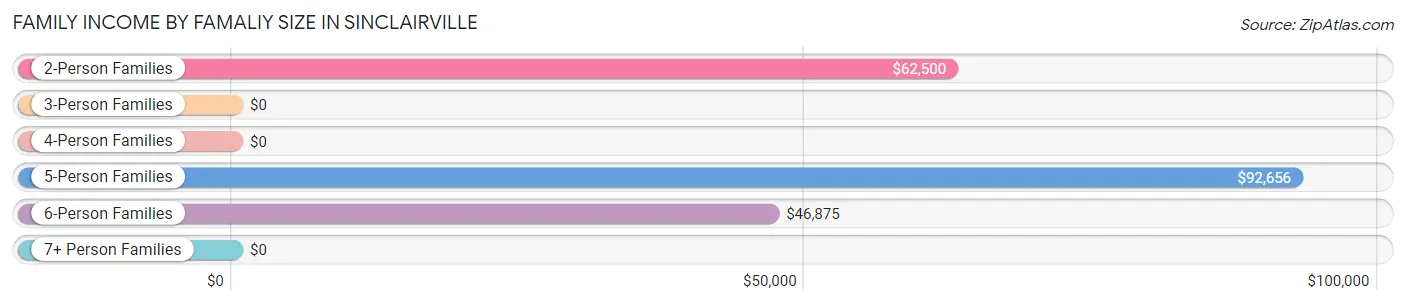
| Income Bracket | # Families | Median Income |
| 2-Person Families | 98 (65.3%) | $62,500 |
| 3-Person Families | 12 (8.0%) | $0 |
| 4-Person Families | 4 (2.7%) | $0 |
| 5-Person Families | 21 (14.0%) | $92,656 |
| 6-Person Families | 15 (10.0%) | $46,875 |
| 7+ Person Families | 0 (0.0%) | $0 |
| Total | 150 (100.0%) | $67,778 |
Family Income by Number of Earners in Sinclairville
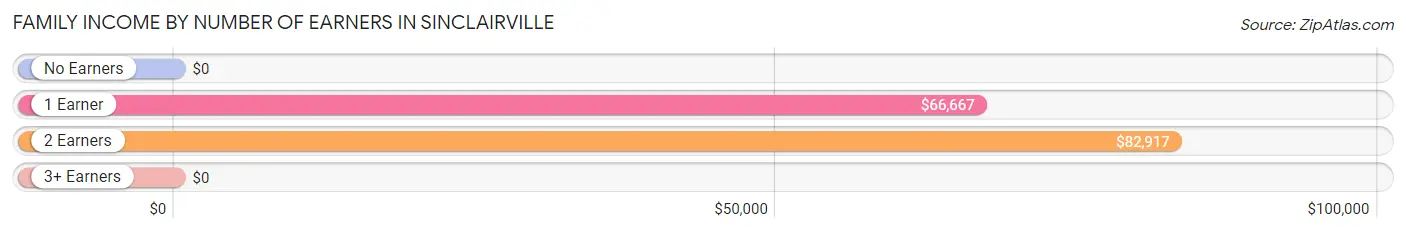
| Number of Earners | # Families | Median Income |
| No Earners | 31 (20.7%) | $0 |
| 1 Earner | 64 (42.7%) | $66,667 |
| 2 Earners | 55 (36.7%) | $82,917 |
| 3+ Earners | 0 (0.0%) | $0 |
| Total | 150 (100.0%) | $67,778 |
Household Income in Sinclairville
Household Income Brackets in Sinclairville
With 44 households falling in the category, the $50,000 to $74,999 income range is the most frequent in Sinclairville, accounting for 16.1% of all households. In contrast, only 2 households (0.7%) fall into the $150,000 to $199,999 income bracket, making it the least populous group.
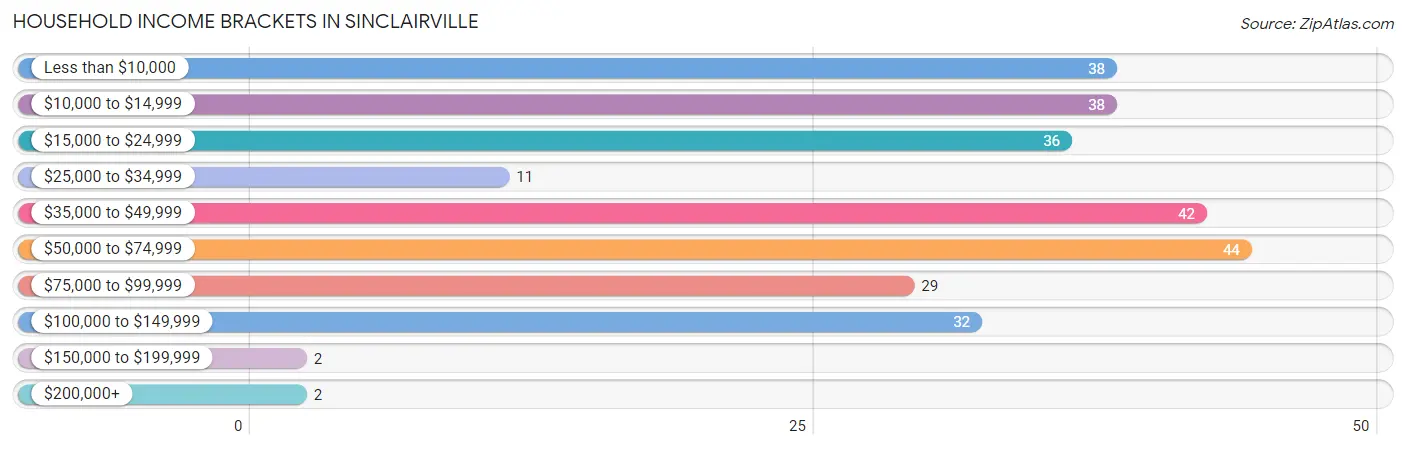
| Income Bracket | # Households | % Households |
| Less than $10,000 | 38 | 13.9% |
| $10,000 to $14,999 | 38 | 13.9% |
| $15,000 to $24,999 | 36 | 13.1% |
| $25,000 to $34,999 | 11 | 4.0% |
| $35,000 to $49,999 | 42 | 15.3% |
| $50,000 to $74,999 | 44 | 16.1% |
| $75,000 to $99,999 | 29 | 10.6% |
| $100,000 to $149,999 | 32 | 11.7% |
| $150,000 to $199,999 | 2 | 0.7% |
| $200,000+ | 2 | 0.7% |
Household Income by Householder Age in Sinclairville
The median household income in Sinclairville is $38,750, with the highest median household income of $59,375 found in the 45 to 64 years age bracket for the primary householder. A total of 83 households (30.3%) fall into this category. Meanwhile, the 15 to 24 years age bracket for the primary householder has the lowest median household income of $0, with 2 households (0.7%) in this group.
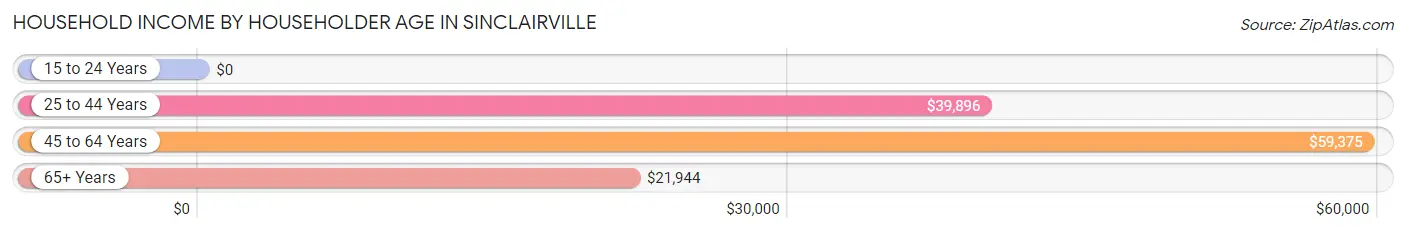
| Income Bracket | # Households | Median Income |
| 15 to 24 Years | 2 (0.7%) | $0 |
| 25 to 44 Years | 83 (30.3%) | $39,896 |
| 45 to 64 Years | 83 (30.3%) | $59,375 |
| 65+ Years | 106 (38.7%) | $21,944 |
| Total | 274 (100.0%) | $38,750 |
Poverty in Sinclairville
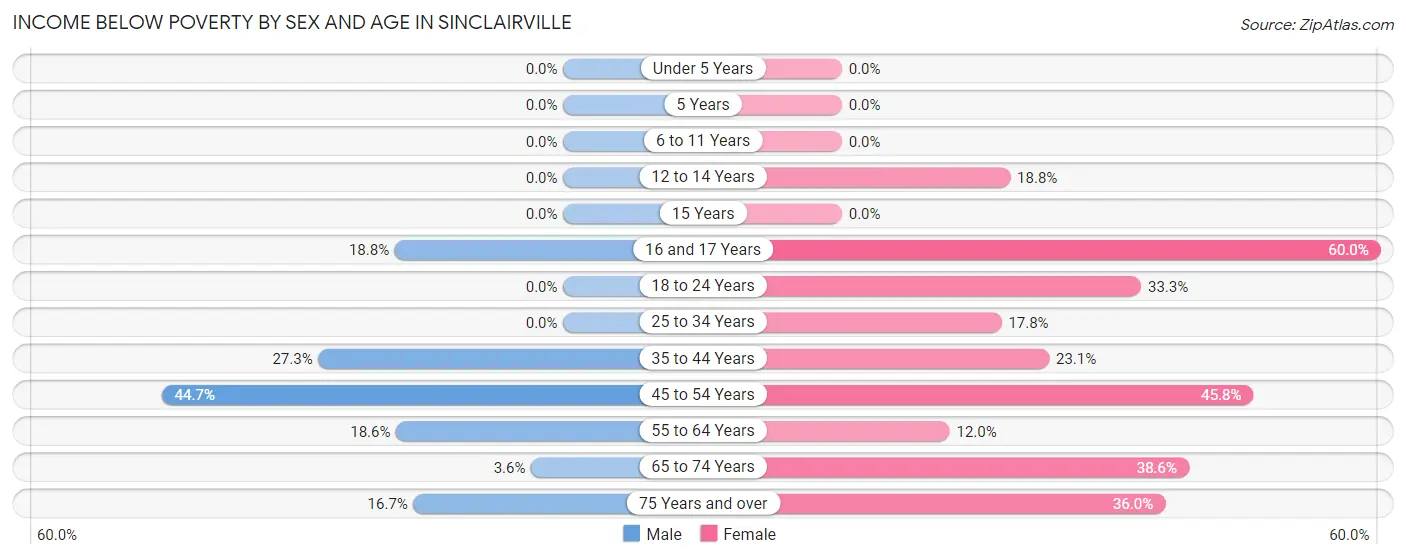
Income Below Poverty by Sex and Age in Sinclairville
With 13.3% poverty level for males and 24.8% for females among the residents of Sinclairville, 45 to 54 year old males and 16 and 17 year old females are the most vulnerable to poverty, with 17 males (44.7%) and 3 females (60.0%) in their respective age groups living below the poverty level.
| Age Bracket | Male | Female |
| Under 5 Years | 0 (0.0%) | 0 (0.0%) |
| 5 Years | 0 (0.0%) | 0 (0.0%) |
| 6 to 11 Years | 0 (0.0%) | 0 (0.0%) |
| 12 to 14 Years | 0 (0.0%) | 3 (18.8%) |
| 15 Years | 0 (0.0%) | 0 (0.0%) |
| 16 and 17 Years | 3 (18.8%) | 3 (60.0%) |
| 18 to 24 Years | 0 (0.0%) | 2 (33.3%) |
| 25 to 34 Years | 0 (0.0%) | 8 (17.8%) |
| 35 to 44 Years | 6 (27.3%) | 6 (23.1%) |
| 45 to 54 Years | 17 (44.7%) | 11 (45.8%) |
| 55 to 64 Years | 8 (18.6%) | 3 (12.0%) |
| 65 to 74 Years | 1 (3.6%) | 17 (38.6%) |
| 75 Years and over | 6 (16.7%) | 18 (36.0%) |
| Total | 41 (13.3%) | 71 (24.8%) |
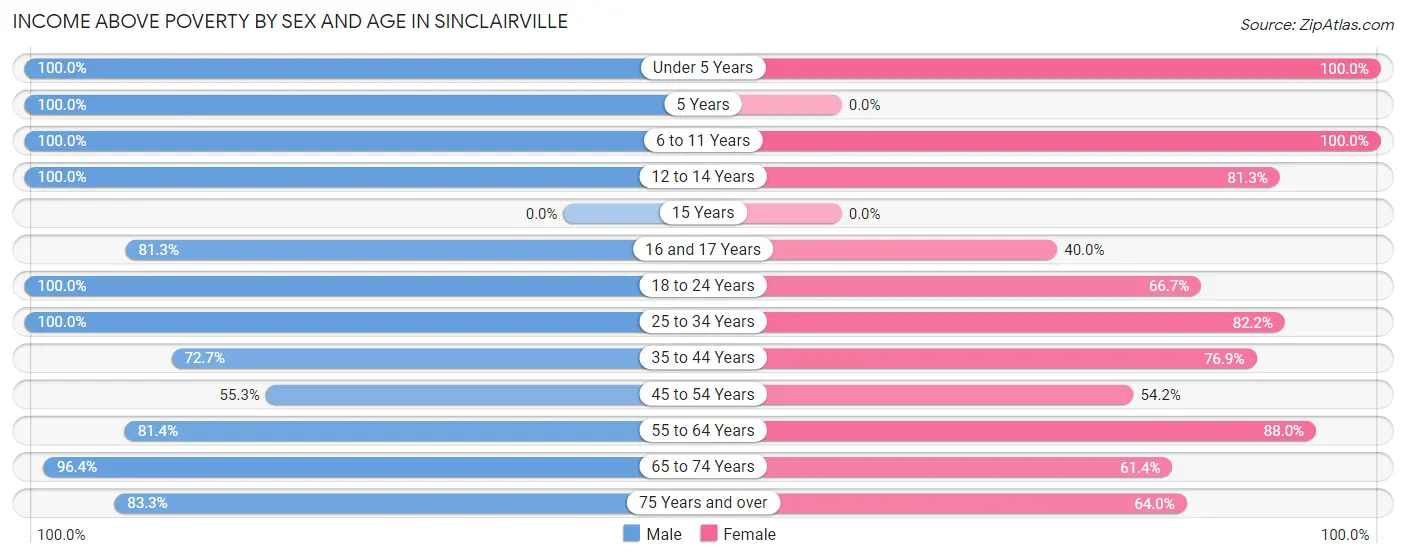
Income Above Poverty by Sex and Age in Sinclairville
According to the poverty statistics in Sinclairville, males aged under 5 years and females aged under 5 years are the age groups that are most secure financially, with 100.0% of males and 100.0% of females in these age groups living above the poverty line.
| Age Bracket | Male | Female |
| Under 5 Years | 14 (100.0%) | 22 (100.0%) |
| 5 Years | 9 (100.0%) | 0 (0.0%) |
| 6 to 11 Years | 31 (100.0%) | 23 (100.0%) |
| 12 to 14 Years | 6 (100.0%) | 13 (81.2%) |
| 15 Years | 0 (0.0%) | 0 (0.0%) |
| 16 and 17 Years | 13 (81.2%) | 2 (40.0%) |
| 18 to 24 Years | 10 (100.0%) | 4 (66.7%) |
| 25 to 34 Years | 56 (100.0%) | 37 (82.2%) |
| 35 to 44 Years | 16 (72.7%) | 20 (76.9%) |
| 45 to 54 Years | 21 (55.3%) | 13 (54.2%) |
| 55 to 64 Years | 35 (81.4%) | 22 (88.0%) |
| 65 to 74 Years | 27 (96.4%) | 27 (61.4%) |
| 75 Years and over | 30 (83.3%) | 32 (64.0%) |
| Total | 268 (86.7%) | 215 (75.2%) |
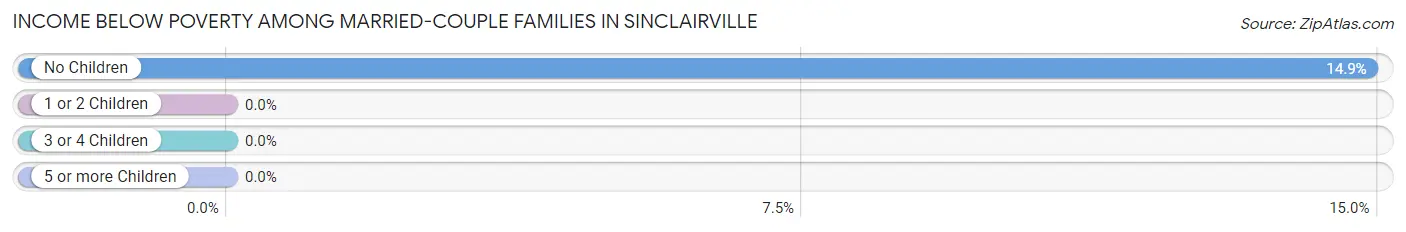
Income Below Poverty Among Married-Couple Families in Sinclairville
The poverty statistics for married-couple families in Sinclairville show that 10.3% or 14 of the total 136 families live below the poverty line. Families with no children have the highest poverty rate of 14.9%, comprising of 14 families. On the other hand, families with 1 or 2 children have the lowest poverty rate of 0.0%, which includes 0 families.
| Children | Above Poverty | Below Poverty |
| No Children | 80 (85.1%) | 14 (14.9%) |
| 1 or 2 Children | 16 (100.0%) | 0 (0.0%) |
| 3 or 4 Children | 26 (100.0%) | 0 (0.0%) |
| 5 or more Children | 0 (0.0%) | 0 (0.0%) |
| Total | 122 (89.7%) | 14 (10.3%) |
Income Below Poverty Among Single-Parent Households in Sinclairville
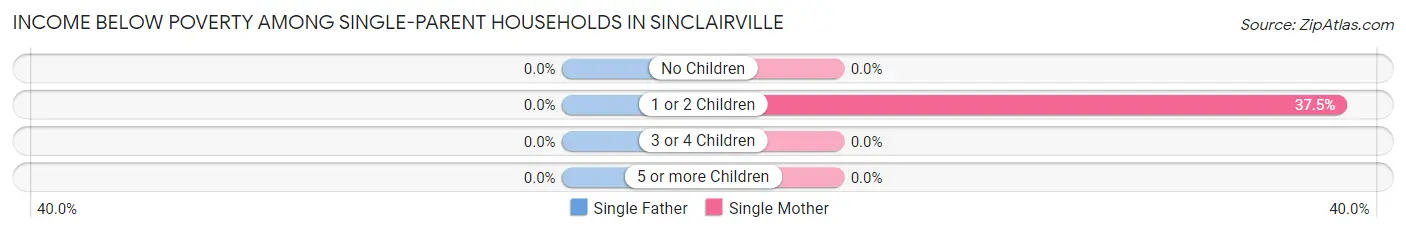
| Children | Single Father | Single Mother |
| No Children | 0 (0.0%) | 0 (0.0%) |
| 1 or 2 Children | 0 (0.0%) | 3 (37.5%) |
| 3 or 4 Children | 0 (0.0%) | 0 (0.0%) |
| 5 or more Children | 0 (0.0%) | 0 (0.0%) |
| Total | 0 (0.0%) | 3 (30.0%) |
Income Below Poverty Among Married-Couple vs Single-Parent Households in Sinclairville
The poverty data for Sinclairville shows that 14 of the married-couple family households (10.3%) and 3 of the single-parent households (21.4%) are living below the poverty level. Within the married-couple family households, those with no children have the highest poverty rate, with 14 households (14.9%) falling below the poverty line. Among the single-parent households, those with 1 or 2 children have the highest poverty rate, with 3 household (37.5%) living below poverty.
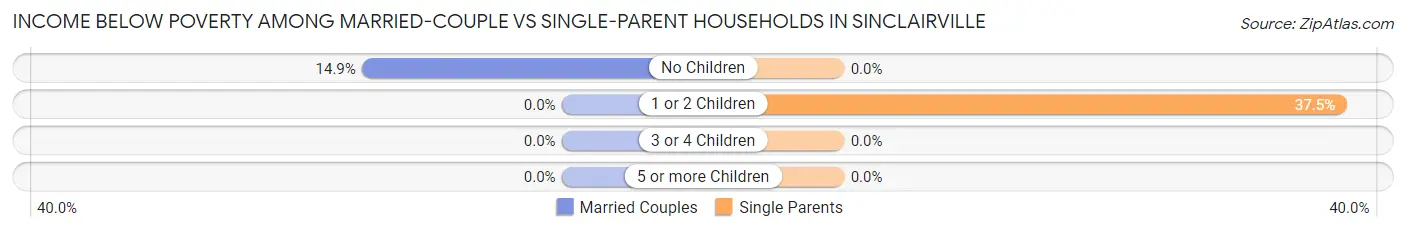
| Children | Married-Couple Families | Single-Parent Households |
| No Children | 14 (14.9%) | 0 (0.0%) |
| 1 or 2 Children | 0 (0.0%) | 3 (37.5%) |
| 3 or 4 Children | 0 (0.0%) | 0 (0.0%) |
| 5 or more Children | 0 (0.0%) | 0 (0.0%) |
| Total | 14 (10.3%) | 3 (21.4%) |
Race in Sinclairville
The most populous races in Sinclairville are White / Caucasian (555 | 93.3%), Two or more Races (26 | 4.4%), and Hispanic or Latino (22 | 3.7%).
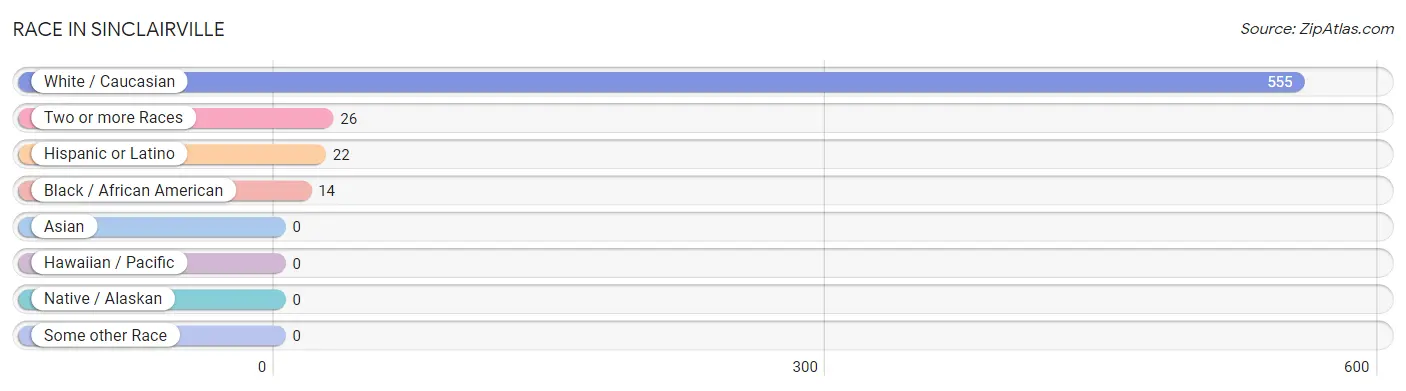
| Race | # Population | % Population |
| Asian | 0 | 0.0% |
| Black / African American | 14 | 2.4% |
| Hawaiian / Pacific | 0 | 0.0% |
| Hispanic or Latino | 22 | 3.7% |
| Native / Alaskan | 0 | 0.0% |
| White / Caucasian | 555 | 93.3% |
| Two or more Races | 26 | 4.4% |
| Some other Race | 0 | 0.0% |
| Total | 595 | 100.0% |
Ancestry in Sinclairville
The most populous ancestries reported in Sinclairville are English (99 | 16.6%), Irish (83 | 14.0%), German (67 | 11.3%), Swedish (45 | 7.6%), and Italian (32 | 5.4%), together accounting for 54.8% of all Sinclairville residents.
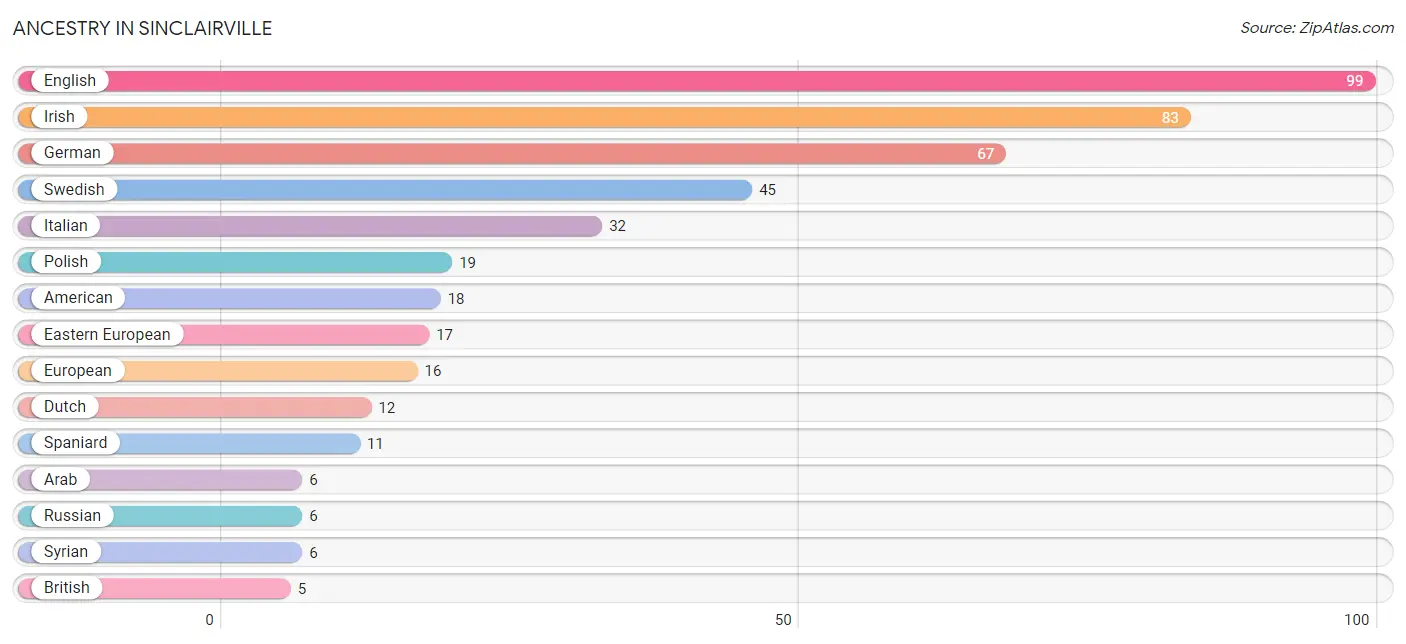
| Ancestry | # Population | % Population |
| American | 18 | 3.0% |
| Arab | 6 | 1.0% |
| British | 5 | 0.8% |
| Dutch | 12 | 2.0% |
| Eastern European | 17 | 2.9% |
| English | 99 | 16.6% |
| European | 16 | 2.7% |
| French | 5 | 0.8% |
| German | 67 | 11.3% |
| Irish | 83 | 14.0% |
| Italian | 32 | 5.4% |
| Mexican | 2 | 0.3% |
| Polish | 19 | 3.2% |
| Puerto Rican | 4 | 0.7% |
| Russian | 6 | 1.0% |
| Scotch-Irish | 2 | 0.3% |
| Scottish | 4 | 0.7% |
| Slavic | 3 | 0.5% |
| Spaniard | 11 | 1.8% |
| Spanish | 5 | 0.8% |
| Swedish | 45 | 7.6% |
| Syrian | 6 | 1.0% |
| Welsh | 3 | 0.5% | View All 23 Rows |
Immigrants in Sinclairville
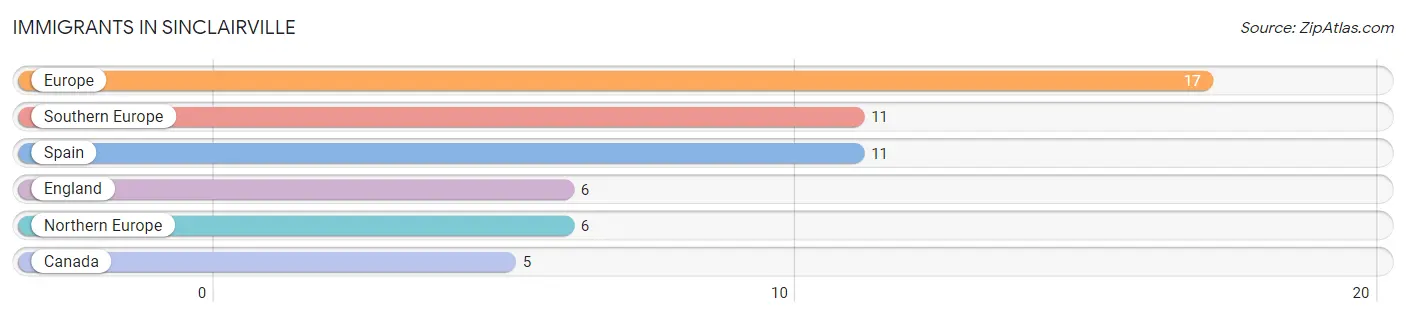
The most numerous immigrant groups reported in Sinclairville came from Europe (17 | 2.9%), Southern Europe (11 | 1.8%), Spain (11 | 1.8%), England (6 | 1.0%), and Northern Europe (6 | 1.0%), together accounting for 8.6% of all Sinclairville residents.
| Immigration Origin | # Population | % Population |
| Canada | 5 | 0.8% |
| England | 6 | 1.0% |
| Europe | 17 | 2.9% |
| Northern Europe | 6 | 1.0% |
| Southern Europe | 11 | 1.8% |
| Spain | 11 | 1.8% | View All 6 Rows |
Sex and Age in Sinclairville
Sex and Age in Sinclairville
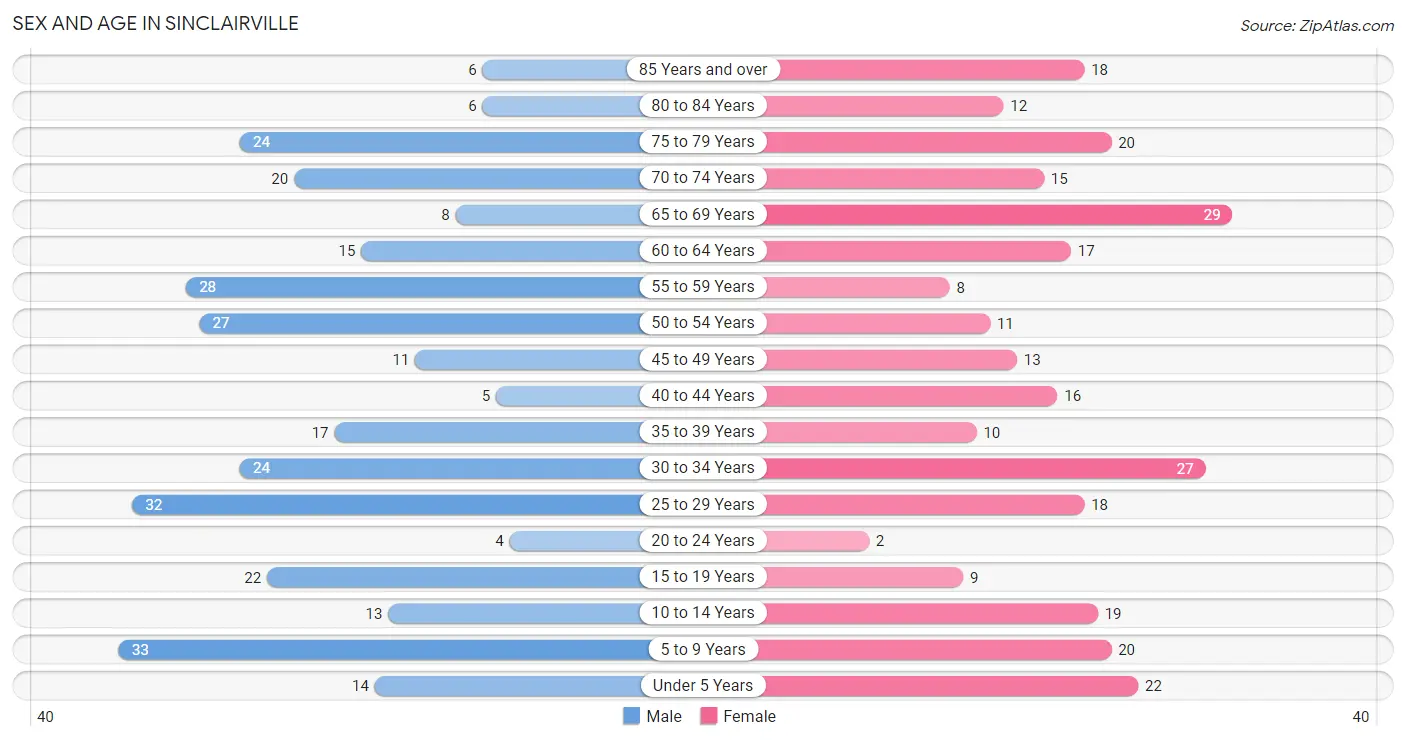
The most populous age groups in Sinclairville are 5 to 9 Years (33 | 10.7%) for men and 65 to 69 Years (29 | 10.1%) for women.
| Age Bracket | Male | Female |
| Under 5 Years | 14 (4.5%) | 22 (7.7%) |
| 5 to 9 Years | 33 (10.7%) | 20 (7.0%) |
| 10 to 14 Years | 13 (4.2%) | 19 (6.6%) |
| 15 to 19 Years | 22 (7.1%) | 9 (3.2%) |
| 20 to 24 Years | 4 (1.3%) | 2 (0.7%) |
| 25 to 29 Years | 32 (10.4%) | 18 (6.3%) |
| 30 to 34 Years | 24 (7.8%) | 27 (9.4%) |
| 35 to 39 Years | 17 (5.5%) | 10 (3.5%) |
| 40 to 44 Years | 5 (1.6%) | 16 (5.6%) |
| 45 to 49 Years | 11 (3.6%) | 13 (4.5%) |
| 50 to 54 Years | 27 (8.7%) | 11 (3.8%) |
| 55 to 59 Years | 28 (9.1%) | 8 (2.8%) |
| 60 to 64 Years | 15 (4.9%) | 17 (5.9%) |
| 65 to 69 Years | 8 (2.6%) | 29 (10.1%) |
| 70 to 74 Years | 20 (6.5%) | 15 (5.2%) |
| 75 to 79 Years | 24 (7.8%) | 20 (7.0%) |
| 80 to 84 Years | 6 (1.9%) | 12 (4.2%) |
| 85 Years and over | 6 (1.9%) | 18 (6.3%) |
| Total | 309 (100.0%) | 286 (100.0%) |
Families and Households in Sinclairville
Median Family Size in Sinclairville
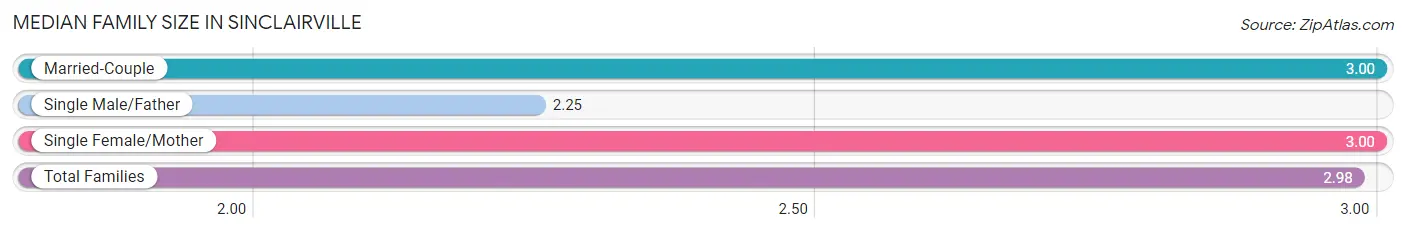
The median family size in Sinclairville is 2.98 persons per family, with married-couple families (136 | 90.7%) accounting for the largest median family size of 3 persons per family. On the other hand, single male/father families (4 | 2.7%) represent the smallest median family size with 2.25 persons per family.
| Family Type | # Families | Family Size |
| Married-Couple | 136 (90.7%) | 3.00 |
| Single Male/Father | 4 (2.7%) | 2.25 |
| Single Female/Mother | 10 (6.7%) | 3.00 |
| Total Families | 150 (100.0%) | 2.98 |
Median Household Size in Sinclairville
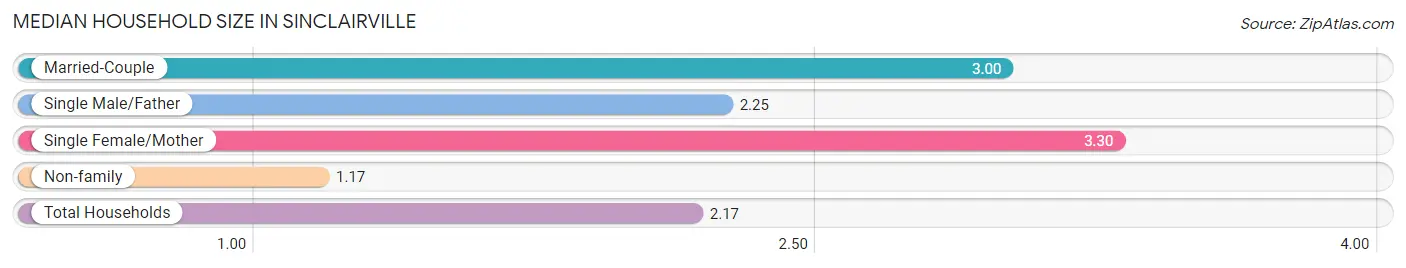
The median household size in Sinclairville is 2.17 persons per household, with single female/mother households (10 | 3.6%) accounting for the largest median household size of 3.3 persons per household. non-family households (124 | 45.3%) represent the smallest median household size with 1.17 persons per household.
| Household Type | # Households | Household Size |
| Married-Couple | 136 (49.6%) | 3.00 |
| Single Male/Father | 4 (1.5%) | 2.25 |
| Single Female/Mother | 10 (3.6%) | 3.30 |
| Non-family | 124 (45.3%) | 1.17 |
| Total Households | 274 (100.0%) | 2.17 |
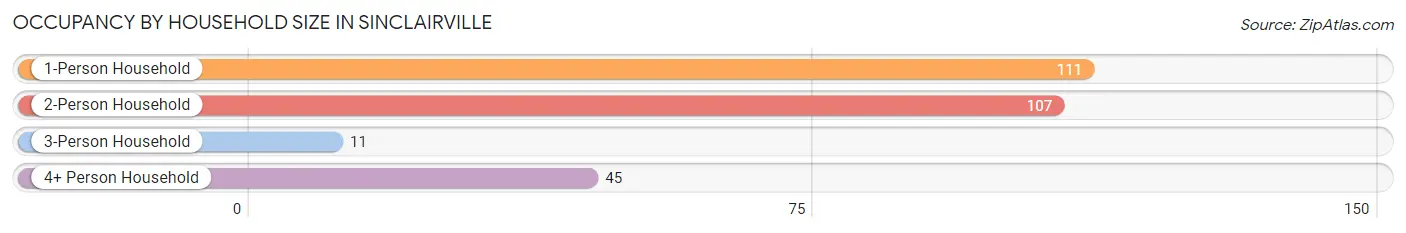
Household Size by Marriage Status in Sinclairville
Out of a total of 274 households in Sinclairville, 150 (54.7%) are family households, while 124 (45.3%) are nonfamily households. The most numerous type of family households are 2-person households, comprising 98, and the most common type of nonfamily households are 1-person households, comprising 111.
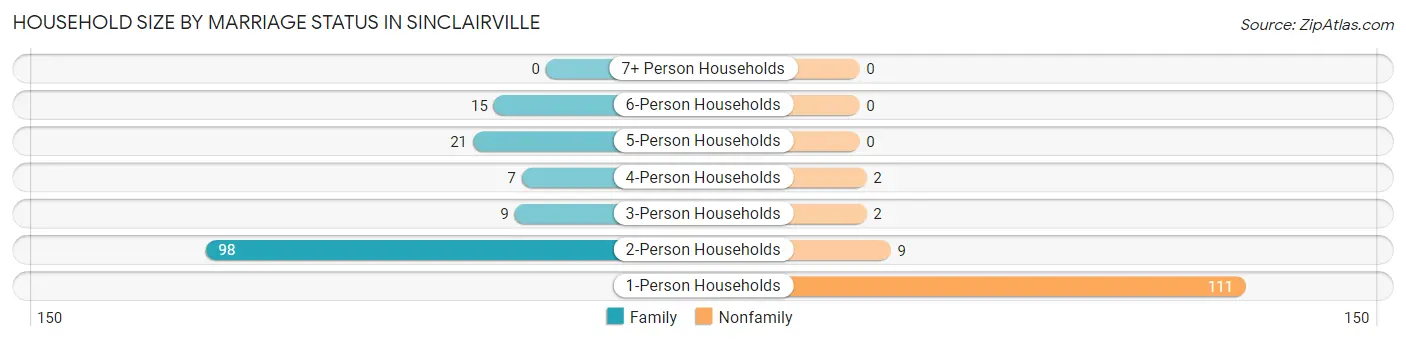
| Household Size | Family Households | Nonfamily Households |
| 1-Person Households | - | 111 (40.5%) |
| 2-Person Households | 98 (35.8%) | 9 (3.3%) |
| 3-Person Households | 9 (3.3%) | 2 (0.7%) |
| 4-Person Households | 7 (2.5%) | 2 (0.7%) |
| 5-Person Households | 21 (7.7%) | 0 (0.0%) |
| 6-Person Households | 15 (5.5%) | 0 (0.0%) |
| 7+ Person Households | 0 (0.0%) | 0 (0.0%) |
| Total | 150 (54.7%) | 124 (45.3%) |
Female Fertility in Sinclairville
Fertility by Age in Sinclairville
Average fertility rate in Sinclairville is 75.0 births per 1,000 women. Women in the age bracket of 20 to 34 years have the highest fertility rate with 170.0 births per 1,000 women. Women in the age bracket of 20 to 34 years acount for 100.0% of all women with births.
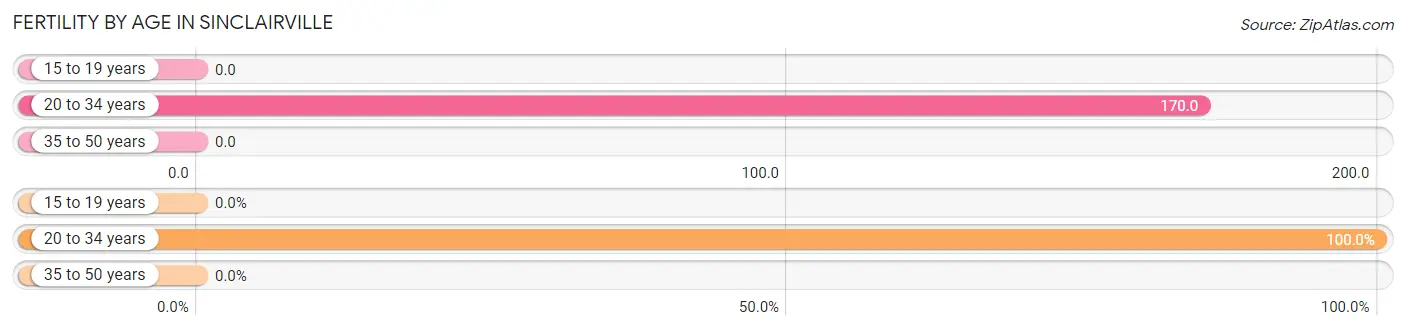
| Age Bracket | Women with Births | Births / 1,000 Women |
| 15 to 19 years | 0 (0.0%) | 0.0 |
| 20 to 34 years | 8 (100.0%) | 170.0 |
| 35 to 50 years | 0 (0.0%) | 0.0 |
| Total | 8 (100.0%) | 75.0 |
Fertility by Age by Marriage Status in Sinclairville
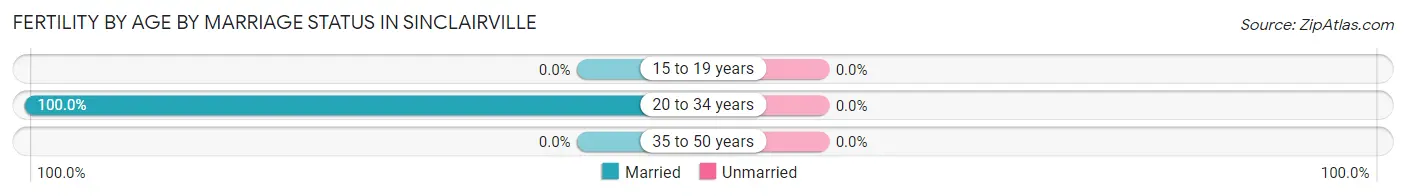
| Age Bracket | Married | Unmarried |
| 15 to 19 years | 0 (0.0%) | 0 (0.0%) |
| 20 to 34 years | 8 (100.0%) | 0 (0.0%) |
| 35 to 50 years | 0 (0.0%) | 0 (0.0%) |
| Total | 8 (100.0%) | 0 (0.0%) |
Fertility by Education in Sinclairville
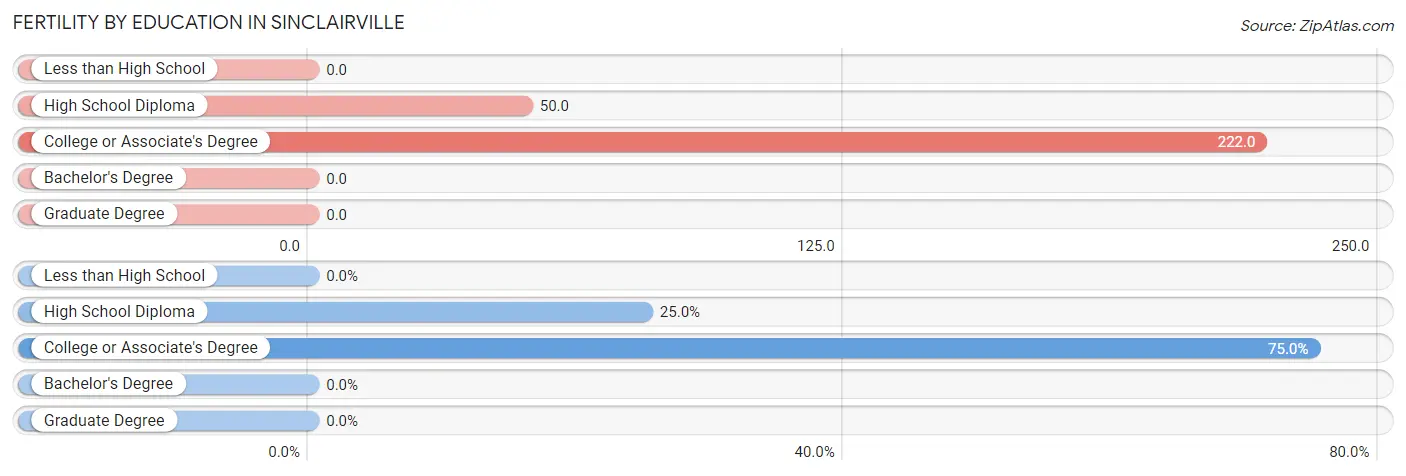
| Educational Attainment | Women with Births | Births / 1,000 Women |
| Less than High School | 0 (0.0%) | 0.0 |
| High School Diploma | 2 (25.0%) | 50.0 |
| College or Associate's Degree | 6 (75.0%) | 222.0 |
| Bachelor's Degree | 0 (0.0%) | 0.0 |
| Graduate Degree | 0 (0.0%) | 0.0 |
| Total | 8 (100.0%) | 75.0 |
Fertility by Education by Marriage Status in Sinclairville
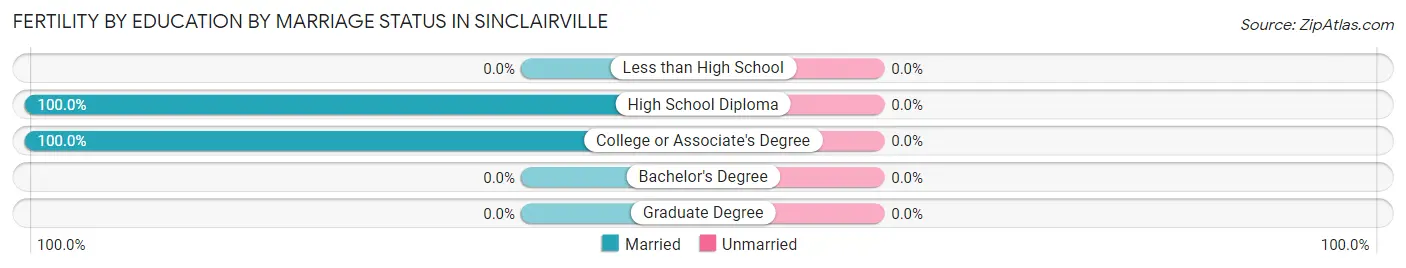
| Educational Attainment | Married | Unmarried |
| Less than High School | 0 (0.0%) | 0 (0.0%) |
| High School Diploma | 2 (100.0%) | 0 (0.0%) |
| College or Associate's Degree | 6 (100.0%) | 0 (0.0%) |
| Bachelor's Degree | 0 (0.0%) | 0 (0.0%) |
| Graduate Degree | 0 (0.0%) | 0 (0.0%) |
| Total | 8 (100.0%) | 0 (0.0%) |
Employment Characteristics in Sinclairville
Employment by Class of Employer in Sinclairville
Among the 222 employed individuals in Sinclairville, private company employees (137 | 61.7%), self-employed (not incorporated) (28 | 12.6%), and state government employees (23 | 10.4%) make up the most common classes of employment.
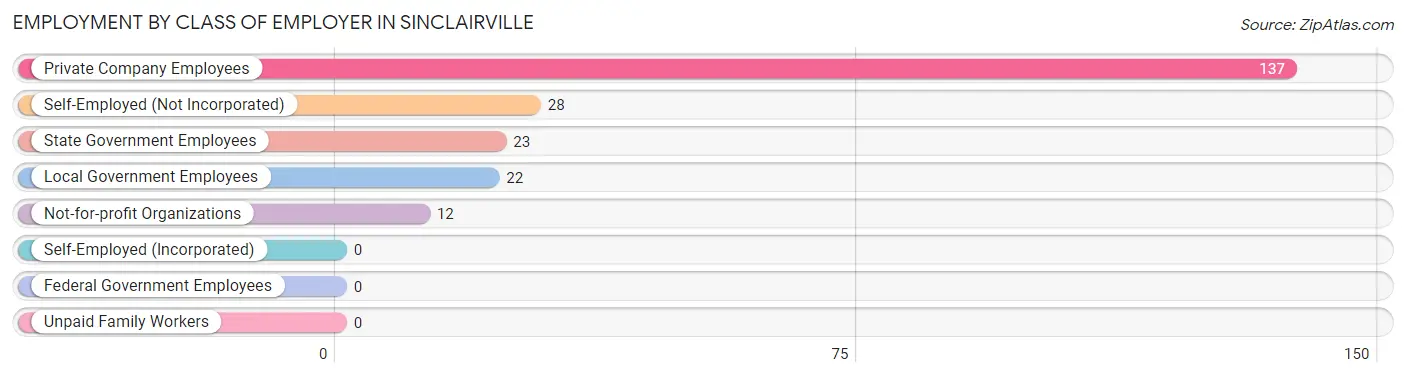
| Employer Class | # Employees | % Employees |
| Private Company Employees | 137 | 61.7% |
| Self-Employed (Incorporated) | 0 | 0.0% |
| Self-Employed (Not Incorporated) | 28 | 12.6% |
| Not-for-profit Organizations | 12 | 5.4% |
| Local Government Employees | 22 | 9.9% |
| State Government Employees | 23 | 10.4% |
| Federal Government Employees | 0 | 0.0% |
| Unpaid Family Workers | 0 | 0.0% |
| Total | 222 | 100.0% |
Employment Status by Age in Sinclairville
According to the labor force statistics for Sinclairville, out of the total population over 16 years of age (474), 48.3% or 229 individuals are in the labor force, with 2.2% or 5 of them unemployed. The age group with the highest labor force participation rate is 20 to 24 years, with 100.0% or 6 individuals in the labor force. Within the labor force, the 60 to 64 years age range has the highest percentage of unemployed individuals, with 28.6% or 2 of them being unemployed.
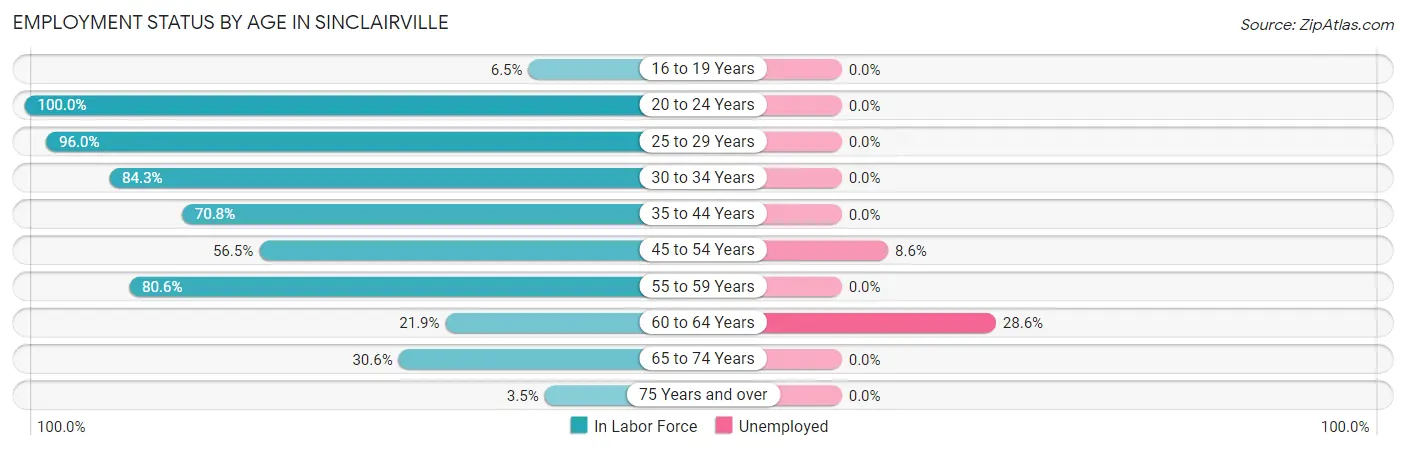
| Age Bracket | In Labor Force | Unemployed |
| 16 to 19 Years | 2 (6.5%) | 0 (0.0%) |
| 20 to 24 Years | 6 (100.0%) | 0 (0.0%) |
| 25 to 29 Years | 48 (96.0%) | 0 (0.0%) |
| 30 to 34 Years | 43 (84.3%) | 0 (0.0%) |
| 35 to 44 Years | 34 (70.8%) | 0 (0.0%) |
| 45 to 54 Years | 35 (56.5%) | 3 (8.6%) |
| 55 to 59 Years | 29 (80.6%) | 0 (0.0%) |
| 60 to 64 Years | 7 (21.9%) | 2 (28.6%) |
| 65 to 74 Years | 22 (30.6%) | 0 (0.0%) |
| 75 Years and over | 3 (3.5%) | 0 (0.0%) |
| Total | 229 (48.3%) | 5 (2.2%) |
Employment Status by Educational Attainment in Sinclairville
According to labor force statistics for Sinclairville, 70.3% of individuals (196) out of the total population between 25 and 64 years of age (279) are in the labor force, with 2.6% or 5 of them being unemployed. The group with the highest labor force participation rate are those with the educational attainment of college / associate degree, with 87.9% or 51 individuals in the labor force. Within the labor force, individuals with less than high school education have the highest percentage of unemployment, with 10.7% or 3 of them being unemployed.
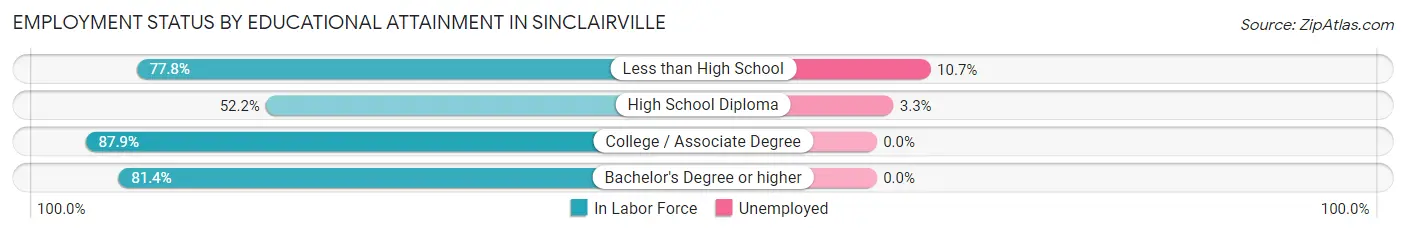
| Educational Attainment | In Labor Force | Unemployed |
| Less than High School | 28 (77.8%) | 4 (10.7%) |
| High School Diploma | 60 (52.2%) | 4 (3.3%) |
| College / Associate Degree | 51 (87.9%) | 0 (0.0%) |
| Bachelor's Degree or higher | 57 (81.4%) | 0 (0.0%) |
| Total | 196 (70.3%) | 7 (2.6%) |
Employment Occupations by Sex in Sinclairville
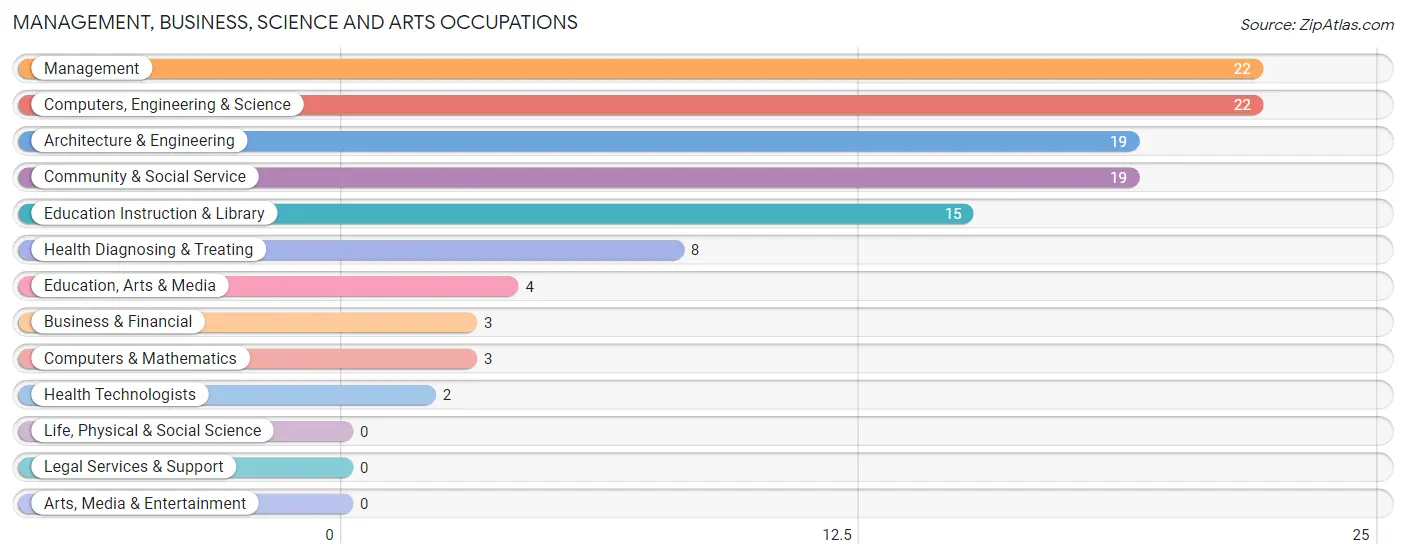
Management, Business, Science and Arts Occupations
The most common Management, Business, Science and Arts occupations in Sinclairville are Management (22 | 9.8%), Computers, Engineering & Science (22 | 9.8%), Architecture & Engineering (19 | 8.5%), Community & Social Service (19 | 8.5%), and Education Instruction & Library (15 | 6.7%).
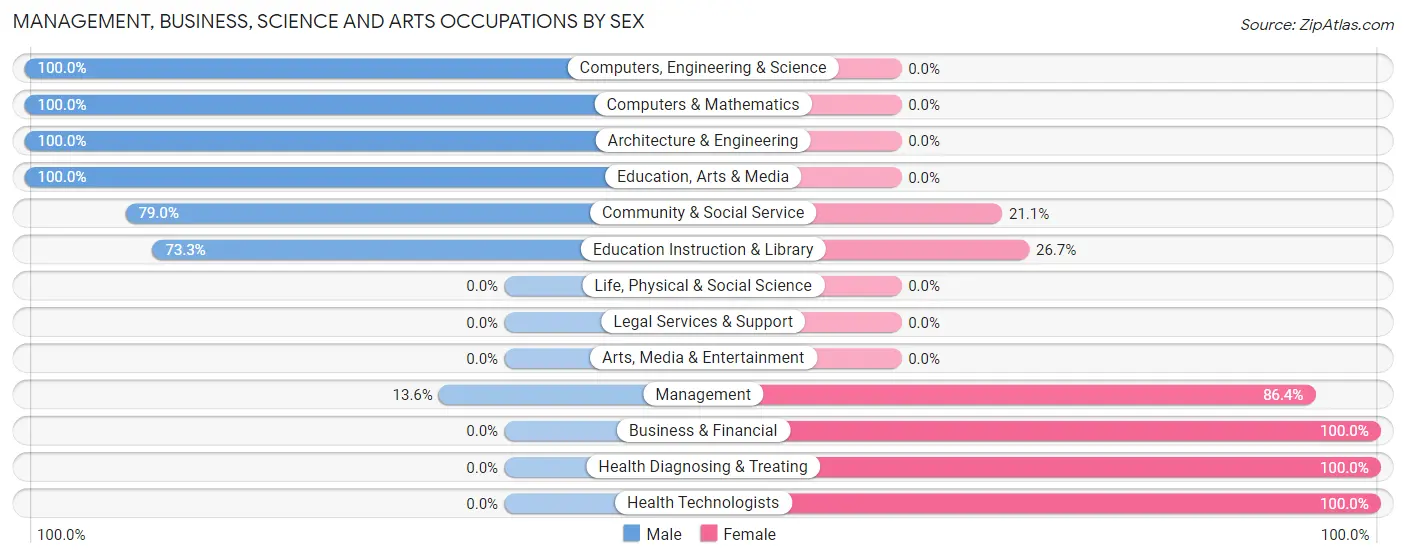
Management, Business, Science and Arts Occupations by Sex
Within the Management, Business, Science and Arts occupations in Sinclairville, the most male-oriented occupations are Computers, Engineering & Science (100.0%), Computers & Mathematics (100.0%), and Architecture & Engineering (100.0%), while the most female-oriented occupations are Business & Financial (100.0%), Health Diagnosing & Treating (100.0%), and Health Technologists (100.0%).
| Occupation | Male | Female |
| Management | 3 (13.6%) | 19 (86.4%) |
| Business & Financial | 0 (0.0%) | 3 (100.0%) |
| Computers, Engineering & Science | 22 (100.0%) | 0 (0.0%) |
| Computers & Mathematics | 3 (100.0%) | 0 (0.0%) |
| Architecture & Engineering | 19 (100.0%) | 0 (0.0%) |
| Life, Physical & Social Science | 0 (0.0%) | 0 (0.0%) |
| Community & Social Service | 15 (78.9%) | 4 (21.0%) |
| Education, Arts & Media | 4 (100.0%) | 0 (0.0%) |
| Legal Services & Support | 0 (0.0%) | 0 (0.0%) |
| Education Instruction & Library | 11 (73.3%) | 4 (26.7%) |
| Arts, Media & Entertainment | 0 (0.0%) | 0 (0.0%) |
| Health Diagnosing & Treating | 0 (0.0%) | 8 (100.0%) |
| Health Technologists | 0 (0.0%) | 2 (100.0%) |
| Total (Category) | 40 (54.0%) | 34 (46.0%) |
| Total (Overall) | 125 (55.8%) | 99 (44.2%) |
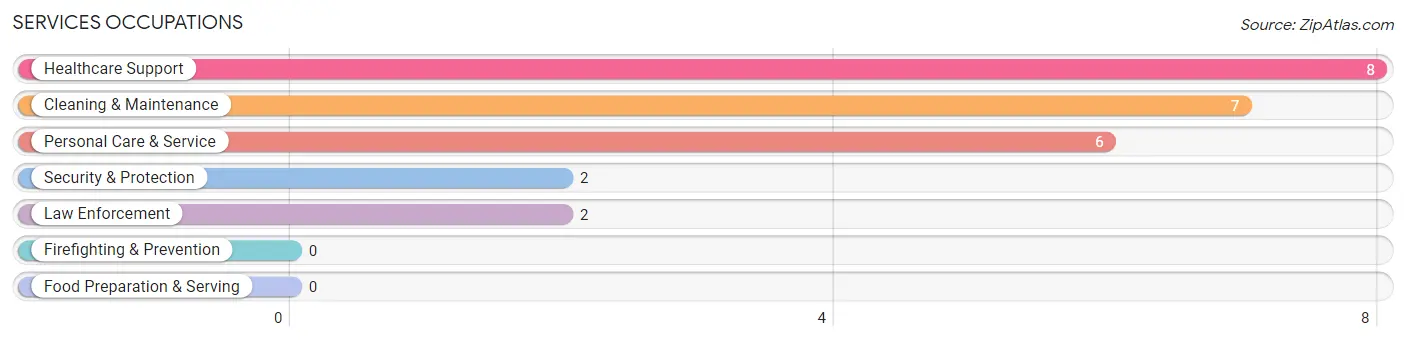
Services Occupations
The most common Services occupations in Sinclairville are Healthcare Support (8 | 3.6%), Cleaning & Maintenance (7 | 3.1%), Personal Care & Service (6 | 2.7%), Security & Protection (2 | 0.9%), and Law Enforcement (2 | 0.9%).
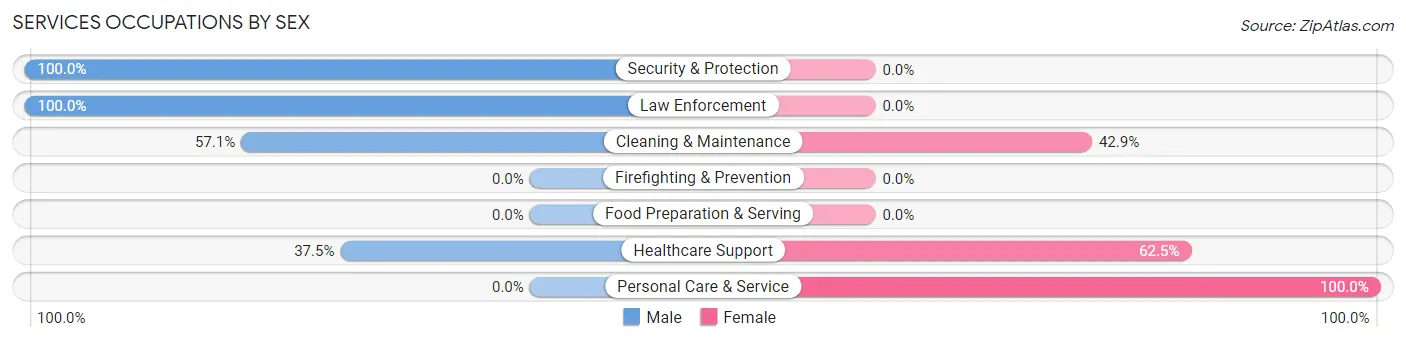
Services Occupations by Sex
Within the Services occupations in Sinclairville, the most male-oriented occupations are Security & Protection (100.0%), Law Enforcement (100.0%), and Cleaning & Maintenance (57.1%), while the most female-oriented occupations are Personal Care & Service (100.0%), Healthcare Support (62.5%), and Cleaning & Maintenance (42.9%).
| Occupation | Male | Female |
| Healthcare Support | 3 (37.5%) | 5 (62.5%) |
| Security & Protection | 2 (100.0%) | 0 (0.0%) |
| Firefighting & Prevention | 0 (0.0%) | 0 (0.0%) |
| Law Enforcement | 2 (100.0%) | 0 (0.0%) |
| Food Preparation & Serving | 0 (0.0%) | 0 (0.0%) |
| Cleaning & Maintenance | 4 (57.1%) | 3 (42.9%) |
| Personal Care & Service | 0 (0.0%) | 6 (100.0%) |
| Total (Category) | 9 (39.1%) | 14 (60.9%) |
| Total (Overall) | 125 (55.8%) | 99 (44.2%) |
Sales and Office Occupations
The most common Sales and Office occupations in Sinclairville are Office & Administration (35 | 15.6%), and Sales & Related (29 | 13.0%).
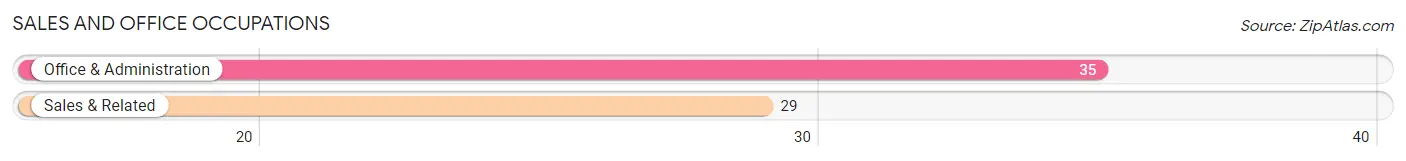
Sales and Office Occupations by Sex
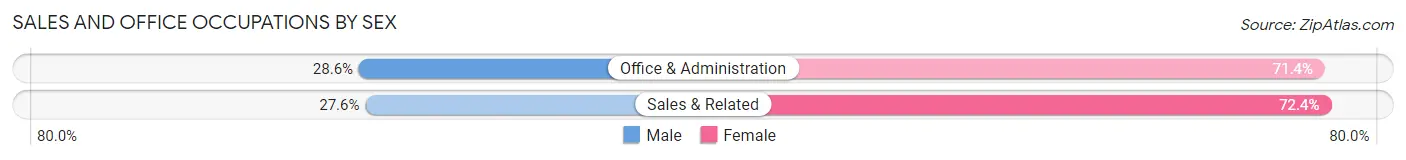
| Occupation | Male | Female |
| Sales & Related | 8 (27.6%) | 21 (72.4%) |
| Office & Administration | 10 (28.6%) | 25 (71.4%) |
| Total (Category) | 18 (28.1%) | 46 (71.9%) |
| Total (Overall) | 125 (55.8%) | 99 (44.2%) |
Natural Resources, Construction and Maintenance Occupations
The most common Natural Resources, Construction and Maintenance occupations in Sinclairville are Construction & Extraction (25 | 11.2%), and Installation, Maintenance & Repair (5 | 2.2%).
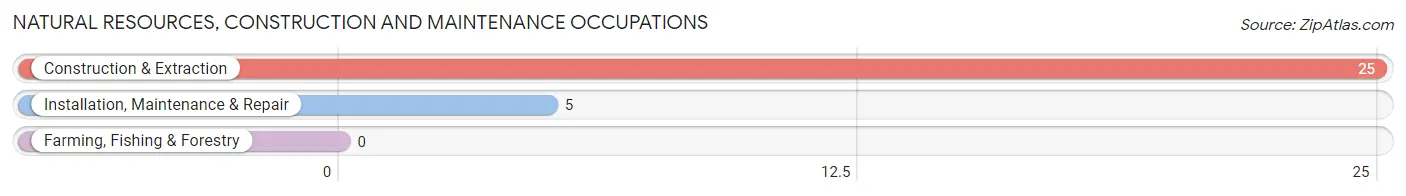
Natural Resources, Construction and Maintenance Occupations by Sex
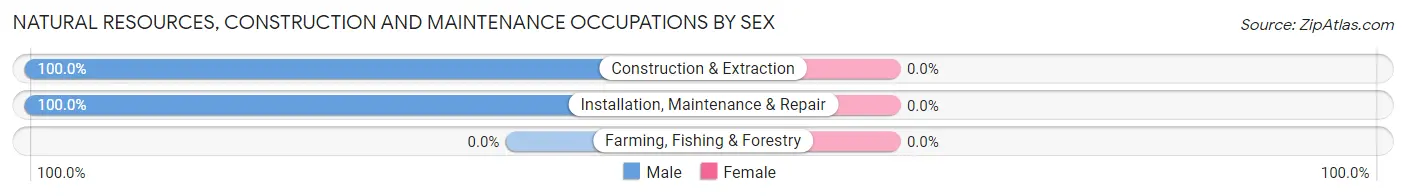
| Occupation | Male | Female |
| Farming, Fishing & Forestry | 0 (0.0%) | 0 (0.0%) |
| Construction & Extraction | 25 (100.0%) | 0 (0.0%) |
| Installation, Maintenance & Repair | 5 (100.0%) | 0 (0.0%) |
| Total (Category) | 30 (100.0%) | 0 (0.0%) |
| Total (Overall) | 125 (55.8%) | 99 (44.2%) |
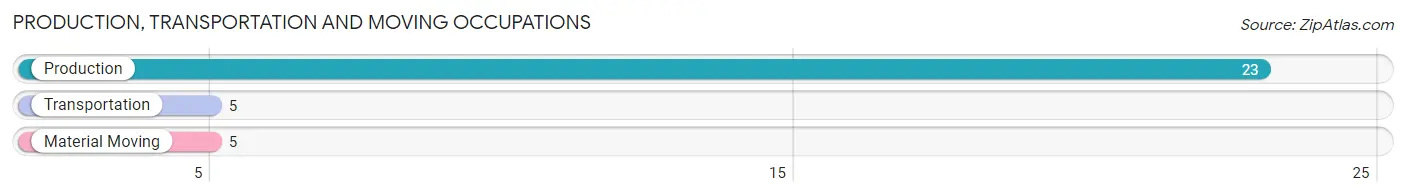
Production, Transportation and Moving Occupations
The most common Production, Transportation and Moving occupations in Sinclairville are Production (23 | 10.3%), Transportation (5 | 2.2%), and Material Moving (5 | 2.2%).
Production, Transportation and Moving Occupations by Sex
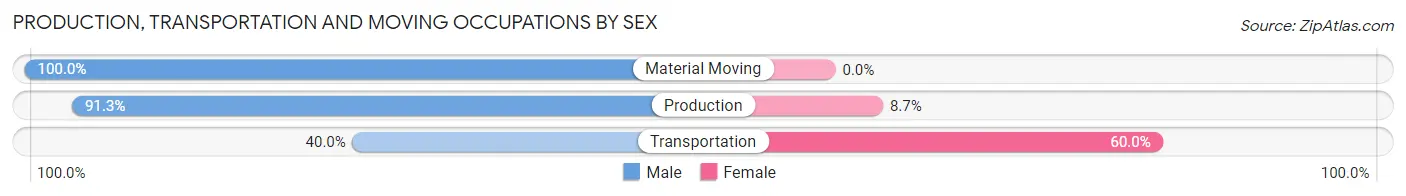
| Occupation | Male | Female |
| Production | 21 (91.3%) | 2 (8.7%) |
| Transportation | 2 (40.0%) | 3 (60.0%) |
| Material Moving | 5 (100.0%) | 0 (0.0%) |
| Total (Category) | 28 (84.9%) | 5 (15.1%) |
| Total (Overall) | 125 (55.8%) | 99 (44.2%) |
Employment Industries by Sex in Sinclairville
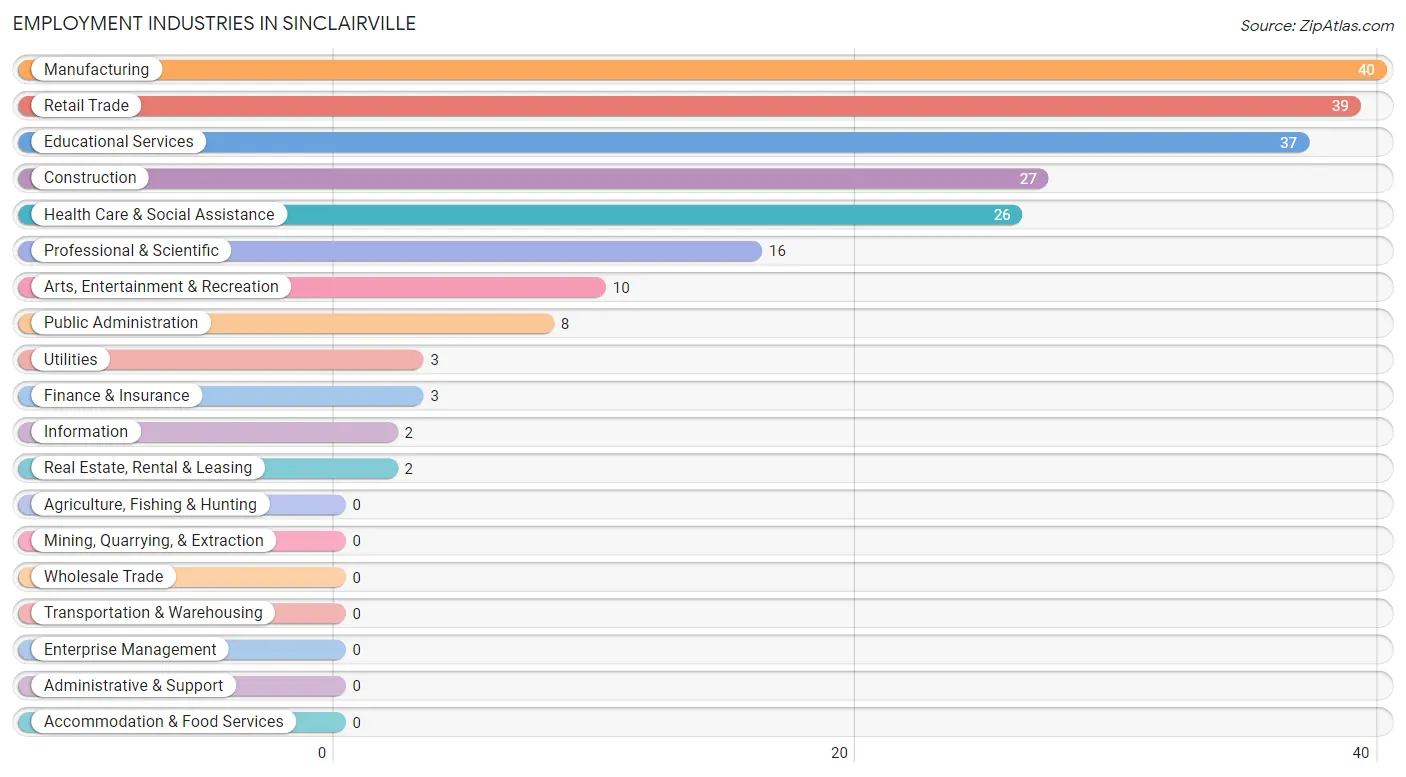
Employment Industries in Sinclairville
The major employment industries in Sinclairville include Manufacturing (40 | 17.9%), Retail Trade (39 | 17.4%), Educational Services (37 | 16.5%), Construction (27 | 12.0%), and Health Care & Social Assistance (26 | 11.6%).
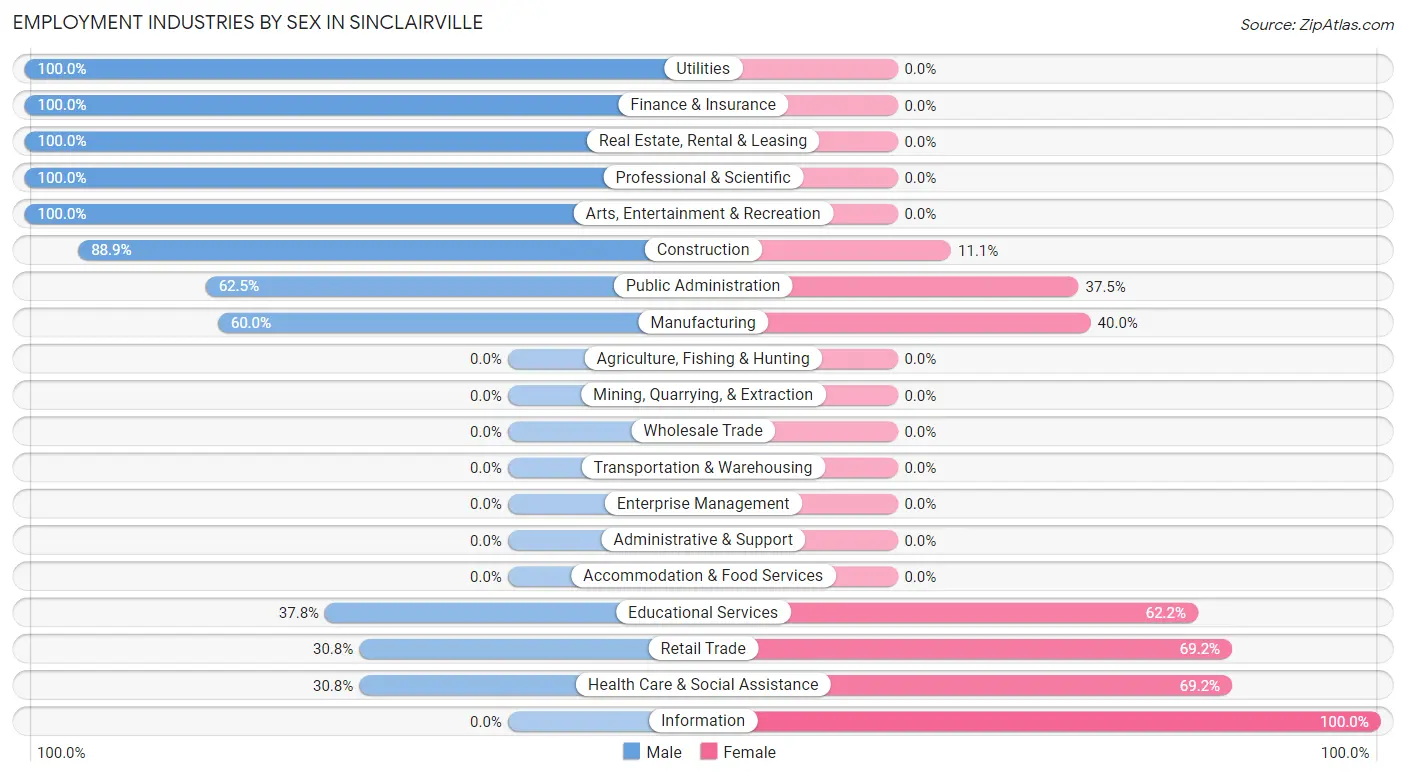
Employment Industries by Sex in Sinclairville
The Sinclairville industries that see more men than women are Utilities (100.0%), Finance & Insurance (100.0%), and Real Estate, Rental & Leasing (100.0%), whereas the industries that tend to have a higher number of women are Information (100.0%), Retail Trade (69.2%), and Health Care & Social Assistance (69.2%).
| Industry | Male | Female |
| Agriculture, Fishing & Hunting | 0 (0.0%) | 0 (0.0%) |
| Mining, Quarrying, & Extraction | 0 (0.0%) | 0 (0.0%) |
| Construction | 24 (88.9%) | 3 (11.1%) |
| Manufacturing | 24 (60.0%) | 16 (40.0%) |
| Wholesale Trade | 0 (0.0%) | 0 (0.0%) |
| Retail Trade | 12 (30.8%) | 27 (69.2%) |
| Transportation & Warehousing | 0 (0.0%) | 0 (0.0%) |
| Utilities | 3 (100.0%) | 0 (0.0%) |
| Information | 0 (0.0%) | 2 (100.0%) |
| Finance & Insurance | 3 (100.0%) | 0 (0.0%) |
| Real Estate, Rental & Leasing | 2 (100.0%) | 0 (0.0%) |
| Professional & Scientific | 16 (100.0%) | 0 (0.0%) |
| Enterprise Management | 0 (0.0%) | 0 (0.0%) |
| Administrative & Support | 0 (0.0%) | 0 (0.0%) |
| Educational Services | 14 (37.8%) | 23 (62.2%) |
| Health Care & Social Assistance | 8 (30.8%) | 18 (69.2%) |
| Arts, Entertainment & Recreation | 10 (100.0%) | 0 (0.0%) |
| Accommodation & Food Services | 0 (0.0%) | 0 (0.0%) |
| Public Administration | 5 (62.5%) | 3 (37.5%) |
| Total | 125 (55.8%) | 99 (44.2%) |
Education in Sinclairville
School Enrollment in Sinclairville
The most common levels of schooling among the 112 students in Sinclairville are middle school (36 | 32.1%), elementary school (35 | 31.2%), and kindergarten (18 | 16.1%).
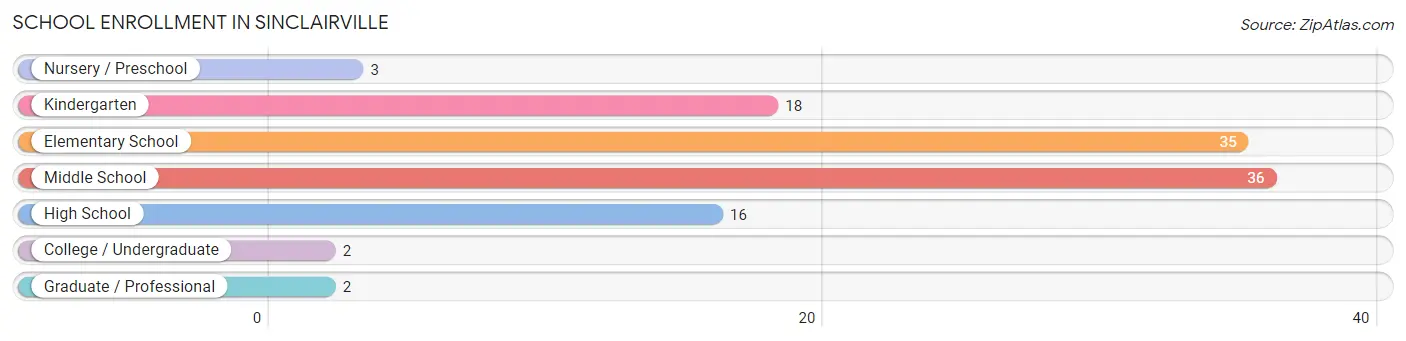
| School Level | # Students | % Students |
| Nursery / Preschool | 3 | 2.7% |
| Kindergarten | 18 | 16.1% |
| Elementary School | 35 | 31.2% |
| Middle School | 36 | 32.1% |
| High School | 16 | 14.3% |
| College / Undergraduate | 2 | 1.8% |
| Graduate / Professional | 2 | 1.8% |
| Total | 112 | 100.0% |
School Enrollment by Age by Funding Source in Sinclairville
Out of a total of 112 students who are enrolled in schools in Sinclairville, 7 (6.3%) attend a private institution, while the remaining 105 (93.7%) are enrolled in public schools. The age group of 15 to 17 year olds has the highest likelihood of being enrolled in private schools, with 5 (23.8% in the age bracket) enrolled. Conversely, the age group of 5 to 9 year old has the lowest likelihood of being enrolled in a private school, with 53 (100.0% in the age bracket) attending a public institution.
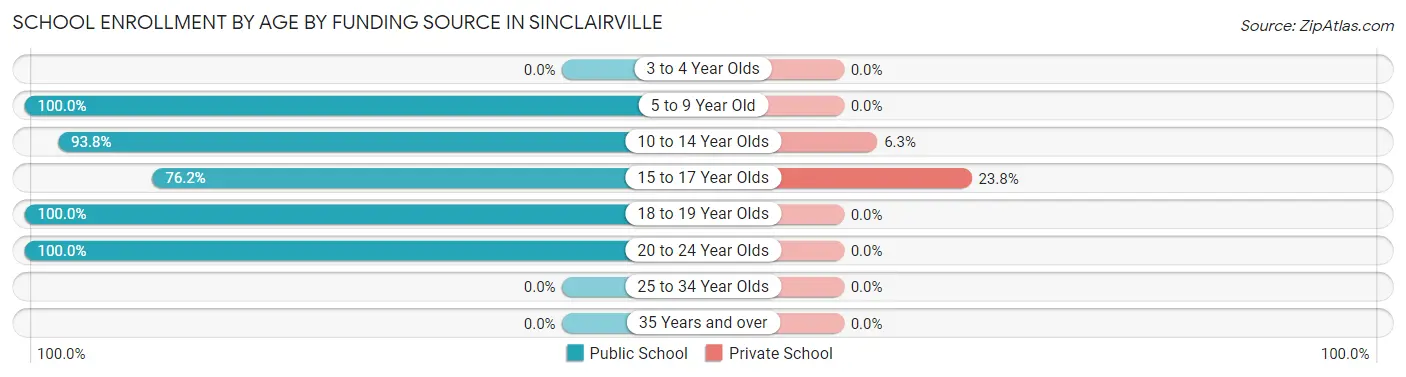
| Age Bracket | Public School | Private School |
| 3 to 4 Year Olds | 0 (0.0%) | 0 (0.0%) |
| 5 to 9 Year Old | 53 (100.0%) | 0 (0.0%) |
| 10 to 14 Year Olds | 30 (93.8%) | 2 (6.2%) |
| 15 to 17 Year Olds | 16 (76.2%) | 5 (23.8%) |
| 18 to 19 Year Olds | 4 (100.0%) | 0 (0.0%) |
| 20 to 24 Year Olds | 2 (100.0%) | 0 (0.0%) |
| 25 to 34 Year Olds | 0 (0.0%) | 0 (0.0%) |
| 35 Years and over | 0 (0.0%) | 0 (0.0%) |
| Total | 105 (93.8%) | 7 (6.3%) |
Educational Attainment by Field of Study in Sinclairville
Engineering (18 | 21.7%), education (15 | 18.1%), visual & performing arts (11 | 13.3%), arts & humanities (10 | 12.0%), and psychology (9 | 10.8%) are the most common fields of study among 83 individuals in Sinclairville who have obtained a bachelor's degree or higher.
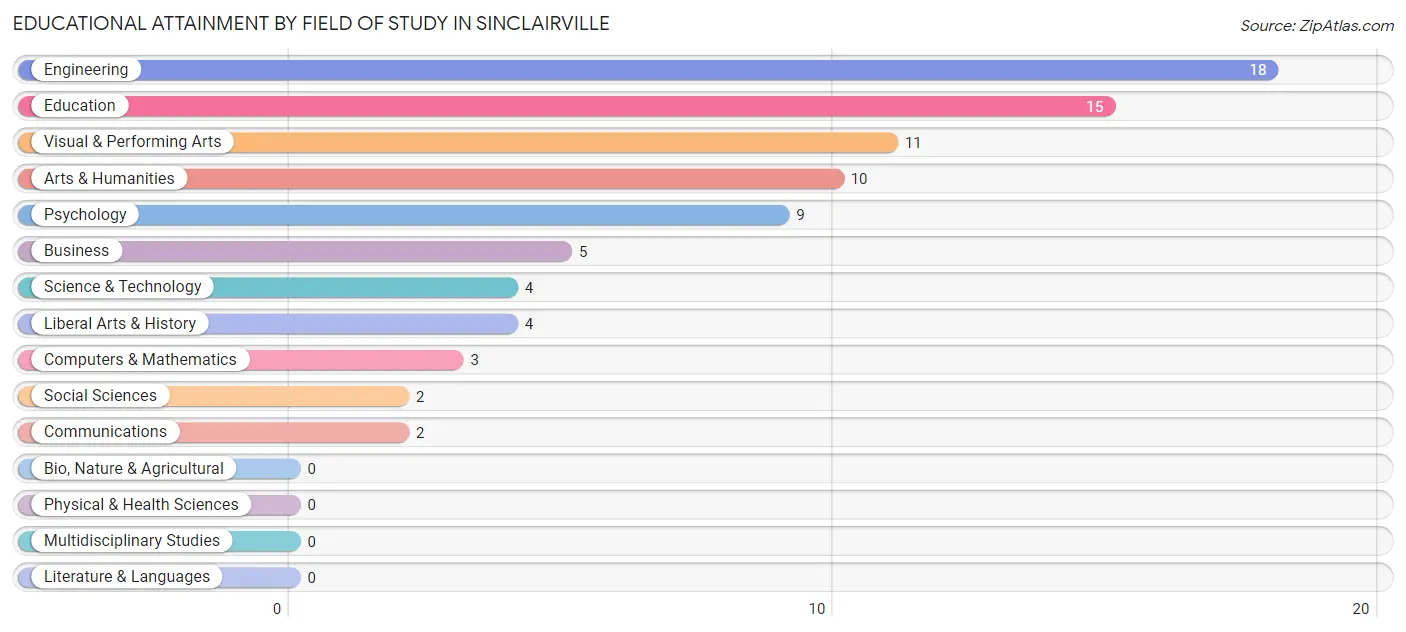
| Field of Study | # Graduates | % Graduates |
| Computers & Mathematics | 3 | 3.6% |
| Bio, Nature & Agricultural | 0 | 0.0% |
| Physical & Health Sciences | 0 | 0.0% |
| Psychology | 9 | 10.8% |
| Social Sciences | 2 | 2.4% |
| Engineering | 18 | 21.7% |
| Multidisciplinary Studies | 0 | 0.0% |
| Science & Technology | 4 | 4.8% |
| Business | 5 | 6.0% |
| Education | 15 | 18.1% |
| Literature & Languages | 0 | 0.0% |
| Liberal Arts & History | 4 | 4.8% |
| Visual & Performing Arts | 11 | 13.3% |
| Communications | 2 | 2.4% |
| Arts & Humanities | 10 | 12.0% |
| Total | 83 | 100.0% |
Transportation & Commute in Sinclairville
Vehicle Availability by Sex in Sinclairville
The most prevalent vehicle ownership categories in Sinclairville are males with 2 vehicles (49, accounting for 39.2%) and females with 2 vehicles (56, making up 50.5%).
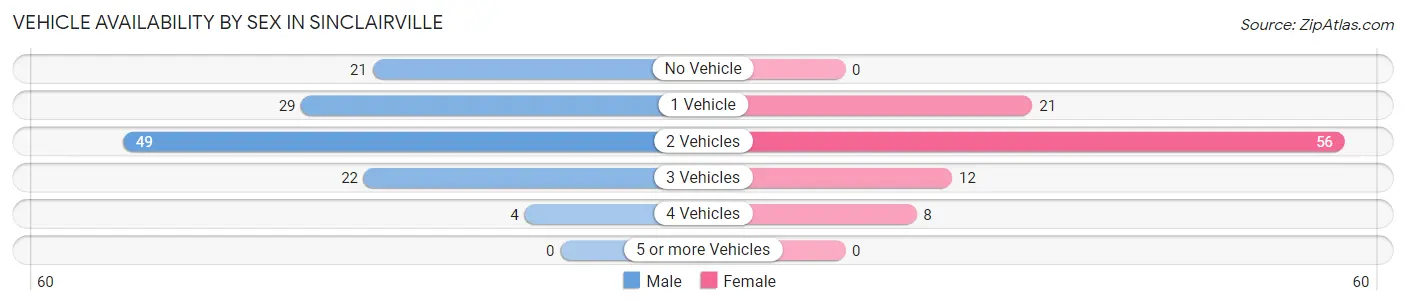
| Vehicles Available | Male | Female |
| No Vehicle | 21 (16.8%) | 0 (0.0%) |
| 1 Vehicle | 29 (23.2%) | 21 (21.6%) |
| 2 Vehicles | 49 (39.2%) | 56 (57.7%) |
| 3 Vehicles | 22 (17.6%) | 12 (12.4%) |
| 4 Vehicles | 4 (3.2%) | 8 (8.3%) |
| 5 or more Vehicles | 0 (0.0%) | 0 (0.0%) |
| Total | 125 (100.0%) | 97 (100.0%) |
Commute Time in Sinclairville
The most frequently occuring commute durations in Sinclairville are 30 to 34 minutes (75 commuters, 35.7%), 20 to 24 minutes (64 commuters, 30.5%), and less than 5 minutes (23 commuters, 11.0%).
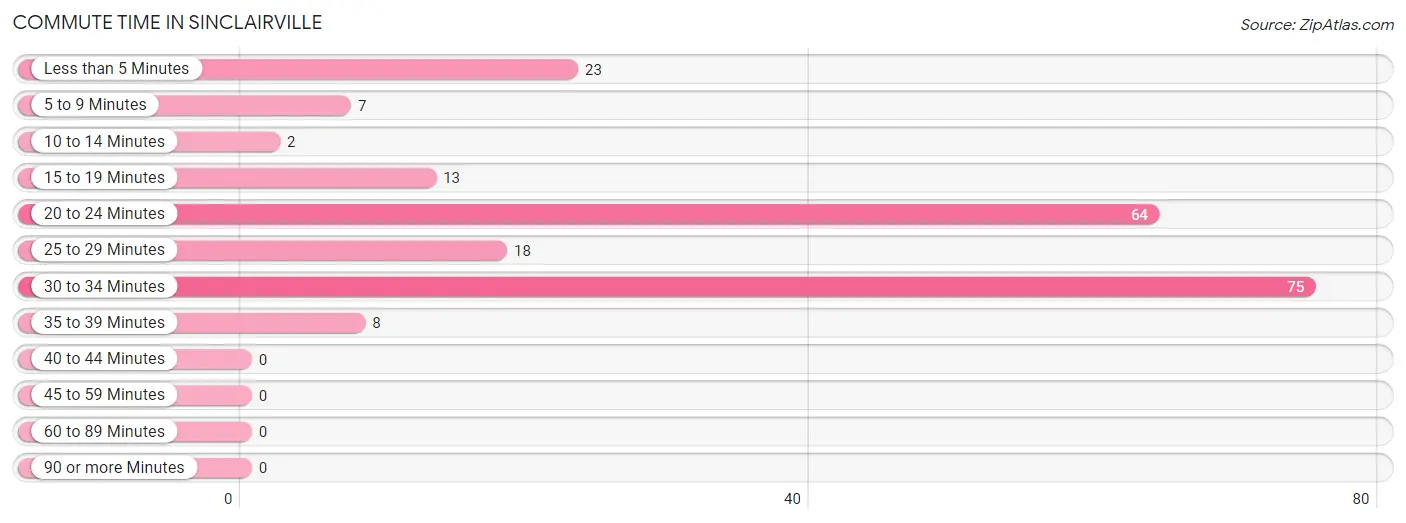
| Commute Time | # Commuters | % Commuters |
| Less than 5 Minutes | 23 | 11.0% |
| 5 to 9 Minutes | 7 | 3.3% |
| 10 to 14 Minutes | 2 | 0.9% |
| 15 to 19 Minutes | 13 | 6.2% |
| 20 to 24 Minutes | 64 | 30.5% |
| 25 to 29 Minutes | 18 | 8.6% |
| 30 to 34 Minutes | 75 | 35.7% |
| 35 to 39 Minutes | 8 | 3.8% |
| 40 to 44 Minutes | 0 | 0.0% |
| 45 to 59 Minutes | 0 | 0.0% |
| 60 to 89 Minutes | 0 | 0.0% |
| 90 or more Minutes | 0 | 0.0% |
Commute Time by Sex in Sinclairville
The most common commute times in Sinclairville are 30 to 34 minutes (48 commuters, 41.7%) for males and 20 to 24 minutes (33 commuters, 34.7%) for females.
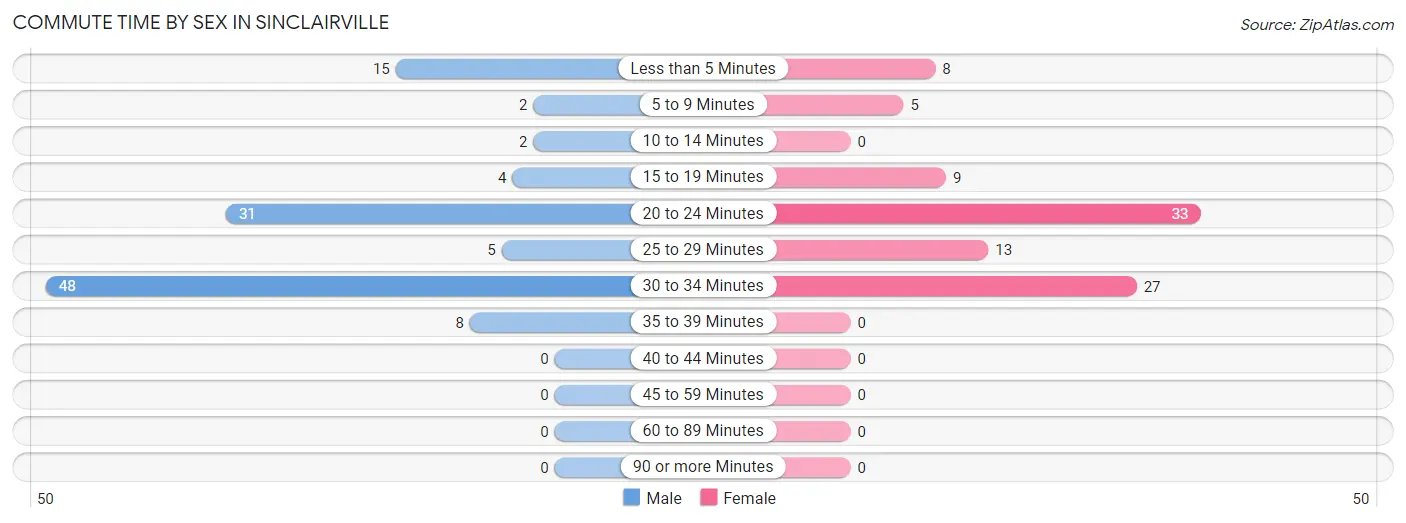
| Commute Time | Male | Female |
| Less than 5 Minutes | 15 (13.0%) | 8 (8.4%) |
| 5 to 9 Minutes | 2 (1.7%) | 5 (5.3%) |
| 10 to 14 Minutes | 2 (1.7%) | 0 (0.0%) |
| 15 to 19 Minutes | 4 (3.5%) | 9 (9.5%) |
| 20 to 24 Minutes | 31 (27.0%) | 33 (34.7%) |
| 25 to 29 Minutes | 5 (4.3%) | 13 (13.7%) |
| 30 to 34 Minutes | 48 (41.7%) | 27 (28.4%) |
| 35 to 39 Minutes | 8 (7.0%) | 0 (0.0%) |
| 40 to 44 Minutes | 0 (0.0%) | 0 (0.0%) |
| 45 to 59 Minutes | 0 (0.0%) | 0 (0.0%) |
| 60 to 89 Minutes | 0 (0.0%) | 0 (0.0%) |
| 90 or more Minutes | 0 (0.0%) | 0 (0.0%) |
Time of Departure to Work by Sex in Sinclairville
The most frequent times of departure to work in Sinclairville are 6:30 AM to 6:59 AM (28, 24.3%) for males and 8:00 AM to 8:29 AM (18, 19.0%) for females.
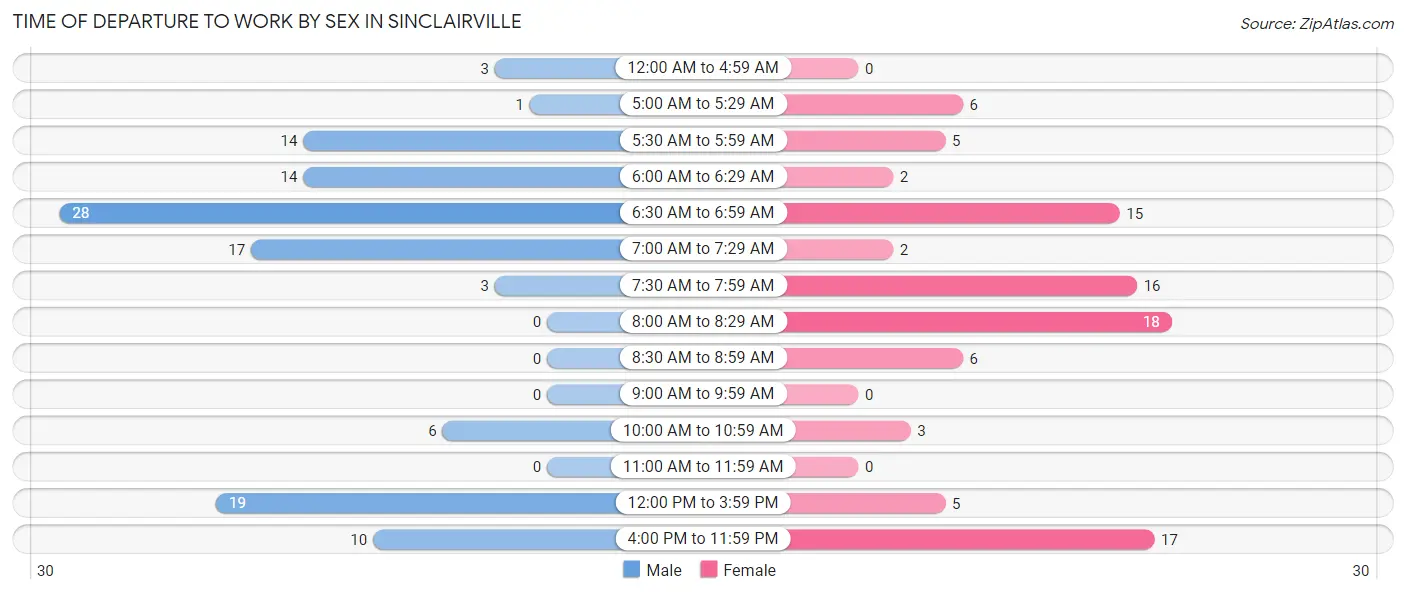
| Time of Departure | Male | Female |
| 12:00 AM to 4:59 AM | 3 (2.6%) | 0 (0.0%) |
| 5:00 AM to 5:29 AM | 1 (0.9%) | 6 (6.3%) |
| 5:30 AM to 5:59 AM | 14 (12.2%) | 5 (5.3%) |
| 6:00 AM to 6:29 AM | 14 (12.2%) | 2 (2.1%) |
| 6:30 AM to 6:59 AM | 28 (24.3%) | 15 (15.8%) |
| 7:00 AM to 7:29 AM | 17 (14.8%) | 2 (2.1%) |
| 7:30 AM to 7:59 AM | 3 (2.6%) | 16 (16.8%) |
| 8:00 AM to 8:29 AM | 0 (0.0%) | 18 (19.0%) |
| 8:30 AM to 8:59 AM | 0 (0.0%) | 6 (6.3%) |
| 9:00 AM to 9:59 AM | 0 (0.0%) | 0 (0.0%) |
| 10:00 AM to 10:59 AM | 6 (5.2%) | 3 (3.2%) |
| 11:00 AM to 11:59 AM | 0 (0.0%) | 0 (0.0%) |
| 12:00 PM to 3:59 PM | 19 (16.5%) | 5 (5.3%) |
| 4:00 PM to 11:59 PM | 10 (8.7%) | 17 (17.9%) |
| Total | 115 (100.0%) | 95 (100.0%) |
Housing Occupancy in Sinclairville
Occupancy by Ownership in Sinclairville
Of the total 274 dwellings in Sinclairville, owner-occupied units account for 191 (69.7%), while renter-occupied units make up 83 (30.3%).
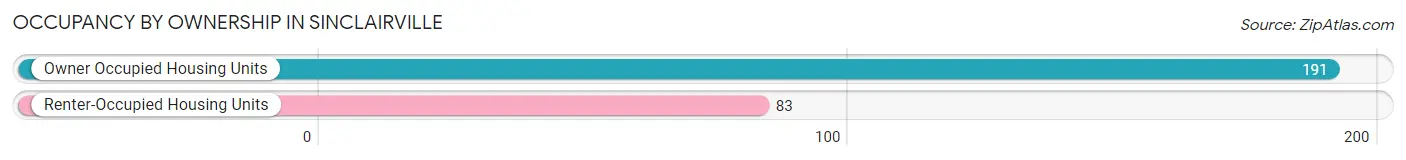
| Occupancy | # Housing Units | % Housing Units |
| Owner Occupied Housing Units | 191 | 69.7% |
| Renter-Occupied Housing Units | 83 | 30.3% |
| Total Occupied Housing Units | 274 | 100.0% |
Occupancy by Household Size in Sinclairville
| Household Size | # Housing Units | % Housing Units |
| 1-Person Household | 111 | 40.5% |
| 2-Person Household | 107 | 39.1% |
| 3-Person Household | 11 | 4.0% |
| 4+ Person Household | 45 | 16.4% |
| Total Housing Units | 274 | 100.0% |
Occupancy by Ownership by Household Size in Sinclairville
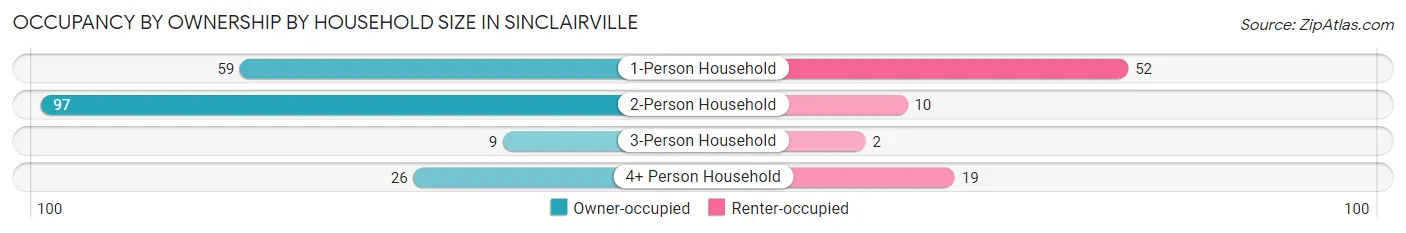
| Household Size | Owner-occupied | Renter-occupied |
| 1-Person Household | 59 (53.1%) | 52 (46.9%) |
| 2-Person Household | 97 (90.6%) | 10 (9.3%) |
| 3-Person Household | 9 (81.8%) | 2 (18.2%) |
| 4+ Person Household | 26 (57.8%) | 19 (42.2%) |
| Total Housing Units | 191 (69.7%) | 83 (30.3%) |
Occupancy by Educational Attainment in Sinclairville
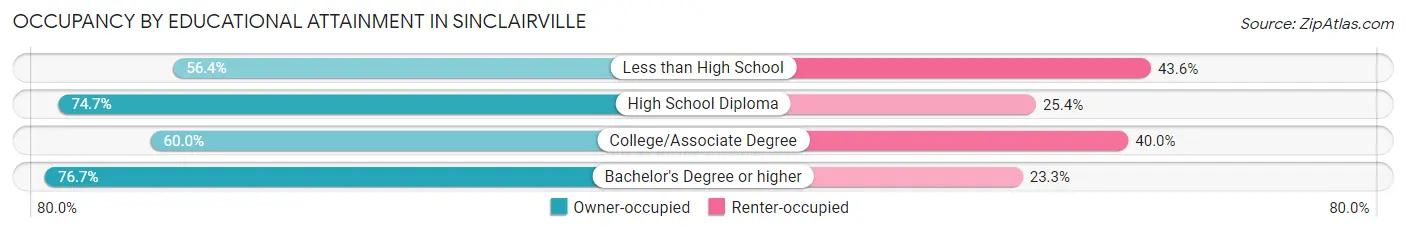
| Household Size | Owner-occupied | Renter-occupied |
| Less than High School | 22 (56.4%) | 17 (43.6%) |
| High School Diploma | 106 (74.7%) | 36 (25.4%) |
| College/Associate Degree | 30 (60.0%) | 20 (40.0%) |
| Bachelor's Degree or higher | 33 (76.7%) | 10 (23.3%) |
Occupancy by Age of Householder in Sinclairville
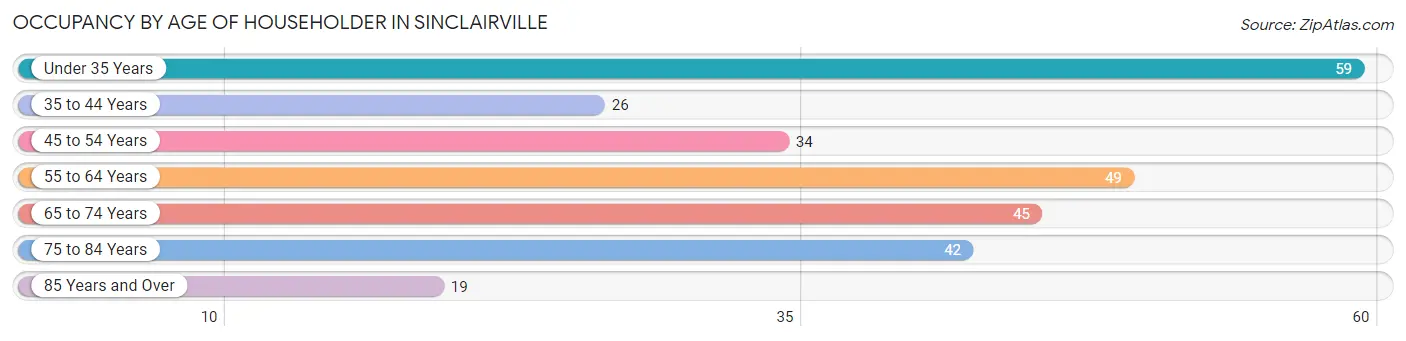
| Age Bracket | # Households | % Households |
| Under 35 Years | 59 | 21.5% |
| 35 to 44 Years | 26 | 9.5% |
| 45 to 54 Years | 34 | 12.4% |
| 55 to 64 Years | 49 | 17.9% |
| 65 to 74 Years | 45 | 16.4% |
| 75 to 84 Years | 42 | 15.3% |
| 85 Years and Over | 19 | 6.9% |
| Total | 274 | 100.0% |
Housing Finances in Sinclairville
Median Income by Occupancy in Sinclairville
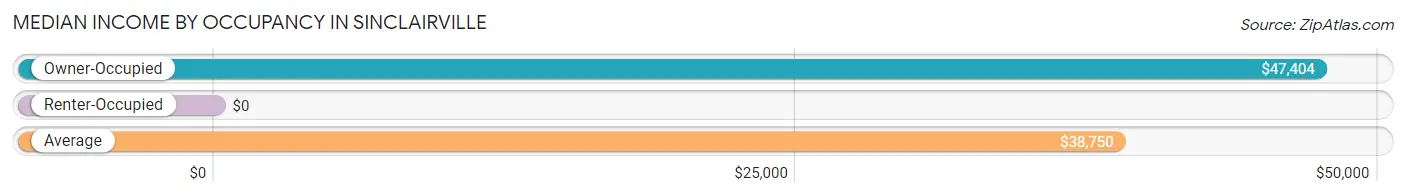
| Occupancy Type | # Households | Median Income |
| Owner-Occupied | 191 (69.7%) | $47,404 |
| Renter-Occupied | 83 (30.3%) | $0 |
| Average | 274 (100.0%) | $38,750 |
Occupancy by Householder Income Bracket in Sinclairville
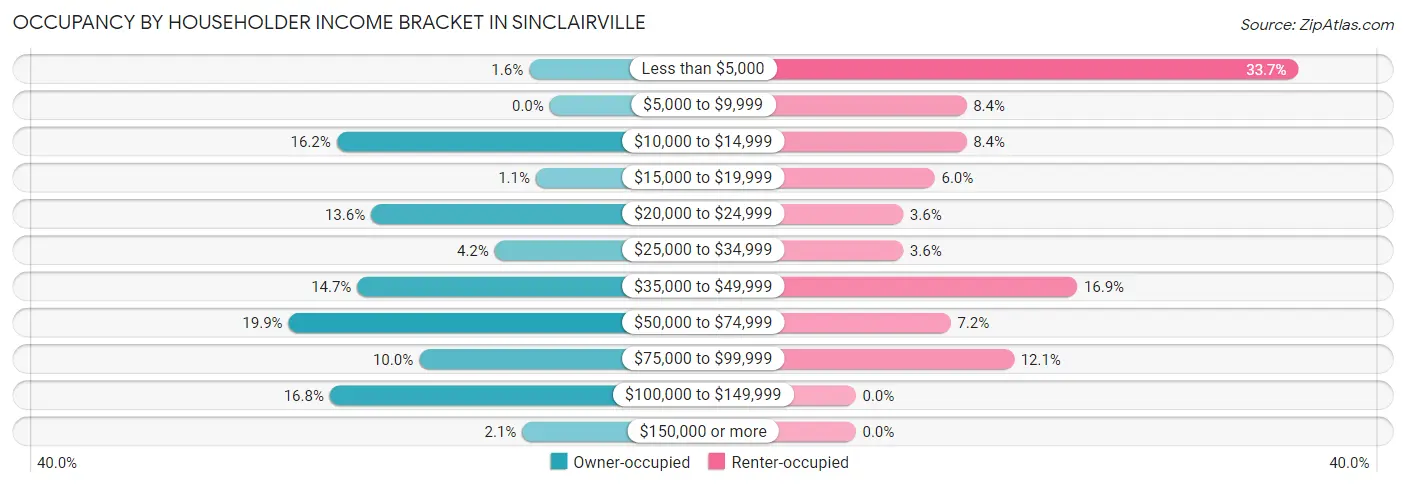
| Income Bracket | Owner-occupied | Renter-occupied |
| Less than $5,000 | 3 (1.6%) | 28 (33.7%) |
| $5,000 to $9,999 | 0 (0.0%) | 7 (8.4%) |
| $10,000 to $14,999 | 31 (16.2%) | 7 (8.4%) |
| $15,000 to $19,999 | 2 (1.1%) | 5 (6.0%) |
| $20,000 to $24,999 | 26 (13.6%) | 3 (3.6%) |
| $25,000 to $34,999 | 8 (4.2%) | 3 (3.6%) |
| $35,000 to $49,999 | 28 (14.7%) | 14 (16.9%) |
| $50,000 to $74,999 | 38 (19.9%) | 6 (7.2%) |
| $75,000 to $99,999 | 19 (10.0%) | 10 (12.0%) |
| $100,000 to $149,999 | 32 (16.8%) | 0 (0.0%) |
| $150,000 or more | 4 (2.1%) | 0 (0.0%) |
| Total | 191 (100.0%) | 83 (100.0%) |
Monthly Housing Cost Tiers in Sinclairville
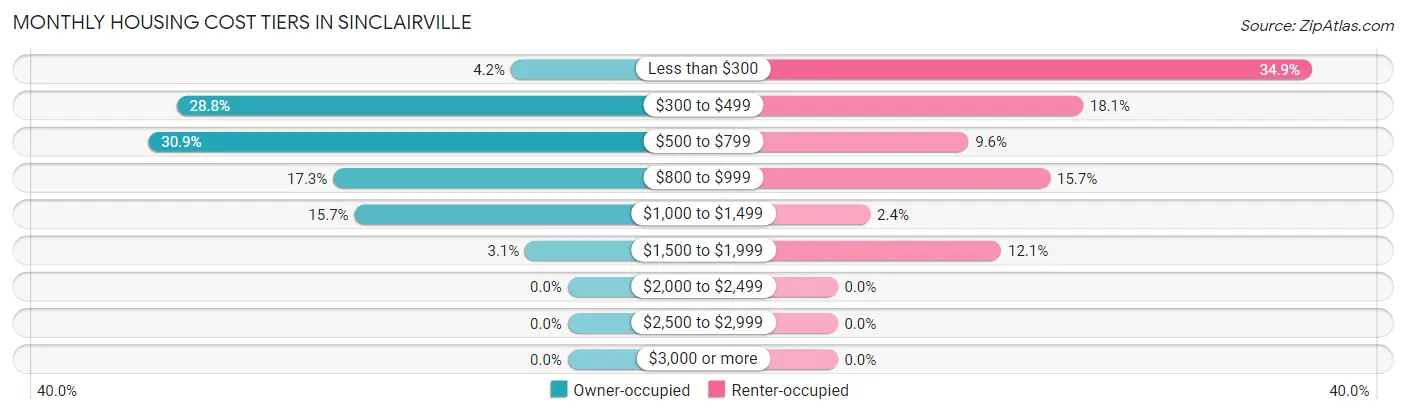
| Monthly Cost | Owner-occupied | Renter-occupied |
| Less than $300 | 8 (4.2%) | 29 (34.9%) |
| $300 to $499 | 55 (28.8%) | 15 (18.1%) |
| $500 to $799 | 59 (30.9%) | 8 (9.6%) |
| $800 to $999 | 33 (17.3%) | 13 (15.7%) |
| $1,000 to $1,499 | 30 (15.7%) | 2 (2.4%) |
| $1,500 to $1,999 | 6 (3.1%) | 10 (12.0%) |
| $2,000 to $2,499 | 0 (0.0%) | 0 (0.0%) |
| $2,500 to $2,999 | 0 (0.0%) | 0 (0.0%) |
| $3,000 or more | 0 (0.0%) | 0 (0.0%) |
| Total | 191 (100.0%) | 83 (100.0%) |
Physical Housing Characteristics in Sinclairville
Housing Structures in Sinclairville
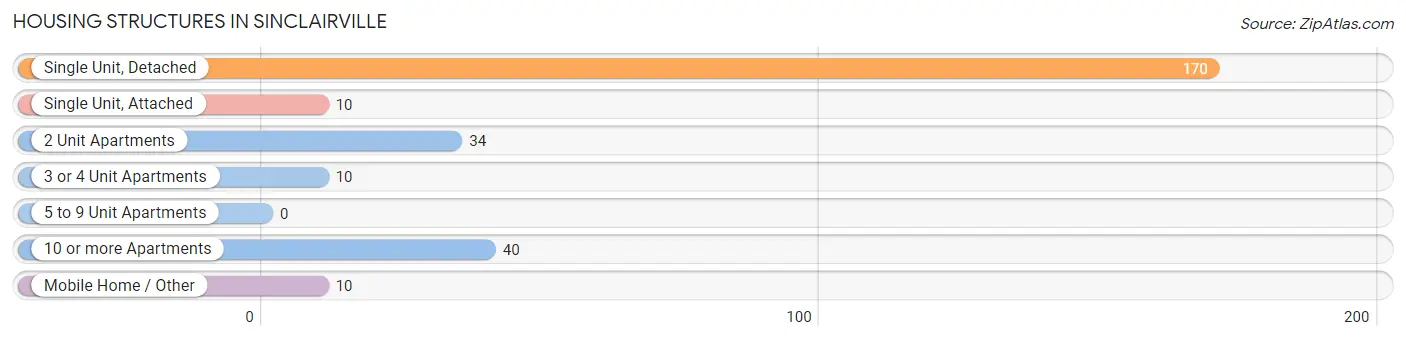
| Structure Type | # Housing Units | % Housing Units |
| Single Unit, Detached | 170 | 62.0% |
| Single Unit, Attached | 10 | 3.6% |
| 2 Unit Apartments | 34 | 12.4% |
| 3 or 4 Unit Apartments | 10 | 3.6% |
| 5 to 9 Unit Apartments | 0 | 0.0% |
| 10 or more Apartments | 40 | 14.6% |
| Mobile Home / Other | 10 | 3.6% |
| Total | 274 | 100.0% |
Housing Structures by Occupancy in Sinclairville
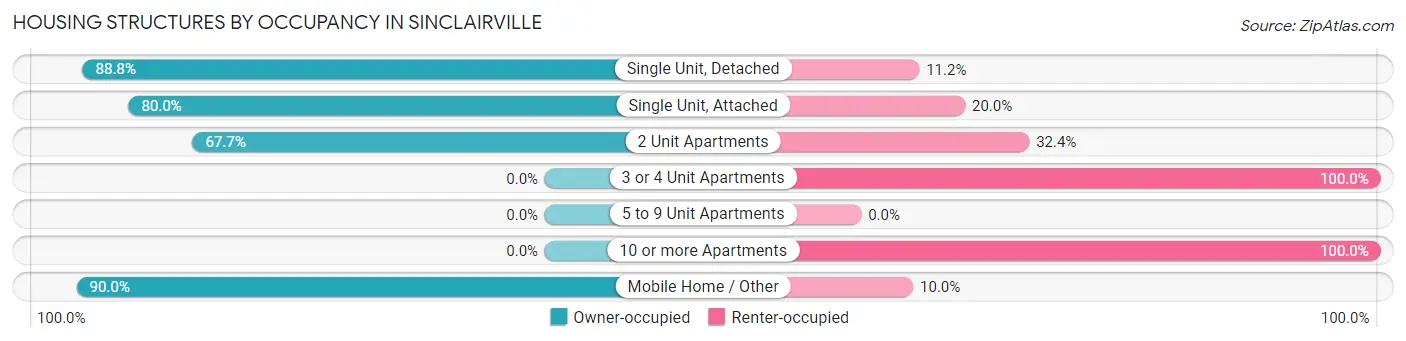
| Structure Type | Owner-occupied | Renter-occupied |
| Single Unit, Detached | 151 (88.8%) | 19 (11.2%) |
| Single Unit, Attached | 8 (80.0%) | 2 (20.0%) |
| 2 Unit Apartments | 23 (67.6%) | 11 (32.4%) |
| 3 or 4 Unit Apartments | 0 (0.0%) | 10 (100.0%) |
| 5 to 9 Unit Apartments | 0 (0.0%) | 0 (0.0%) |
| 10 or more Apartments | 0 (0.0%) | 40 (100.0%) |
| Mobile Home / Other | 9 (90.0%) | 1 (10.0%) |
| Total | 191 (69.7%) | 83 (30.3%) |
Housing Structures by Number of Rooms in Sinclairville
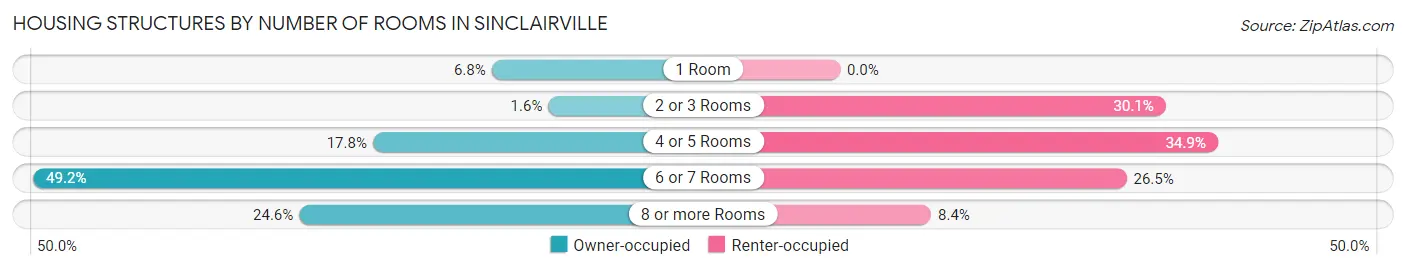
| Number of Rooms | Owner-occupied | Renter-occupied |
| 1 Room | 13 (6.8%) | 0 (0.0%) |
| 2 or 3 Rooms | 3 (1.6%) | 25 (30.1%) |
| 4 or 5 Rooms | 34 (17.8%) | 29 (34.9%) |
| 6 or 7 Rooms | 94 (49.2%) | 22 (26.5%) |
| 8 or more Rooms | 47 (24.6%) | 7 (8.4%) |
| Total | 191 (100.0%) | 83 (100.0%) |
Housing Structure by Heating Type in Sinclairville
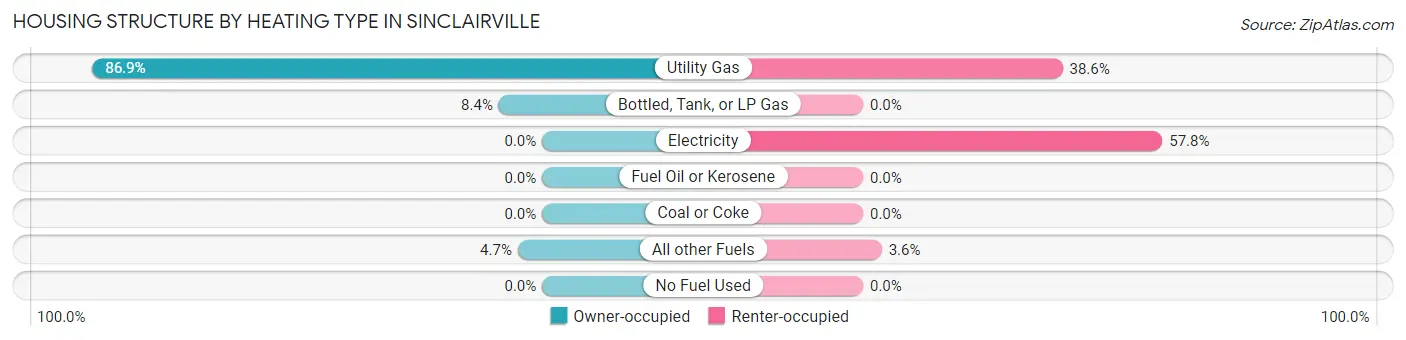
| Heating Type | Owner-occupied | Renter-occupied |
| Utility Gas | 166 (86.9%) | 32 (38.6%) |
| Bottled, Tank, or LP Gas | 16 (8.4%) | 0 (0.0%) |
| Electricity | 0 (0.0%) | 48 (57.8%) |
| Fuel Oil or Kerosene | 0 (0.0%) | 0 (0.0%) |
| Coal or Coke | 0 (0.0%) | 0 (0.0%) |
| All other Fuels | 9 (4.7%) | 3 (3.6%) |
| No Fuel Used | 0 (0.0%) | 0 (0.0%) |
| Total | 191 (100.0%) | 83 (100.0%) |
Household Vehicle Usage in Sinclairville
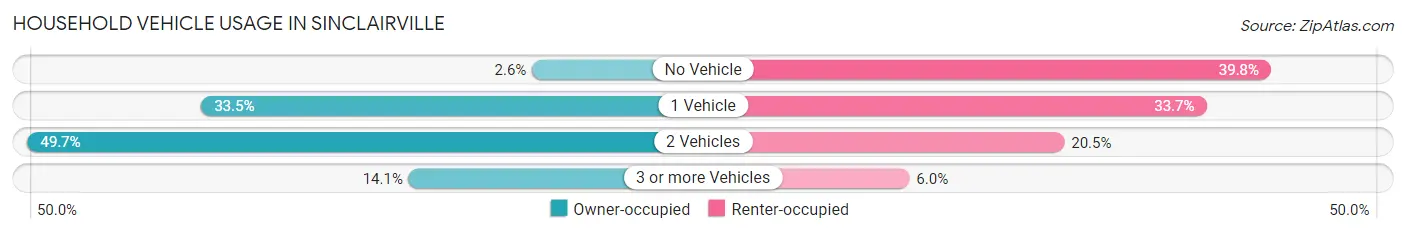
| Vehicles per Household | Owner-occupied | Renter-occupied |
| No Vehicle | 5 (2.6%) | 33 (39.8%) |
| 1 Vehicle | 64 (33.5%) | 28 (33.7%) |
| 2 Vehicles | 95 (49.7%) | 17 (20.5%) |
| 3 or more Vehicles | 27 (14.1%) | 5 (6.0%) |
| Total | 191 (100.0%) | 83 (100.0%) |
Real Estate & Mortgages in Sinclairville
Real Estate and Mortgage Overview in Sinclairville
| Characteristic | Without Mortgage | With Mortgage |
| Housing Units | 112 | 79 |
| Median Property Value | $77,600 | $86,500 |
| Median Household Income | $48,750 | $2 |
| Monthly Housing Costs | $481 | $0 |
| Real Estate Taxes | $2,750 | $0 |
Property Value by Mortgage Status in Sinclairville
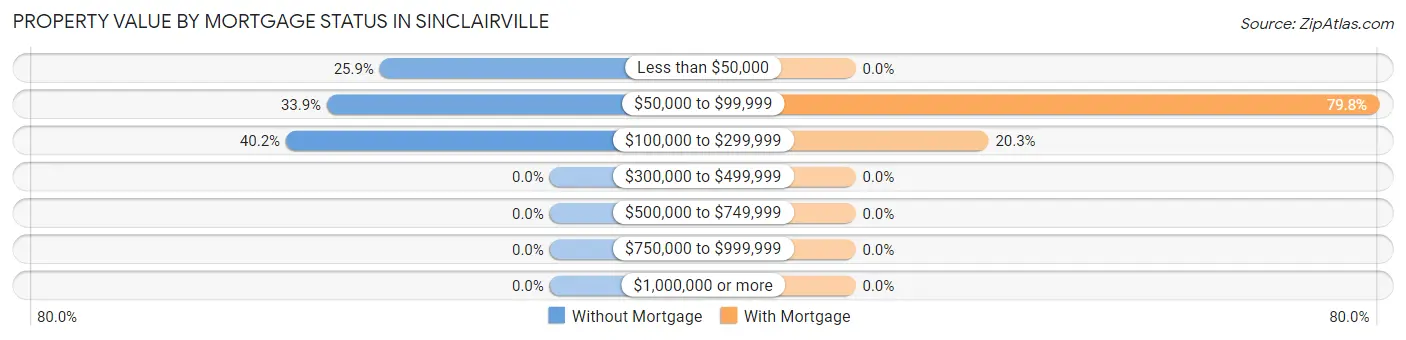
| Property Value | Without Mortgage | With Mortgage |
| Less than $50,000 | 29 (25.9%) | 0 (0.0%) |
| $50,000 to $99,999 | 38 (33.9%) | 63 (79.7%) |
| $100,000 to $299,999 | 45 (40.2%) | 16 (20.3%) |
| $300,000 to $499,999 | 0 (0.0%) | 0 (0.0%) |
| $500,000 to $749,999 | 0 (0.0%) | 0 (0.0%) |
| $750,000 to $999,999 | 0 (0.0%) | 0 (0.0%) |
| $1,000,000 or more | 0 (0.0%) | 0 (0.0%) |
| Total | 112 (100.0%) | 79 (100.0%) |
Household Income by Mortgage Status in Sinclairville
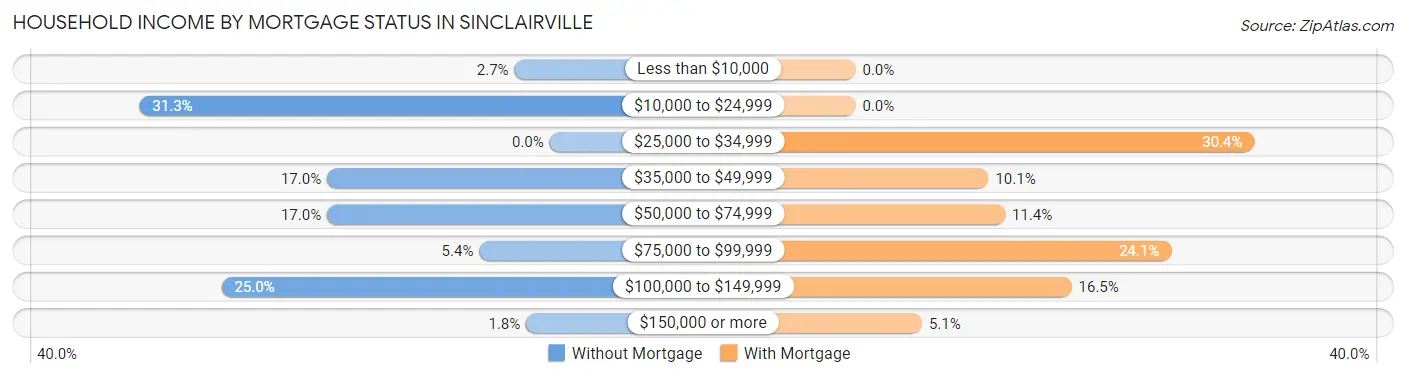
| Household Income | Without Mortgage | With Mortgage |
| Less than $10,000 | 3 (2.7%) | 0 (0.0%) |
| $10,000 to $24,999 | 35 (31.2%) | 0 (0.0%) |
| $25,000 to $34,999 | 0 (0.0%) | 24 (30.4%) |
| $35,000 to $49,999 | 19 (17.0%) | 8 (10.1%) |
| $50,000 to $74,999 | 19 (17.0%) | 9 (11.4%) |
| $75,000 to $99,999 | 6 (5.4%) | 19 (24.0%) |
| $100,000 to $149,999 | 28 (25.0%) | 13 (16.5%) |
| $150,000 or more | 2 (1.8%) | 4 (5.1%) |
| Total | 112 (100.0%) | 79 (100.0%) |
Property Value to Household Income Ratio in Sinclairville
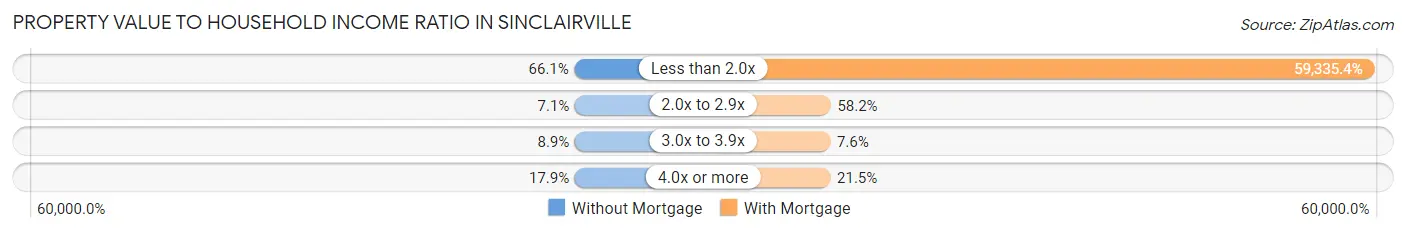
| Value-to-Income Ratio | Without Mortgage | With Mortgage |
| Less than 2.0x | 74 (66.1%) | 46,875 (59,335.4%) |
| 2.0x to 2.9x | 8 (7.1%) | 46 (58.2%) |
| 3.0x to 3.9x | 10 (8.9%) | 6 (7.6%) |
| 4.0x or more | 20 (17.9%) | 17 (21.5%) |
| Total | 112 (100.0%) | 79 (100.0%) |
Real Estate Taxes by Mortgage Status in Sinclairville
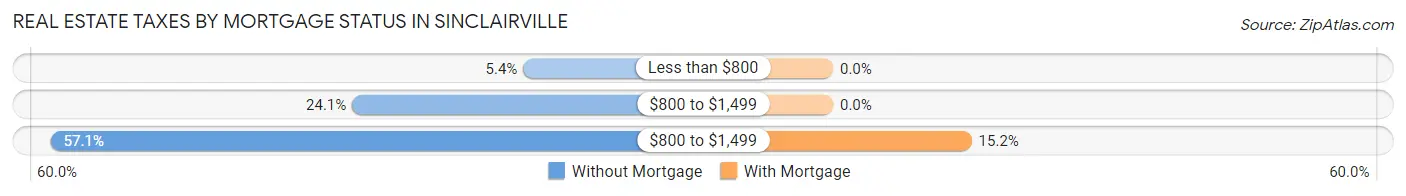
| Property Taxes | Without Mortgage | With Mortgage |
| Less than $800 | 6 (5.4%) | 0 (0.0%) |
| $800 to $1,499 | 27 (24.1%) | 0 (0.0%) |
| $800 to $1,499 | 64 (57.1%) | 12 (15.2%) |
| Total | 112 (100.0%) | 79 (100.0%) |
Health & Disability in Sinclairville
Health Insurance Coverage by Age in Sinclairville
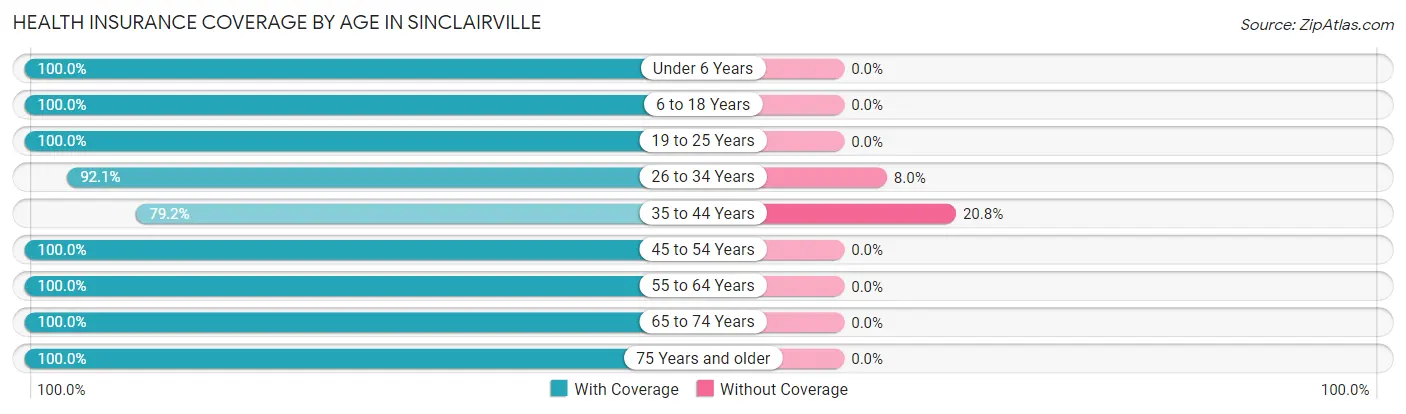
| Age Bracket | With Coverage | Without Coverage |
| Under 6 Years | 45 (100.0%) | 0 (0.0%) |
| 6 to 18 Years | 105 (100.0%) | 0 (0.0%) |
| 19 to 25 Years | 21 (100.0%) | 0 (0.0%) |
| 26 to 34 Years | 81 (92.0%) | 7 (8.0%) |
| 35 to 44 Years | 38 (79.2%) | 10 (20.8%) |
| 45 to 54 Years | 62 (100.0%) | 0 (0.0%) |
| 55 to 64 Years | 68 (100.0%) | 0 (0.0%) |
| 65 to 74 Years | 72 (100.0%) | 0 (0.0%) |
| 75 Years and older | 86 (100.0%) | 0 (0.0%) |
| Total | 578 (97.1%) | 17 (2.9%) |
Health Insurance Coverage by Citizenship Status in Sinclairville
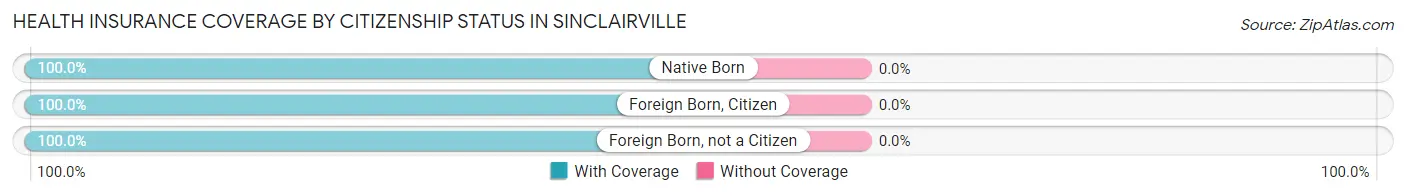
| Citizenship Status | With Coverage | Without Coverage |
| Native Born | 45 (100.0%) | 0 (0.0%) |
| Foreign Born, Citizen | 105 (100.0%) | 0 (0.0%) |
| Foreign Born, not a Citizen | 21 (100.0%) | 0 (0.0%) |
Health Insurance Coverage by Household Income in Sinclairville
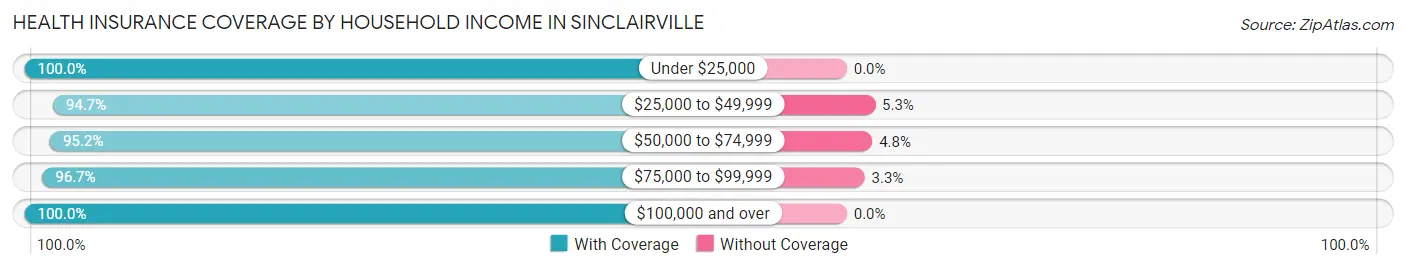
| Household Income | With Coverage | Without Coverage |
| Under $25,000 | 142 (100.0%) | 0 (0.0%) |
| $25,000 to $49,999 | 125 (94.7%) | 7 (5.3%) |
| $50,000 to $74,999 | 140 (95.2%) | 7 (4.8%) |
| $75,000 to $99,999 | 87 (96.7%) | 3 (3.3%) |
| $100,000 and over | 84 (100.0%) | 0 (0.0%) |
Public vs Private Health Insurance Coverage by Age in Sinclairville
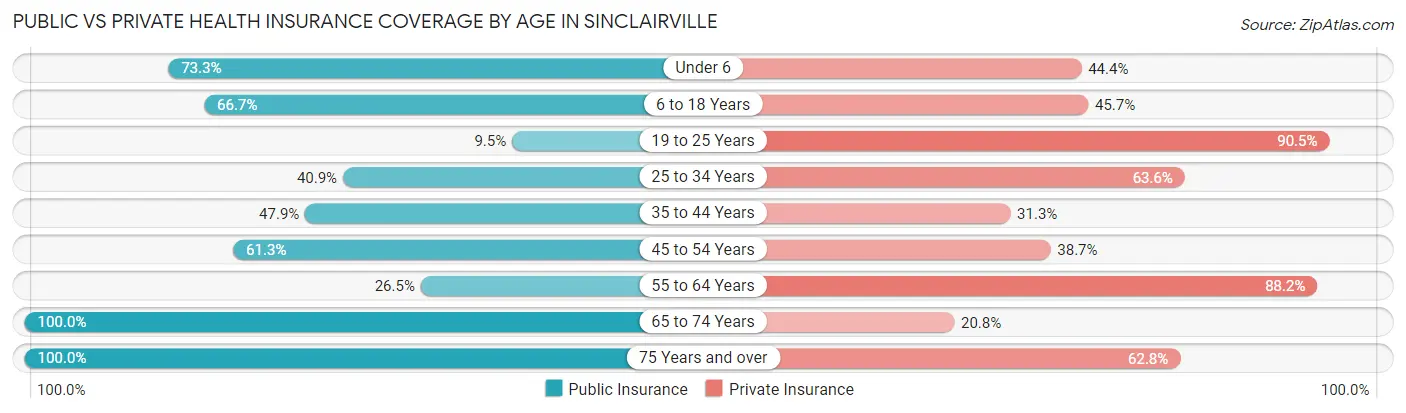
| Age Bracket | Public Insurance | Private Insurance |
| Under 6 | 33 (73.3%) | 20 (44.4%) |
| 6 to 18 Years | 70 (66.7%) | 48 (45.7%) |
| 19 to 25 Years | 2 (9.5%) | 19 (90.5%) |
| 25 to 34 Years | 36 (40.9%) | 56 (63.6%) |
| 35 to 44 Years | 23 (47.9%) | 15 (31.2%) |
| 45 to 54 Years | 38 (61.3%) | 24 (38.7%) |
| 55 to 64 Years | 18 (26.5%) | 60 (88.2%) |
| 65 to 74 Years | 72 (100.0%) | 15 (20.8%) |
| 75 Years and over | 86 (100.0%) | 54 (62.8%) |
| Total | 378 (63.5%) | 311 (52.3%) |
Disability Status by Sex by Age in Sinclairville
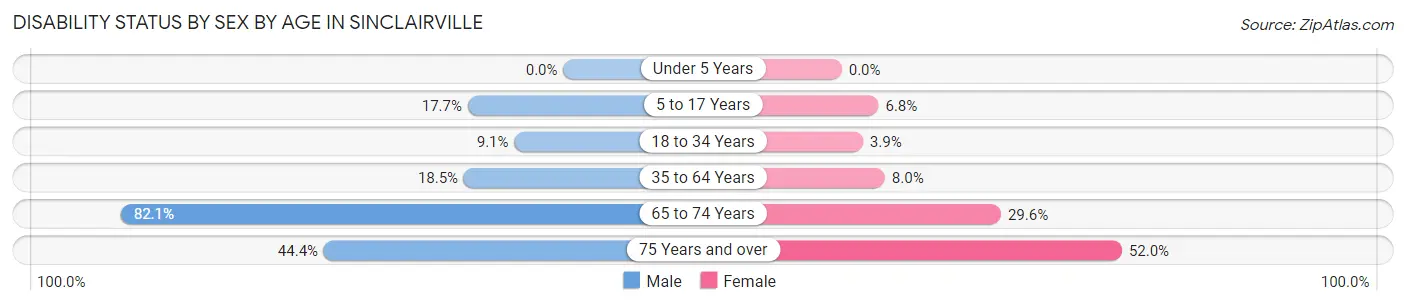
| Age Bracket | Male | Female |
| Under 5 Years | 0 (0.0%) | 0 (0.0%) |
| 5 to 17 Years | 11 (17.7%) | 3 (6.8%) |
| 18 to 34 Years | 6 (9.1%) | 2 (3.9%) |
| 35 to 64 Years | 19 (18.4%) | 6 (8.0%) |
| 65 to 74 Years | 23 (82.1%) | 13 (29.5%) |
| 75 Years and over | 16 (44.4%) | 26 (52.0%) |
Disability Class by Sex by Age in Sinclairville
Disability Class: Hearing Difficulty
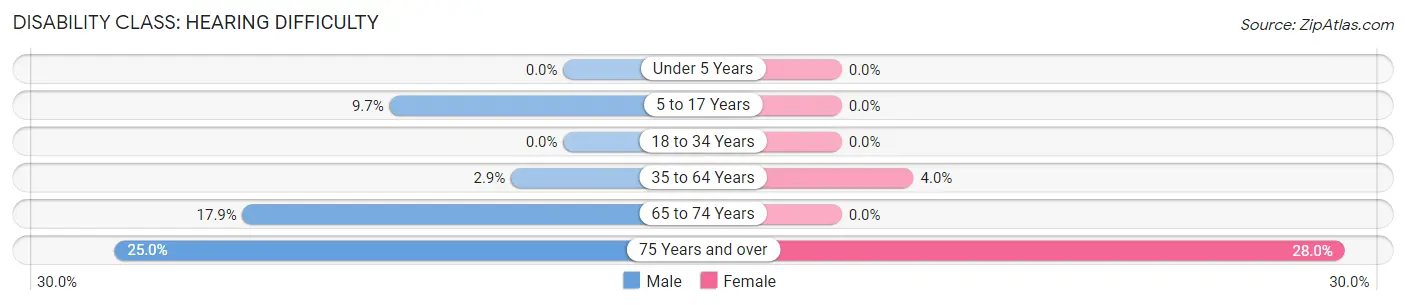
| Age Bracket | Male | Female |
| Under 5 Years | 0 (0.0%) | 0 (0.0%) |
| 5 to 17 Years | 6 (9.7%) | 0 (0.0%) |
| 18 to 34 Years | 0 (0.0%) | 0 (0.0%) |
| 35 to 64 Years | 3 (2.9%) | 3 (4.0%) |
| 65 to 74 Years | 5 (17.9%) | 0 (0.0%) |
| 75 Years and over | 9 (25.0%) | 14 (28.0%) |
Disability Class: Vision Difficulty
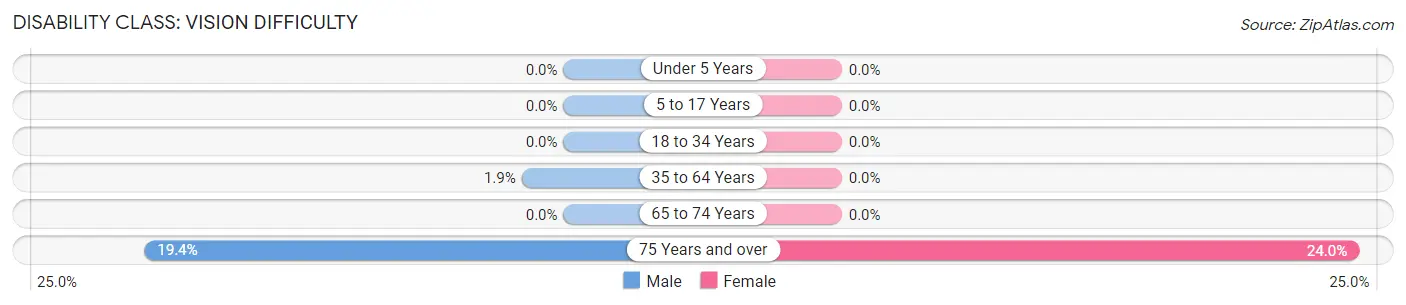
| Age Bracket | Male | Female |
| Under 5 Years | 0 (0.0%) | 0 (0.0%) |
| 5 to 17 Years | 0 (0.0%) | 0 (0.0%) |
| 18 to 34 Years | 0 (0.0%) | 0 (0.0%) |
| 35 to 64 Years | 2 (1.9%) | 0 (0.0%) |
| 65 to 74 Years | 0 (0.0%) | 0 (0.0%) |
| 75 Years and over | 7 (19.4%) | 12 (24.0%) |
Disability Class: Cognitive Difficulty
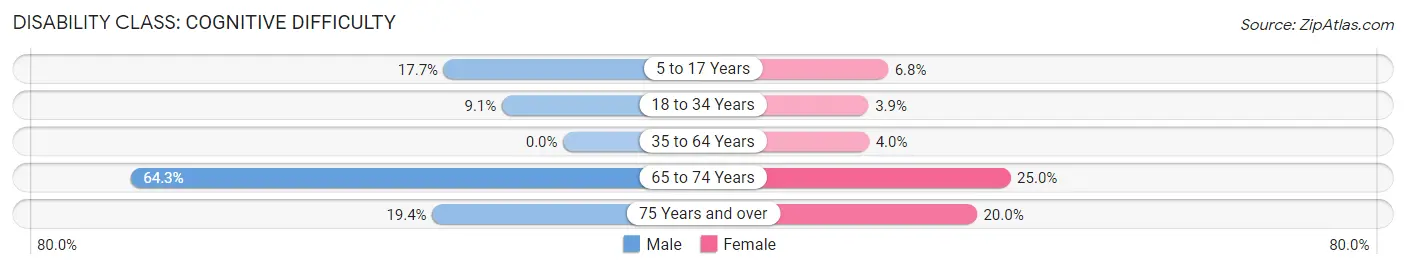
| Age Bracket | Male | Female |
| 5 to 17 Years | 11 (17.7%) | 3 (6.8%) |
| 18 to 34 Years | 6 (9.1%) | 2 (3.9%) |
| 35 to 64 Years | 0 (0.0%) | 3 (4.0%) |
| 65 to 74 Years | 18 (64.3%) | 11 (25.0%) |
| 75 Years and over | 7 (19.4%) | 10 (20.0%) |
Disability Class: Ambulatory Difficulty
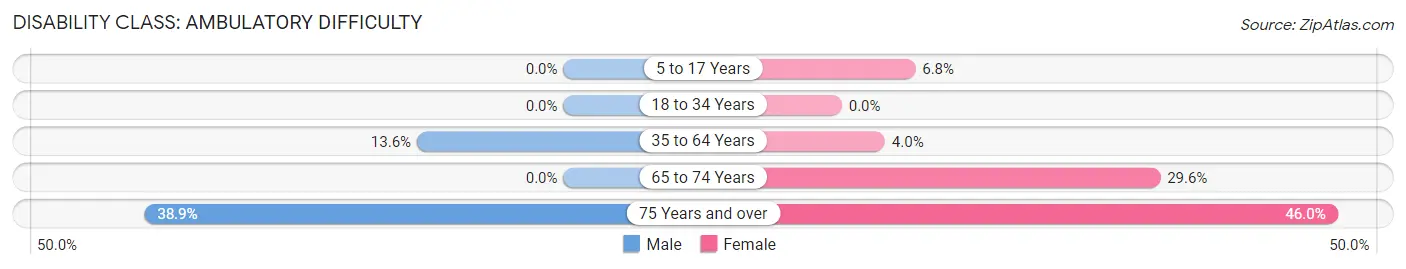
| Age Bracket | Male | Female |
| 5 to 17 Years | 0 (0.0%) | 3 (6.8%) |
| 18 to 34 Years | 0 (0.0%) | 0 (0.0%) |
| 35 to 64 Years | 14 (13.6%) | 3 (4.0%) |
| 65 to 74 Years | 0 (0.0%) | 13 (29.5%) |
| 75 Years and over | 14 (38.9%) | 23 (46.0%) |
Disability Class: Self-Care Difficulty
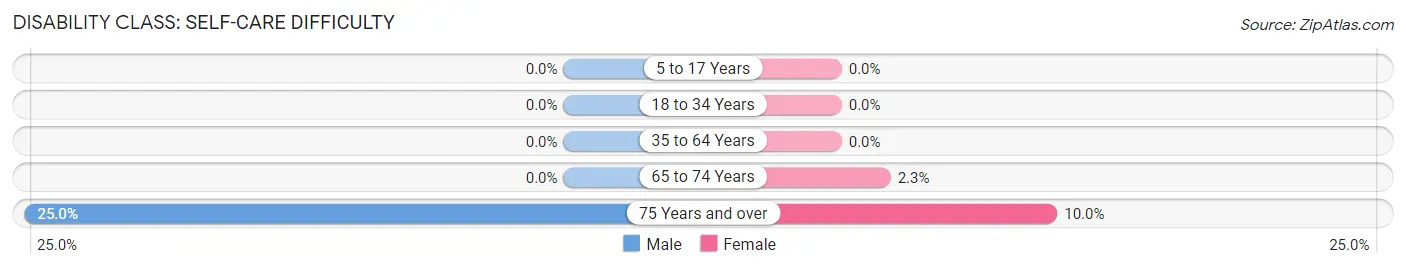
| Age Bracket | Male | Female |
| 5 to 17 Years | 0 (0.0%) | 0 (0.0%) |
| 18 to 34 Years | 0 (0.0%) | 0 (0.0%) |
| 35 to 64 Years | 0 (0.0%) | 0 (0.0%) |
| 65 to 74 Years | 0 (0.0%) | 1 (2.3%) |
| 75 Years and over | 9 (25.0%) | 5 (10.0%) |
Technology Access in Sinclairville
Computing Device Access in Sinclairville
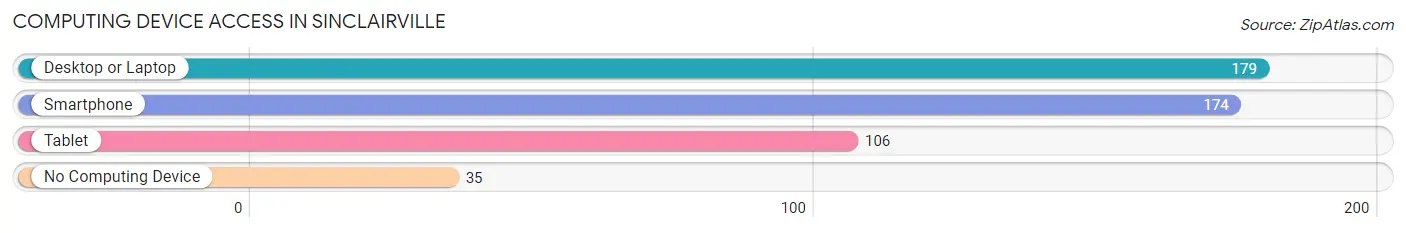
| Device Type | # Households | % Households |
| Desktop or Laptop | 179 | 65.3% |
| Smartphone | 174 | 63.5% |
| Tablet | 106 | 38.7% |
| No Computing Device | 35 | 12.8% |
| Total | 274 | 100.0% |
Internet Access in Sinclairville
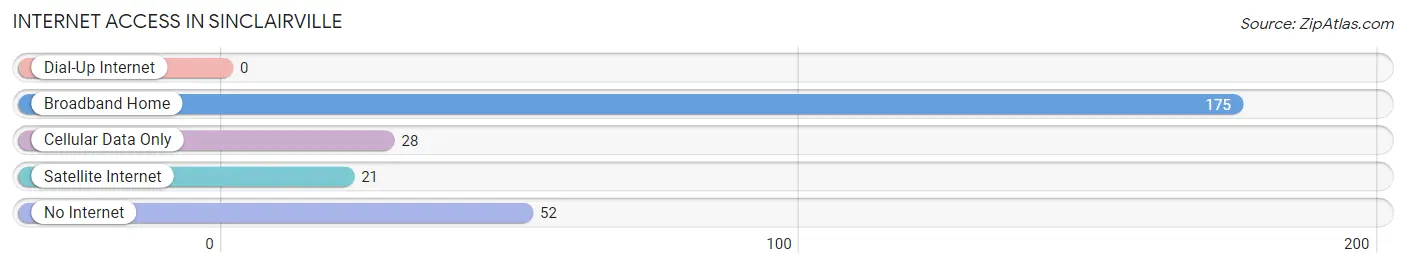
| Internet Type | # Households | % Households |
| Dial-Up Internet | 0 | 0.0% |
| Broadband Home | 175 | 63.9% |
| Cellular Data Only | 28 | 10.2% |
| Satellite Internet | 21 | 7.7% |
| No Internet | 52 | 19.0% |
| Total | 274 | 100.0% |
Sinclairville Summary
Sinclairville is a small hamlet located in the town of Charlotte in Chautauqua County, New York. It is situated in the southwestern corner of the county, near the Pennsylvania border. The hamlet is named after William Sinclair, who was an early settler in the area.
History
The area that is now Sinclairville was first settled in 1811 by William Sinclair, who was a veteran of the War of 1812. He purchased a large tract of land from the Holland Land Company and built a log cabin on the property. The area was known as Sinclairville by 1820, and the hamlet was officially incorporated in 1845.
In the late 19th century, Sinclairville was a thriving agricultural community. It was home to several grist mills, sawmills, and a tannery. The hamlet also had a post office, a general store, and a blacksmith shop.
In the early 20th century, Sinclairville began to decline as the population shifted to larger cities. The grist mills and sawmills closed, and the tannery moved away. The post office closed in the 1950s, and the general store closed in the 1970s.
Geography
Sinclairville is located in the southwestern corner of Chautauqua County, near the Pennsylvania border. It is situated in the foothills of the Allegheny Mountains, and the terrain is mostly rolling hills. The hamlet is located on the banks of the Cassadaga Creek, which flows through the area.
The climate in Sinclairville is humid continental, with cold winters and warm summers. The average annual temperature is around 50°F (10°C), and the average annual precipitation is around 40 inches (102 cm).
Economy
Sinclairville is a small, rural community with a limited economy. The main industries in the area are agriculture and tourism. The hamlet is home to several small farms, which produce a variety of crops, including corn, soybeans, and hay.
The hamlet also has a few small businesses, including a gas station, a convenience store, and a few restaurants. There is also a small manufacturing plant in the area, which produces plastic products.
Demographics
As of the 2010 census, the population of Sinclairville was 1,093. The racial makeup of the hamlet was 97.3% White, 0.7% African American, 0.3% Native American, 0.2% Asian, and 1.5% from other races. The median household income was $41,250, and the median family income was $48,750.
The population of Sinclairville is mostly Christian, with a small percentage of other religions. The hamlet is served by the Cassadaga Valley Central School District, which includes a high school, a middle school, and an elementary school.
Conclusion
Sinclairville is a small hamlet located in the southwestern corner of Chautauqua County, New York. It was first settled in 1811 by William Sinclair, and the hamlet was officially incorporated in 1845. The hamlet has a limited economy, with the main industries being agriculture and tourism. The population of Sinclairville is mostly Christian, and the median household income is around $41,250.
Common Questions
What is Per Capita Income in Sinclairville?
Per Capita income in Sinclairville is $22,415.
What is the Median Family Income in Sinclairville?
Median Family Income in Sinclairville is $67,778.
What is the Median Household income in Sinclairville?
Median Household Income in Sinclairville is $38,750.
What is Income or Wage Gap in Sinclairville?
Income or Wage Gap in Sinclairville is 20.0%.
Women in Sinclairville earn 80.0 cents for every dollar earned by a man.
What is Inequality or Gini Index in Sinclairville?
Inequality or Gini Index in Sinclairville is 0.46.
What is the Total Population of Sinclairville?
Total Population of Sinclairville is 595.
What is the Total Male Population of Sinclairville?
Total Male Population of Sinclairville is 309.
What is the Total Female Population of Sinclairville?
Total Female Population of Sinclairville is 286.
What is the Ratio of Males per 100 Females in Sinclairville?
There are 108.04 Males per 100 Females in Sinclairville.
What is the Ratio of Females per 100 Males in Sinclairville?
There are 92.56 Females per 100 Males in Sinclairville.
What is the Median Population Age in Sinclairville?
Median Population Age in Sinclairville is 42.7 Years.
What is the Average Family Size in Sinclairville
Average Family Size in Sinclairville is 3.0 People.
What is the Average Household Size in Sinclairville
Average Household Size in Sinclairville is 2.2 People.
How Large is the Labor Force in Sinclairville?
There are 229 People in the Labor Forcein in Sinclairville.
What is the Percentage of People in the Labor Force in Sinclairville?
48.3% of People are in the Labor Force in Sinclairville.
What is the Unemployment Rate in Sinclairville?
Unemployment Rate in Sinclairville is 2.2%.