Sidney, NY Map & Demographics
Sidney Map
Sidney Overview
$25,510
PER CAPITA INCOME
$74,911
AVG FAMILY INCOME
$56,667
AVG HOUSEHOLD INCOME
19.3%
WAGE / INCOME GAP [ % ]
80.7¢/ $1
WAGE / INCOME GAP [ $ ]
0.41
INEQUALITY / GINI INDEX
3,750
TOTAL POPULATION
1,795
MALE POPULATION
1,955
FEMALE POPULATION
91.82
MALES / 100 FEMALES
108.91
FEMALES / 100 MALES
43.8
MEDIAN AGE
3.2
AVG FAMILY SIZE
2.5
AVG HOUSEHOLD SIZE
1,676
LABOR FORCE [ PEOPLE ]
57.5%
PERCENT IN LABOR FORCE
11.2%
UNEMPLOYMENT RATE
Sidney Zip Codes
Sidney Area Codes
Income in Sidney
Income Overview in Sidney
Per Capita Income in Sidney is $25,510, while median incomes of families and households are $74,911 and $56,667 respectively.
| Characteristic | Number | Measure |
| Per Capita Income | 3,750 | $25,510 |
| Median Family Income | 846 | $74,911 |
| Mean Family Income | 846 | $77,530 |
| Median Household Income | 1,490 | $56,667 |
| Mean Household Income | 1,490 | $62,224 |
| Income Deficit | 846 | $0 |
| Wage / Income Gap (%) | 3,750 | 19.34% |
| Wage / Income Gap ($) | 3,750 | 80.66¢ per $1 |
| Gini / Inequality Index | 3,750 | 0.41 |
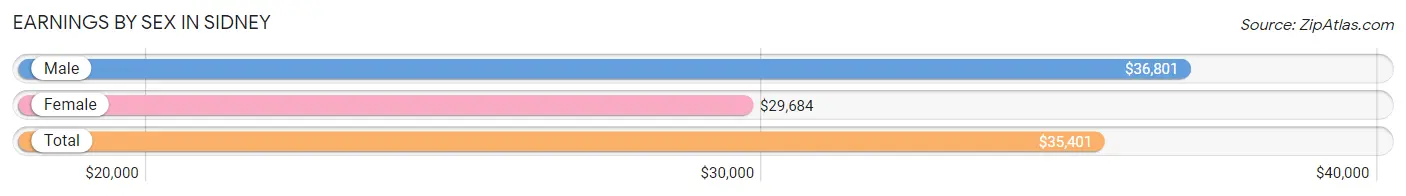
Earnings by Sex in Sidney
Average Earnings in Sidney are $35,401, $36,801 for men and $29,684 for women, a difference of 19.3%.
| Sex | Number | Average Earnings |
| Male | 918 (52.2%) | $36,801 |
| Female | 840 (47.8%) | $29,684 |
| Total | 1,758 (100.0%) | $35,401 |
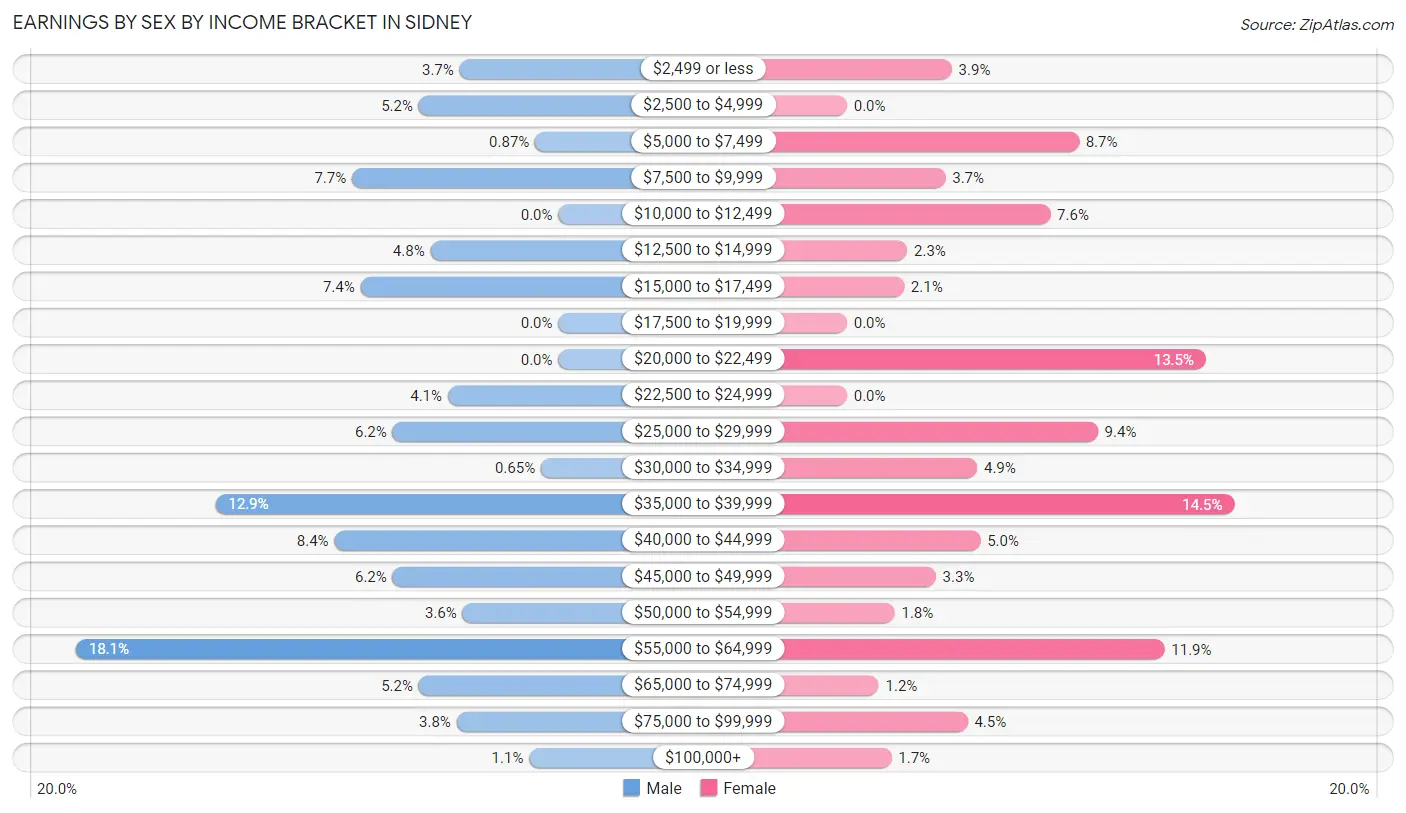
Earnings by Sex by Income Bracket in Sidney
The most common earnings brackets in Sidney are $55,000 to $64,999 for men (166 | 18.1%) and $35,000 to $39,999 for women (122 | 14.5%).
| Income | Male | Female |
| $2,499 or less | 34 (3.7%) | 33 (3.9%) |
| $2,500 to $4,999 | 48 (5.2%) | 0 (0.0%) |
| $5,000 to $7,499 | 8 (0.9%) | 73 (8.7%) |
| $7,500 to $9,999 | 71 (7.7%) | 31 (3.7%) |
| $10,000 to $12,499 | 0 (0.0%) | 64 (7.6%) |
| $12,500 to $14,999 | 44 (4.8%) | 19 (2.3%) |
| $15,000 to $17,499 | 68 (7.4%) | 18 (2.1%) |
| $17,500 to $19,999 | 0 (0.0%) | 0 (0.0%) |
| $20,000 to $22,499 | 0 (0.0%) | 113 (13.5%) |
| $22,500 to $24,999 | 38 (4.1%) | 0 (0.0%) |
| $25,000 to $29,999 | 57 (6.2%) | 79 (9.4%) |
| $30,000 to $34,999 | 6 (0.6%) | 41 (4.9%) |
| $35,000 to $39,999 | 118 (12.9%) | 122 (14.5%) |
| $40,000 to $44,999 | 77 (8.4%) | 42 (5.0%) |
| $45,000 to $49,999 | 57 (6.2%) | 28 (3.3%) |
| $50,000 to $54,999 | 33 (3.6%) | 15 (1.8%) |
| $55,000 to $64,999 | 166 (18.1%) | 100 (11.9%) |
| $65,000 to $74,999 | 48 (5.2%) | 10 (1.2%) |
| $75,000 to $99,999 | 35 (3.8%) | 38 (4.5%) |
| $100,000+ | 10 (1.1%) | 14 (1.7%) |
| Total | 918 (100.0%) | 840 (100.0%) |
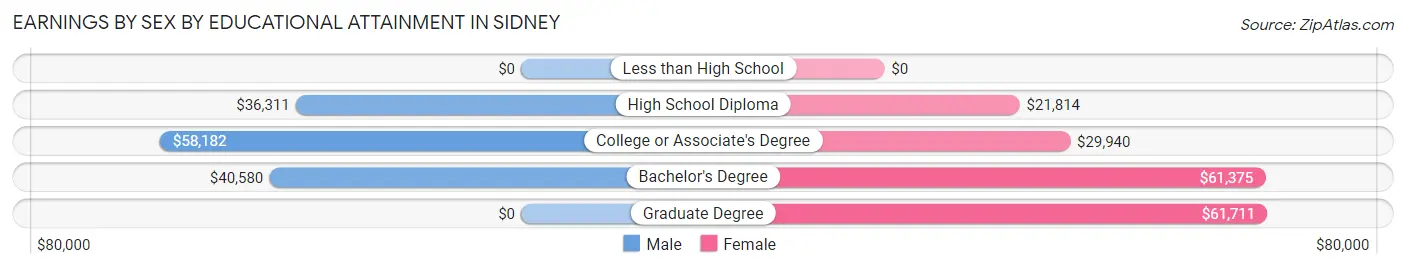
Earnings by Sex by Educational Attainment in Sidney
Average earnings in Sidney are $42,500 for men and $35,319 for women, a difference of 16.9%. Men with an educational attainment of college or associate's degree enjoy the highest average annual earnings of $58,182, while those with high school diploma education earn the least with $36,311. Women with an educational attainment of graduate degree earn the most with the average annual earnings of $61,711, while those with high school diploma education have the smallest earnings of $21,814.
| Educational Attainment | Male Income | Female Income |
| Less than High School | - | - |
| High School Diploma | $36,311 | $21,814 |
| College or Associate's Degree | $58,182 | $29,940 |
| Bachelor's Degree | $40,580 | $61,375 |
| Graduate Degree | - | - |
| Total | $42,500 | $35,319 |
Family Income in Sidney
Family Income Brackets in Sidney
According to the Sidney family income data, there are 197 families falling into the $100,000 to $149,999 income range, which is the most common income bracket and makes up 23.3% of all families. Conversely, the $200,000+ income bracket is the least frequent group with only 10 families (1.2%) belonging to this category.
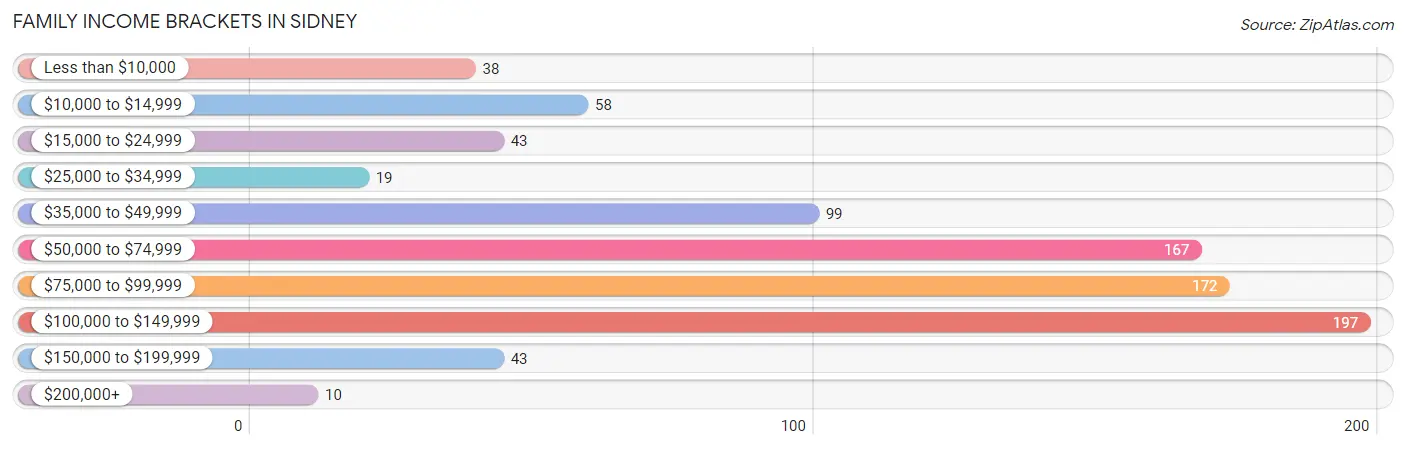
| Income Bracket | # Families | % Families |
| Less than $10,000 | 38 | 4.5% |
| $10,000 to $14,999 | 58 | 6.9% |
| $15,000 to $24,999 | 43 | 5.1% |
| $25,000 to $34,999 | 19 | 2.2% |
| $35,000 to $49,999 | 99 | 11.7% |
| $50,000 to $74,999 | 167 | 19.7% |
| $75,000 to $99,999 | 172 | 20.3% |
| $100,000 to $149,999 | 197 | 23.3% |
| $150,000 to $199,999 | 43 | 5.1% |
| $200,000+ | 10 | 1.2% |
Family Income by Famaliy Size in Sidney
4-person families (48 | 5.7%) account for the highest median family income in Sidney with $127,500 per family, while 2-person families (514 | 60.8%) have the highest median income of $37,009 per family member.
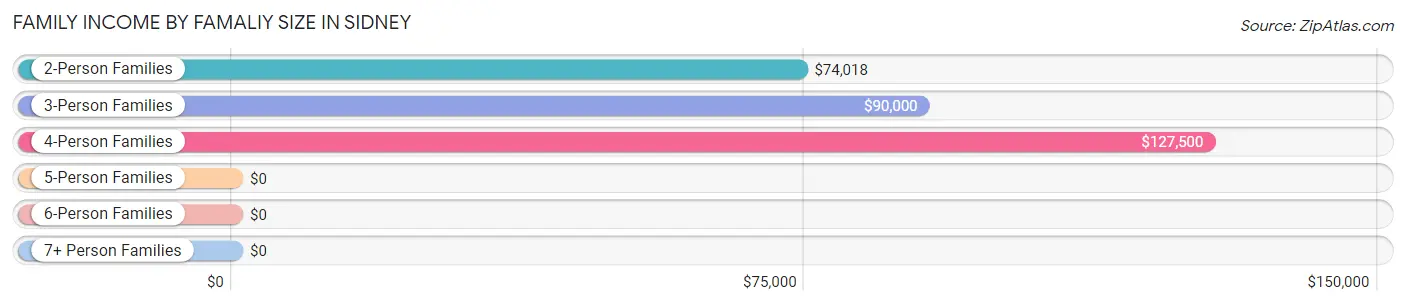
| Income Bracket | # Families | Median Income |
| 2-Person Families | 514 (60.8%) | $74,018 |
| 3-Person Families | 130 (15.4%) | $90,000 |
| 4-Person Families | 48 (5.7%) | $127,500 |
| 5-Person Families | 54 (6.4%) | $0 |
| 6-Person Families | 32 (3.8%) | $0 |
| 7+ Person Families | 68 (8.0%) | $0 |
| Total | 846 (100.0%) | $74,911 |
Family Income by Number of Earners in Sidney
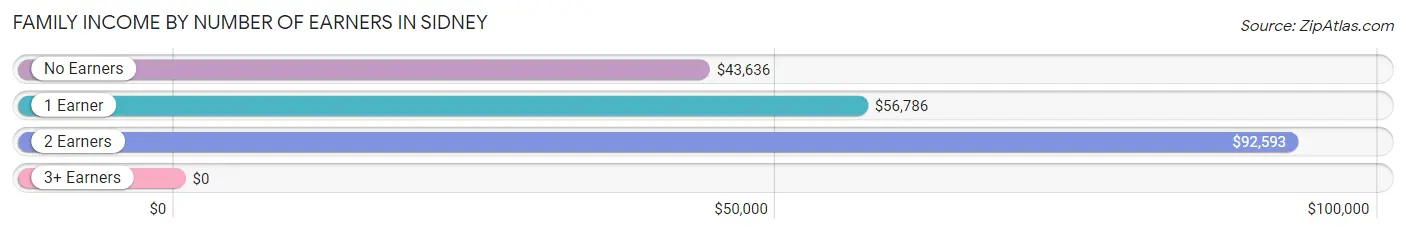
| Number of Earners | # Families | Median Income |
| No Earners | 132 (15.6%) | $43,636 |
| 1 Earner | 298 (35.2%) | $56,786 |
| 2 Earners | 390 (46.1%) | $92,593 |
| 3+ Earners | 26 (3.1%) | $0 |
| Total | 846 (100.0%) | $74,911 |
Household Income in Sidney
Household Income Brackets in Sidney
With 335 households falling in the category, the $50,000 to $74,999 income range is the most frequent in Sidney, accounting for 22.5% of all households. In contrast, only 10 households (0.7%) fall into the $200,000+ income bracket, making it the least populous group.
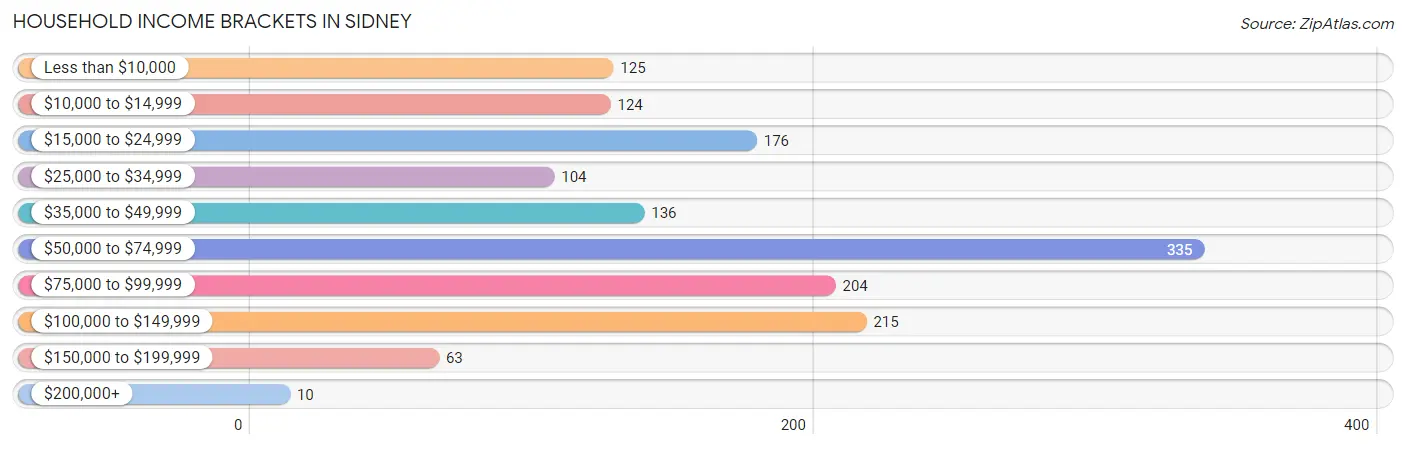
| Income Bracket | # Households | % Households |
| Less than $10,000 | 125 | 8.4% |
| $10,000 to $14,999 | 124 | 8.3% |
| $15,000 to $24,999 | 176 | 11.8% |
| $25,000 to $34,999 | 104 | 7.0% |
| $35,000 to $49,999 | 136 | 9.1% |
| $50,000 to $74,999 | 335 | 22.5% |
| $75,000 to $99,999 | 204 | 13.7% |
| $100,000 to $149,999 | 215 | 14.4% |
| $150,000 to $199,999 | 63 | 4.2% |
| $200,000+ | 10 | 0.7% |
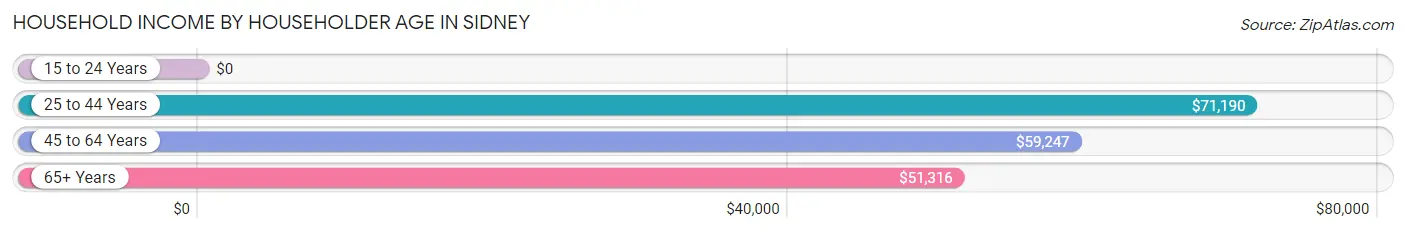
Household Income by Householder Age in Sidney
The median household income in Sidney is $56,667, with the highest median household income of $71,190 found in the 25 to 44 years age bracket for the primary householder. A total of 308 households (20.7%) fall into this category. Meanwhile, the 15 to 24 years age bracket for the primary householder has the lowest median household income of $0, with 76 households (5.1%) in this group.
| Income Bracket | # Households | Median Income |
| 15 to 24 Years | 76 (5.1%) | $0 |
| 25 to 44 Years | 308 (20.7%) | $71,190 |
| 45 to 64 Years | 638 (42.8%) | $59,247 |
| 65+ Years | 468 (31.4%) | $51,316 |
| Total | 1,490 (100.0%) | $56,667 |
Poverty in Sidney
Income Below Poverty by Sex and Age in Sidney
With 24.3% poverty level for males and 21.3% for females among the residents of Sidney, 16 and 17 year old males and 5 year old females are the most vulnerable to poverty, with 17 males (100.0%) and 12 females (100.0%) in their respective age groups living below the poverty level.
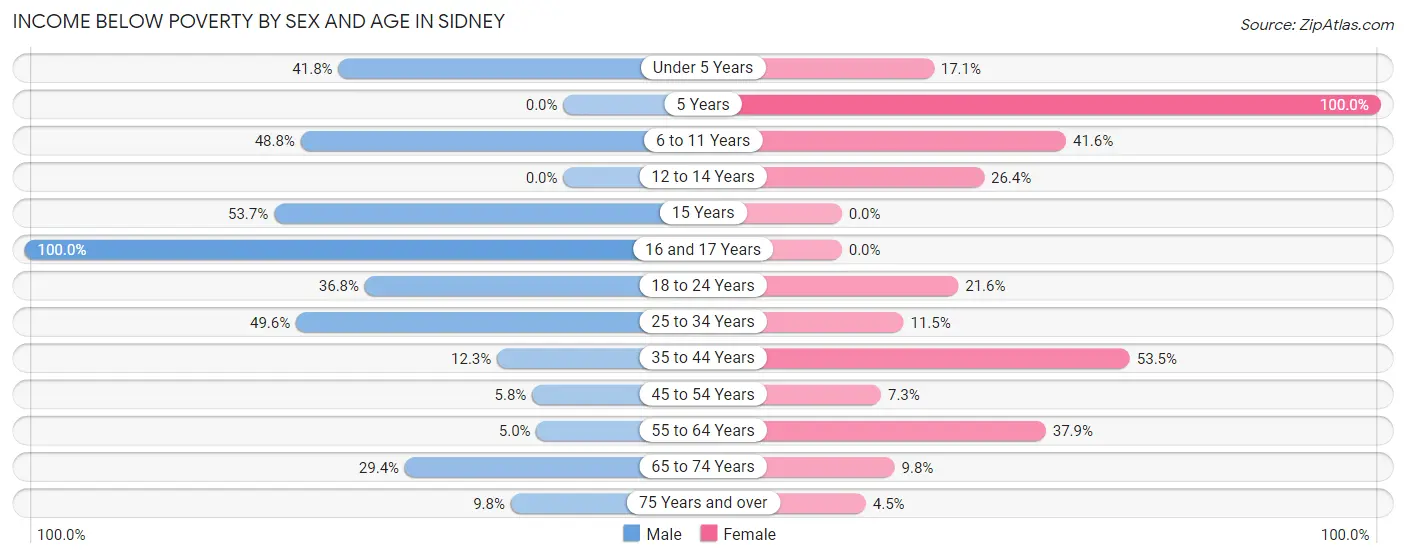
| Age Bracket | Male | Female |
| Under 5 Years | 86 (41.7%) | 7 (17.1%) |
| 5 Years | 0 (0.0%) | 12 (100.0%) |
| 6 to 11 Years | 39 (48.7%) | 87 (41.6%) |
| 12 to 14 Years | 0 (0.0%) | 33 (26.4%) |
| 15 Years | 29 (53.7%) | 0 (0.0%) |
| 16 and 17 Years | 17 (100.0%) | 0 (0.0%) |
| 18 to 24 Years | 70 (36.8%) | 32 (21.6%) |
| 25 to 34 Years | 65 (49.6%) | 32 (11.5%) |
| 35 to 44 Years | 22 (12.3%) | 54 (53.5%) |
| 45 to 54 Years | 17 (5.8%) | 15 (7.3%) |
| 55 to 64 Years | 11 (5.0%) | 114 (37.9%) |
| 65 to 74 Years | 65 (29.4%) | 15 (9.8%) |
| 75 Years and over | 16 (9.8%) | 12 (4.5%) |
| Total | 437 (24.3%) | 413 (21.3%) |
Income Above Poverty by Sex and Age in Sidney
According to the poverty statistics in Sidney, males aged 5 years and females aged 15 years are the age groups that are most secure financially, with 100.0% of males and 100.0% of females in these age groups living above the poverty line.
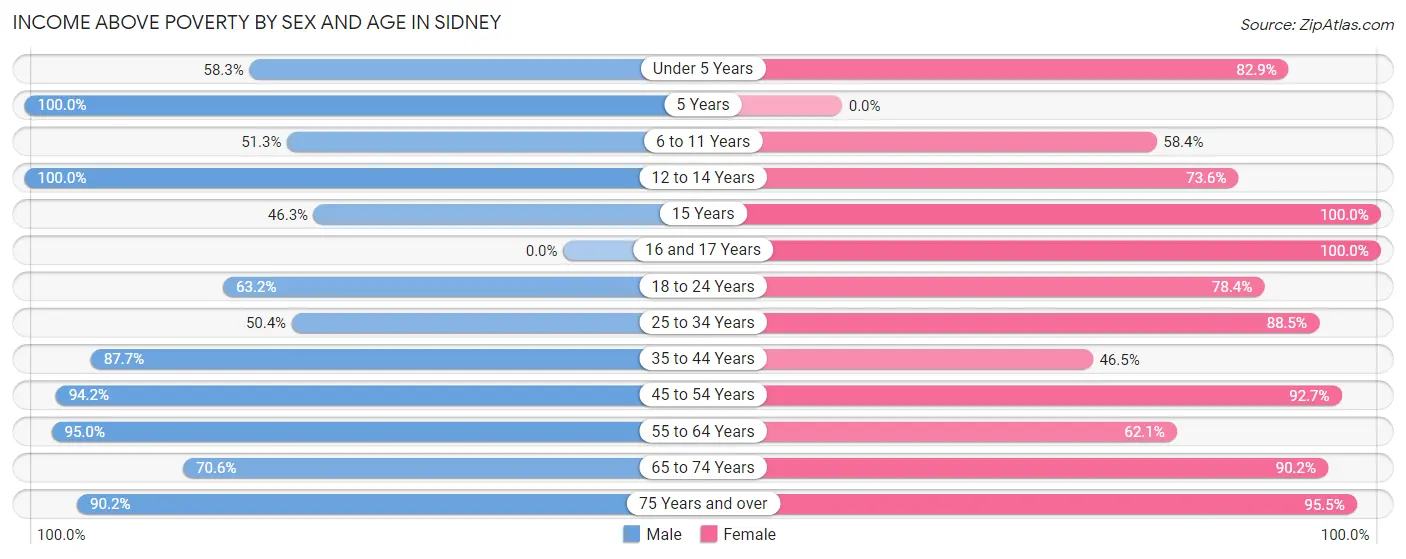
| Age Bracket | Male | Female |
| Under 5 Years | 120 (58.3%) | 34 (82.9%) |
| 5 Years | 7 (100.0%) | 0 (0.0%) |
| 6 to 11 Years | 41 (51.2%) | 122 (58.4%) |
| 12 to 14 Years | 32 (100.0%) | 92 (73.6%) |
| 15 Years | 25 (46.3%) | 56 (100.0%) |
| 16 and 17 Years | 0 (0.0%) | 41 (100.0%) |
| 18 to 24 Years | 120 (63.2%) | 116 (78.4%) |
| 25 to 34 Years | 66 (50.4%) | 247 (88.5%) |
| 35 to 44 Years | 157 (87.7%) | 47 (46.5%) |
| 45 to 54 Years | 277 (94.2%) | 191 (92.7%) |
| 55 to 64 Years | 209 (95.0%) | 187 (62.1%) |
| 65 to 74 Years | 156 (70.6%) | 138 (90.2%) |
| 75 Years and over | 148 (90.2%) | 257 (95.5%) |
| Total | 1,358 (75.6%) | 1,528 (78.7%) |
Income Below Poverty Among Married-Couple Families in Sidney
The poverty statistics for married-couple families in Sidney show that 9.1% or 60 of the total 656 families live below the poverty line. Families with 3 or 4 children have the highest poverty rate of 100.0%, comprising of 45 families. On the other hand, families with no children have the lowest poverty rate of 0.0%, which includes 0 families.
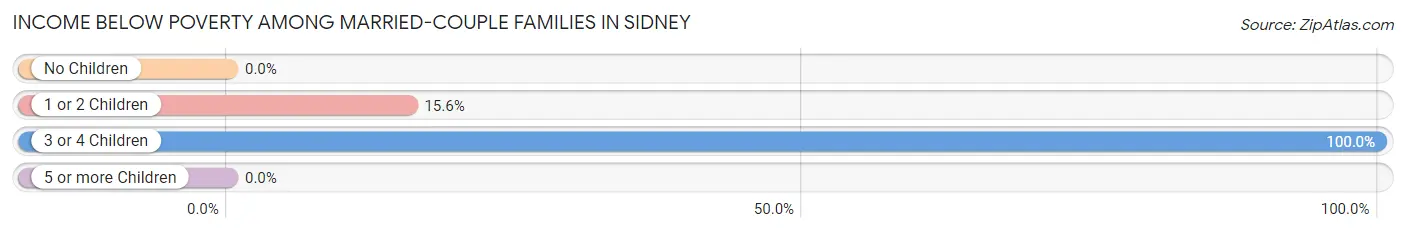
| Children | Above Poverty | Below Poverty |
| No Children | 447 (100.0%) | 0 (0.0%) |
| 1 or 2 Children | 81 (84.4%) | 15 (15.6%) |
| 3 or 4 Children | 0 (0.0%) | 45 (100.0%) |
| 5 or more Children | 68 (100.0%) | 0 (0.0%) |
| Total | 596 (90.8%) | 60 (9.1%) |
Income Below Poverty Among Single-Parent Households in Sidney
According to the poverty data in Sidney, 26.2% or 22 single-father households and 55.7% or 59 single-mother households are living below the poverty line. Among single-father households, those with 3 or 4 children have the highest poverty rate, with 22 households (100.0%) experiencing poverty. Likewise, among single-mother households, those with 1 or 2 children have the highest poverty rate, with 59 households (100.0%) falling below the poverty line.
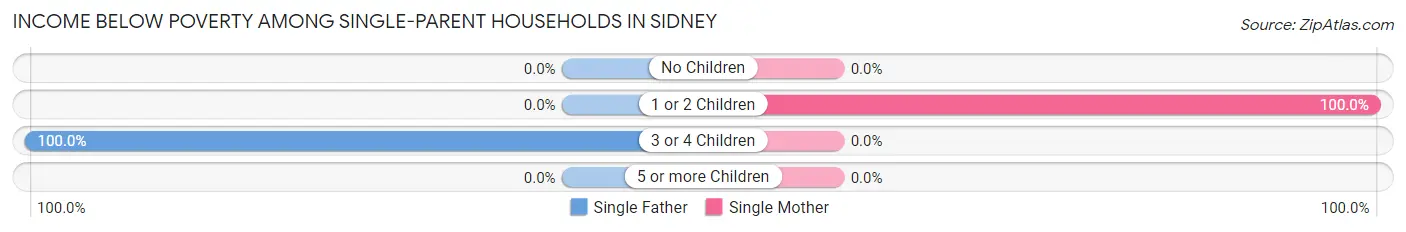
| Children | Single Father | Single Mother |
| No Children | 0 (0.0%) | 0 (0.0%) |
| 1 or 2 Children | 0 (0.0%) | 59 (100.0%) |
| 3 or 4 Children | 22 (100.0%) | 0 (0.0%) |
| 5 or more Children | 0 (0.0%) | 0 (0.0%) |
| Total | 22 (26.2%) | 59 (55.7%) |
Income Below Poverty Among Married-Couple vs Single-Parent Households in Sidney
The poverty data for Sidney shows that 60 of the married-couple family households (9.1%) and 81 of the single-parent households (42.6%) are living below the poverty level. Within the married-couple family households, those with 3 or 4 children have the highest poverty rate, with 45 households (100.0%) falling below the poverty line. Among the single-parent households, those with 3 or 4 children have the highest poverty rate, with 22 household (100.0%) living below poverty.
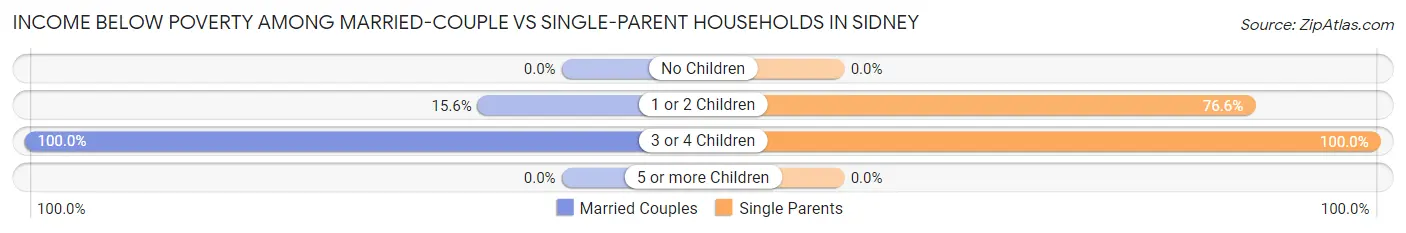
| Children | Married-Couple Families | Single-Parent Households |
| No Children | 0 (0.0%) | 0 (0.0%) |
| 1 or 2 Children | 15 (15.6%) | 59 (76.6%) |
| 3 or 4 Children | 45 (100.0%) | 22 (100.0%) |
| 5 or more Children | 0 (0.0%) | 0 (0.0%) |
| Total | 60 (9.1%) | 81 (42.6%) |
Race in Sidney
The most populous races in Sidney are White / Caucasian (3,478 | 92.7%), Two or more Races (174 | 4.6%), and Black / African American (98 | 2.6%).
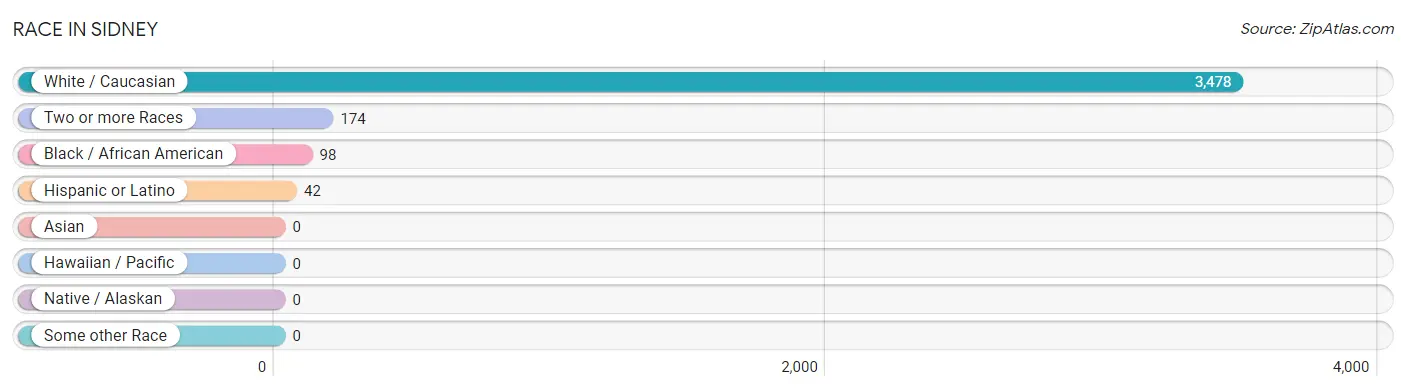
| Race | # Population | % Population |
| Asian | 0 | 0.0% |
| Black / African American | 98 | 2.6% |
| Hawaiian / Pacific | 0 | 0.0% |
| Hispanic or Latino | 42 | 1.1% |
| Native / Alaskan | 0 | 0.0% |
| White / Caucasian | 3,478 | 92.7% |
| Two or more Races | 174 | 4.6% |
| Some other Race | 0 | 0.0% |
| Total | 3,750 | 100.0% |
Ancestry in Sidney
The most populous ancestries reported in Sidney are German (938 | 25.0%), Irish (786 | 21.0%), English (733 | 19.6%), Dutch (442 | 11.8%), and Italian (408 | 10.9%), together accounting for 88.2% of all Sidney residents.
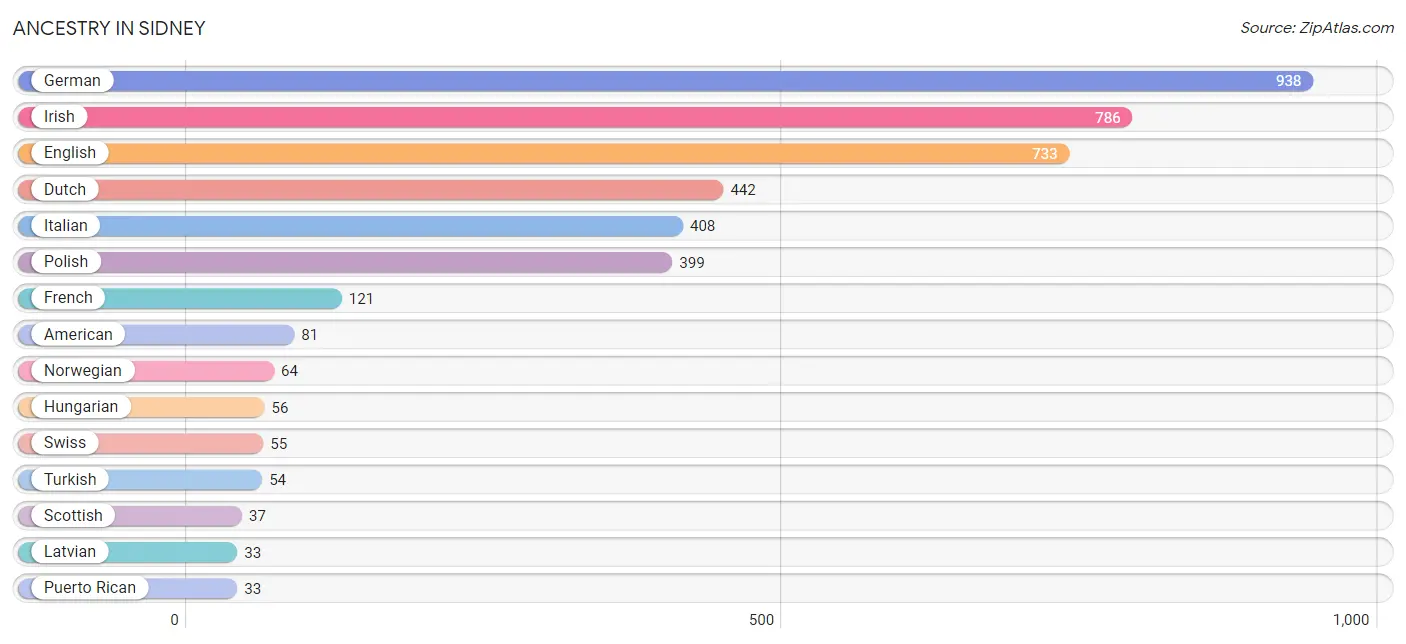
| Ancestry | # Population | % Population |
| American | 81 | 2.2% |
| Blackfeet | 7 | 0.2% |
| British | 23 | 0.6% |
| Cambodian | 30 | 0.8% |
| Cherokee | 10 | 0.3% |
| Dutch | 442 | 11.8% |
| English | 733 | 19.6% |
| French | 121 | 3.2% |
| German | 938 | 25.0% |
| Greek | 16 | 0.4% |
| Hungarian | 56 | 1.5% |
| Irish | 786 | 21.0% |
| Italian | 408 | 10.9% |
| Latvian | 33 | 0.9% |
| Lithuanian | 18 | 0.5% |
| Norwegian | 64 | 1.7% |
| Polish | 399 | 10.6% |
| Puerto Rican | 33 | 0.9% |
| Scottish | 37 | 1.0% |
| Slavic | 20 | 0.5% |
| Swedish | 18 | 0.5% |
| Swiss | 55 | 1.5% |
| Turkish | 54 | 1.4% | View All 23 Rows |
Immigrants in Sidney
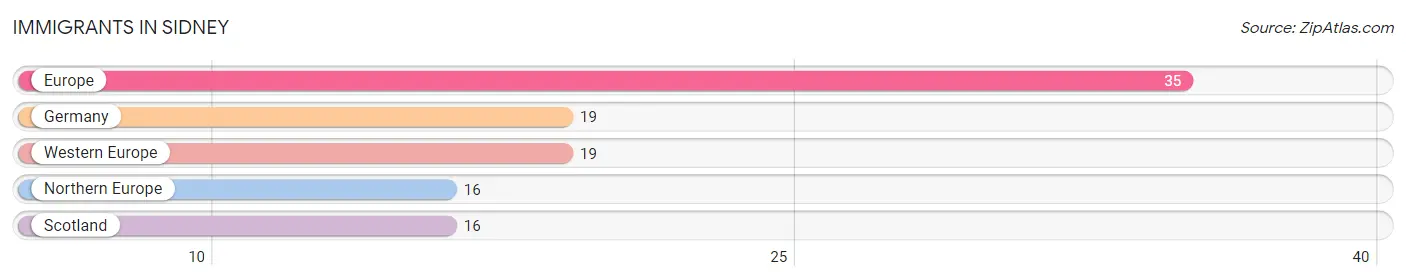
The most numerous immigrant groups reported in Sidney came from Europe (35 | 0.9%), Germany (19 | 0.5%), Western Europe (19 | 0.5%), Northern Europe (16 | 0.4%), and Scotland (16 | 0.4%), together accounting for 2.8% of all Sidney residents.
| Immigration Origin | # Population | % Population |
| Europe | 35 | 0.9% |
| Germany | 19 | 0.5% |
| Northern Europe | 16 | 0.4% |
| Scotland | 16 | 0.4% |
| Western Europe | 19 | 0.5% | View All 5 Rows |
Sex and Age in Sidney
Sex and Age in Sidney
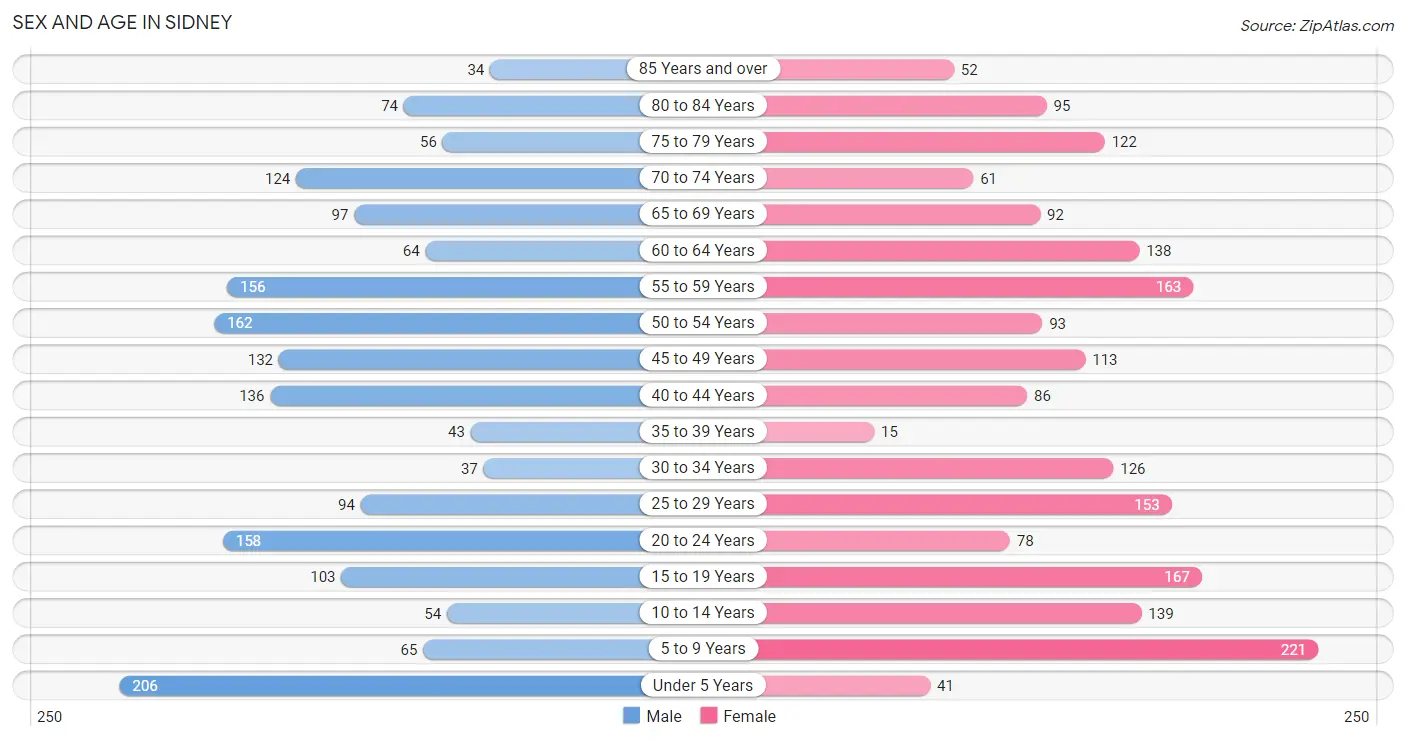
The most populous age groups in Sidney are Under 5 Years (206 | 11.5%) for men and 5 to 9 Years (221 | 11.3%) for women.
| Age Bracket | Male | Female |
| Under 5 Years | 206 (11.5%) | 41 (2.1%) |
| 5 to 9 Years | 65 (3.6%) | 221 (11.3%) |
| 10 to 14 Years | 54 (3.0%) | 139 (7.1%) |
| 15 to 19 Years | 103 (5.7%) | 167 (8.5%) |
| 20 to 24 Years | 158 (8.8%) | 78 (4.0%) |
| 25 to 29 Years | 94 (5.2%) | 153 (7.8%) |
| 30 to 34 Years | 37 (2.1%) | 126 (6.5%) |
| 35 to 39 Years | 43 (2.4%) | 15 (0.8%) |
| 40 to 44 Years | 136 (7.6%) | 86 (4.4%) |
| 45 to 49 Years | 132 (7.3%) | 113 (5.8%) |
| 50 to 54 Years | 162 (9.0%) | 93 (4.8%) |
| 55 to 59 Years | 156 (8.7%) | 163 (8.3%) |
| 60 to 64 Years | 64 (3.6%) | 138 (7.1%) |
| 65 to 69 Years | 97 (5.4%) | 92 (4.7%) |
| 70 to 74 Years | 124 (6.9%) | 61 (3.1%) |
| 75 to 79 Years | 56 (3.1%) | 122 (6.2%) |
| 80 to 84 Years | 74 (4.1%) | 95 (4.9%) |
| 85 Years and over | 34 (1.9%) | 52 (2.7%) |
| Total | 1,795 (100.0%) | 1,955 (100.0%) |
Families and Households in Sidney
Median Family Size in Sidney
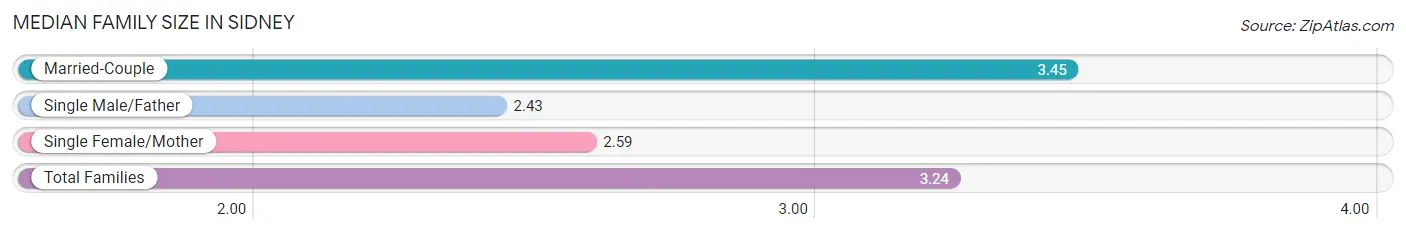
The median family size in Sidney is 3.24 persons per family, with married-couple families (656 | 77.5%) accounting for the largest median family size of 3.45 persons per family. On the other hand, single male/father families (84 | 9.9%) represent the smallest median family size with 2.43 persons per family.
| Family Type | # Families | Family Size |
| Married-Couple | 656 (77.5%) | 3.45 |
| Single Male/Father | 84 (9.9%) | 2.43 |
| Single Female/Mother | 106 (12.5%) | 2.59 |
| Total Families | 846 (100.0%) | 3.24 |
Median Household Size in Sidney
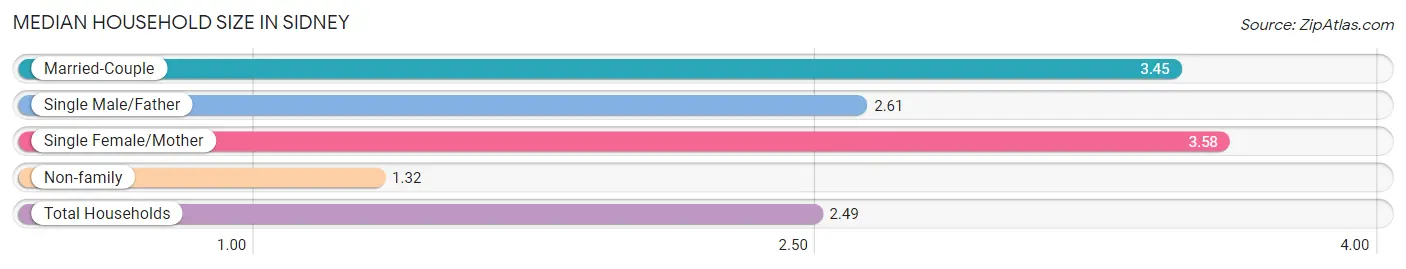
The median household size in Sidney is 2.49 persons per household, with single female/mother households (106 | 7.1%) accounting for the largest median household size of 3.58 persons per household. non-family households (644 | 43.2%) represent the smallest median household size with 1.32 persons per household.
| Household Type | # Households | Household Size |
| Married-Couple | 656 (44.0%) | 3.45 |
| Single Male/Father | 84 (5.6%) | 2.61 |
| Single Female/Mother | 106 (7.1%) | 3.58 |
| Non-family | 644 (43.2%) | 1.32 |
| Total Households | 1,490 (100.0%) | 2.49 |
Household Size by Marriage Status in Sidney
Out of a total of 1,490 households in Sidney, 846 (56.8%) are family households, while 644 (43.2%) are nonfamily households. The most numerous type of family households are 2-person households, comprising 441, and the most common type of nonfamily households are 1-person households, comprising 531.
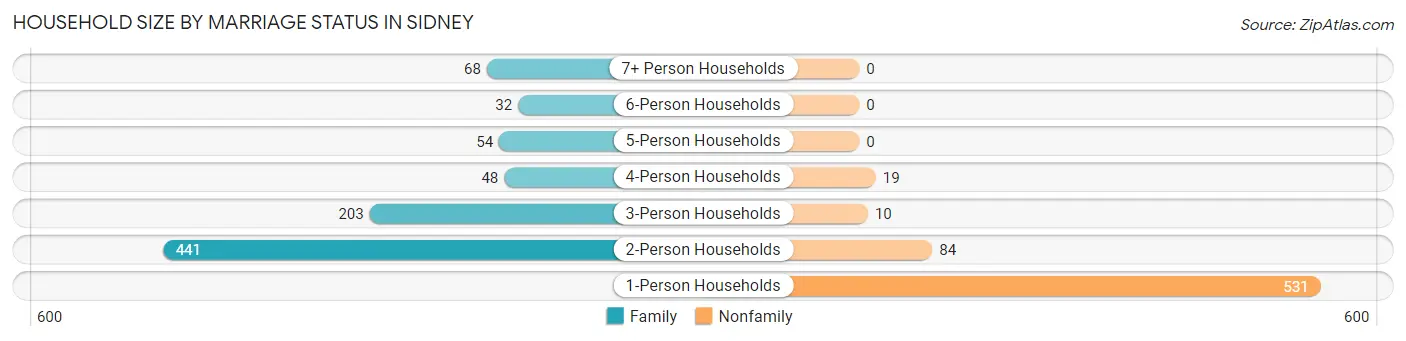
| Household Size | Family Households | Nonfamily Households |
| 1-Person Households | - | 531 (35.6%) |
| 2-Person Households | 441 (29.6%) | 84 (5.6%) |
| 3-Person Households | 203 (13.6%) | 10 (0.7%) |
| 4-Person Households | 48 (3.2%) | 19 (1.3%) |
| 5-Person Households | 54 (3.6%) | 0 (0.0%) |
| 6-Person Households | 32 (2.1%) | 0 (0.0%) |
| 7+ Person Households | 68 (4.6%) | 0 (0.0%) |
| Total | 846 (56.8%) | 644 (43.2%) |
Female Fertility in Sidney
Fertility by Age in Sidney
Average fertility rate in Sidney is 217.0 births per 1,000 women. Women in the age bracket of 20 to 34 years have the highest fertility rate with 322.0 births per 1,000 women. Women in the age bracket of 20 to 34 years acount for 71.0% of all women with births.
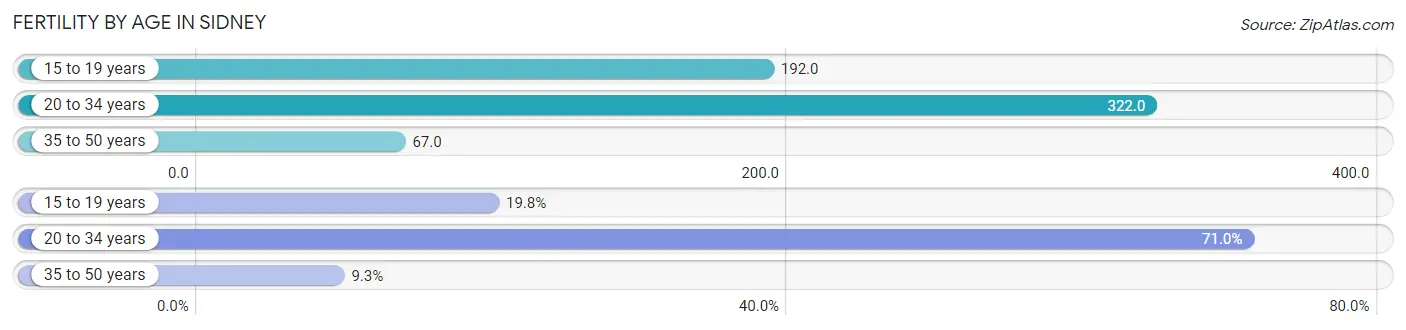
| Age Bracket | Women with Births | Births / 1,000 Women |
| 15 to 19 years | 32 (19.8%) | 192.0 |
| 20 to 34 years | 115 (71.0%) | 322.0 |
| 35 to 50 years | 15 (9.3%) | 67.0 |
| Total | 162 (100.0%) | 217.0 |
Fertility by Age by Marriage Status in Sidney
71.0% of women with births (162) in Sidney are married. The highest percentage of unmarried women with births falls into 15 to 19 years age bracket with 100.0% of them unmarried at the time of birth, while the lowest percentage of unmarried women with births belong to 20 to 34 years age bracket with 0.0% of them unmarried.
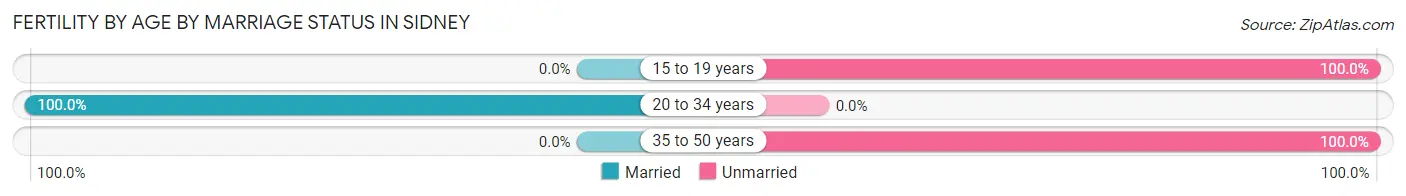
| Age Bracket | Married | Unmarried |
| 15 to 19 years | 0 (0.0%) | 32 (100.0%) |
| 20 to 34 years | 115 (100.0%) | 0 (0.0%) |
| 35 to 50 years | 0 (0.0%) | 15 (100.0%) |
| Total | 115 (71.0%) | 47 (29.0%) |
Fertility by Education in Sidney
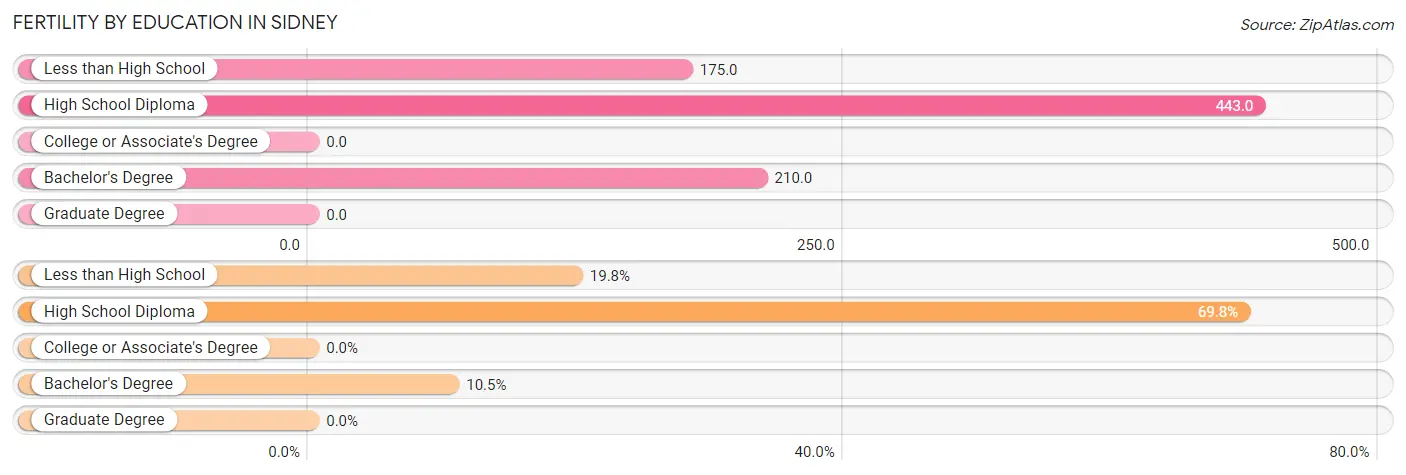
| Educational Attainment | Women with Births | Births / 1,000 Women |
| Less than High School | 32 (19.8%) | 175.0 |
| High School Diploma | 113 (69.8%) | 443.0 |
| College or Associate's Degree | 0 (0.0%) | 0.0 |
| Bachelor's Degree | 17 (10.5%) | 210.0 |
| Graduate Degree | 0 (0.0%) | 0.0 |
| Total | 162 (100.0%) | 217.0 |
Fertility by Education by Marriage Status in Sidney
29.0% of women with births in Sidney are unmarried. Women with the educational attainment of bachelor's degree are most likely to be married with 100.0% of them married at childbirth, while women with the educational attainment of less than high school are least likely to be married with 100.0% of them unmarried at childbirth.
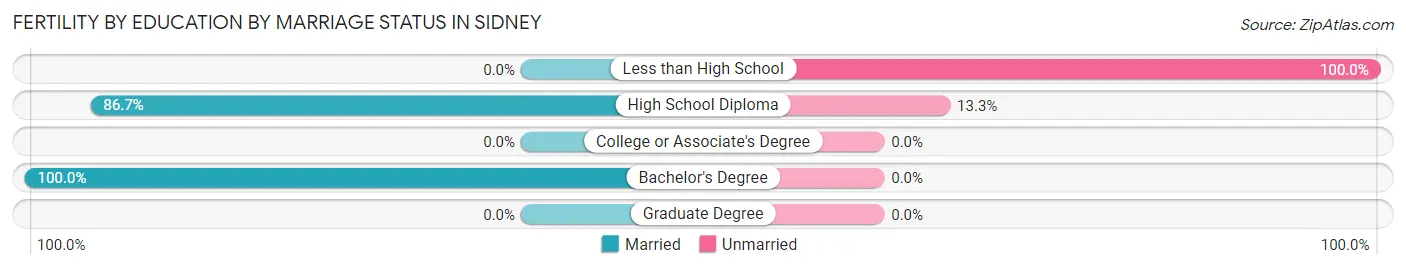
| Educational Attainment | Married | Unmarried |
| Less than High School | 0 (0.0%) | 32 (100.0%) |
| High School Diploma | 98 (86.7%) | 15 (13.3%) |
| College or Associate's Degree | 0 (0.0%) | 0 (0.0%) |
| Bachelor's Degree | 17 (100.0%) | 0 (0.0%) |
| Graduate Degree | 0 (0.0%) | 0 (0.0%) |
| Total | 115 (71.0%) | 47 (29.0%) |
Employment Characteristics in Sidney
Employment by Class of Employer in Sidney
Among the 1,391 employed individuals in Sidney, private company employees (747 | 53.7%), not-for-profit organizations (286 | 20.6%), and self-employed (not incorporated) (234 | 16.8%) make up the most common classes of employment.
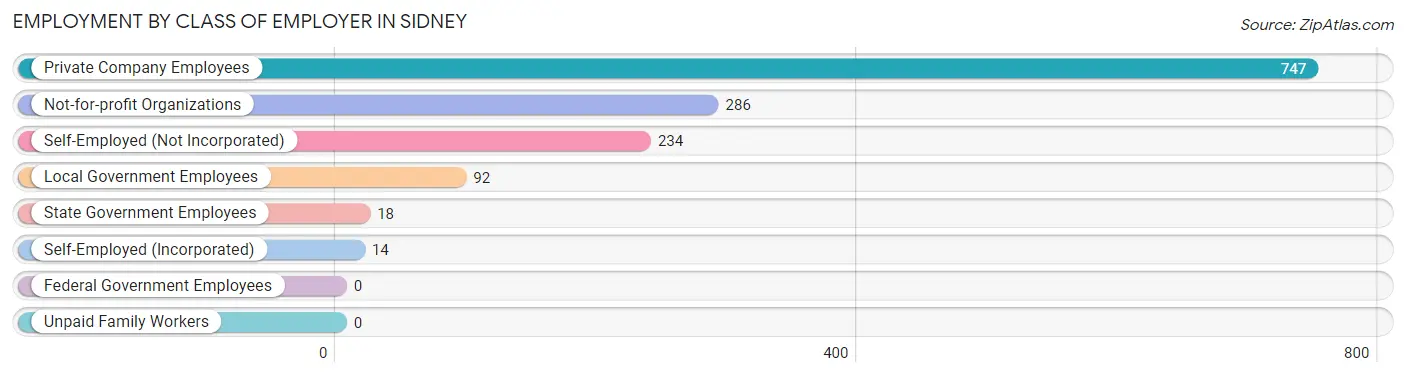
| Employer Class | # Employees | % Employees |
| Private Company Employees | 747 | 53.7% |
| Self-Employed (Incorporated) | 14 | 1.0% |
| Self-Employed (Not Incorporated) | 234 | 16.8% |
| Not-for-profit Organizations | 286 | 20.6% |
| Local Government Employees | 92 | 6.6% |
| State Government Employees | 18 | 1.3% |
| Federal Government Employees | 0 | 0.0% |
| Unpaid Family Workers | 0 | 0.0% |
| Total | 1,391 | 100.0% |
Employment Status by Age in Sidney
According to the labor force statistics for Sidney, out of the total population over 16 years of age (2,914), 57.5% or 1,676 individuals are in the labor force, with 11.2% or 188 of them unemployed. The age group with the highest labor force participation rate is 25 to 29 years, with 88.7% or 219 individuals in the labor force. Within the labor force, the 30 to 34 years age range has the highest percentage of unemployed individuals, with 71.1% or 69 of them being unemployed.
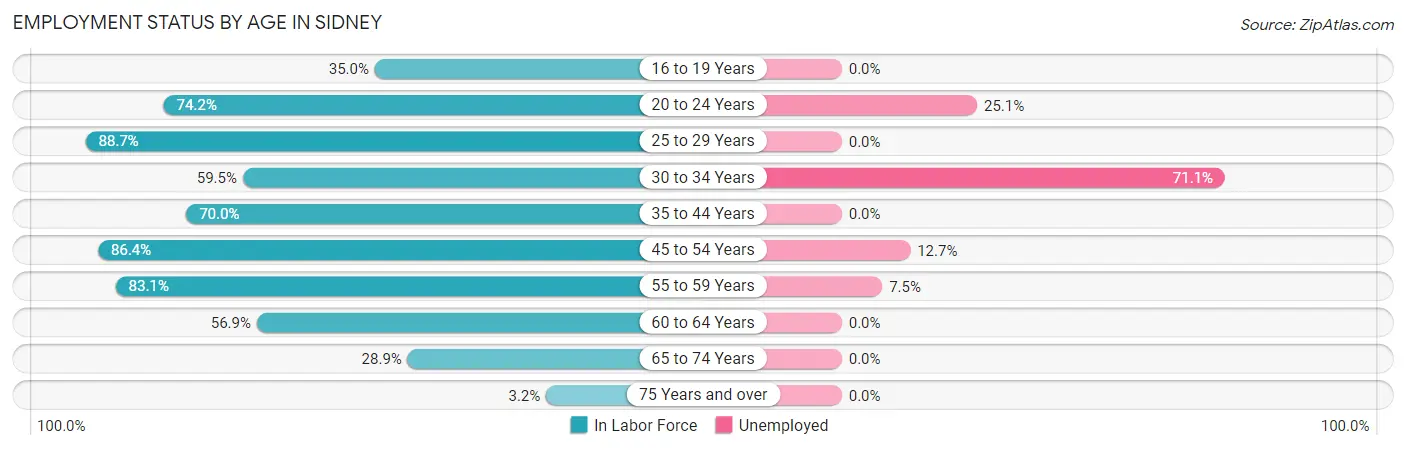
| Age Bracket | In Labor Force | Unemployed |
| 16 to 19 Years | 56 (35.0%) | 0 (0.0%) |
| 20 to 24 Years | 175 (74.2%) | 44 (25.1%) |
| 25 to 29 Years | 219 (88.7%) | 0 (0.0%) |
| 30 to 34 Years | 97 (59.5%) | 69 (71.1%) |
| 35 to 44 Years | 196 (70.0%) | 0 (0.0%) |
| 45 to 54 Years | 432 (86.4%) | 55 (12.7%) |
| 55 to 59 Years | 265 (83.1%) | 20 (7.5%) |
| 60 to 64 Years | 115 (56.9%) | 0 (0.0%) |
| 65 to 74 Years | 108 (28.9%) | 0 (0.0%) |
| 75 Years and over | 14 (3.2%) | 0 (0.0%) |
| Total | 1,676 (57.5%) | 188 (11.2%) |
Employment Status by Educational Attainment in Sidney
According to labor force statistics for Sidney, 77.4% of individuals (1,324) out of the total population between 25 and 64 years of age (1,711) are in the labor force, with 10.9% or 144 of them being unemployed. The group with the highest labor force participation rate are those with the educational attainment of bachelor's degree or higher, with 87.8% or 332 individuals in the labor force. Within the labor force, individuals with college / associate degree education have the highest percentage of unemployment, with 29.0% or 83 of them being unemployed.
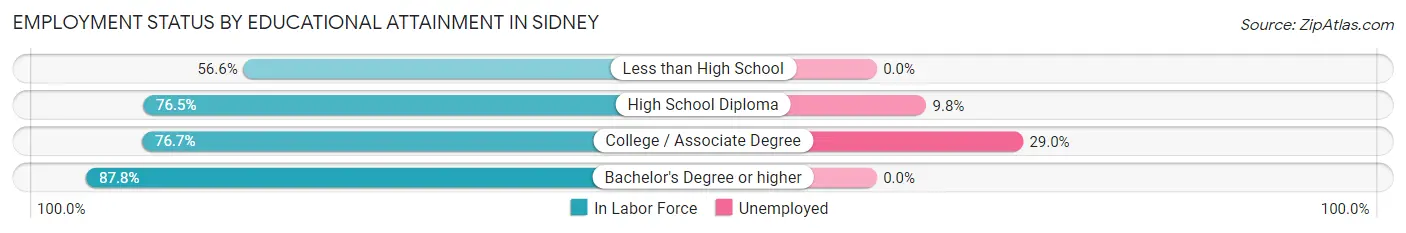
| Educational Attainment | In Labor Force | Unemployed |
| Less than High School | 81 (56.6%) | 0 (0.0%) |
| High School Diploma | 625 (76.5%) | 80 (9.8%) |
| College / Associate Degree | 286 (76.7%) | 108 (29.0%) |
| Bachelor's Degree or higher | 332 (87.8%) | 0 (0.0%) |
| Total | 1,324 (77.4%) | 186 (10.9%) |
Employment Occupations by Sex in Sidney
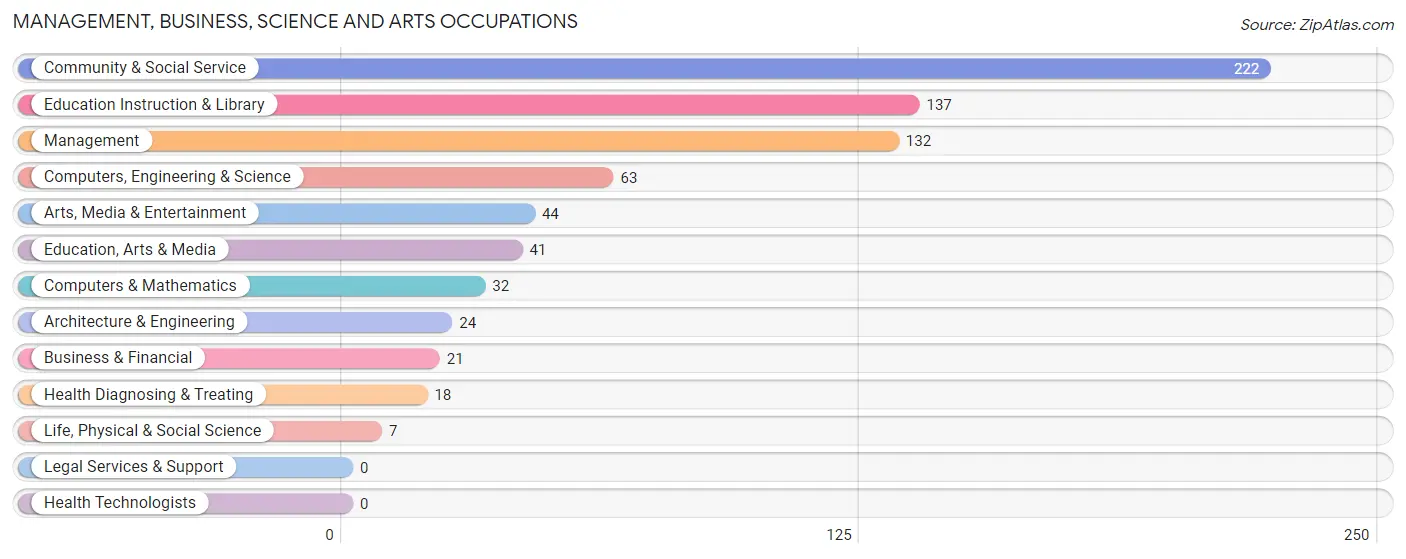
Management, Business, Science and Arts Occupations
The most common Management, Business, Science and Arts occupations in Sidney are Community & Social Service (222 | 14.9%), Education Instruction & Library (137 | 9.2%), Management (132 | 8.9%), Computers, Engineering & Science (63 | 4.2%), and Arts, Media & Entertainment (44 | 3.0%).
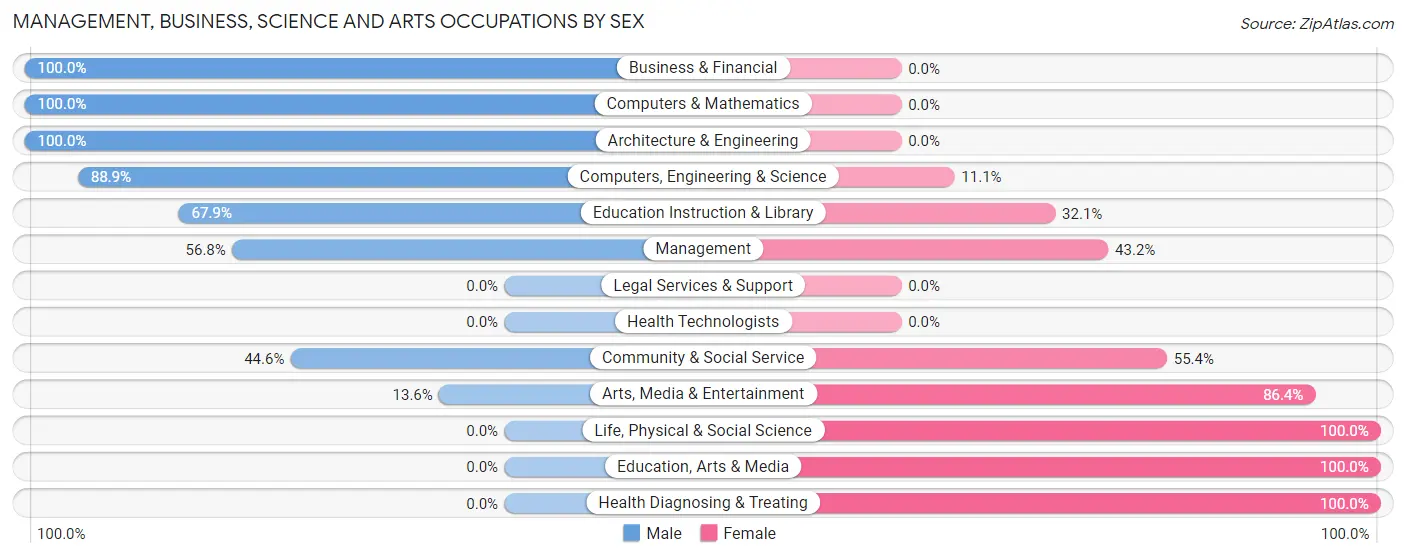
Management, Business, Science and Arts Occupations by Sex
Within the Management, Business, Science and Arts occupations in Sidney, the most male-oriented occupations are Business & Financial (100.0%), Computers & Mathematics (100.0%), and Architecture & Engineering (100.0%), while the most female-oriented occupations are Life, Physical & Social Science (100.0%), Education, Arts & Media (100.0%), and Health Diagnosing & Treating (100.0%).
| Occupation | Male | Female |
| Management | 75 (56.8%) | 57 (43.2%) |
| Business & Financial | 21 (100.0%) | 0 (0.0%) |
| Computers, Engineering & Science | 56 (88.9%) | 7 (11.1%) |
| Computers & Mathematics | 32 (100.0%) | 0 (0.0%) |
| Architecture & Engineering | 24 (100.0%) | 0 (0.0%) |
| Life, Physical & Social Science | 0 (0.0%) | 7 (100.0%) |
| Community & Social Service | 99 (44.6%) | 123 (55.4%) |
| Education, Arts & Media | 0 (0.0%) | 41 (100.0%) |
| Legal Services & Support | 0 (0.0%) | 0 (0.0%) |
| Education Instruction & Library | 93 (67.9%) | 44 (32.1%) |
| Arts, Media & Entertainment | 6 (13.6%) | 38 (86.4%) |
| Health Diagnosing & Treating | 0 (0.0%) | 18 (100.0%) |
| Health Technologists | 0 (0.0%) | 0 (0.0%) |
| Total (Category) | 251 (55.0%) | 205 (45.0%) |
| Total (Overall) | 717 (48.1%) | 772 (51.8%) |
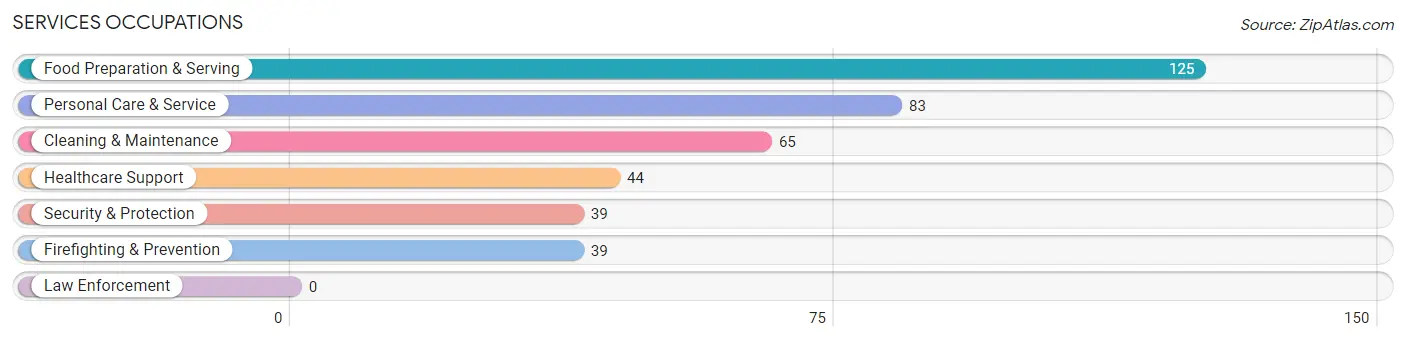
Services Occupations
The most common Services occupations in Sidney are Food Preparation & Serving (125 | 8.4%), Personal Care & Service (83 | 5.6%), Cleaning & Maintenance (65 | 4.4%), Healthcare Support (44 | 3.0%), and Security & Protection (39 | 2.6%).
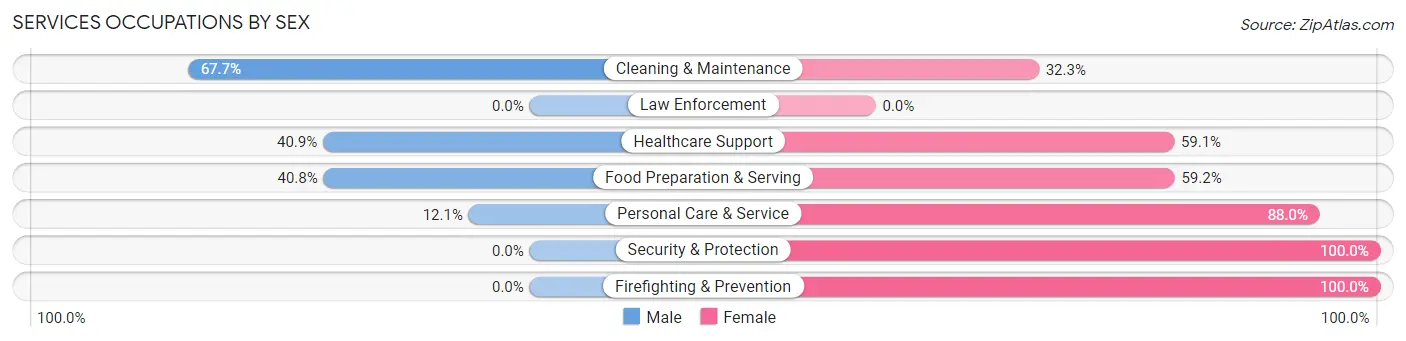
Services Occupations by Sex
Within the Services occupations in Sidney, the most male-oriented occupations are Cleaning & Maintenance (67.7%), Healthcare Support (40.9%), and Food Preparation & Serving (40.8%), while the most female-oriented occupations are Security & Protection (100.0%), Firefighting & Prevention (100.0%), and Personal Care & Service (87.9%).
| Occupation | Male | Female |
| Healthcare Support | 18 (40.9%) | 26 (59.1%) |
| Security & Protection | 0 (0.0%) | 39 (100.0%) |
| Firefighting & Prevention | 0 (0.0%) | 39 (100.0%) |
| Law Enforcement | 0 (0.0%) | 0 (0.0%) |
| Food Preparation & Serving | 51 (40.8%) | 74 (59.2%) |
| Cleaning & Maintenance | 44 (67.7%) | 21 (32.3%) |
| Personal Care & Service | 10 (12.0%) | 73 (87.9%) |
| Total (Category) | 123 (34.5%) | 233 (65.4%) |
| Total (Overall) | 717 (48.1%) | 772 (51.8%) |
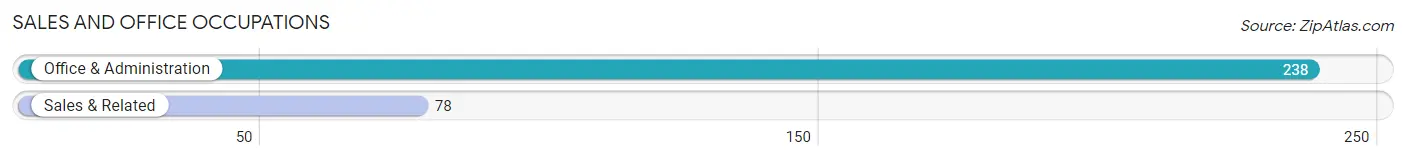
Sales and Office Occupations
The most common Sales and Office occupations in Sidney are Office & Administration (238 | 16.0%), and Sales & Related (78 | 5.2%).
Sales and Office Occupations by Sex
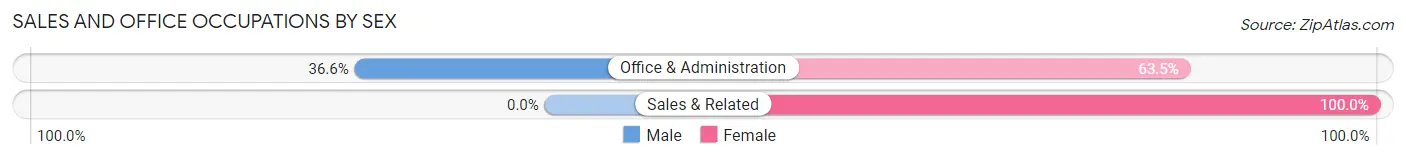
| Occupation | Male | Female |
| Sales & Related | 0 (0.0%) | 78 (100.0%) |
| Office & Administration | 87 (36.5%) | 151 (63.4%) |
| Total (Category) | 87 (27.5%) | 229 (72.5%) |
| Total (Overall) | 717 (48.1%) | 772 (51.8%) |
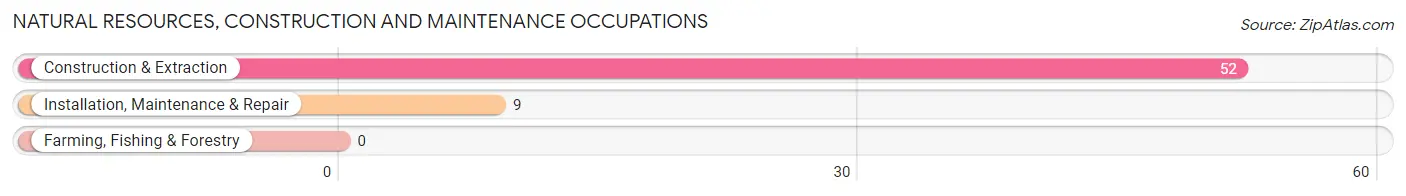
Natural Resources, Construction and Maintenance Occupations
The most common Natural Resources, Construction and Maintenance occupations in Sidney are Construction & Extraction (52 | 3.5%), and Installation, Maintenance & Repair (9 | 0.6%).
Natural Resources, Construction and Maintenance Occupations by Sex
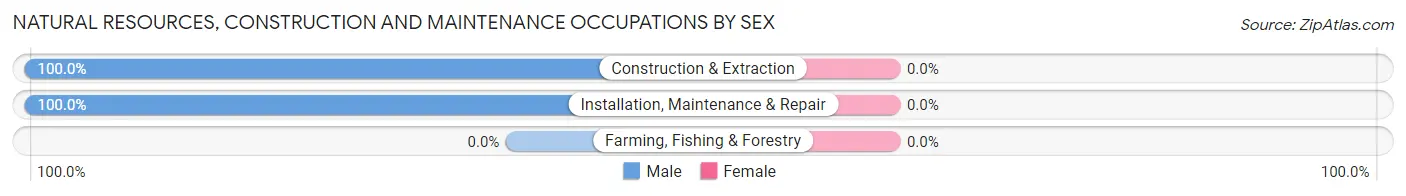
| Occupation | Male | Female |
| Farming, Fishing & Forestry | 0 (0.0%) | 0 (0.0%) |
| Construction & Extraction | 52 (100.0%) | 0 (0.0%) |
| Installation, Maintenance & Repair | 9 (100.0%) | 0 (0.0%) |
| Total (Category) | 61 (100.0%) | 0 (0.0%) |
| Total (Overall) | 717 (48.1%) | 772 (51.8%) |
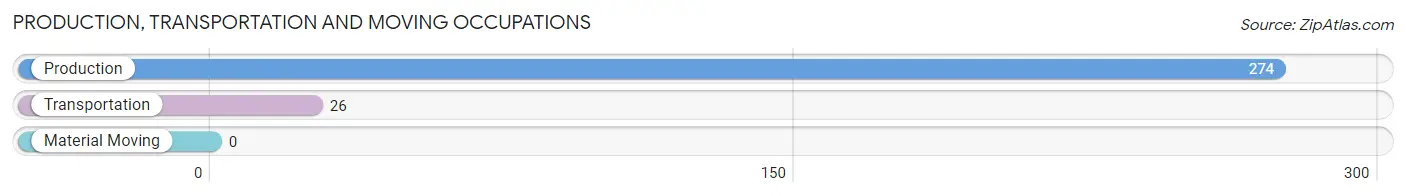
Production, Transportation and Moving Occupations
The most common Production, Transportation and Moving occupations in Sidney are Production (274 | 18.4%), and Transportation (26 | 1.8%).
Production, Transportation and Moving Occupations by Sex
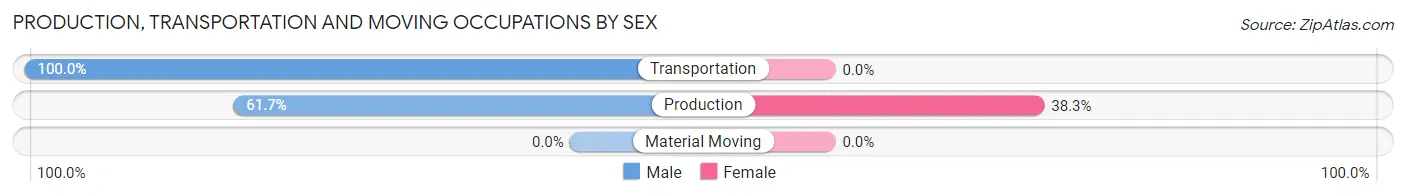
| Occupation | Male | Female |
| Production | 169 (61.7%) | 105 (38.3%) |
| Transportation | 26 (100.0%) | 0 (0.0%) |
| Material Moving | 0 (0.0%) | 0 (0.0%) |
| Total (Category) | 195 (65.0%) | 105 (35.0%) |
| Total (Overall) | 717 (48.1%) | 772 (51.8%) |
Employment Industries by Sex in Sidney
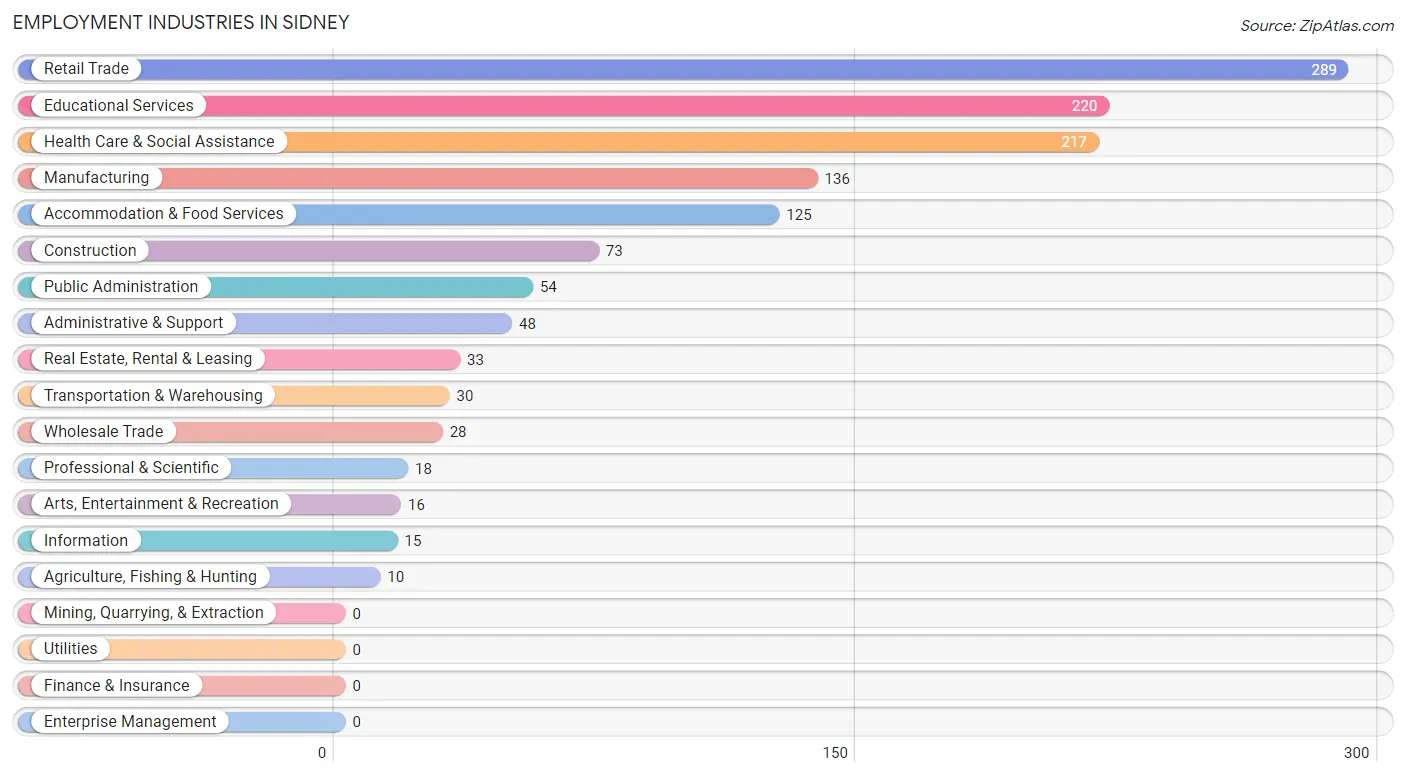
Employment Industries in Sidney
The major employment industries in Sidney include Retail Trade (289 | 19.4%), Educational Services (220 | 14.8%), Health Care & Social Assistance (217 | 14.6%), Manufacturing (136 | 9.1%), and Accommodation & Food Services (125 | 8.4%).
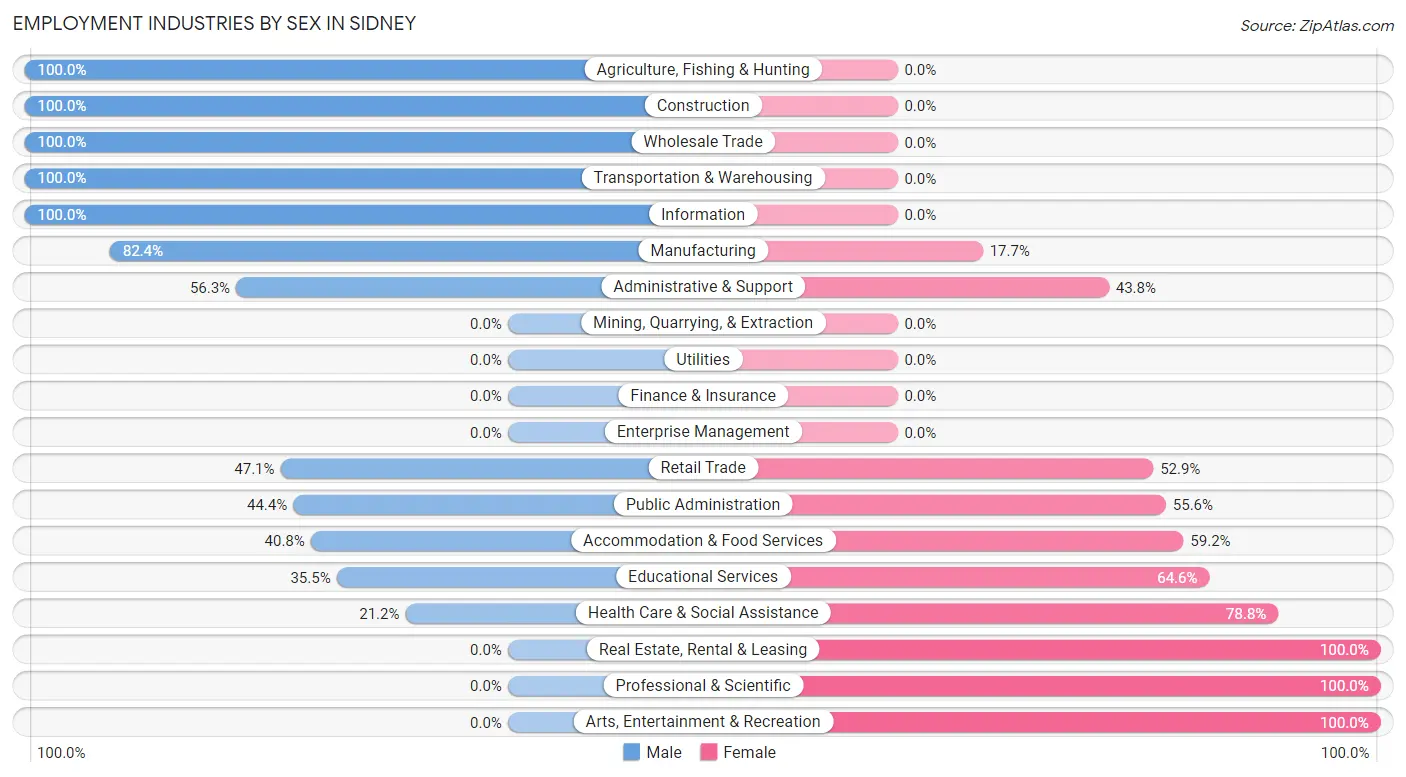
Employment Industries by Sex in Sidney
The Sidney industries that see more men than women are Agriculture, Fishing & Hunting (100.0%), Construction (100.0%), and Wholesale Trade (100.0%), whereas the industries that tend to have a higher number of women are Real Estate, Rental & Leasing (100.0%), Professional & Scientific (100.0%), and Arts, Entertainment & Recreation (100.0%).
| Industry | Male | Female |
| Agriculture, Fishing & Hunting | 10 (100.0%) | 0 (0.0%) |
| Mining, Quarrying, & Extraction | 0 (0.0%) | 0 (0.0%) |
| Construction | 73 (100.0%) | 0 (0.0%) |
| Manufacturing | 112 (82.4%) | 24 (17.6%) |
| Wholesale Trade | 28 (100.0%) | 0 (0.0%) |
| Retail Trade | 136 (47.1%) | 153 (52.9%) |
| Transportation & Warehousing | 30 (100.0%) | 0 (0.0%) |
| Utilities | 0 (0.0%) | 0 (0.0%) |
| Information | 15 (100.0%) | 0 (0.0%) |
| Finance & Insurance | 0 (0.0%) | 0 (0.0%) |
| Real Estate, Rental & Leasing | 0 (0.0%) | 33 (100.0%) |
| Professional & Scientific | 0 (0.0%) | 18 (100.0%) |
| Enterprise Management | 0 (0.0%) | 0 (0.0%) |
| Administrative & Support | 27 (56.2%) | 21 (43.8%) |
| Educational Services | 78 (35.4%) | 142 (64.5%) |
| Health Care & Social Assistance | 46 (21.2%) | 171 (78.8%) |
| Arts, Entertainment & Recreation | 0 (0.0%) | 16 (100.0%) |
| Accommodation & Food Services | 51 (40.8%) | 74 (59.2%) |
| Public Administration | 24 (44.4%) | 30 (55.6%) |
| Total | 717 (48.1%) | 772 (51.8%) |
Education in Sidney
School Enrollment in Sidney
The most common levels of schooling among the 888 students in Sidney are elementary school (238 | 26.8%), high school (216 | 24.3%), and middle school (177 | 19.9%).
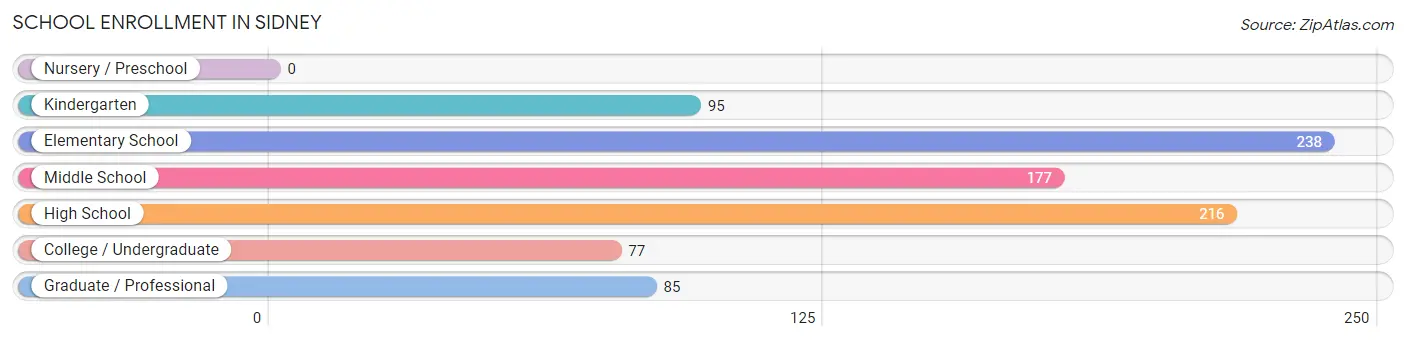
| School Level | # Students | % Students |
| Nursery / Preschool | 0 | 0.0% |
| Kindergarten | 95 | 10.7% |
| Elementary School | 238 | 26.8% |
| Middle School | 177 | 19.9% |
| High School | 216 | 24.3% |
| College / Undergraduate | 77 | 8.7% |
| Graduate / Professional | 85 | 9.6% |
| Total | 888 | 100.0% |
School Enrollment by Age by Funding Source in Sidney
Out of a total of 888 students who are enrolled in schools in Sidney, 231 (26.0%) attend a private institution, while the remaining 657 (74.0%) are enrolled in public schools. The age group of 3 to 4 year olds has the highest likelihood of being enrolled in private schools, with 31 (100.0% in the age bracket) enrolled. Conversely, the age group of 15 to 17 year olds has the lowest likelihood of being enrolled in a private school, with 168 (100.0% in the age bracket) attending a public institution.
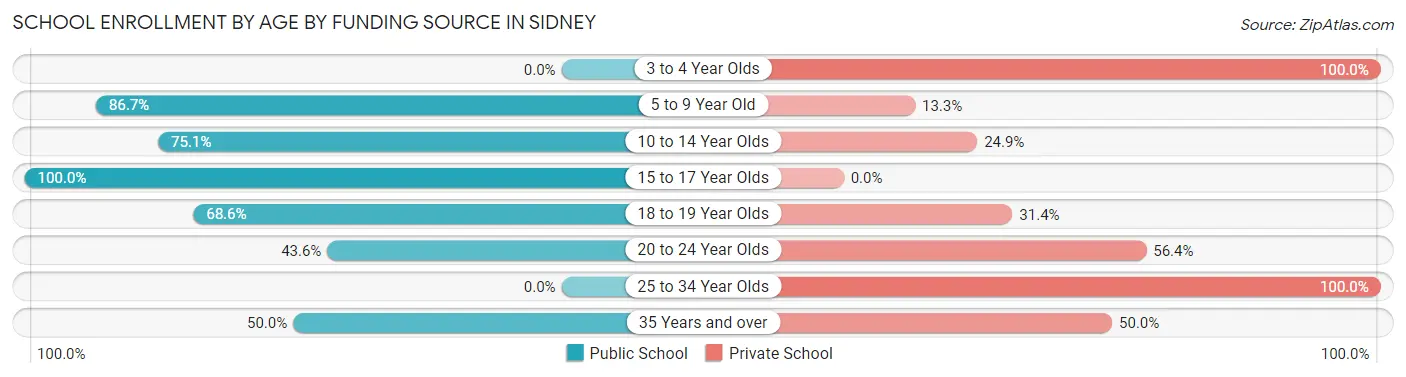
| Age Bracket | Public School | Private School |
| 3 to 4 Year Olds | 0 (0.0%) | 31 (100.0%) |
| 5 to 9 Year Old | 248 (86.7%) | 38 (13.3%) |
| 10 to 14 Year Olds | 145 (75.1%) | 48 (24.9%) |
| 15 to 17 Year Olds | 168 (100.0%) | 0 (0.0%) |
| 18 to 19 Year Olds | 48 (68.6%) | 22 (31.4%) |
| 20 to 24 Year Olds | 24 (43.6%) | 31 (56.4%) |
| 25 to 34 Year Olds | 0 (0.0%) | 37 (100.0%) |
| 35 Years and over | 24 (50.0%) | 24 (50.0%) |
| Total | 657 (74.0%) | 231 (26.0%) |
Educational Attainment by Field of Study in Sidney
Arts & humanities (133 | 27.0%), education (76 | 15.4%), liberal arts & history (56 | 11.4%), visual & performing arts (53 | 10.8%), and engineering (41 | 8.3%) are the most common fields of study among 492 individuals in Sidney who have obtained a bachelor's degree or higher.
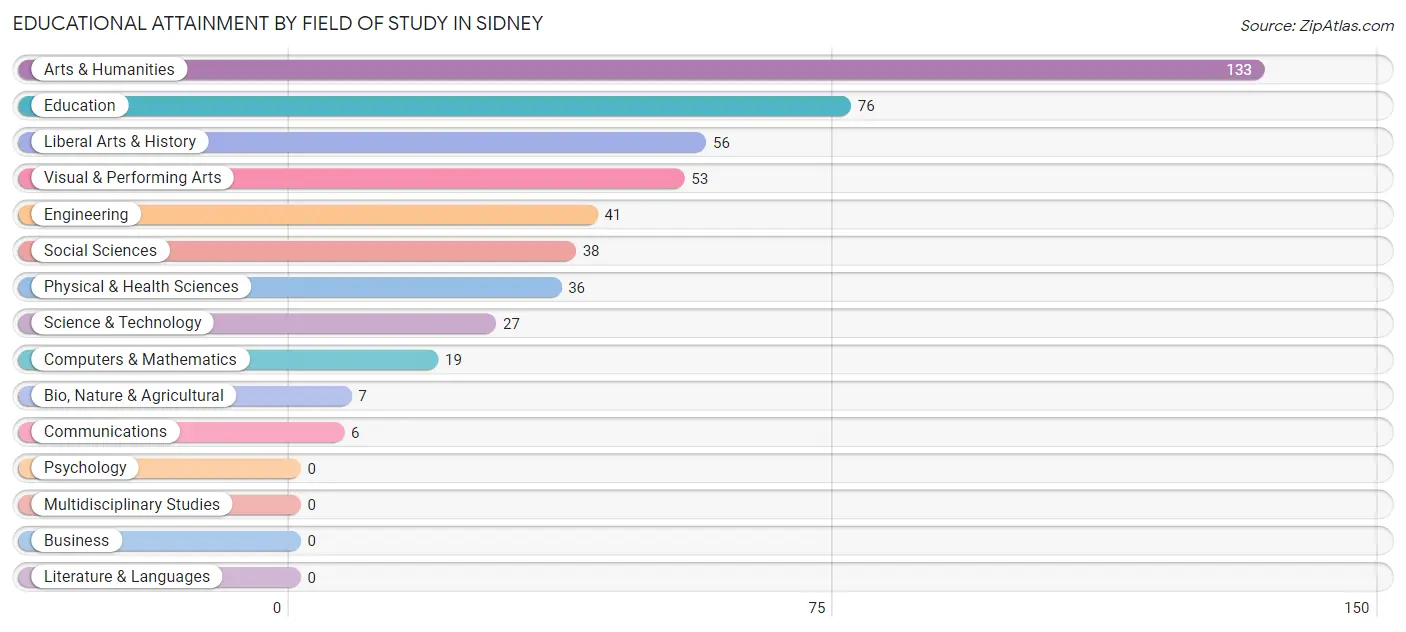
| Field of Study | # Graduates | % Graduates |
| Computers & Mathematics | 19 | 3.9% |
| Bio, Nature & Agricultural | 7 | 1.4% |
| Physical & Health Sciences | 36 | 7.3% |
| Psychology | 0 | 0.0% |
| Social Sciences | 38 | 7.7% |
| Engineering | 41 | 8.3% |
| Multidisciplinary Studies | 0 | 0.0% |
| Science & Technology | 27 | 5.5% |
| Business | 0 | 0.0% |
| Education | 76 | 15.4% |
| Literature & Languages | 0 | 0.0% |
| Liberal Arts & History | 56 | 11.4% |
| Visual & Performing Arts | 53 | 10.8% |
| Communications | 6 | 1.2% |
| Arts & Humanities | 133 | 27.0% |
| Total | 492 | 100.0% |
Transportation & Commute in Sidney
Vehicle Availability by Sex in Sidney
The most prevalent vehicle ownership categories in Sidney are males with 2 vehicles (325, accounting for 45.3%) and females with 2 vehicles (268, making up 48.2%).
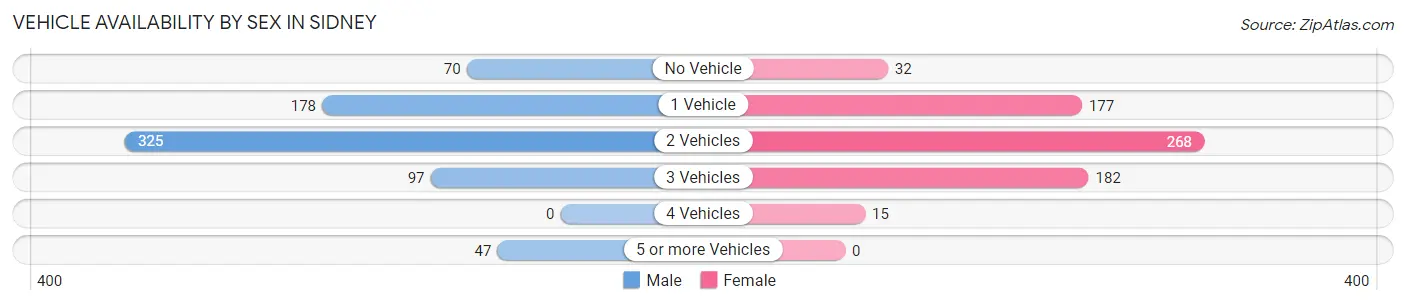
| Vehicles Available | Male | Female |
| No Vehicle | 70 (9.8%) | 32 (4.8%) |
| 1 Vehicle | 178 (24.8%) | 177 (26.3%) |
| 2 Vehicles | 325 (45.3%) | 268 (39.8%) |
| 3 Vehicles | 97 (13.5%) | 182 (27.0%) |
| 4 Vehicles | 0 (0.0%) | 15 (2.2%) |
| 5 or more Vehicles | 47 (6.6%) | 0 (0.0%) |
| Total | 717 (100.0%) | 674 (100.0%) |
Commute Time in Sidney
The most frequently occuring commute durations in Sidney are 10 to 14 minutes (303 commuters, 22.7%), 5 to 9 minutes (252 commuters, 18.9%), and less than 5 minutes (203 commuters, 15.2%).
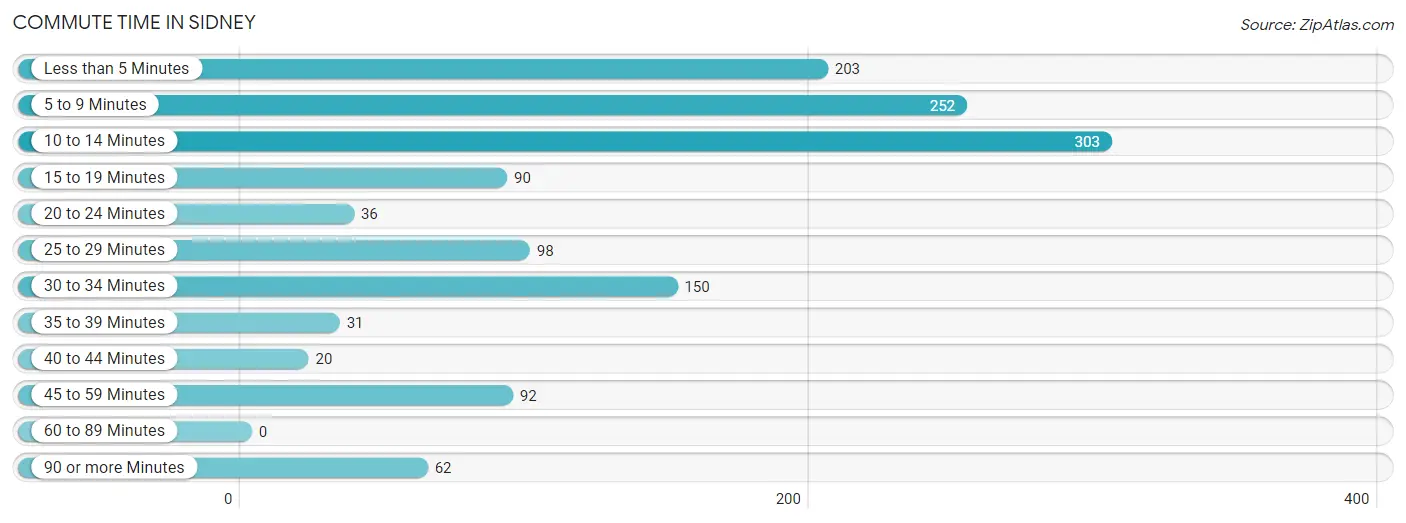
| Commute Time | # Commuters | % Commuters |
| Less than 5 Minutes | 203 | 15.2% |
| 5 to 9 Minutes | 252 | 18.9% |
| 10 to 14 Minutes | 303 | 22.7% |
| 15 to 19 Minutes | 90 | 6.7% |
| 20 to 24 Minutes | 36 | 2.7% |
| 25 to 29 Minutes | 98 | 7.3% |
| 30 to 34 Minutes | 150 | 11.2% |
| 35 to 39 Minutes | 31 | 2.3% |
| 40 to 44 Minutes | 20 | 1.5% |
| 45 to 59 Minutes | 92 | 6.9% |
| 60 to 89 Minutes | 0 | 0.0% |
| 90 or more Minutes | 62 | 4.6% |
Commute Time by Sex in Sidney
The most common commute times in Sidney are 10 to 14 minutes (204 commuters, 30.4%) for males and 5 to 9 minutes (151 commuters, 22.6%) for females.
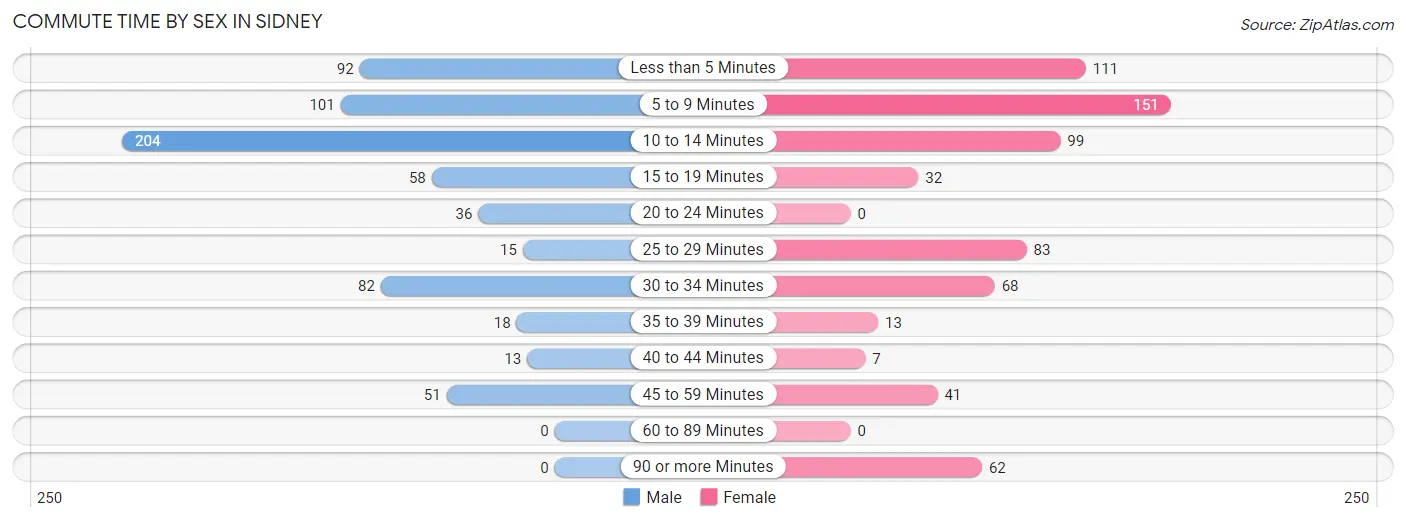
| Commute Time | Male | Female |
| Less than 5 Minutes | 92 (13.7%) | 111 (16.6%) |
| 5 to 9 Minutes | 101 (15.1%) | 151 (22.6%) |
| 10 to 14 Minutes | 204 (30.4%) | 99 (14.8%) |
| 15 to 19 Minutes | 58 (8.7%) | 32 (4.8%) |
| 20 to 24 Minutes | 36 (5.4%) | 0 (0.0%) |
| 25 to 29 Minutes | 15 (2.2%) | 83 (12.4%) |
| 30 to 34 Minutes | 82 (12.2%) | 68 (10.2%) |
| 35 to 39 Minutes | 18 (2.7%) | 13 (1.9%) |
| 40 to 44 Minutes | 13 (1.9%) | 7 (1.1%) |
| 45 to 59 Minutes | 51 (7.6%) | 41 (6.1%) |
| 60 to 89 Minutes | 0 (0.0%) | 0 (0.0%) |
| 90 or more Minutes | 0 (0.0%) | 62 (9.3%) |
Time of Departure to Work by Sex in Sidney
The most frequent times of departure to work in Sidney are 12:00 PM to 3:59 PM (110, 16.4%) for males and 8:30 AM to 8:59 AM (171, 25.6%) for females.
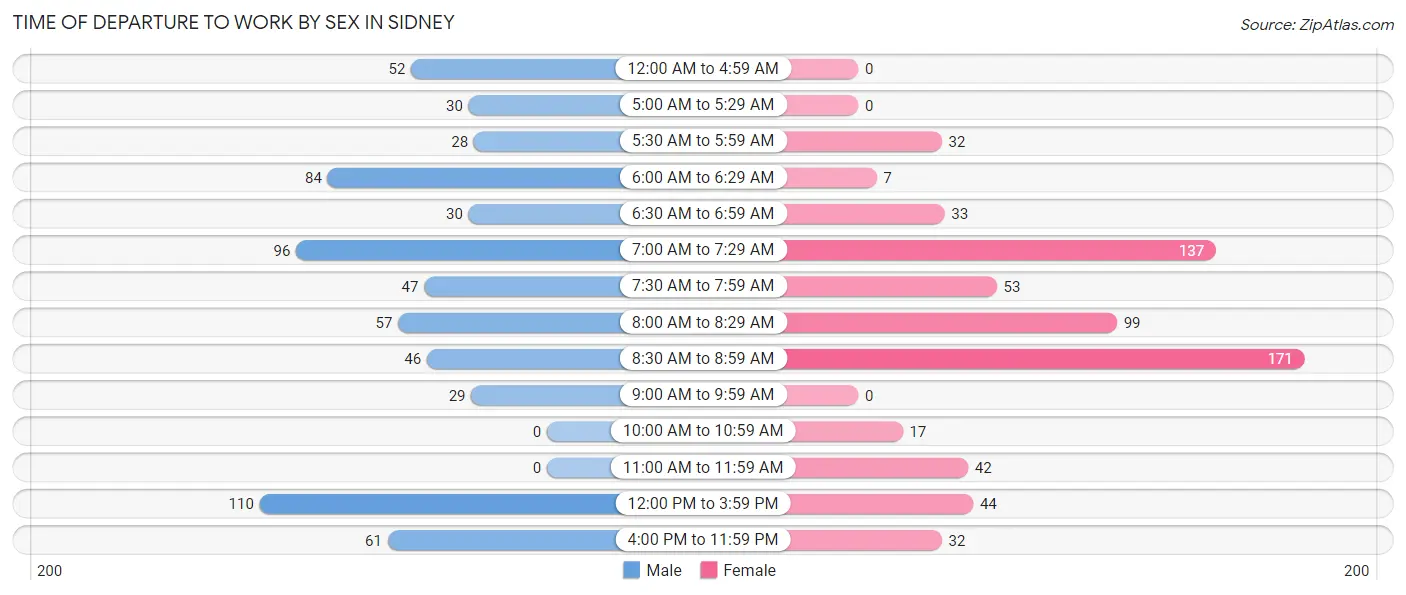
| Time of Departure | Male | Female |
| 12:00 AM to 4:59 AM | 52 (7.8%) | 0 (0.0%) |
| 5:00 AM to 5:29 AM | 30 (4.5%) | 0 (0.0%) |
| 5:30 AM to 5:59 AM | 28 (4.2%) | 32 (4.8%) |
| 6:00 AM to 6:29 AM | 84 (12.5%) | 7 (1.1%) |
| 6:30 AM to 6:59 AM | 30 (4.5%) | 33 (5.0%) |
| 7:00 AM to 7:29 AM | 96 (14.3%) | 137 (20.5%) |
| 7:30 AM to 7:59 AM | 47 (7.0%) | 53 (8.0%) |
| 8:00 AM to 8:29 AM | 57 (8.5%) | 99 (14.8%) |
| 8:30 AM to 8:59 AM | 46 (6.9%) | 171 (25.6%) |
| 9:00 AM to 9:59 AM | 29 (4.3%) | 0 (0.0%) |
| 10:00 AM to 10:59 AM | 0 (0.0%) | 17 (2.5%) |
| 11:00 AM to 11:59 AM | 0 (0.0%) | 42 (6.3%) |
| 12:00 PM to 3:59 PM | 110 (16.4%) | 44 (6.6%) |
| 4:00 PM to 11:59 PM | 61 (9.1%) | 32 (4.8%) |
| Total | 670 (100.0%) | 667 (100.0%) |
Housing Occupancy in Sidney
Occupancy by Ownership in Sidney
Of the total 1,490 dwellings in Sidney, owner-occupied units account for 936 (62.8%), while renter-occupied units make up 554 (37.2%).
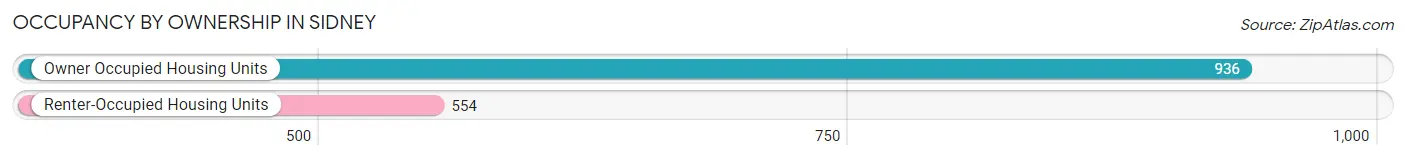
| Occupancy | # Housing Units | % Housing Units |
| Owner Occupied Housing Units | 936 | 62.8% |
| Renter-Occupied Housing Units | 554 | 37.2% |
| Total Occupied Housing Units | 1,490 | 100.0% |
Occupancy by Household Size in Sidney
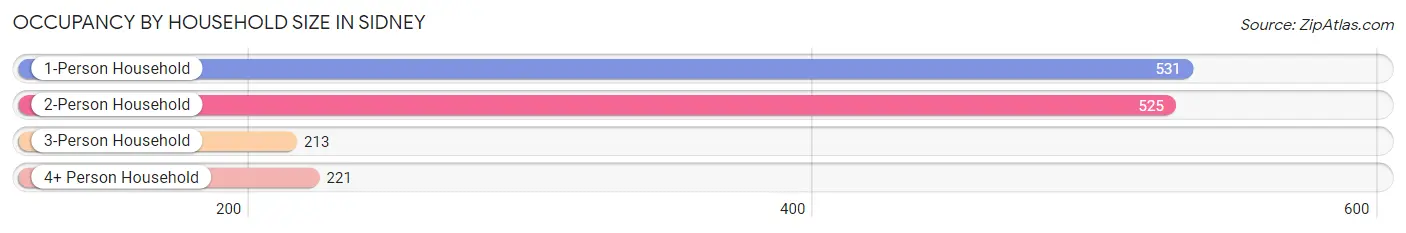
| Household Size | # Housing Units | % Housing Units |
| 1-Person Household | 531 | 35.6% |
| 2-Person Household | 525 | 35.2% |
| 3-Person Household | 213 | 14.3% |
| 4+ Person Household | 221 | 14.8% |
| Total Housing Units | 1,490 | 100.0% |
Occupancy by Ownership by Household Size in Sidney
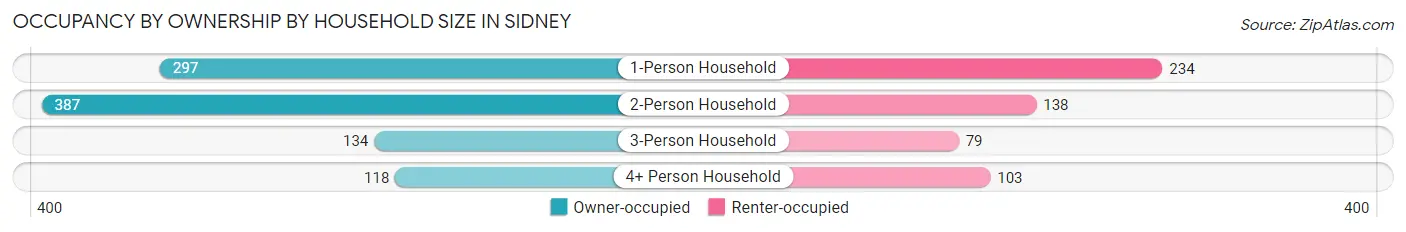
| Household Size | Owner-occupied | Renter-occupied |
| 1-Person Household | 297 (55.9%) | 234 (44.1%) |
| 2-Person Household | 387 (73.7%) | 138 (26.3%) |
| 3-Person Household | 134 (62.9%) | 79 (37.1%) |
| 4+ Person Household | 118 (53.4%) | 103 (46.6%) |
| Total Housing Units | 936 (62.8%) | 554 (37.2%) |
Occupancy by Educational Attainment in Sidney
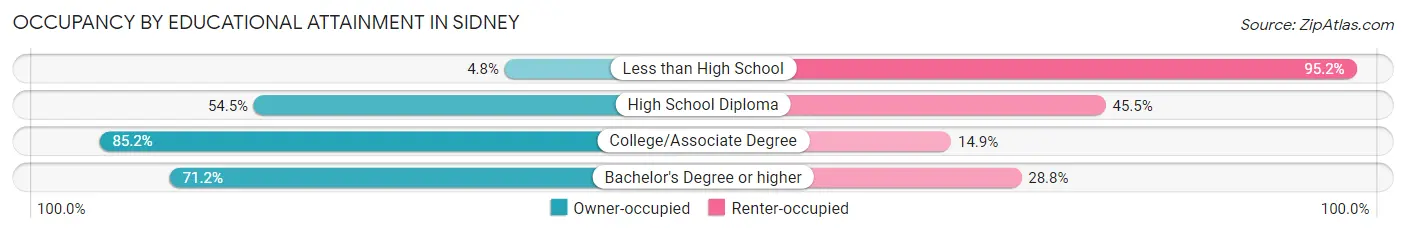
| Household Size | Owner-occupied | Renter-occupied |
| Less than High School | 7 (4.8%) | 139 (95.2%) |
| High School Diploma | 313 (54.5%) | 261 (45.5%) |
| College/Associate Degree | 413 (85.2%) | 72 (14.8%) |
| Bachelor's Degree or higher | 203 (71.2%) | 82 (28.8%) |
Occupancy by Age of Householder in Sidney
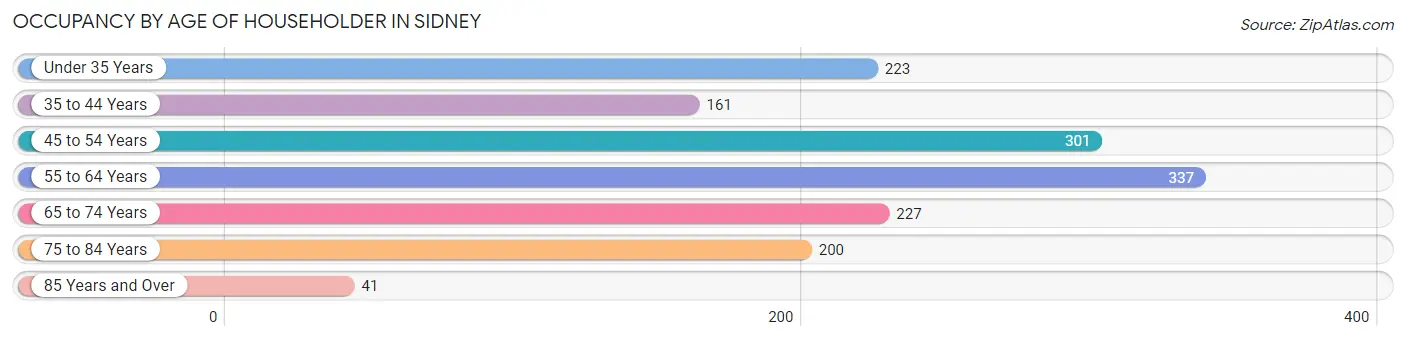
| Age Bracket | # Households | % Households |
| Under 35 Years | 223 | 15.0% |
| 35 to 44 Years | 161 | 10.8% |
| 45 to 54 Years | 301 | 20.2% |
| 55 to 64 Years | 337 | 22.6% |
| 65 to 74 Years | 227 | 15.2% |
| 75 to 84 Years | 200 | 13.4% |
| 85 Years and Over | 41 | 2.8% |
| Total | 1,490 | 100.0% |
Housing Finances in Sidney
Median Income by Occupancy in Sidney
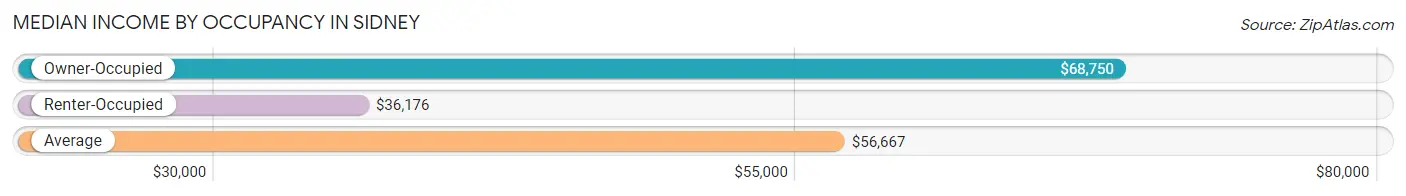
| Occupancy Type | # Households | Median Income |
| Owner-Occupied | 936 (62.8%) | $68,750 |
| Renter-Occupied | 554 (37.2%) | $36,176 |
| Average | 1,490 (100.0%) | $56,667 |
Occupancy by Householder Income Bracket in Sidney
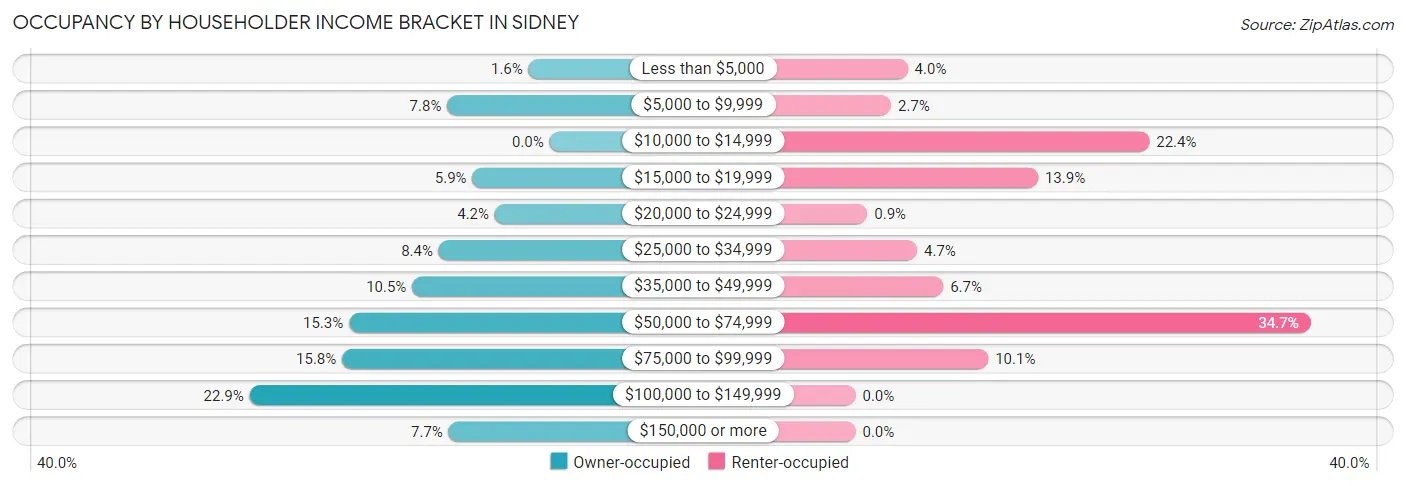
| Income Bracket | Owner-occupied | Renter-occupied |
| Less than $5,000 | 15 (1.6%) | 22 (4.0%) |
| $5,000 to $9,999 | 73 (7.8%) | 15 (2.7%) |
| $10,000 to $14,999 | 0 (0.0%) | 124 (22.4%) |
| $15,000 to $19,999 | 55 (5.9%) | 77 (13.9%) |
| $20,000 to $24,999 | 39 (4.2%) | 5 (0.9%) |
| $25,000 to $34,999 | 79 (8.4%) | 26 (4.7%) |
| $35,000 to $49,999 | 98 (10.5%) | 37 (6.7%) |
| $50,000 to $74,999 | 143 (15.3%) | 192 (34.7%) |
| $75,000 to $99,999 | 148 (15.8%) | 56 (10.1%) |
| $100,000 to $149,999 | 214 (22.9%) | 0 (0.0%) |
| $150,000 or more | 72 (7.7%) | 0 (0.0%) |
| Total | 936 (100.0%) | 554 (100.0%) |
Monthly Housing Cost Tiers in Sidney
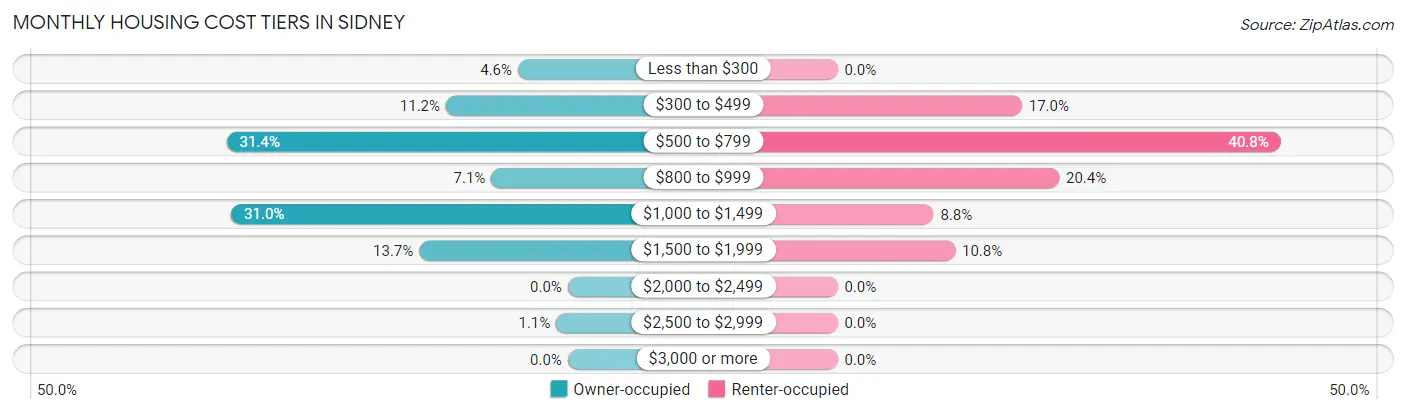
| Monthly Cost | Owner-occupied | Renter-occupied |
| Less than $300 | 43 (4.6%) | 0 (0.0%) |
| $300 to $499 | 105 (11.2%) | 94 (17.0%) |
| $500 to $799 | 294 (31.4%) | 226 (40.8%) |
| $800 to $999 | 66 (7.0%) | 113 (20.4%) |
| $1,000 to $1,499 | 290 (31.0%) | 49 (8.8%) |
| $1,500 to $1,999 | 128 (13.7%) | 60 (10.8%) |
| $2,000 to $2,499 | 0 (0.0%) | 0 (0.0%) |
| $2,500 to $2,999 | 10 (1.1%) | 0 (0.0%) |
| $3,000 or more | 0 (0.0%) | 0 (0.0%) |
| Total | 936 (100.0%) | 554 (100.0%) |
Physical Housing Characteristics in Sidney
Housing Structures in Sidney
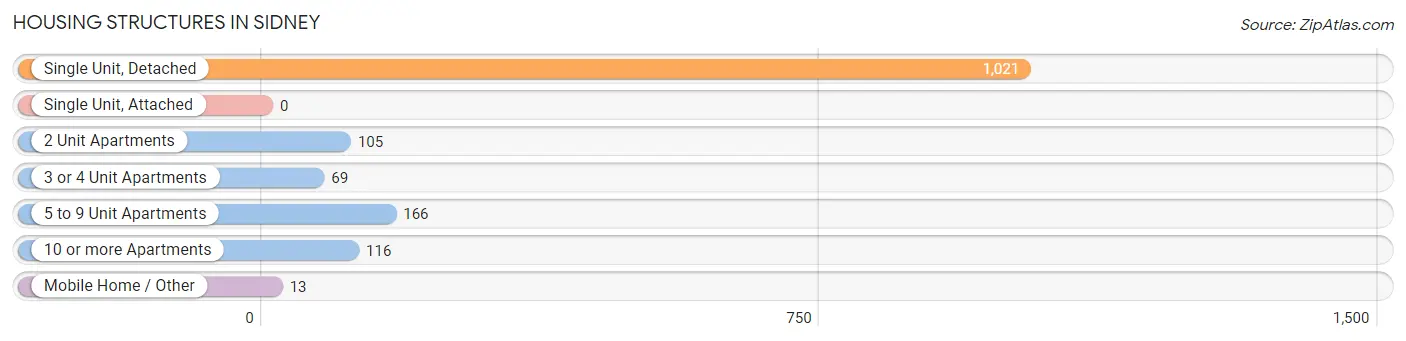
| Structure Type | # Housing Units | % Housing Units |
| Single Unit, Detached | 1,021 | 68.5% |
| Single Unit, Attached | 0 | 0.0% |
| 2 Unit Apartments | 105 | 7.0% |
| 3 or 4 Unit Apartments | 69 | 4.6% |
| 5 to 9 Unit Apartments | 166 | 11.1% |
| 10 or more Apartments | 116 | 7.8% |
| Mobile Home / Other | 13 | 0.9% |
| Total | 1,490 | 100.0% |
Housing Structures by Occupancy in Sidney
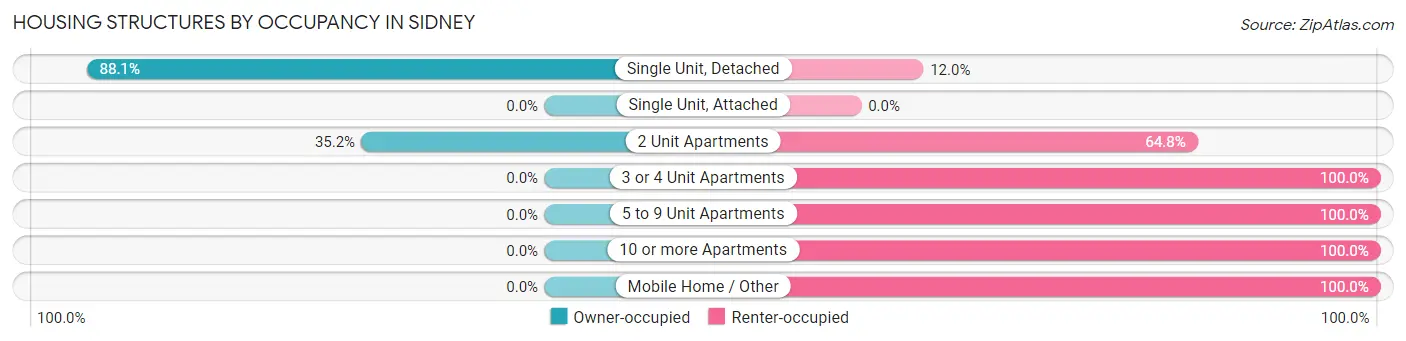
| Structure Type | Owner-occupied | Renter-occupied |
| Single Unit, Detached | 899 (88.0%) | 122 (11.9%) |
| Single Unit, Attached | 0 (0.0%) | 0 (0.0%) |
| 2 Unit Apartments | 37 (35.2%) | 68 (64.8%) |
| 3 or 4 Unit Apartments | 0 (0.0%) | 69 (100.0%) |
| 5 to 9 Unit Apartments | 0 (0.0%) | 166 (100.0%) |
| 10 or more Apartments | 0 (0.0%) | 116 (100.0%) |
| Mobile Home / Other | 0 (0.0%) | 13 (100.0%) |
| Total | 936 (62.8%) | 554 (37.2%) |
Housing Structures by Number of Rooms in Sidney
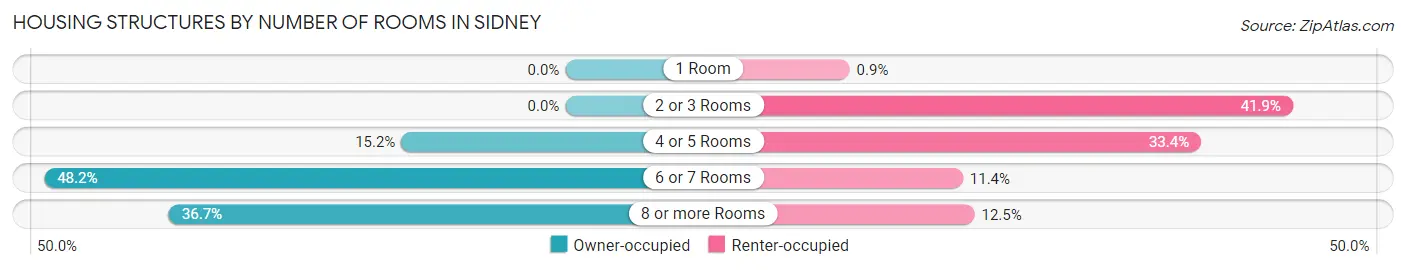
| Number of Rooms | Owner-occupied | Renter-occupied |
| 1 Room | 0 (0.0%) | 5 (0.9%) |
| 2 or 3 Rooms | 0 (0.0%) | 232 (41.9%) |
| 4 or 5 Rooms | 142 (15.2%) | 185 (33.4%) |
| 6 or 7 Rooms | 451 (48.2%) | 63 (11.4%) |
| 8 or more Rooms | 343 (36.6%) | 69 (12.4%) |
| Total | 936 (100.0%) | 554 (100.0%) |
Housing Structure by Heating Type in Sidney
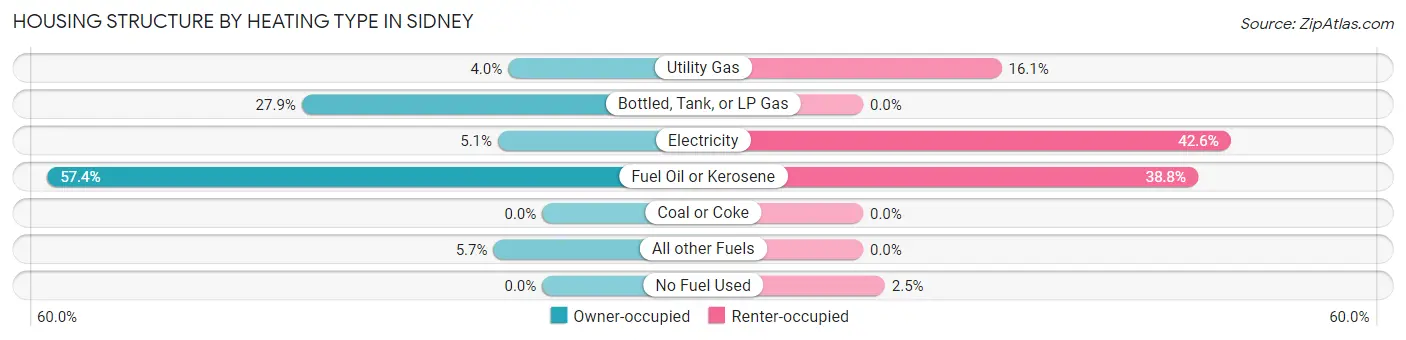
| Heating Type | Owner-occupied | Renter-occupied |
| Utility Gas | 37 (4.0%) | 89 (16.1%) |
| Bottled, Tank, or LP Gas | 261 (27.9%) | 0 (0.0%) |
| Electricity | 48 (5.1%) | 236 (42.6%) |
| Fuel Oil or Kerosene | 537 (57.4%) | 215 (38.8%) |
| Coal or Coke | 0 (0.0%) | 0 (0.0%) |
| All other Fuels | 53 (5.7%) | 0 (0.0%) |
| No Fuel Used | 0 (0.0%) | 14 (2.5%) |
| Total | 936 (100.0%) | 554 (100.0%) |
Household Vehicle Usage in Sidney
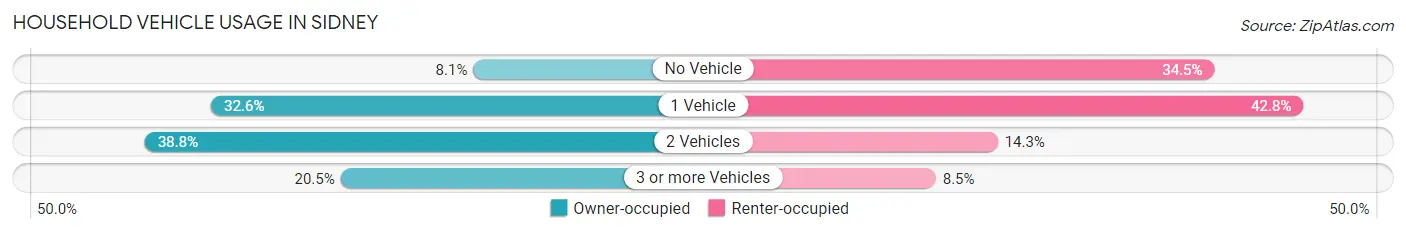
| Vehicles per Household | Owner-occupied | Renter-occupied |
| No Vehicle | 76 (8.1%) | 191 (34.5%) |
| 1 Vehicle | 305 (32.6%) | 237 (42.8%) |
| 2 Vehicles | 363 (38.8%) | 79 (14.3%) |
| 3 or more Vehicles | 192 (20.5%) | 47 (8.5%) |
| Total | 936 (100.0%) | 554 (100.0%) |
Real Estate & Mortgages in Sidney
Real Estate and Mortgage Overview in Sidney
| Characteristic | Without Mortgage | With Mortgage |
| Housing Units | 493 | 443 |
| Median Property Value | $89,500 | $106,100 |
| Median Household Income | $70,703 | $24 |
| Monthly Housing Costs | $619 | $0 |
| Real Estate Taxes | $3,089 | $31 |
Property Value by Mortgage Status in Sidney
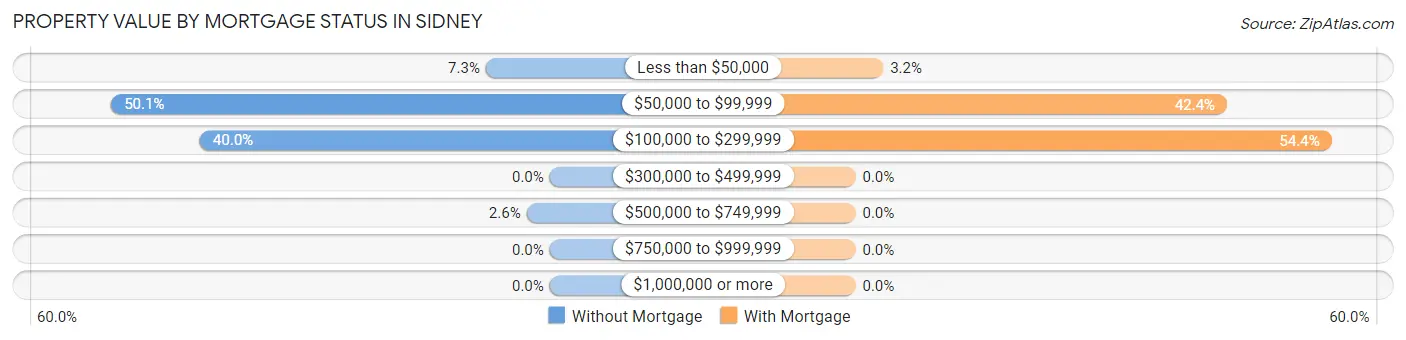
| Property Value | Without Mortgage | With Mortgage |
| Less than $50,000 | 36 (7.3%) | 14 (3.2%) |
| $50,000 to $99,999 | 247 (50.1%) | 188 (42.4%) |
| $100,000 to $299,999 | 197 (40.0%) | 241 (54.4%) |
| $300,000 to $499,999 | 0 (0.0%) | 0 (0.0%) |
| $500,000 to $749,999 | 13 (2.6%) | 0 (0.0%) |
| $750,000 to $999,999 | 0 (0.0%) | 0 (0.0%) |
| $1,000,000 or more | 0 (0.0%) | 0 (0.0%) |
| Total | 493 (100.0%) | 443 (100.0%) |
Household Income by Mortgage Status in Sidney
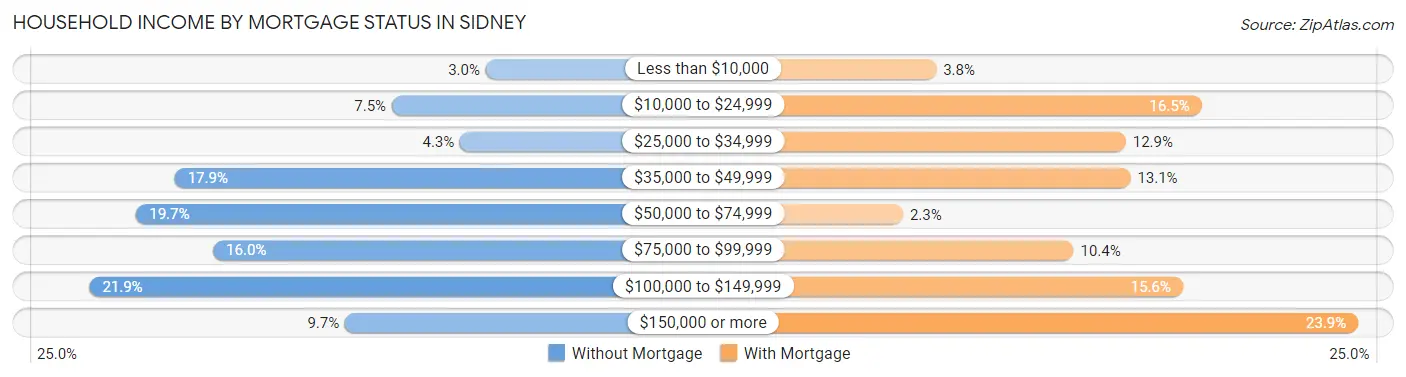
| Household Income | Without Mortgage | With Mortgage |
| Less than $10,000 | 15 (3.0%) | 17 (3.8%) |
| $10,000 to $24,999 | 37 (7.5%) | 73 (16.5%) |
| $25,000 to $34,999 | 21 (4.3%) | 57 (12.9%) |
| $35,000 to $49,999 | 88 (17.8%) | 58 (13.1%) |
| $50,000 to $74,999 | 97 (19.7%) | 10 (2.3%) |
| $75,000 to $99,999 | 79 (16.0%) | 46 (10.4%) |
| $100,000 to $149,999 | 108 (21.9%) | 69 (15.6%) |
| $150,000 or more | 48 (9.7%) | 106 (23.9%) |
| Total | 493 (100.0%) | 443 (100.0%) |
Property Value to Household Income Ratio in Sidney
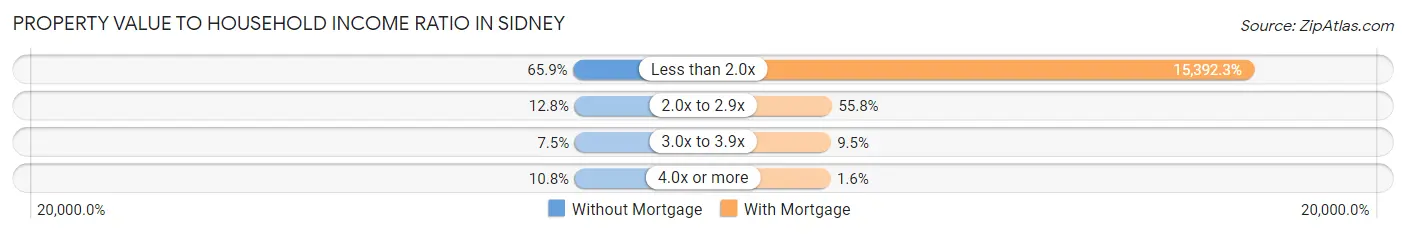
| Value-to-Income Ratio | Without Mortgage | With Mortgage |
| Less than 2.0x | 325 (65.9%) | 68,188 (15,392.3%) |
| 2.0x to 2.9x | 63 (12.8%) | 247 (55.8%) |
| 3.0x to 3.9x | 37 (7.5%) | 42 (9.5%) |
| 4.0x or more | 53 (10.7%) | 7 (1.6%) |
| Total | 493 (100.0%) | 443 (100.0%) |
Real Estate Taxes by Mortgage Status in Sidney
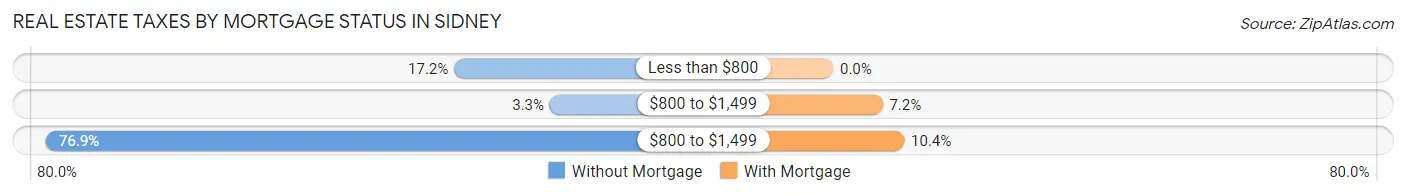
| Property Taxes | Without Mortgage | With Mortgage |
| Less than $800 | 85 (17.2%) | 0 (0.0%) |
| $800 to $1,499 | 16 (3.3%) | 32 (7.2%) |
| $800 to $1,499 | 379 (76.9%) | 46 (10.4%) |
| Total | 493 (100.0%) | 443 (100.0%) |
Health & Disability in Sidney
Health Insurance Coverage by Age in Sidney
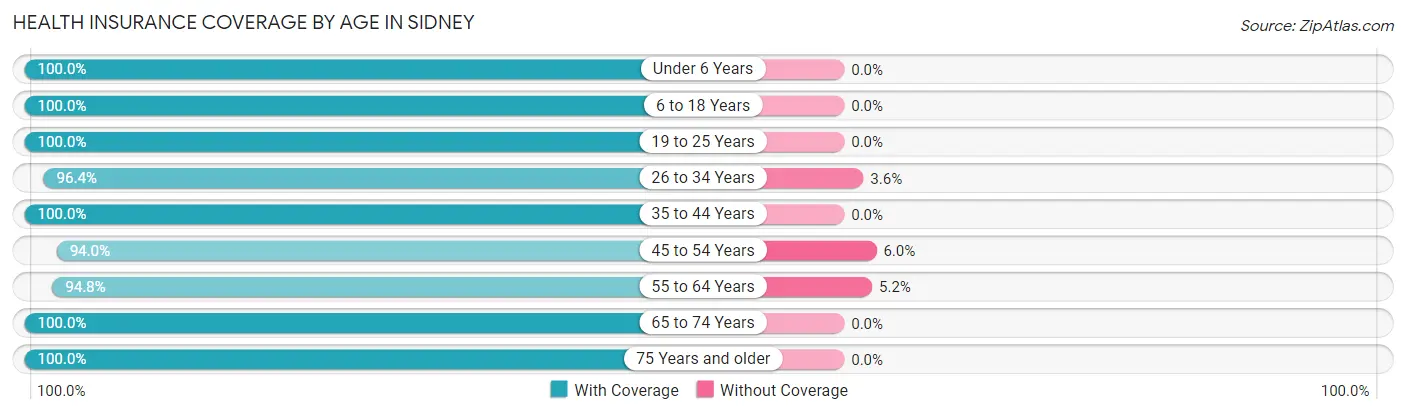
| Age Bracket | With Coverage | Without Coverage |
| Under 6 Years | 266 (100.0%) | 0 (0.0%) |
| 6 to 18 Years | 676 (100.0%) | 0 (0.0%) |
| 19 to 25 Years | 307 (100.0%) | 0 (0.0%) |
| 26 to 34 Years | 379 (96.4%) | 14 (3.6%) |
| 35 to 44 Years | 280 (100.0%) | 0 (0.0%) |
| 45 to 54 Years | 470 (94.0%) | 30 (6.0%) |
| 55 to 64 Years | 494 (94.8%) | 27 (5.2%) |
| 65 to 74 Years | 374 (100.0%) | 0 (0.0%) |
| 75 Years and older | 433 (100.0%) | 0 (0.0%) |
| Total | 3,679 (98.1%) | 71 (1.9%) |
Health Insurance Coverage by Citizenship Status in Sidney
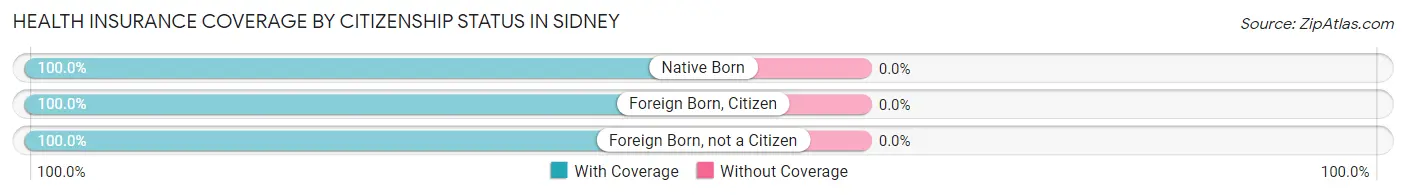
| Citizenship Status | With Coverage | Without Coverage |
| Native Born | 266 (100.0%) | 0 (0.0%) |
| Foreign Born, Citizen | 676 (100.0%) | 0 (0.0%) |
| Foreign Born, not a Citizen | 307 (100.0%) | 0 (0.0%) |
Health Insurance Coverage by Household Income in Sidney
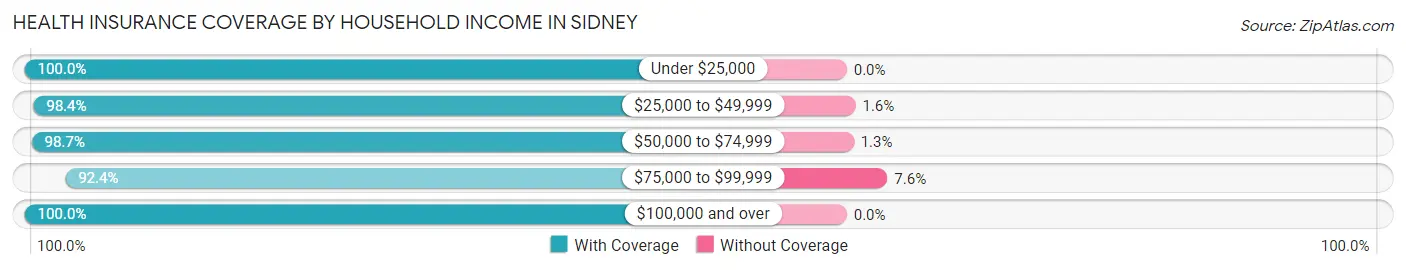
| Household Income | With Coverage | Without Coverage |
| Under $25,000 | 831 (100.0%) | 0 (0.0%) |
| $25,000 to $49,999 | 420 (98.4%) | 7 (1.6%) |
| $50,000 to $74,999 | 1,141 (98.7%) | 15 (1.3%) |
| $75,000 to $99,999 | 425 (92.4%) | 35 (7.6%) |
| $100,000 and over | 838 (100.0%) | 0 (0.0%) |
Public vs Private Health Insurance Coverage by Age in Sidney
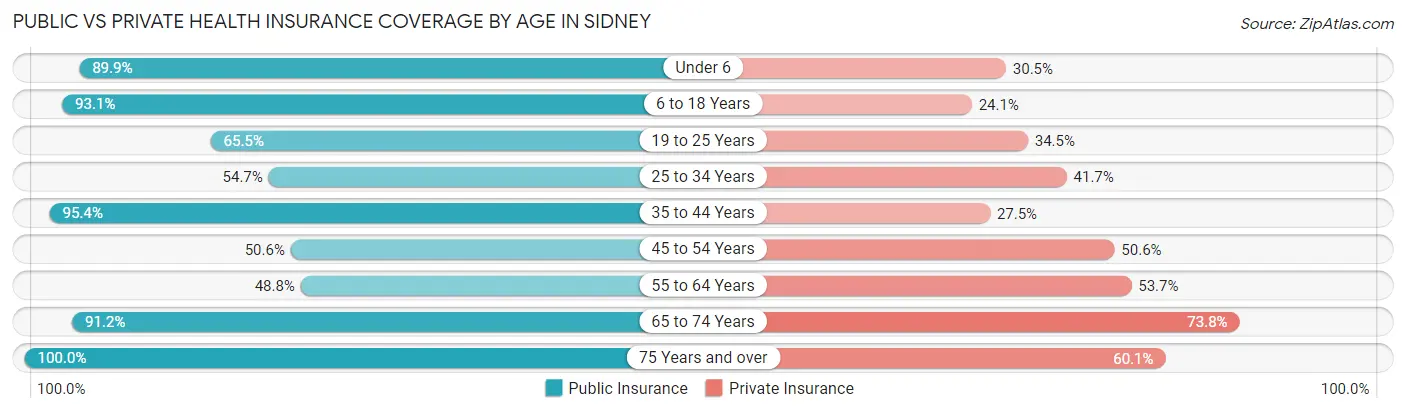
| Age Bracket | Public Insurance | Private Insurance |
| Under 6 | 239 (89.8%) | 81 (30.4%) |
| 6 to 18 Years | 629 (93.0%) | 163 (24.1%) |
| 19 to 25 Years | 201 (65.5%) | 106 (34.5%) |
| 25 to 34 Years | 215 (54.7%) | 164 (41.7%) |
| 35 to 44 Years | 267 (95.4%) | 77 (27.5%) |
| 45 to 54 Years | 253 (50.6%) | 253 (50.6%) |
| 55 to 64 Years | 254 (48.7%) | 280 (53.7%) |
| 65 to 74 Years | 341 (91.2%) | 276 (73.8%) |
| 75 Years and over | 433 (100.0%) | 260 (60.1%) |
| Total | 2,832 (75.5%) | 1,660 (44.3%) |
Disability Status by Sex by Age in Sidney
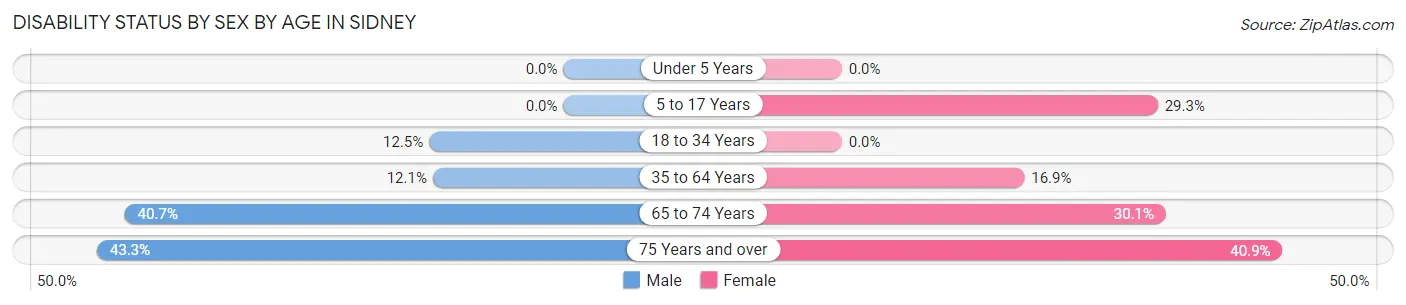
| Age Bracket | Male | Female |
| Under 5 Years | 0 (0.0%) | 0 (0.0%) |
| 5 to 17 Years | 0 (0.0%) | 134 (29.3%) |
| 18 to 34 Years | 40 (12.5%) | 0 (0.0%) |
| 35 to 64 Years | 84 (12.1%) | 103 (16.9%) |
| 65 to 74 Years | 90 (40.7%) | 46 (30.1%) |
| 75 Years and over | 71 (43.3%) | 110 (40.9%) |
Disability Class by Sex by Age in Sidney
Disability Class: Hearing Difficulty
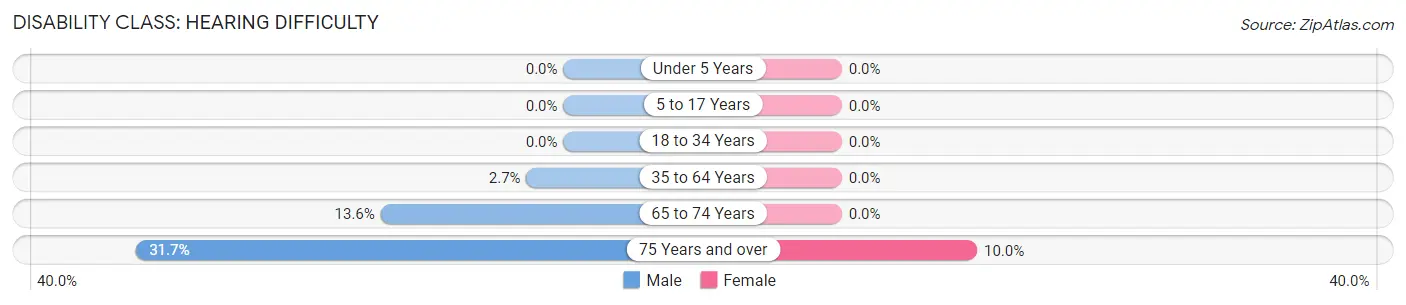
| Age Bracket | Male | Female |
| Under 5 Years | 0 (0.0%) | 0 (0.0%) |
| 5 to 17 Years | 0 (0.0%) | 0 (0.0%) |
| 18 to 34 Years | 0 (0.0%) | 0 (0.0%) |
| 35 to 64 Years | 19 (2.7%) | 0 (0.0%) |
| 65 to 74 Years | 30 (13.6%) | 0 (0.0%) |
| 75 Years and over | 52 (31.7%) | 27 (10.0%) |
Disability Class: Vision Difficulty
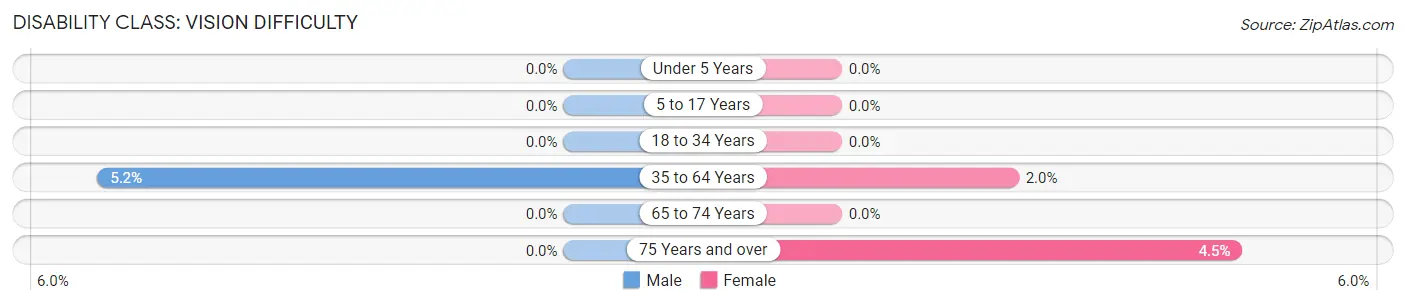
| Age Bracket | Male | Female |
| Under 5 Years | 0 (0.0%) | 0 (0.0%) |
| 5 to 17 Years | 0 (0.0%) | 0 (0.0%) |
| 18 to 34 Years | 0 (0.0%) | 0 (0.0%) |
| 35 to 64 Years | 36 (5.2%) | 12 (2.0%) |
| 65 to 74 Years | 0 (0.0%) | 0 (0.0%) |
| 75 Years and over | 0 (0.0%) | 12 (4.5%) |
Disability Class: Cognitive Difficulty
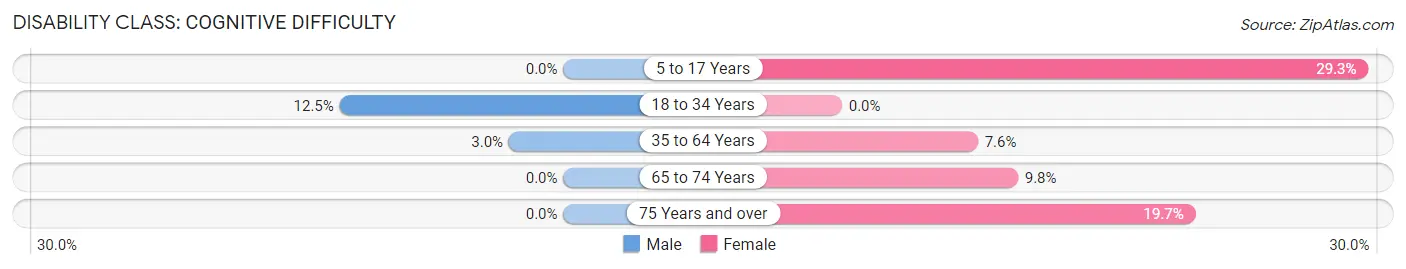
| Age Bracket | Male | Female |
| 5 to 17 Years | 0 (0.0%) | 134 (29.3%) |
| 18 to 34 Years | 40 (12.5%) | 0 (0.0%) |
| 35 to 64 Years | 21 (3.0%) | 46 (7.6%) |
| 65 to 74 Years | 0 (0.0%) | 15 (9.8%) |
| 75 Years and over | 0 (0.0%) | 53 (19.7%) |
Disability Class: Ambulatory Difficulty
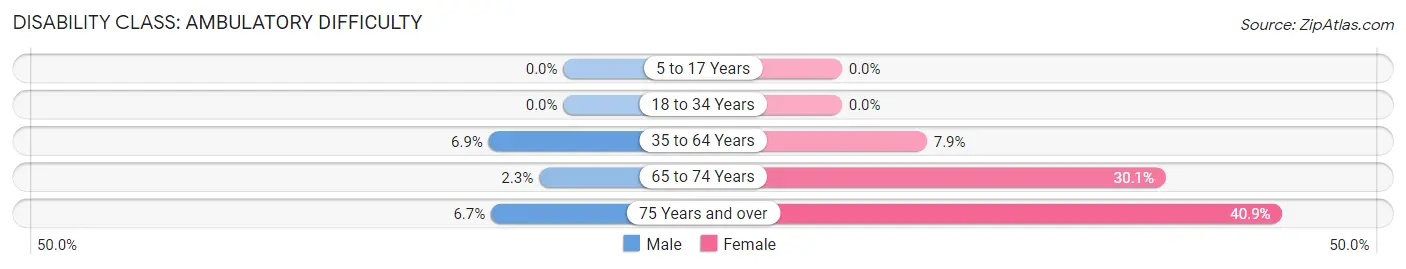
| Age Bracket | Male | Female |
| 5 to 17 Years | 0 (0.0%) | 0 (0.0%) |
| 18 to 34 Years | 0 (0.0%) | 0 (0.0%) |
| 35 to 64 Years | 48 (6.9%) | 48 (7.9%) |
| 65 to 74 Years | 5 (2.3%) | 46 (30.1%) |
| 75 Years and over | 11 (6.7%) | 110 (40.9%) |
Disability Class: Self-Care Difficulty
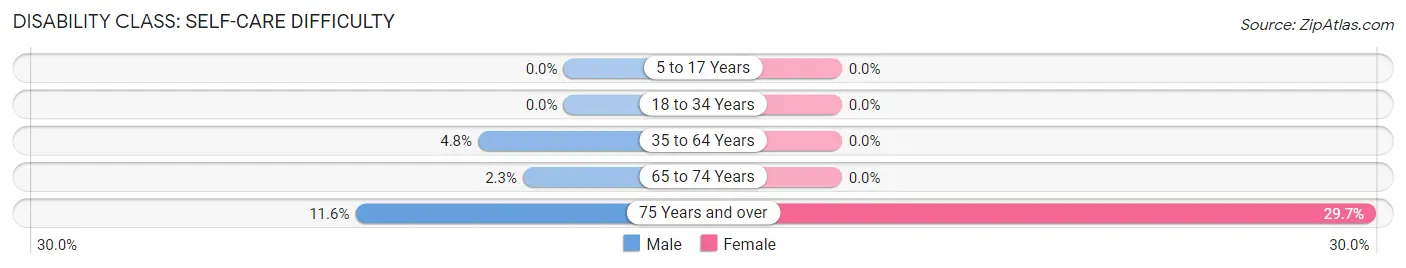
| Age Bracket | Male | Female |
| 5 to 17 Years | 0 (0.0%) | 0 (0.0%) |
| 18 to 34 Years | 0 (0.0%) | 0 (0.0%) |
| 35 to 64 Years | 33 (4.8%) | 0 (0.0%) |
| 65 to 74 Years | 5 (2.3%) | 0 (0.0%) |
| 75 Years and over | 19 (11.6%) | 80 (29.7%) |
Technology Access in Sidney
Computing Device Access in Sidney
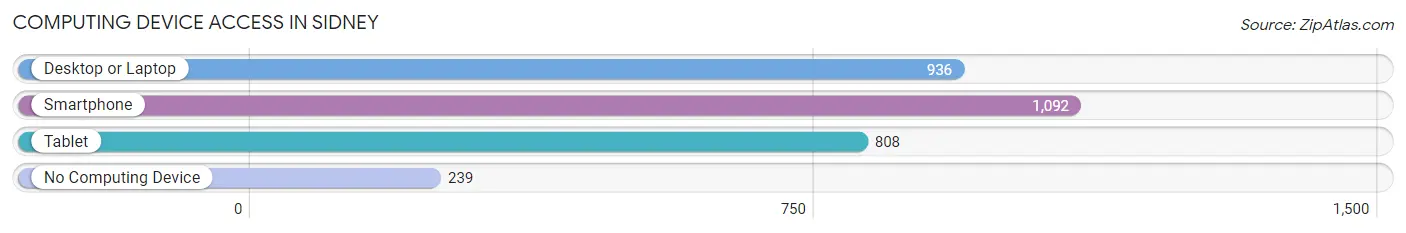
| Device Type | # Households | % Households |
| Desktop or Laptop | 936 | 62.8% |
| Smartphone | 1,092 | 73.3% |
| Tablet | 808 | 54.2% |
| No Computing Device | 239 | 16.0% |
| Total | 1,490 | 100.0% |
Internet Access in Sidney
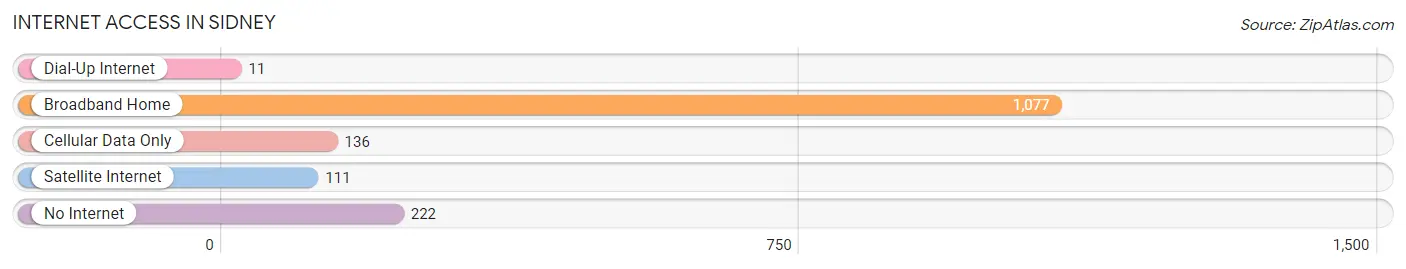
| Internet Type | # Households | % Households |
| Dial-Up Internet | 11 | 0.7% |
| Broadband Home | 1,077 | 72.3% |
| Cellular Data Only | 136 | 9.1% |
| Satellite Internet | 111 | 7.4% |
| No Internet | 222 | 14.9% |
| Total | 1,490 | 100.0% |
Sidney Summary
Sidney is a town located in Delaware County, New York, United States. The population was 6,819 at the 2010 census. The town is named after Sir Philip Sidney, an English poet and courtier. Sidney is located in the western part of the county and is south of Oneonta.
History
The area that is now Sidney was first settled around 1786. The town was formed from the Town of Franklin in 1807. The town was named after Sir Philip Sidney, an English poet and courtier.
In the early 19th century, the town was known for its iron ore deposits. The ore was mined and shipped to the nearby city of Oneonta. The town also had several sawmills and gristmills.
Geography
Sidney is located in the western part of Delaware County. It is bordered by the towns of Franklin to the north, Masonville to the east, and Walton to the south. The town is located in the Catskill Mountains and is home to several small lakes and ponds.
The highest point in the town is an unnamed peak in the Catskills, with an elevation of 2,890 feet (881 m). The lowest point is the junction of the Delaware and Susquehanna Rivers, with an elevation of 1,000 feet (305 m).
Economy
The economy of Sidney is largely based on agriculture and tourism. The town is home to several dairy farms, as well as several apple orchards. The town is also home to several wineries and breweries.
Tourism is also an important part of the economy. The town is home to several campgrounds, as well as several hiking trails. The town is also home to several ski resorts, including Belleayre Mountain and Plattekill Mountain.
Demographics
As of the 2010 census, there were 6,819 people, 2,717 households, and 1,845 families residing in the town. The population density was 57.3 people per square mile (22.1/km2). There were 3,093 housing units at an average density of 25.7 per square mile (9.9/km2).
The racial makeup of the town was 97.2% White, 0.7% African American, 0.2% Native American, 0.3% Asian, 0.1% Pacific Islander, 0.4% from other races, and 1.1% from two or more races. Hispanic or Latino of any race were 1.7% of the population.
There were 2,717 households, out of which 30.2% had children under the age of 18 living with them, 51.2% were married couples living together, 11.2% had a female householder with no husband present, and 32.3% were non-families. 26.2% of all households were made up of individuals, and 11.2% had someone living alone who was 65 years of age or older. The average household size was 2.50 and the average family size was 3.01.
In the town, the population was spread out, with 25.2% under the age of 18, 7.2% from 18 to 24, 25.7% from 25 to 44, 26.2% from 45 to 64, and 15.7% who were 65 years of age or older. The median age was 39 years. For every 100 females, there were 97.2 males. For every 100 females age 18 and over, there were 94.2 males.
The median income for a household in the town was $37,917, and the median income for a family was $45,938. Males had a median income of $31,917 versus $25,000 for females. The per capita income for the town was $18,945. About 8.2% of families and 11.2% of the population were below the poverty line, including 15.2% of those under age 18 and 8.2% of those age 65 or over.
Common Questions
What is Per Capita Income in Sidney?
Per Capita income in Sidney is $25,510.
What is the Median Family Income in Sidney?
Median Family Income in Sidney is $74,911.
What is the Median Household income in Sidney?
Median Household Income in Sidney is $56,667.
What is Income or Wage Gap in Sidney?
Income or Wage Gap in Sidney is 19.3%.
Women in Sidney earn 80.7 cents for every dollar earned by a man.
What is Inequality or Gini Index in Sidney?
Inequality or Gini Index in Sidney is 0.41.
What is the Total Population of Sidney?
Total Population of Sidney is 3,750.
What is the Total Male Population of Sidney?
Total Male Population of Sidney is 1,795.
What is the Total Female Population of Sidney?
Total Female Population of Sidney is 1,955.
What is the Ratio of Males per 100 Females in Sidney?
There are 91.82 Males per 100 Females in Sidney.
What is the Ratio of Females per 100 Males in Sidney?
There are 108.91 Females per 100 Males in Sidney.
What is the Median Population Age in Sidney?
Median Population Age in Sidney is 43.8 Years.
What is the Average Family Size in Sidney
Average Family Size in Sidney is 3.2 People.
What is the Average Household Size in Sidney
Average Household Size in Sidney is 2.5 People.
How Large is the Labor Force in Sidney?
There are 1,676 People in the Labor Forcein in Sidney.
What is the Percentage of People in the Labor Force in Sidney?
57.5% of People are in the Labor Force in Sidney.
What is the Unemployment Rate in Sidney?
Unemployment Rate in Sidney is 11.2%.