Sherman, NY Map & Demographics
Sherman Map
Sherman Overview
$28,035
PER CAPITA INCOME
$61,875
AVG FAMILY INCOME
$39,464
AVG HOUSEHOLD INCOME
7.1%
WAGE / INCOME GAP [ % ]
92.9¢/ $1
WAGE / INCOME GAP [ $ ]
0.51
INEQUALITY / GINI INDEX
567
TOTAL POPULATION
287
MALE POPULATION
280
FEMALE POPULATION
102.50
MALES / 100 FEMALES
97.56
FEMALES / 100 MALES
39.6
MEDIAN AGE
3.4
AVG FAMILY SIZE
2.3
AVG HOUSEHOLD SIZE
232
LABOR FORCE [ PEOPLE ]
53.3%
PERCENT IN LABOR FORCE
3.0%
UNEMPLOYMENT RATE
Sherman Zip Codes
Sherman Area Codes
Income in Sherman
Income Overview in Sherman
Per Capita Income in Sherman is $28,035, while median incomes of families and households are $61,875 and $39,464 respectively.
| Characteristic | Number | Measure |
| Per Capita Income | 567 | $28,035 |
| Median Family Income | 126 | $61,875 |
| Mean Family Income | 126 | $88,324 |
| Median Household Income | 243 | $39,464 |
| Mean Household Income | 243 | $62,388 |
| Income Deficit | 126 | $0 |
| Wage / Income Gap (%) | 567 | 7.12% |
| Wage / Income Gap ($) | 567 | 92.88¢ per $1 |
| Gini / Inequality Index | 567 | 0.51 |
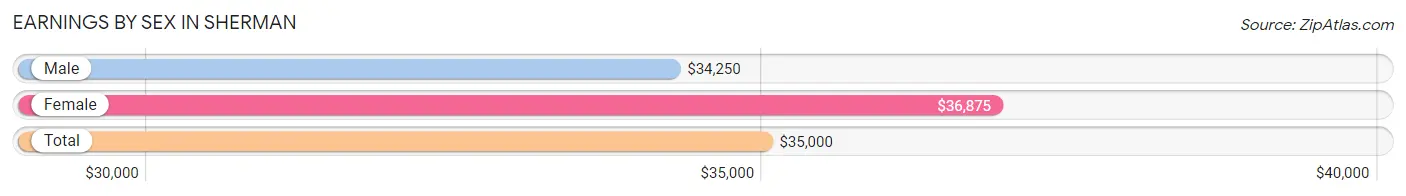
Earnings by Sex in Sherman
Average Earnings in Sherman are $35,000, $34,250 for men and $36,875 for women, a difference of 7.1%.
| Sex | Number | Average Earnings |
| Male | 137 (57.6%) | $34,250 |
| Female | 101 (42.4%) | $36,875 |
| Total | 238 (100.0%) | $35,000 |
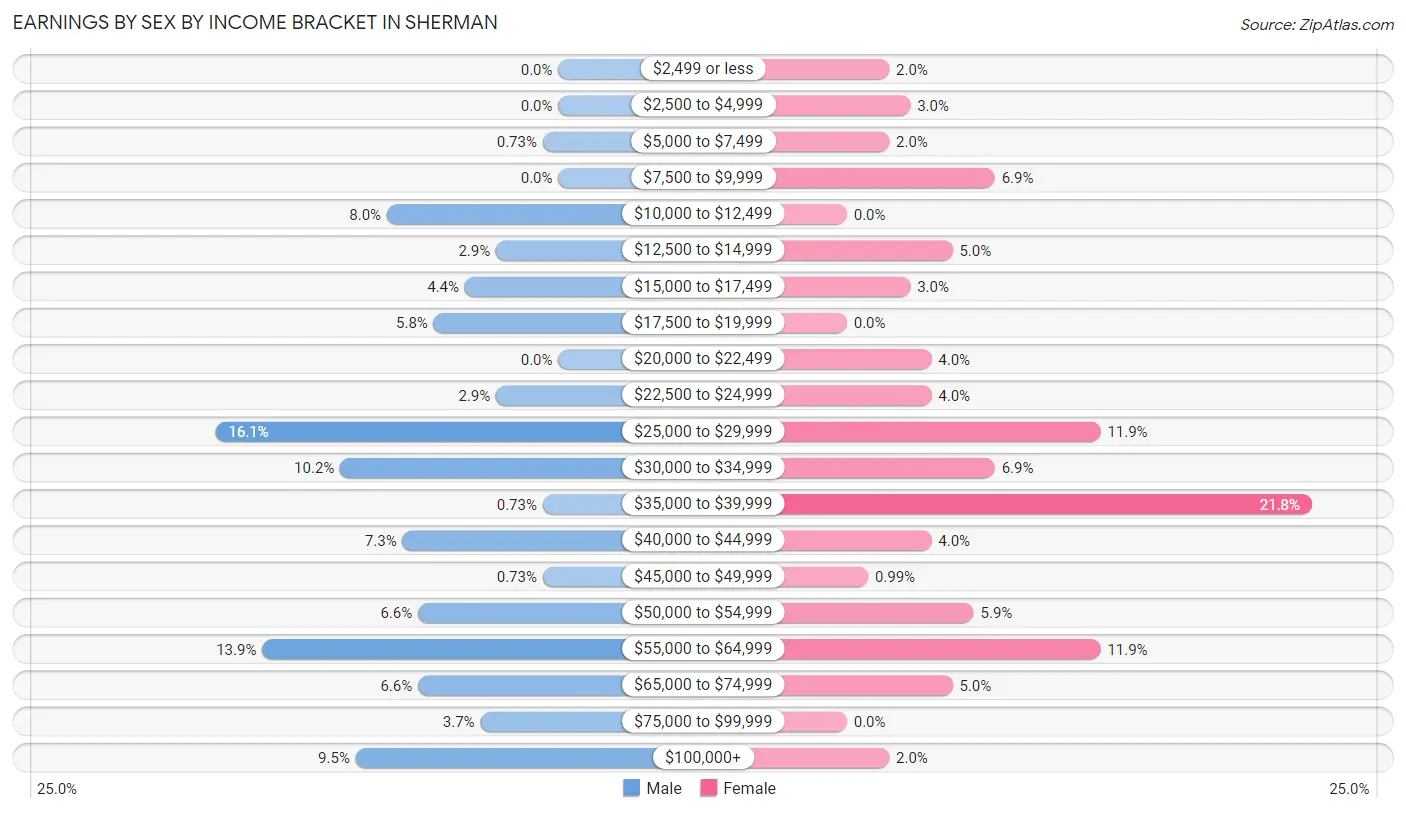
Earnings by Sex by Income Bracket in Sherman
The most common earnings brackets in Sherman are $25,000 to $29,999 for men (22 | 16.1%) and $35,000 to $39,999 for women (22 | 21.8%).
| Income | Male | Female |
| $2,499 or less | 0 (0.0%) | 2 (2.0%) |
| $2,500 to $4,999 | 0 (0.0%) | 3 (3.0%) |
| $5,000 to $7,499 | 1 (0.7%) | 2 (2.0%) |
| $7,500 to $9,999 | 0 (0.0%) | 7 (6.9%) |
| $10,000 to $12,499 | 11 (8.0%) | 0 (0.0%) |
| $12,500 to $14,999 | 4 (2.9%) | 5 (5.0%) |
| $15,000 to $17,499 | 6 (4.4%) | 3 (3.0%) |
| $17,500 to $19,999 | 8 (5.8%) | 0 (0.0%) |
| $20,000 to $22,499 | 0 (0.0%) | 4 (4.0%) |
| $22,500 to $24,999 | 4 (2.9%) | 4 (4.0%) |
| $25,000 to $29,999 | 22 (16.1%) | 12 (11.9%) |
| $30,000 to $34,999 | 14 (10.2%) | 7 (6.9%) |
| $35,000 to $39,999 | 1 (0.7%) | 22 (21.8%) |
| $40,000 to $44,999 | 10 (7.3%) | 4 (4.0%) |
| $45,000 to $49,999 | 1 (0.7%) | 1 (1.0%) |
| $50,000 to $54,999 | 9 (6.6%) | 6 (5.9%) |
| $55,000 to $64,999 | 19 (13.9%) | 12 (11.9%) |
| $65,000 to $74,999 | 9 (6.6%) | 5 (5.0%) |
| $75,000 to $99,999 | 5 (3.6%) | 0 (0.0%) |
| $100,000+ | 13 (9.5%) | 2 (2.0%) |
| Total | 137 (100.0%) | 101 (100.0%) |
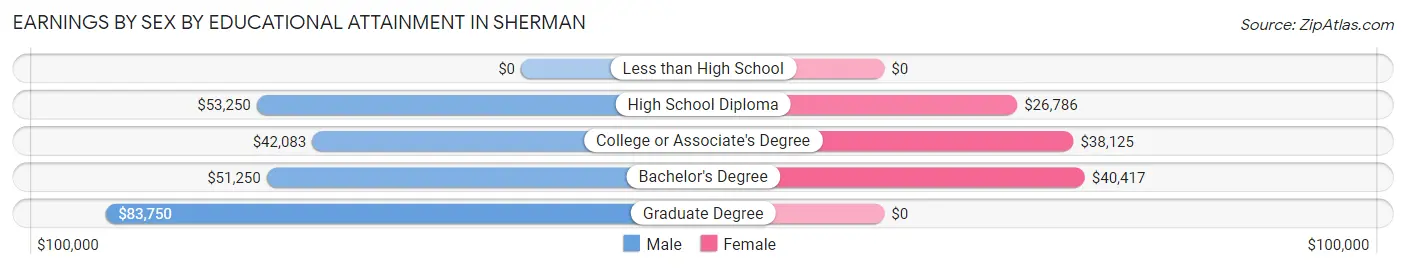
Earnings by Sex by Educational Attainment in Sherman
Average earnings in Sherman are $41,250 for men and $37,563 for women, a difference of 8.9%. Men with an educational attainment of graduate degree enjoy the highest average annual earnings of $83,750, while those with college or associate's degree education earn the least with $42,083. Women with an educational attainment of bachelor's degree earn the most with the average annual earnings of $40,417, while those with high school diploma education have the smallest earnings of $26,786.
| Educational Attainment | Male Income | Female Income |
| Less than High School | - | - |
| High School Diploma | $53,250 | $26,786 |
| College or Associate's Degree | $42,083 | $38,125 |
| Bachelor's Degree | $51,250 | $40,417 |
| Graduate Degree | $83,750 | $0 |
| Total | $41,250 | $37,563 |
Family Income in Sherman
Family Income Brackets in Sherman
According to the Sherman family income data, there are 25 families falling into the $50,000 to $74,999 income range, which is the most common income bracket and makes up 19.8% of all families. Conversely, the $15,000 to $24,999 income bracket is the least frequent group with only 3 families (2.4%) belonging to this category.
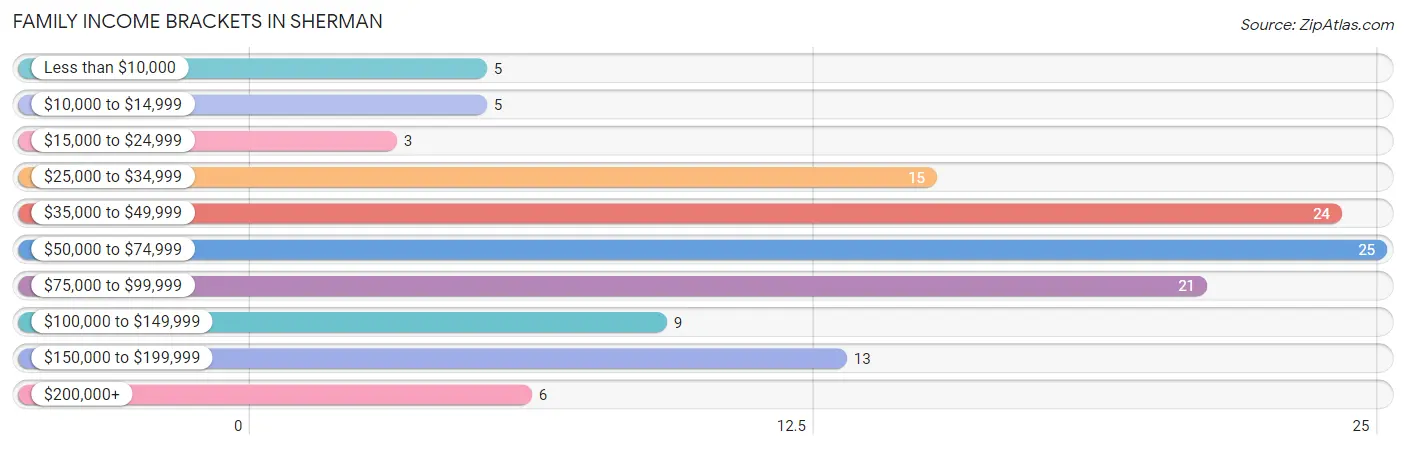
| Income Bracket | # Families | % Families |
| Less than $10,000 | 5 | 4.0% |
| $10,000 to $14,999 | 5 | 4.0% |
| $15,000 to $24,999 | 3 | 2.4% |
| $25,000 to $34,999 | 15 | 11.9% |
| $35,000 to $49,999 | 24 | 19.0% |
| $50,000 to $74,999 | 25 | 19.8% |
| $75,000 to $99,999 | 21 | 16.7% |
| $100,000 to $149,999 | 9 | 7.1% |
| $150,000 to $199,999 | 13 | 10.3% |
| $200,000+ | 6 | 4.8% |
Family Income by Famaliy Size in Sherman
4-person families (24 | 19.1%) account for the highest median family income in Sherman with $96,786 per family, while 4-person families (24 | 19.1%) have the highest median income of $24,196 per family member.
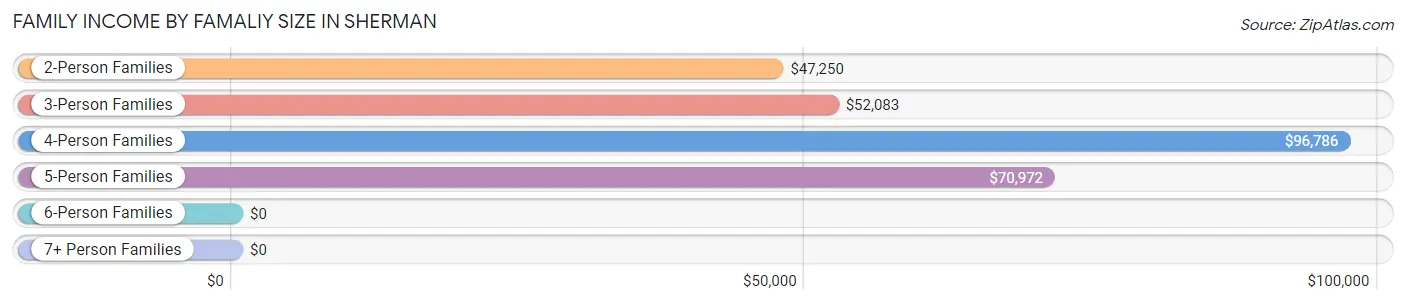
| Income Bracket | # Families | Median Income |
| 2-Person Families | 43 (34.1%) | $47,250 |
| 3-Person Families | 29 (23.0%) | $52,083 |
| 4-Person Families | 24 (19.1%) | $96,786 |
| 5-Person Families | 21 (16.7%) | $70,972 |
| 6-Person Families | 9 (7.1%) | $0 |
| 7+ Person Families | 0 (0.0%) | $0 |
| Total | 126 (100.0%) | $61,875 |
Family Income by Number of Earners in Sherman
The median family income in Sherman is $61,875, with families comprising 2 earners (35) having the highest median family income of $98,750, while families with no earners (31) have the lowest median family income of $29,688, accounting for 27.8% and 24.6% of families, respectively.
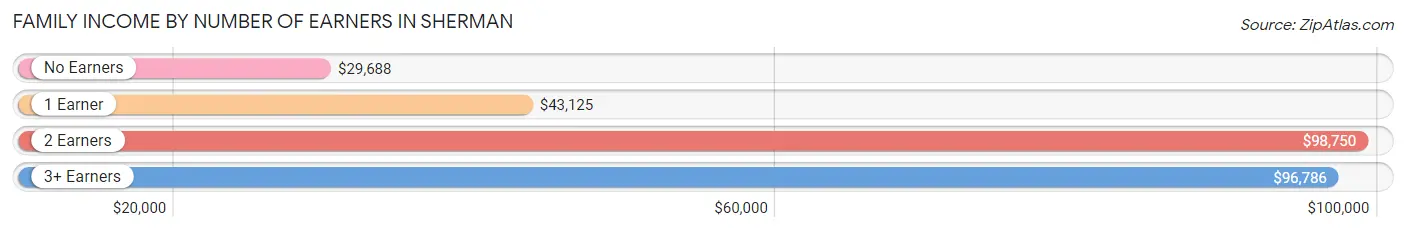
| Number of Earners | # Families | Median Income |
| No Earners | 31 (24.6%) | $29,688 |
| 1 Earner | 40 (31.8%) | $43,125 |
| 2 Earners | 35 (27.8%) | $98,750 |
| 3+ Earners | 20 (15.9%) | $96,786 |
| Total | 126 (100.0%) | $61,875 |
Household Income in Sherman
Household Income Brackets in Sherman
With 42 households falling in the category, the $35,000 to $49,999 income range is the most frequent in Sherman, accounting for 17.3% of all households. In contrast, only 6 households (2.5%) fall into the $200,000+ income bracket, making it the least populous group.
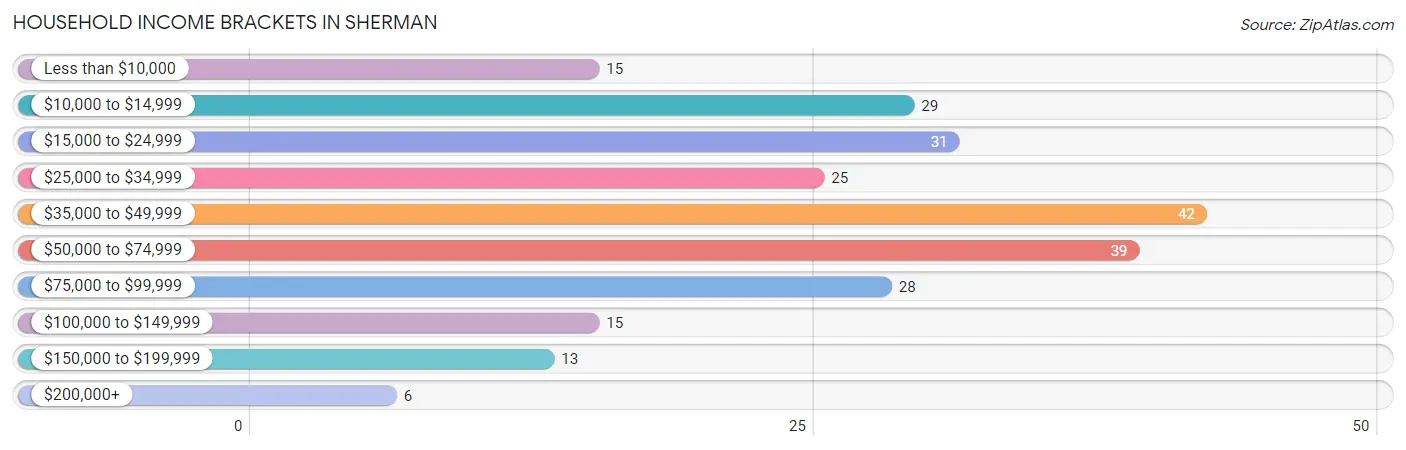
| Income Bracket | # Households | % Households |
| Less than $10,000 | 15 | 6.2% |
| $10,000 to $14,999 | 29 | 11.9% |
| $15,000 to $24,999 | 31 | 12.8% |
| $25,000 to $34,999 | 25 | 10.3% |
| $35,000 to $49,999 | 42 | 17.3% |
| $50,000 to $74,999 | 39 | 16.0% |
| $75,000 to $99,999 | 28 | 11.5% |
| $100,000 to $149,999 | 15 | 6.2% |
| $150,000 to $199,999 | 13 | 5.3% |
| $200,000+ | 6 | 2.5% |
Household Income by Householder Age in Sherman
The median household income in Sherman is $39,464, with the highest median household income of $59,821 found in the 45 to 64 years age bracket for the primary householder. A total of 89 households (36.6%) fall into this category. Meanwhile, the 15 to 24 years age bracket for the primary householder has the lowest median household income of $0, with 2 households (0.8%) in this group.
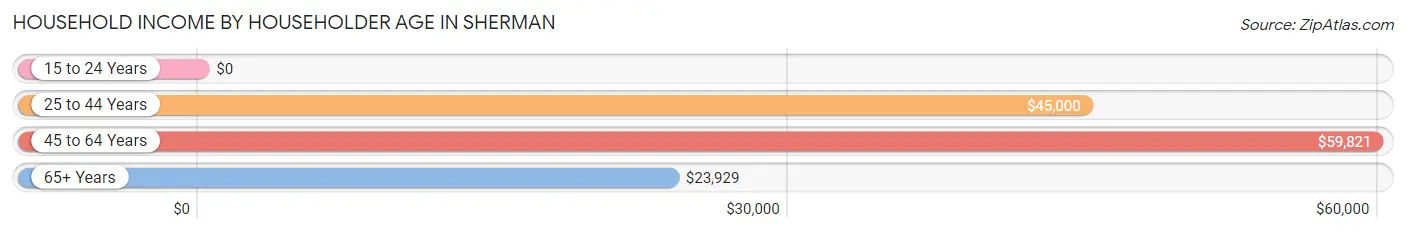
| Income Bracket | # Households | Median Income |
| 15 to 24 Years | 2 (0.8%) | $0 |
| 25 to 44 Years | 68 (28.0%) | $45,000 |
| 45 to 64 Years | 89 (36.6%) | $59,821 |
| 65+ Years | 84 (34.6%) | $23,929 |
| Total | 243 (100.0%) | $39,464 |
Poverty in Sherman
Income Below Poverty by Sex and Age in Sherman
With 18.8% poverty level for males and 26.1% for females among the residents of Sherman, 5 year old males and 18 to 24 year old females are the most vulnerable to poverty, with 5 males (83.3%) and 7 females (77.8%) in their respective age groups living below the poverty level.
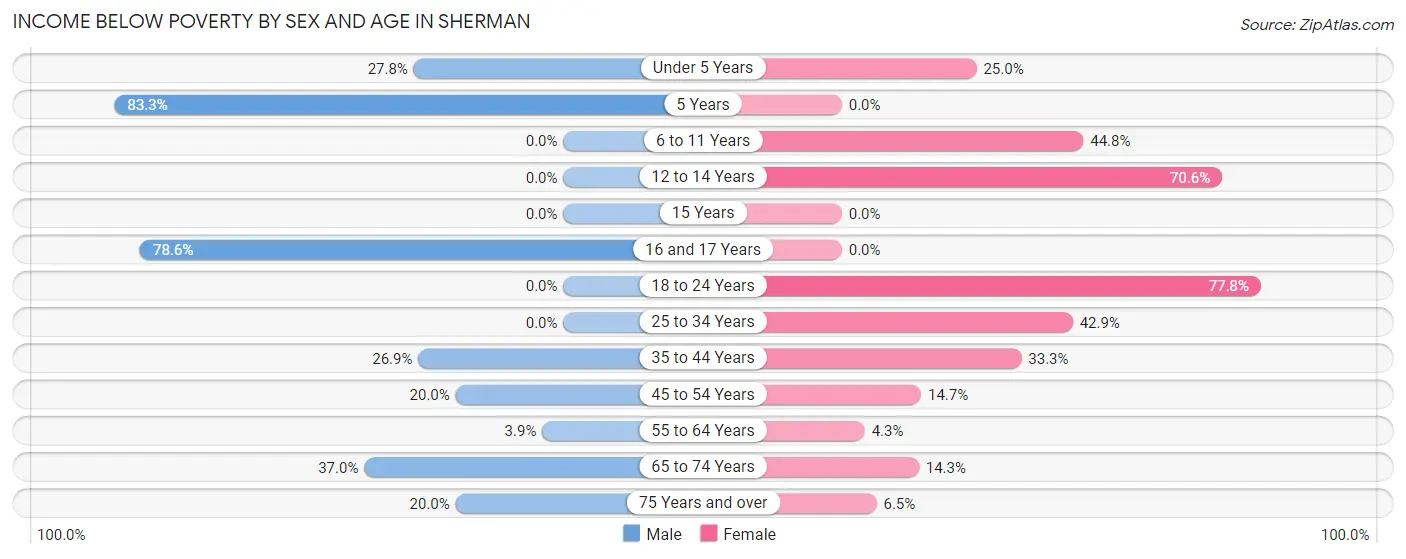
| Age Bracket | Male | Female |
| Under 5 Years | 5 (27.8%) | 5 (25.0%) |
| 5 Years | 5 (83.3%) | 0 (0.0%) |
| 6 to 11 Years | 0 (0.0%) | 13 (44.8%) |
| 12 to 14 Years | 0 (0.0%) | 12 (70.6%) |
| 15 Years | 0 (0.0%) | 0 (0.0%) |
| 16 and 17 Years | 11 (78.6%) | 0 (0.0%) |
| 18 to 24 Years | 0 (0.0%) | 7 (77.8%) |
| 25 to 34 Years | 0 (0.0%) | 12 (42.9%) |
| 35 to 44 Years | 7 (26.9%) | 12 (33.3%) |
| 45 to 54 Years | 3 (20.0%) | 5 (14.7%) |
| 55 to 64 Years | 2 (3.9%) | 2 (4.3%) |
| 65 to 74 Years | 17 (37.0%) | 3 (14.3%) |
| 75 Years and over | 4 (20.0%) | 2 (6.5%) |
| Total | 54 (18.8%) | 73 (26.1%) |
Income Above Poverty by Sex and Age in Sherman
According to the poverty statistics in Sherman, males aged 6 to 11 years and females aged 5 years are the age groups that are most secure financially, with 100.0% of males and 100.0% of females in these age groups living above the poverty line.
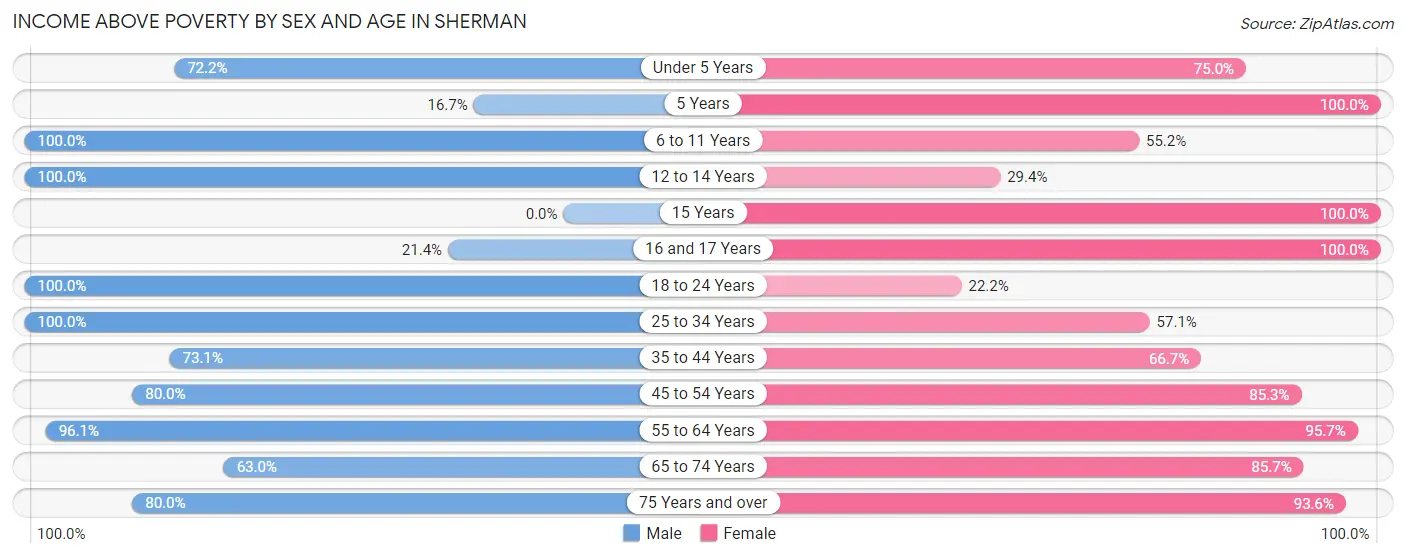
| Age Bracket | Male | Female |
| Under 5 Years | 13 (72.2%) | 15 (75.0%) |
| 5 Years | 1 (16.7%) | 2 (100.0%) |
| 6 to 11 Years | 27 (100.0%) | 16 (55.2%) |
| 12 to 14 Years | 12 (100.0%) | 5 (29.4%) |
| 15 Years | 0 (0.0%) | 1 (100.0%) |
| 16 and 17 Years | 3 (21.4%) | 5 (100.0%) |
| 18 to 24 Years | 15 (100.0%) | 2 (22.2%) |
| 25 to 34 Years | 37 (100.0%) | 16 (57.1%) |
| 35 to 44 Years | 19 (73.1%) | 24 (66.7%) |
| 45 to 54 Years | 12 (80.0%) | 29 (85.3%) |
| 55 to 64 Years | 49 (96.1%) | 45 (95.7%) |
| 65 to 74 Years | 29 (63.0%) | 18 (85.7%) |
| 75 Years and over | 16 (80.0%) | 29 (93.5%) |
| Total | 233 (81.2%) | 207 (73.9%) |
Income Below Poverty Among Married-Couple Families in Sherman
The poverty statistics for married-couple families in Sherman show that 10.2% or 9 of the total 88 families live below the poverty line. Families with 3 or 4 children have the highest poverty rate of 50.0%, comprising of 7 families. On the other hand, families with 1 or 2 children have the lowest poverty rate of 0.0%, which includes 0 families.
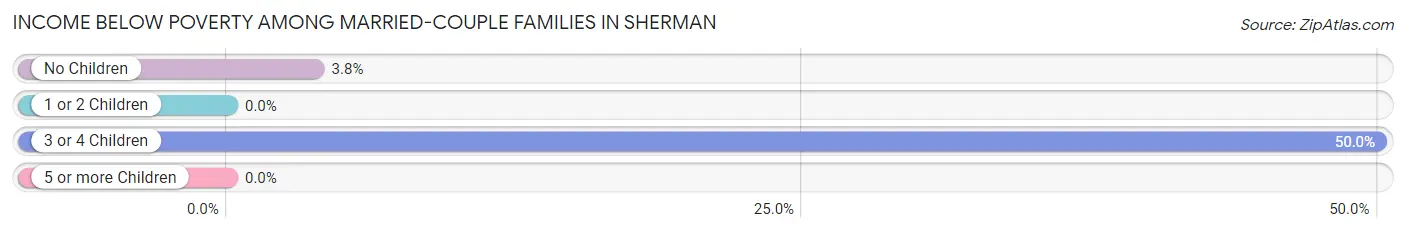
| Children | Above Poverty | Below Poverty |
| No Children | 51 (96.2%) | 2 (3.8%) |
| 1 or 2 Children | 21 (100.0%) | 0 (0.0%) |
| 3 or 4 Children | 7 (50.0%) | 7 (50.0%) |
| 5 or more Children | 0 (0.0%) | 0 (0.0%) |
| Total | 79 (89.8%) | 9 (10.2%) |
Income Below Poverty Among Single-Parent Households in Sherman
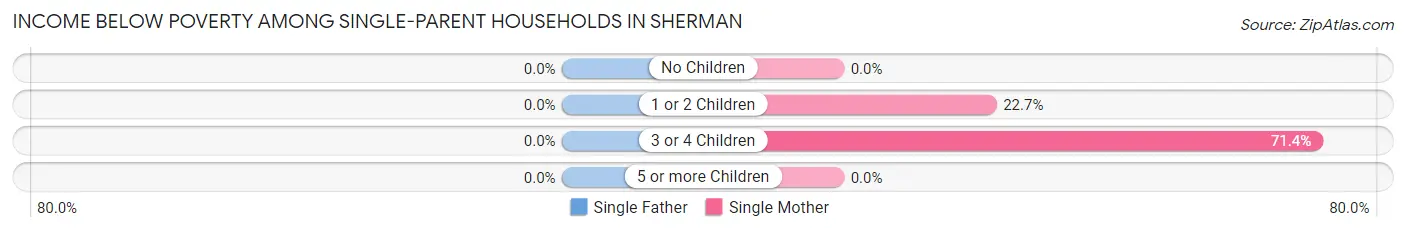
| Children | Single Father | Single Mother |
| No Children | 0 (0.0%) | 0 (0.0%) |
| 1 or 2 Children | 0 (0.0%) | 5 (22.7%) |
| 3 or 4 Children | 0 (0.0%) | 5 (71.4%) |
| 5 or more Children | 0 (0.0%) | 0 (0.0%) |
| Total | 0 (0.0%) | 10 (29.4%) |
Income Below Poverty Among Married-Couple vs Single-Parent Households in Sherman
The poverty data for Sherman shows that 9 of the married-couple family households (10.2%) and 10 of the single-parent households (26.3%) are living below the poverty level. Within the married-couple family households, those with 3 or 4 children have the highest poverty rate, with 7 households (50.0%) falling below the poverty line. Among the single-parent households, those with 3 or 4 children have the highest poverty rate, with 5 household (71.4%) living below poverty.
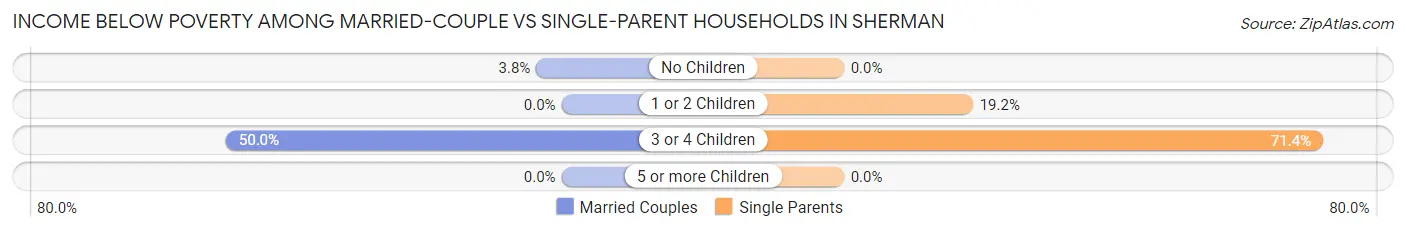
| Children | Married-Couple Families | Single-Parent Households |
| No Children | 2 (3.8%) | 0 (0.0%) |
| 1 or 2 Children | 0 (0.0%) | 5 (19.2%) |
| 3 or 4 Children | 7 (50.0%) | 5 (71.4%) |
| 5 or more Children | 0 (0.0%) | 0 (0.0%) |
| Total | 9 (10.2%) | 10 (26.3%) |
Race in Sherman
The most populous races in Sherman are White / Caucasian (526 | 92.8%), Some other Race (16 | 2.8%), and Two or more Races (14 | 2.5%).
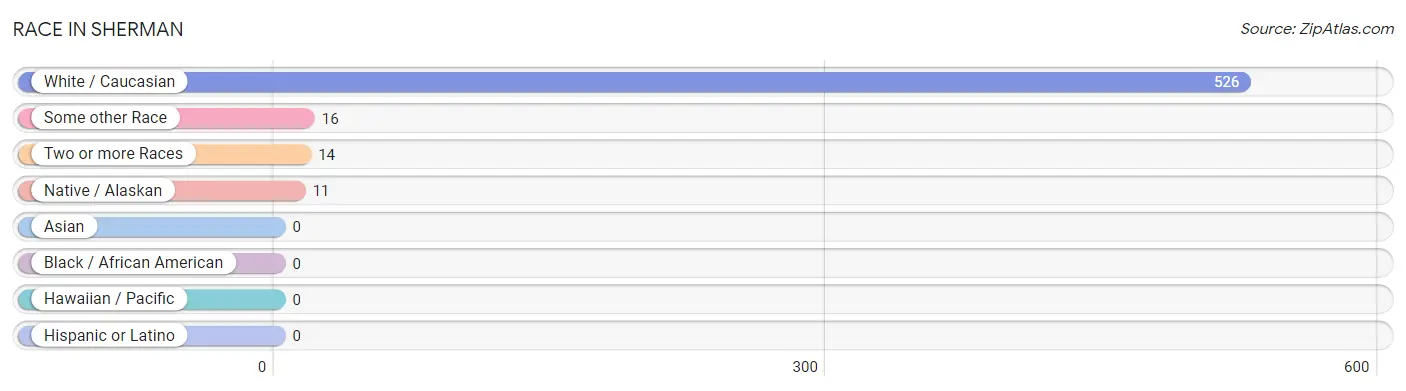
| Race | # Population | % Population |
| Asian | 0 | 0.0% |
| Black / African American | 0 | 0.0% |
| Hawaiian / Pacific | 0 | 0.0% |
| Hispanic or Latino | 0 | 0.0% |
| Native / Alaskan | 11 | 1.9% |
| White / Caucasian | 526 | 92.8% |
| Two or more Races | 14 | 2.5% |
| Some other Race | 16 | 2.8% |
| Total | 567 | 100.0% |
Ancestry in Sherman
The most populous ancestries reported in Sherman are English (166 | 29.3%), German (101 | 17.8%), Swedish (78 | 13.8%), Irish (69 | 12.2%), and Dutch (37 | 6.5%), together accounting for 79.6% of all Sherman residents.
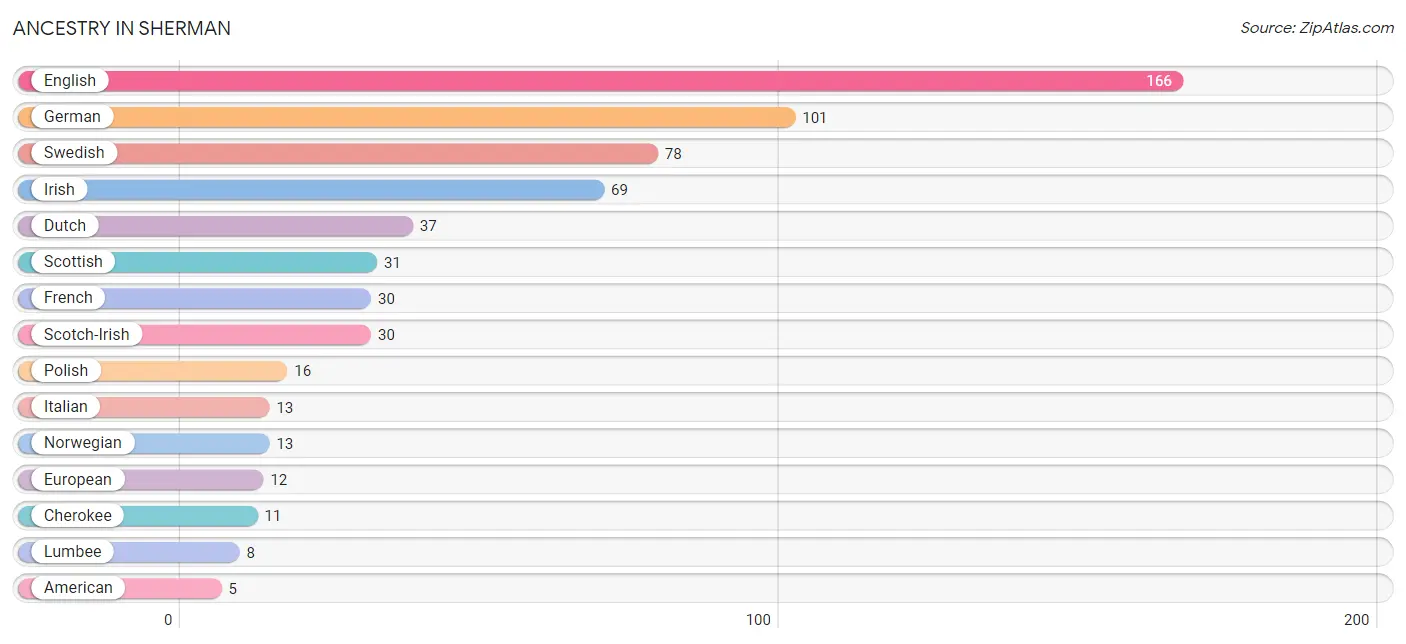
| Ancestry | # Population | % Population |
| American | 5 | 0.9% |
| Blackfeet | 2 | 0.4% |
| Cherokee | 11 | 1.9% |
| Dutch | 37 | 6.5% |
| English | 166 | 29.3% |
| European | 12 | 2.1% |
| French | 30 | 5.3% |
| German | 101 | 17.8% |
| Irish | 69 | 12.2% |
| Iroquois | 2 | 0.4% |
| Italian | 13 | 2.3% |
| Laotian | 4 | 0.7% |
| Latvian | 2 | 0.4% |
| Lithuanian | 3 | 0.5% |
| Lumbee | 8 | 1.4% |
| Norwegian | 13 | 2.3% |
| Polish | 16 | 2.8% |
| Scotch-Irish | 30 | 5.3% |
| Scottish | 31 | 5.5% |
| Swedish | 78 | 13.8% | View All 20 Rows |
Immigrants in Sherman

| Immigration Origin | # Population | % Population | View All 0 Rows |
Sex and Age in Sherman
Sex and Age in Sherman
The most populous age groups in Sherman are 60 to 64 Years (30 | 10.4%) for men and 35 to 39 Years (34 | 12.1%) for women.
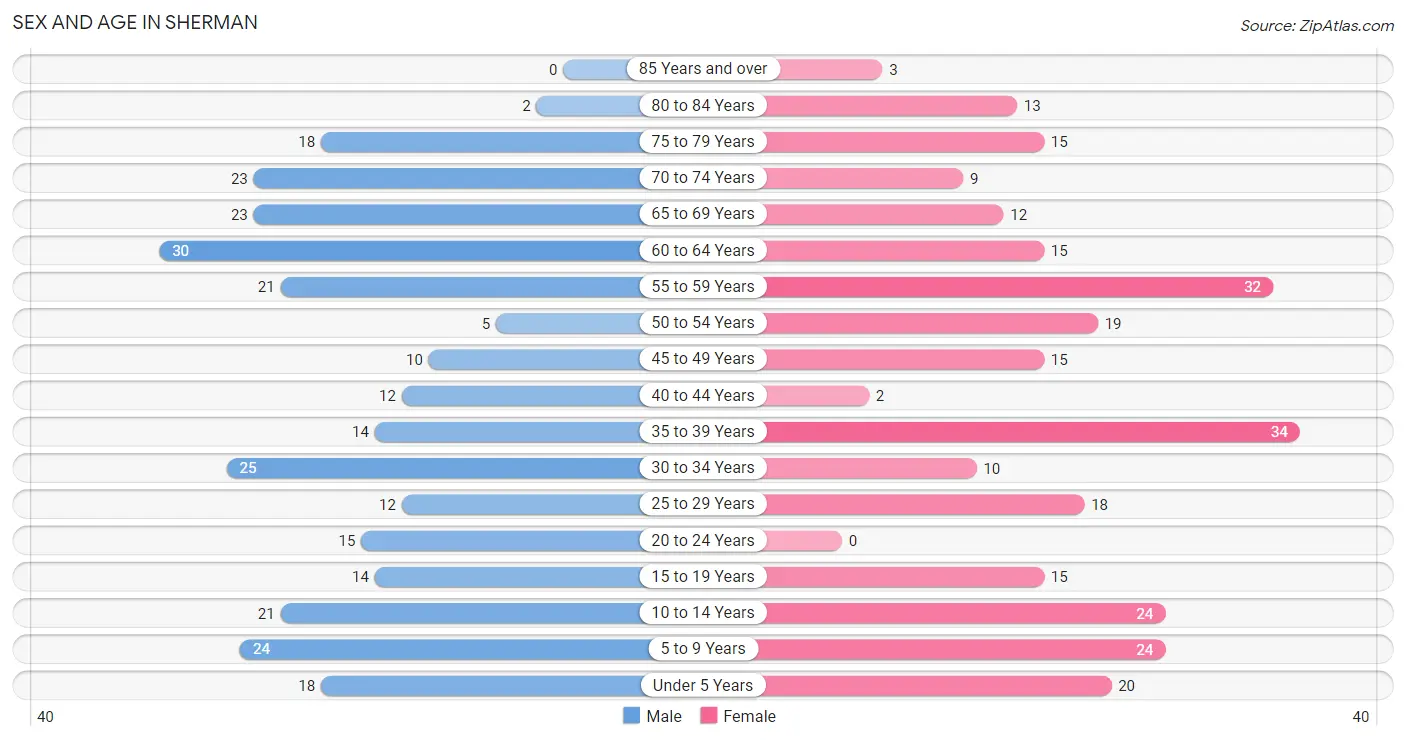
| Age Bracket | Male | Female |
| Under 5 Years | 18 (6.3%) | 20 (7.1%) |
| 5 to 9 Years | 24 (8.4%) | 24 (8.6%) |
| 10 to 14 Years | 21 (7.3%) | 24 (8.6%) |
| 15 to 19 Years | 14 (4.9%) | 15 (5.4%) |
| 20 to 24 Years | 15 (5.2%) | 0 (0.0%) |
| 25 to 29 Years | 12 (4.2%) | 18 (6.4%) |
| 30 to 34 Years | 25 (8.7%) | 10 (3.6%) |
| 35 to 39 Years | 14 (4.9%) | 34 (12.1%) |
| 40 to 44 Years | 12 (4.2%) | 2 (0.7%) |
| 45 to 49 Years | 10 (3.5%) | 15 (5.4%) |
| 50 to 54 Years | 5 (1.7%) | 19 (6.8%) |
| 55 to 59 Years | 21 (7.3%) | 32 (11.4%) |
| 60 to 64 Years | 30 (10.4%) | 15 (5.4%) |
| 65 to 69 Years | 23 (8.0%) | 12 (4.3%) |
| 70 to 74 Years | 23 (8.0%) | 9 (3.2%) |
| 75 to 79 Years | 18 (6.3%) | 15 (5.4%) |
| 80 to 84 Years | 2 (0.7%) | 13 (4.6%) |
| 85 Years and over | 0 (0.0%) | 3 (1.1%) |
| Total | 287 (100.0%) | 280 (100.0%) |
Families and Households in Sherman
Median Family Size in Sherman
The median family size in Sherman is 3.42 persons per family, with married-couple families (88 | 69.8%) accounting for the largest median family size of 3.45 persons per family. On the other hand, single male/father families (4 | 3.2%) represent the smallest median family size with 2.75 persons per family.
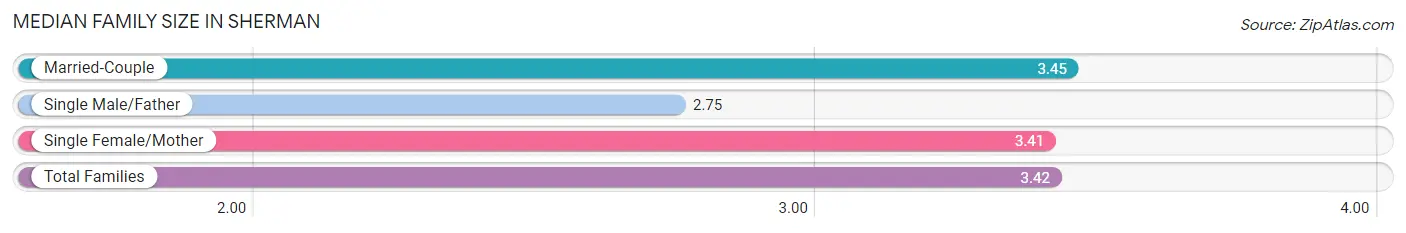
| Family Type | # Families | Family Size |
| Married-Couple | 88 (69.8%) | 3.45 |
| Single Male/Father | 4 (3.2%) | 2.75 |
| Single Female/Mother | 34 (27.0%) | 3.41 |
| Total Families | 126 (100.0%) | 3.42 |
Median Household Size in Sherman
The median household size in Sherman is 2.33 persons per household, with single female/mother households (34 | 14.0%) accounting for the largest median household size of 3.82 persons per household. non-family households (117 | 48.1%) represent the smallest median household size with 1.04 persons per household.
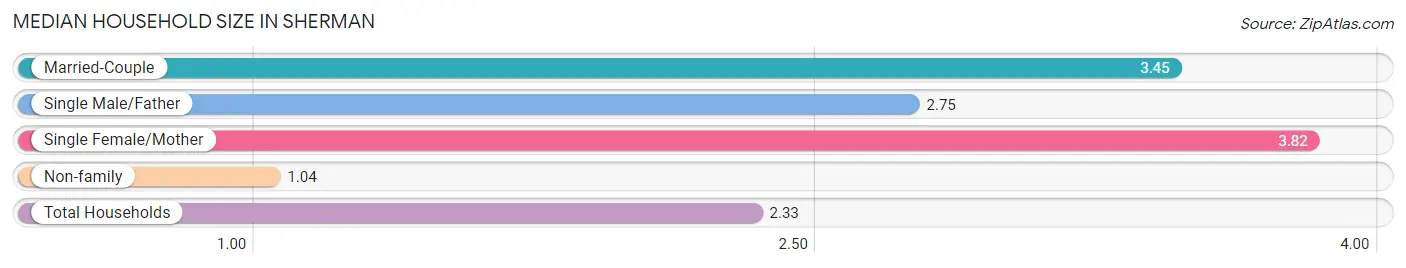
| Household Type | # Households | Household Size |
| Married-Couple | 88 (36.2%) | 3.45 |
| Single Male/Father | 4 (1.7%) | 2.75 |
| Single Female/Mother | 34 (14.0%) | 3.82 |
| Non-family | 117 (48.1%) | 1.04 |
| Total Households | 243 (100.0%) | 2.33 |
Household Size by Marriage Status in Sherman
Out of a total of 243 households in Sherman, 126 (51.8%) are family households, while 117 (48.1%) are nonfamily households. The most numerous type of family households are 2-person households, comprising 43, and the most common type of nonfamily households are 1-person households, comprising 112.
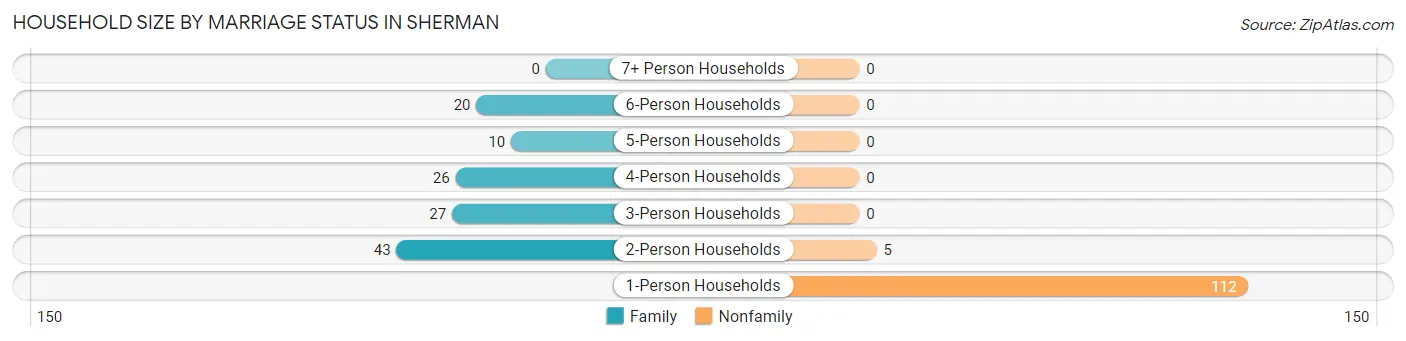
| Household Size | Family Households | Nonfamily Households |
| 1-Person Households | - | 112 (46.1%) |
| 2-Person Households | 43 (17.7%) | 5 (2.1%) |
| 3-Person Households | 27 (11.1%) | 0 (0.0%) |
| 4-Person Households | 26 (10.7%) | 0 (0.0%) |
| 5-Person Households | 10 (4.1%) | 0 (0.0%) |
| 6-Person Households | 20 (8.2%) | 0 (0.0%) |
| 7+ Person Households | 0 (0.0%) | 0 (0.0%) |
| Total | 126 (51.8%) | 117 (48.1%) |
Female Fertility in Sherman
Fertility by Age in Sherman
| Age Bracket | Women with Births | Births / 1,000 Women |
| 15 to 19 years | 0 (0.0%) | 0.0 |
| 20 to 34 years | 0 (0.0%) | 0.0 |
| 35 to 50 years | 0 (0.0%) | 0.0 |
| Total | 0 (0.0%) | 0.0 |
Fertility by Age by Marriage Status in Sherman
| Age Bracket | Married | Unmarried |
| 15 to 19 years | 0 (0.0%) | 0 (0.0%) |
| 20 to 34 years | 0 (0.0%) | 0 (0.0%) |
| 35 to 50 years | 0 (0.0%) | 0 (0.0%) |
| Total | 0 (0.0%) | 0 (0.0%) |
Fertility by Education in Sherman
| Educational Attainment | Women with Births | Births / 1,000 Women |
| Less than High School | 0 (0.0%) | 0.0 |
| High School Diploma | 0 (0.0%) | 0.0 |
| College or Associate's Degree | 0 (0.0%) | 0.0 |
| Bachelor's Degree | 0 (0.0%) | 0.0 |
| Graduate Degree | 0 (0.0%) | 0.0 |
| Total | 0 (0.0%) | 0.0 |
Fertility by Education by Marriage Status in Sherman
| Educational Attainment | Married | Unmarried |
| Less than High School | 0 (0.0%) | 0 (0.0%) |
| High School Diploma | 0 (0.0%) | 0 (0.0%) |
| College or Associate's Degree | 0 (0.0%) | 0 (0.0%) |
| Bachelor's Degree | 0 (0.0%) | 0 (0.0%) |
| Graduate Degree | 0 (0.0%) | 0 (0.0%) |
| Total | 0 (0.0%) | 0 (0.0%) |
Employment Characteristics in Sherman
Employment by Class of Employer in Sherman
Among the 225 employed individuals in Sherman, private company employees (157 | 69.8%), local government employees (25 | 11.1%), and self-employed (not incorporated) (12 | 5.3%) make up the most common classes of employment.
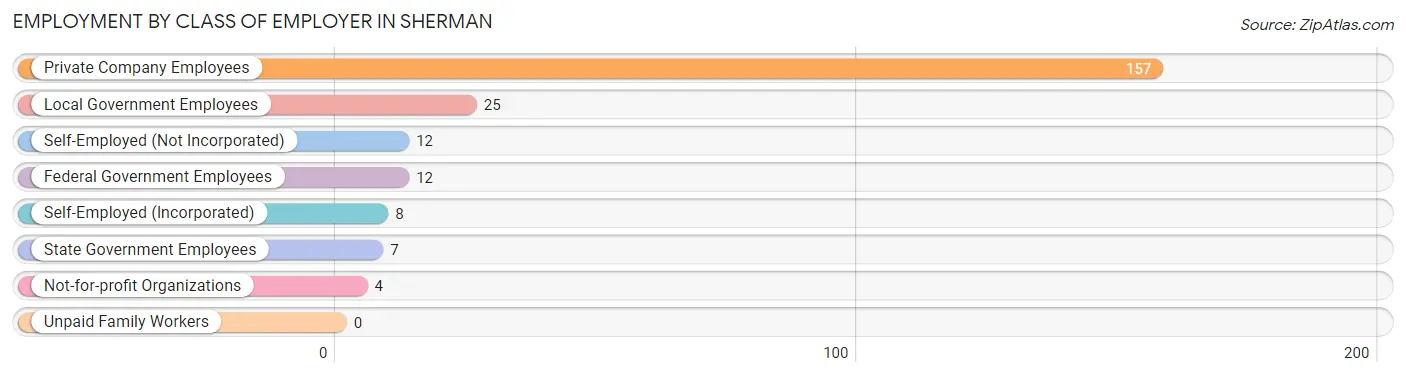
| Employer Class | # Employees | % Employees |
| Private Company Employees | 157 | 69.8% |
| Self-Employed (Incorporated) | 8 | 3.6% |
| Self-Employed (Not Incorporated) | 12 | 5.3% |
| Not-for-profit Organizations | 4 | 1.8% |
| Local Government Employees | 25 | 11.1% |
| State Government Employees | 7 | 3.1% |
| Federal Government Employees | 12 | 5.3% |
| Unpaid Family Workers | 0 | 0.0% |
| Total | 225 | 100.0% |
Employment Status by Age in Sherman
According to the labor force statistics for Sherman, out of the total population over 16 years of age (435), 53.3% or 232 individuals are in the labor force, with 3.0% or 7 of them unemployed. The age group with the highest labor force participation rate is 20 to 24 years, with 100.0% or 15 individuals in the labor force. Within the labor force, the 30 to 34 years age range has the highest percentage of unemployed individuals, with 16.7% or 5 of them being unemployed.
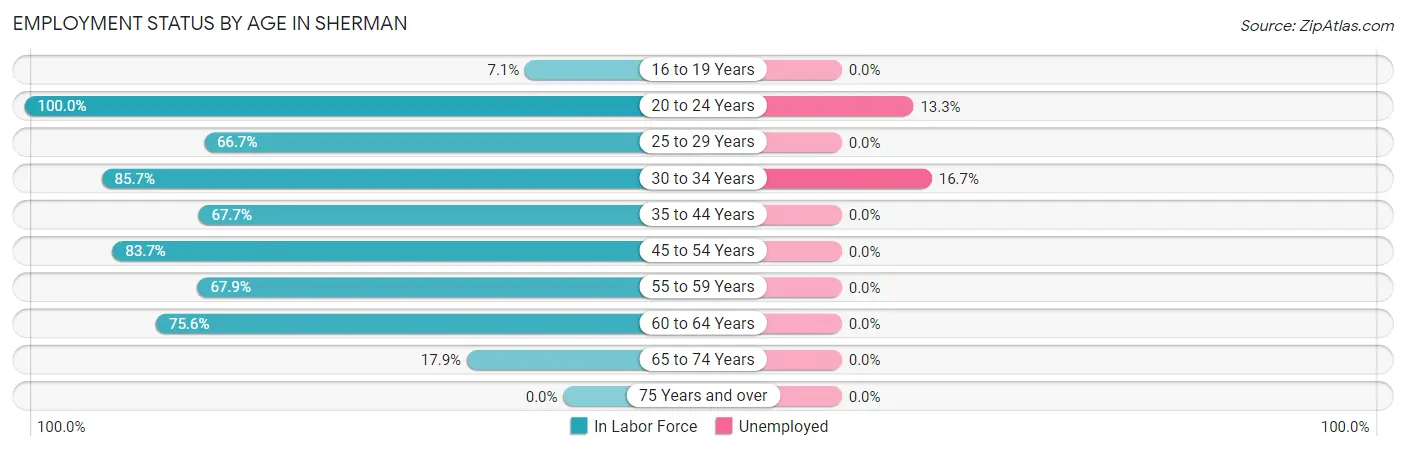
| Age Bracket | In Labor Force | Unemployed |
| 16 to 19 Years | 2 (7.1%) | 0 (0.0%) |
| 20 to 24 Years | 15 (100.0%) | 2 (13.3%) |
| 25 to 29 Years | 20 (66.7%) | 0 (0.0%) |
| 30 to 34 Years | 30 (85.7%) | 5 (16.7%) |
| 35 to 44 Years | 42 (67.7%) | 0 (0.0%) |
| 45 to 54 Years | 41 (83.7%) | 0 (0.0%) |
| 55 to 59 Years | 36 (67.9%) | 0 (0.0%) |
| 60 to 64 Years | 34 (75.6%) | 0 (0.0%) |
| 65 to 74 Years | 12 (17.9%) | 0 (0.0%) |
| 75 Years and over | 0 (0.0%) | 0 (0.0%) |
| Total | 232 (53.3%) | 7 (3.0%) |
Employment Status by Educational Attainment in Sherman
According to labor force statistics for Sherman, 74.1% of individuals (203) out of the total population between 25 and 64 years of age (274) are in the labor force, with 2.5% or 5 of them being unemployed. The group with the highest labor force participation rate are those with the educational attainment of college / associate degree, with 83.3% or 90 individuals in the labor force. Within the labor force, individuals with college / associate degree education have the highest percentage of unemployment, with 5.6% or 5 of them being unemployed.
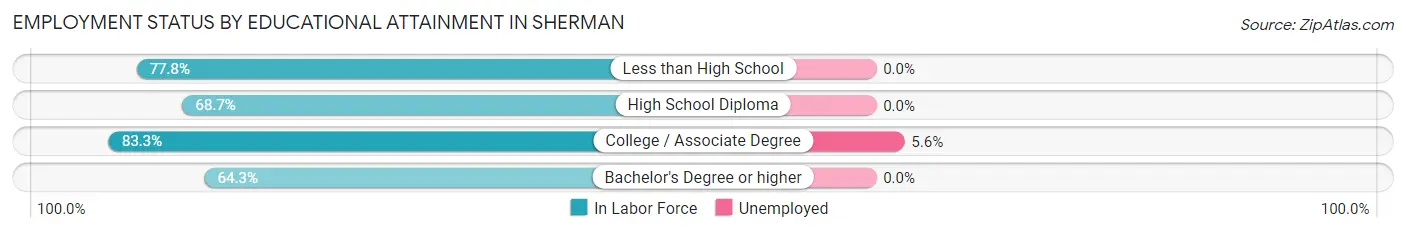
| Educational Attainment | In Labor Force | Unemployed |
| Less than High School | 7 (77.8%) | 0 (0.0%) |
| High School Diploma | 79 (68.7%) | 0 (0.0%) |
| College / Associate Degree | 90 (83.3%) | 6 (5.6%) |
| Bachelor's Degree or higher | 27 (64.3%) | 0 (0.0%) |
| Total | 203 (74.1%) | 7 (2.5%) |
Employment Occupations by Sex in Sherman
Management, Business, Science and Arts Occupations
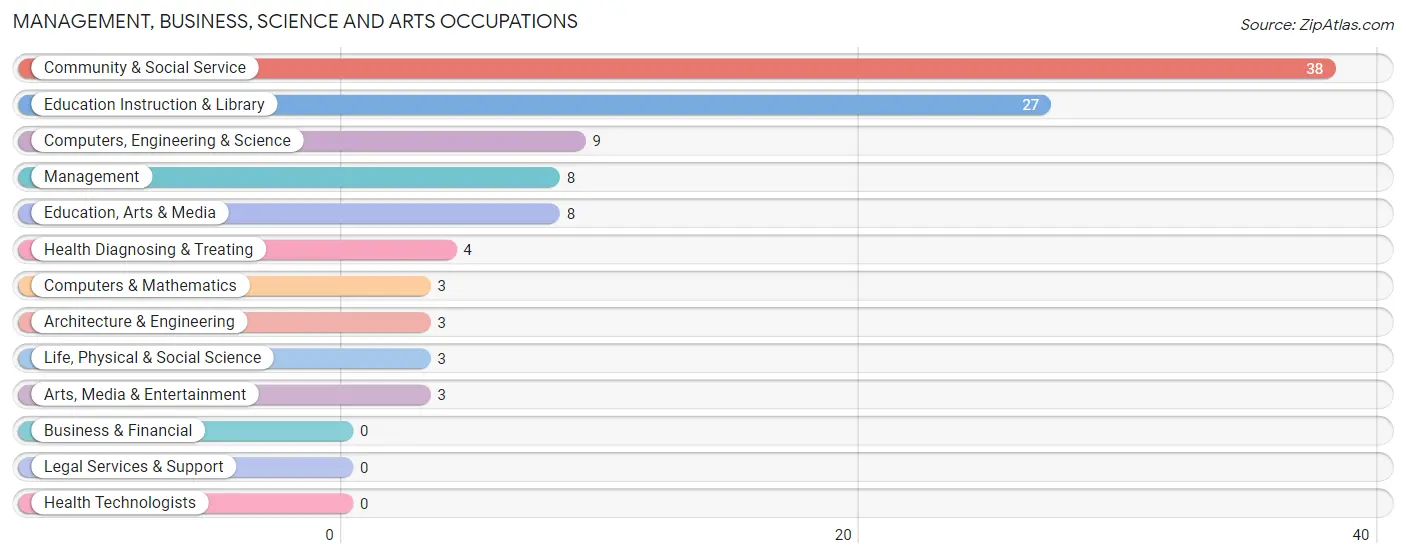
The most common Management, Business, Science and Arts occupations in Sherman are Community & Social Service (38 | 16.9%), Education Instruction & Library (27 | 12.0%), Computers, Engineering & Science (9 | 4.0%), Management (8 | 3.6%), and Education, Arts & Media (8 | 3.6%).
Management, Business, Science and Arts Occupations by Sex
Within the Management, Business, Science and Arts occupations in Sherman, the most male-oriented occupations are Architecture & Engineering (100.0%), Life, Physical & Social Science (100.0%), and Arts, Media & Entertainment (100.0%), while the most female-oriented occupations are Management (100.0%), Computers & Mathematics (100.0%), and Education Instruction & Library (92.6%).
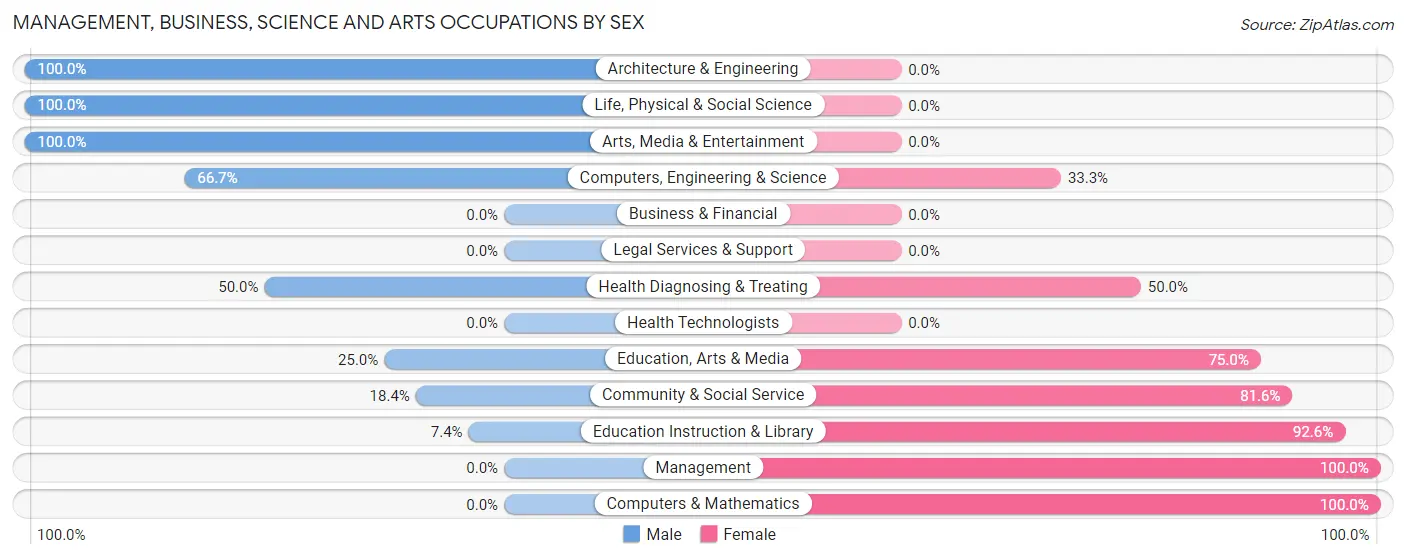
| Occupation | Male | Female |
| Management | 0 (0.0%) | 8 (100.0%) |
| Business & Financial | 0 (0.0%) | 0 (0.0%) |
| Computers, Engineering & Science | 6 (66.7%) | 3 (33.3%) |
| Computers & Mathematics | 0 (0.0%) | 3 (100.0%) |
| Architecture & Engineering | 3 (100.0%) | 0 (0.0%) |
| Life, Physical & Social Science | 3 (100.0%) | 0 (0.0%) |
| Community & Social Service | 7 (18.4%) | 31 (81.6%) |
| Education, Arts & Media | 2 (25.0%) | 6 (75.0%) |
| Legal Services & Support | 0 (0.0%) | 0 (0.0%) |
| Education Instruction & Library | 2 (7.4%) | 25 (92.6%) |
| Arts, Media & Entertainment | 3 (100.0%) | 0 (0.0%) |
| Health Diagnosing & Treating | 2 (50.0%) | 2 (50.0%) |
| Health Technologists | 0 (0.0%) | 0 (0.0%) |
| Total (Category) | 15 (25.4%) | 44 (74.6%) |
| Total (Overall) | 129 (57.3%) | 96 (42.7%) |
Services Occupations
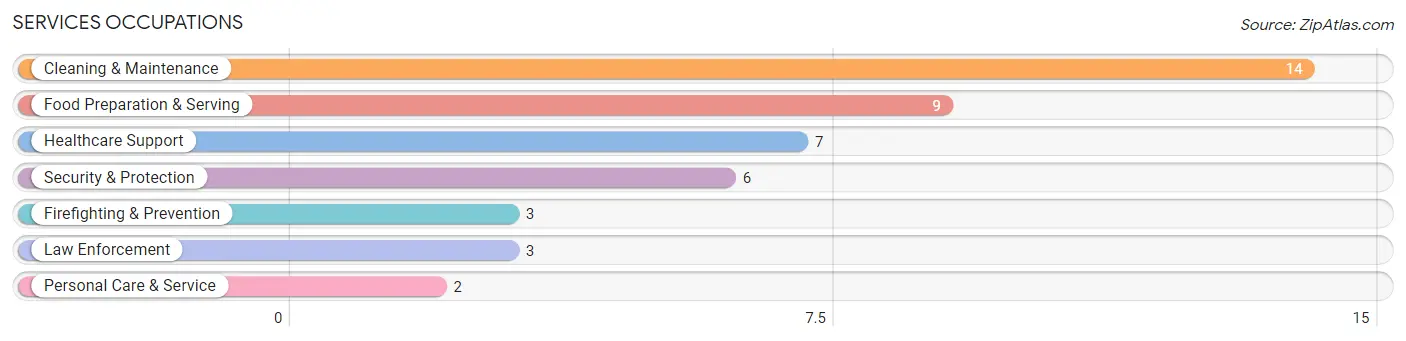
The most common Services occupations in Sherman are Cleaning & Maintenance (14 | 6.2%), Food Preparation & Serving (9 | 4.0%), Healthcare Support (7 | 3.1%), Security & Protection (6 | 2.7%), and Firefighting & Prevention (3 | 1.3%).
Services Occupations by Sex
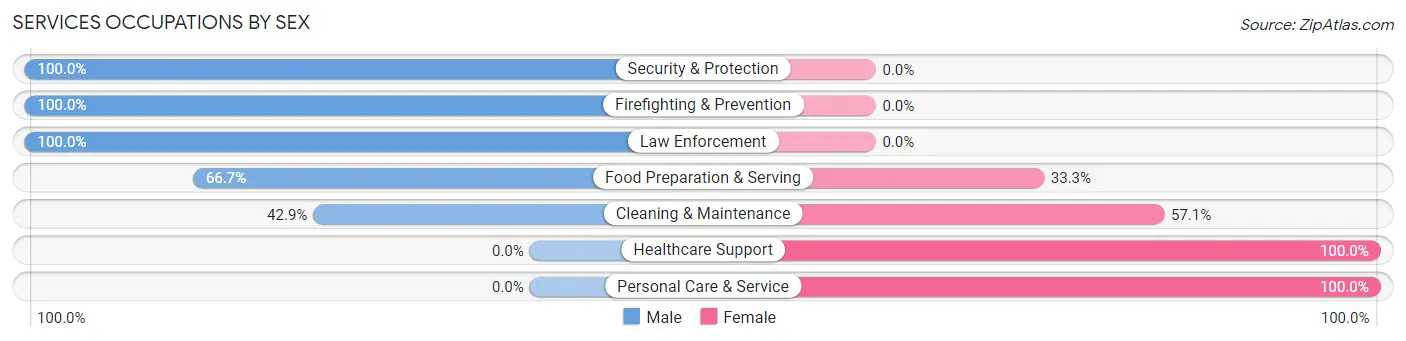
Within the Services occupations in Sherman, the most male-oriented occupations are Security & Protection (100.0%), Firefighting & Prevention (100.0%), and Law Enforcement (100.0%), while the most female-oriented occupations are Healthcare Support (100.0%), Personal Care & Service (100.0%), and Cleaning & Maintenance (57.1%).
| Occupation | Male | Female |
| Healthcare Support | 0 (0.0%) | 7 (100.0%) |
| Security & Protection | 6 (100.0%) | 0 (0.0%) |
| Firefighting & Prevention | 3 (100.0%) | 0 (0.0%) |
| Law Enforcement | 3 (100.0%) | 0 (0.0%) |
| Food Preparation & Serving | 6 (66.7%) | 3 (33.3%) |
| Cleaning & Maintenance | 6 (42.9%) | 8 (57.1%) |
| Personal Care & Service | 0 (0.0%) | 2 (100.0%) |
| Total (Category) | 18 (47.4%) | 20 (52.6%) |
| Total (Overall) | 129 (57.3%) | 96 (42.7%) |
Sales and Office Occupations
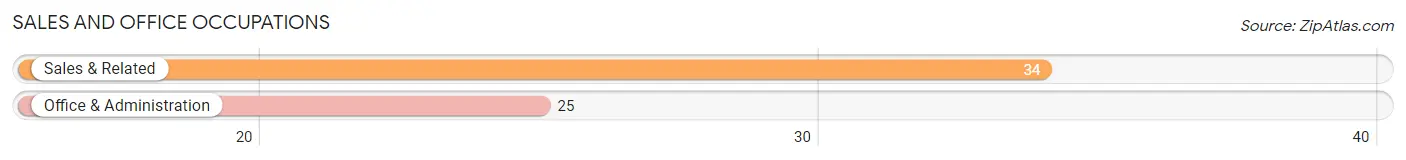
The most common Sales and Office occupations in Sherman are Sales & Related (34 | 15.1%), and Office & Administration (25 | 11.1%).
Sales and Office Occupations by Sex
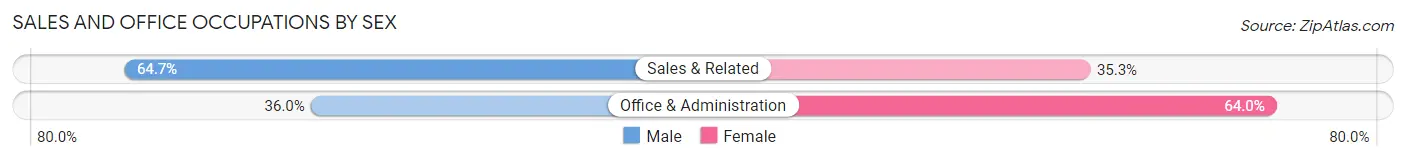
| Occupation | Male | Female |
| Sales & Related | 22 (64.7%) | 12 (35.3%) |
| Office & Administration | 9 (36.0%) | 16 (64.0%) |
| Total (Category) | 31 (52.5%) | 28 (47.5%) |
| Total (Overall) | 129 (57.3%) | 96 (42.7%) |
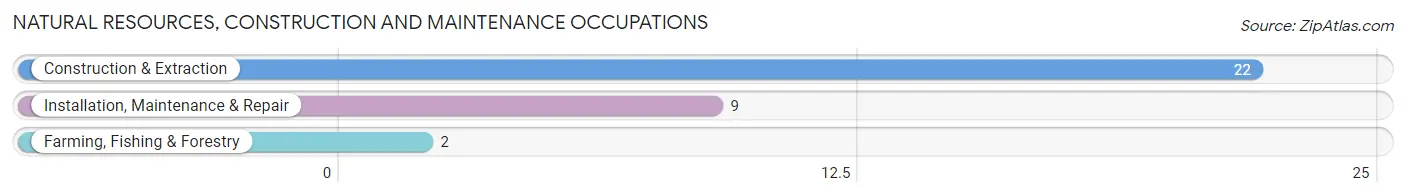
Natural Resources, Construction and Maintenance Occupations
The most common Natural Resources, Construction and Maintenance occupations in Sherman are Construction & Extraction (22 | 9.8%), Installation, Maintenance & Repair (9 | 4.0%), and Farming, Fishing & Forestry (2 | 0.9%).
Natural Resources, Construction and Maintenance Occupations by Sex
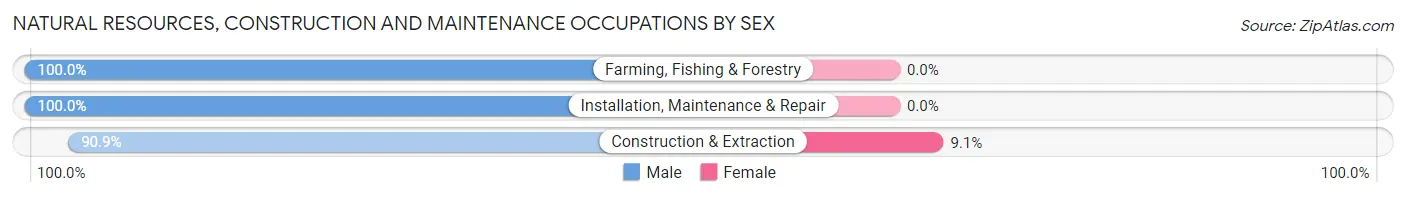
| Occupation | Male | Female |
| Farming, Fishing & Forestry | 2 (100.0%) | 0 (0.0%) |
| Construction & Extraction | 20 (90.9%) | 2 (9.1%) |
| Installation, Maintenance & Repair | 9 (100.0%) | 0 (0.0%) |
| Total (Category) | 31 (93.9%) | 2 (6.1%) |
| Total (Overall) | 129 (57.3%) | 96 (42.7%) |
Production, Transportation and Moving Occupations
The most common Production, Transportation and Moving occupations in Sherman are Production (24 | 10.7%), Transportation (8 | 3.6%), and Material Moving (4 | 1.8%).
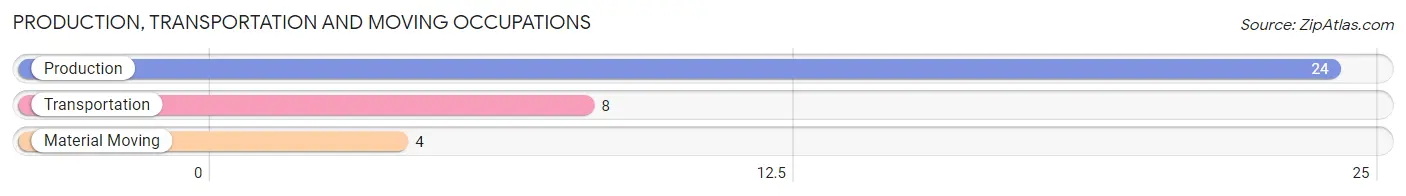
Production, Transportation and Moving Occupations by Sex
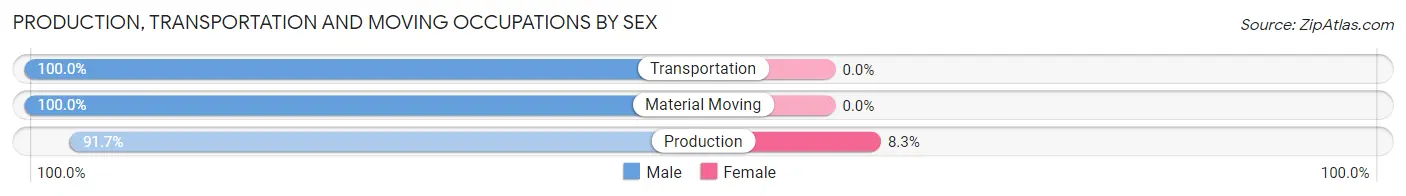
| Occupation | Male | Female |
| Production | 22 (91.7%) | 2 (8.3%) |
| Transportation | 8 (100.0%) | 0 (0.0%) |
| Material Moving | 4 (100.0%) | 0 (0.0%) |
| Total (Category) | 34 (94.4%) | 2 (5.6%) |
| Total (Overall) | 129 (57.3%) | 96 (42.7%) |
Employment Industries by Sex in Sherman
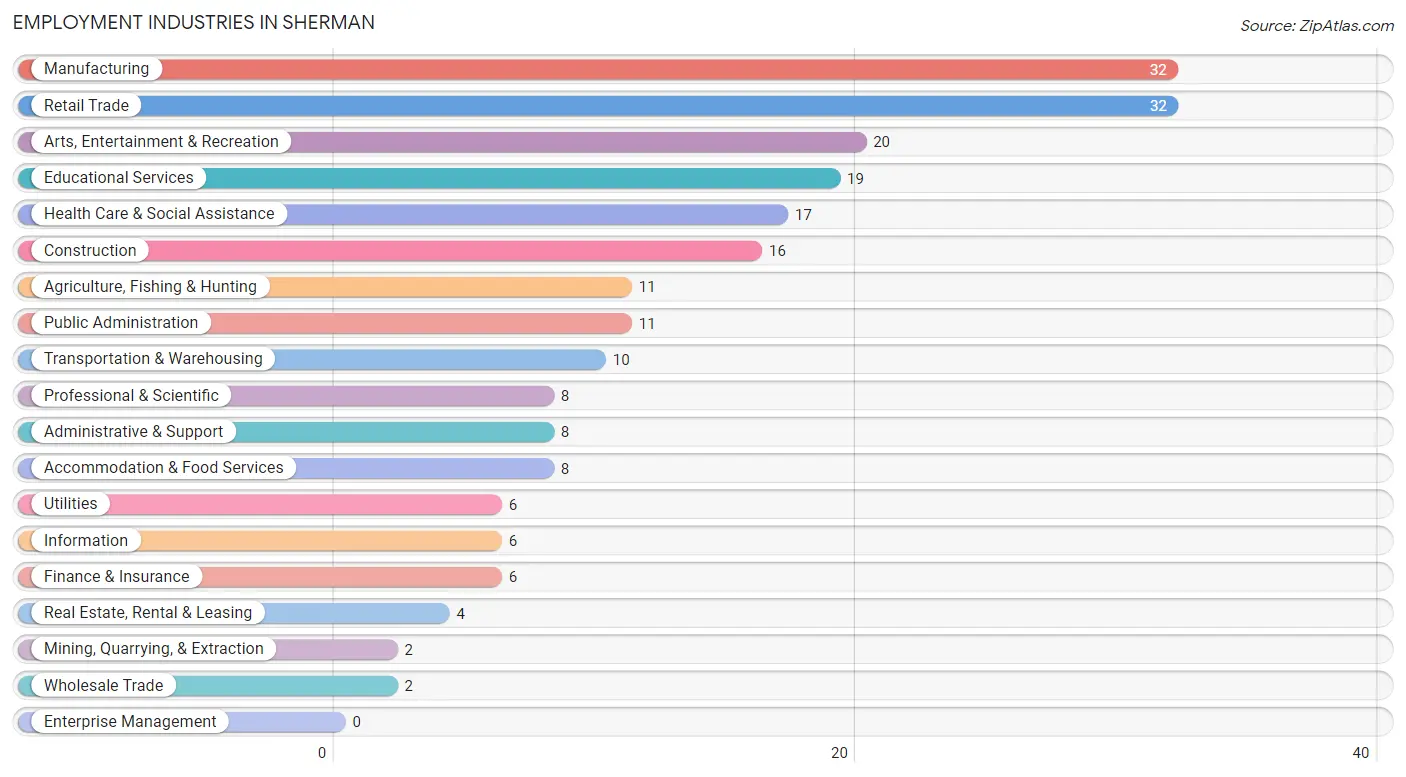
Employment Industries in Sherman
The major employment industries in Sherman include Manufacturing (32 | 14.2%), Retail Trade (32 | 14.2%), Arts, Entertainment & Recreation (20 | 8.9%), Educational Services (19 | 8.4%), and Health Care & Social Assistance (17 | 7.6%).
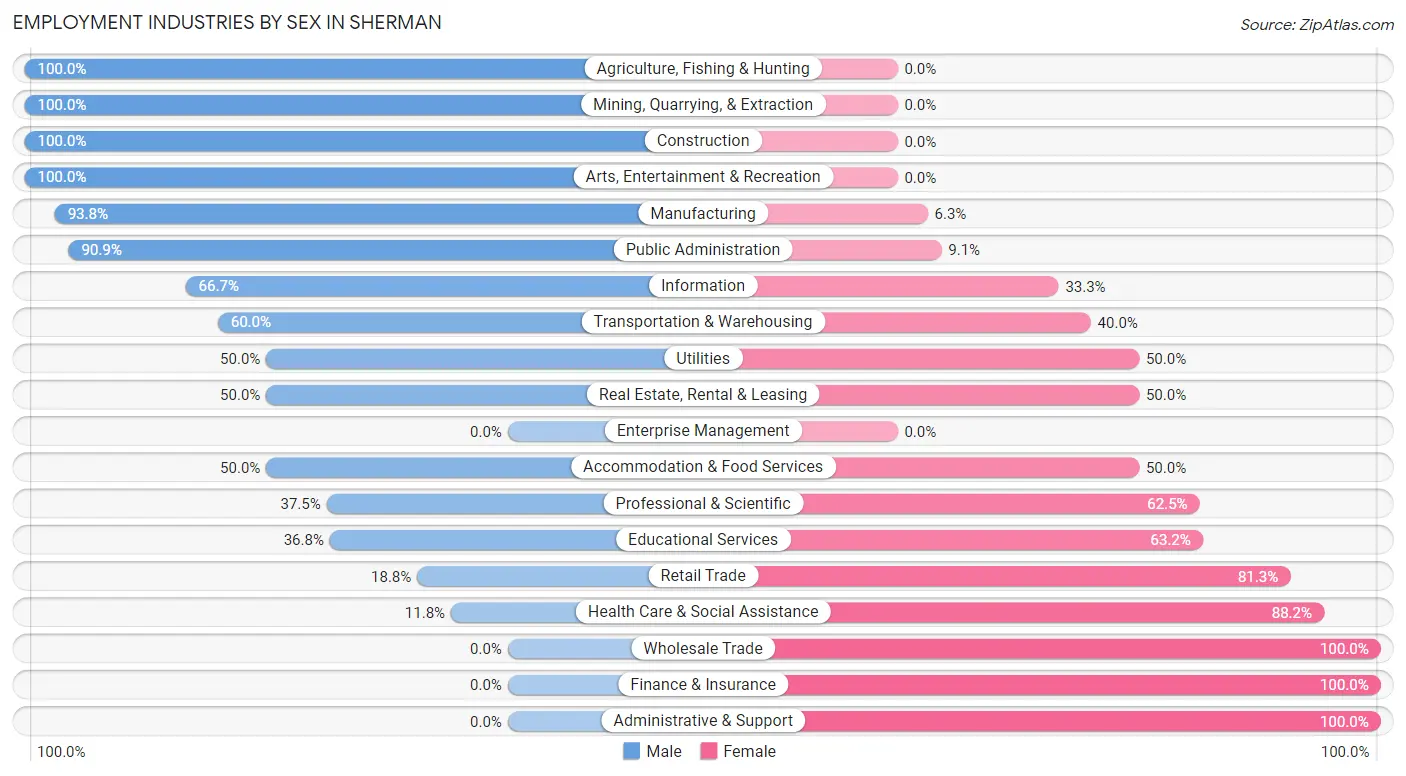
Employment Industries by Sex in Sherman
The Sherman industries that see more men than women are Agriculture, Fishing & Hunting (100.0%), Mining, Quarrying, & Extraction (100.0%), and Construction (100.0%), whereas the industries that tend to have a higher number of women are Wholesale Trade (100.0%), Finance & Insurance (100.0%), and Administrative & Support (100.0%).
| Industry | Male | Female |
| Agriculture, Fishing & Hunting | 11 (100.0%) | 0 (0.0%) |
| Mining, Quarrying, & Extraction | 2 (100.0%) | 0 (0.0%) |
| Construction | 16 (100.0%) | 0 (0.0%) |
| Manufacturing | 30 (93.8%) | 2 (6.2%) |
| Wholesale Trade | 0 (0.0%) | 2 (100.0%) |
| Retail Trade | 6 (18.8%) | 26 (81.2%) |
| Transportation & Warehousing | 6 (60.0%) | 4 (40.0%) |
| Utilities | 3 (50.0%) | 3 (50.0%) |
| Information | 4 (66.7%) | 2 (33.3%) |
| Finance & Insurance | 0 (0.0%) | 6 (100.0%) |
| Real Estate, Rental & Leasing | 2 (50.0%) | 2 (50.0%) |
| Professional & Scientific | 3 (37.5%) | 5 (62.5%) |
| Enterprise Management | 0 (0.0%) | 0 (0.0%) |
| Administrative & Support | 0 (0.0%) | 8 (100.0%) |
| Educational Services | 7 (36.8%) | 12 (63.2%) |
| Health Care & Social Assistance | 2 (11.8%) | 15 (88.2%) |
| Arts, Entertainment & Recreation | 20 (100.0%) | 0 (0.0%) |
| Accommodation & Food Services | 4 (50.0%) | 4 (50.0%) |
| Public Administration | 10 (90.9%) | 1 (9.1%) |
| Total | 129 (57.3%) | 96 (42.7%) |
Education in Sherman
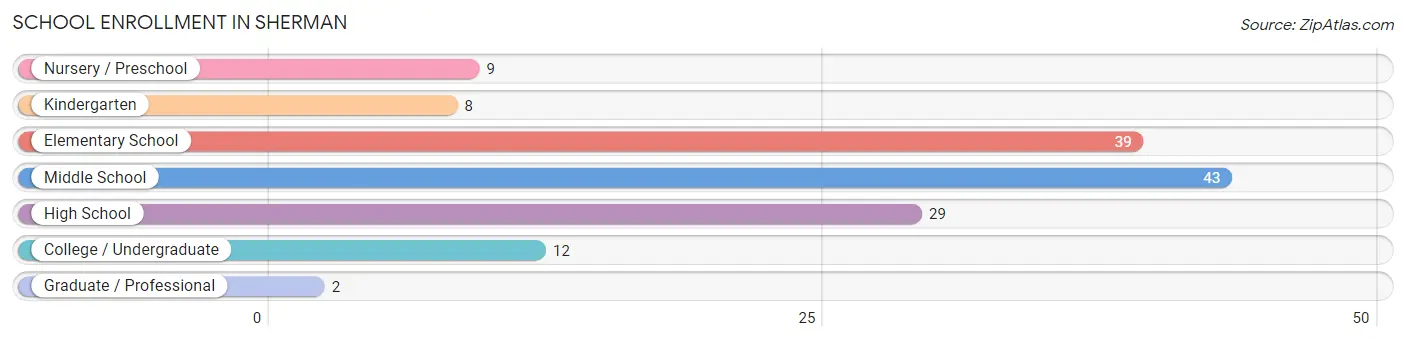
School Enrollment in Sherman
The most common levels of schooling among the 142 students in Sherman are middle school (43 | 30.3%), elementary school (39 | 27.5%), and high school (29 | 20.4%).
| School Level | # Students | % Students |
| Nursery / Preschool | 9 | 6.3% |
| Kindergarten | 8 | 5.6% |
| Elementary School | 39 | 27.5% |
| Middle School | 43 | 30.3% |
| High School | 29 | 20.4% |
| College / Undergraduate | 12 | 8.5% |
| Graduate / Professional | 2 | 1.4% |
| Total | 142 | 100.0% |
School Enrollment by Age by Funding Source in Sherman
Out of a total of 142 students who are enrolled in schools in Sherman, 12 (8.5%) attend a private institution, while the remaining 130 (91.5%) are enrolled in public schools. The age group of 35 years and over has the highest likelihood of being enrolled in private schools, with 2 (25.0% in the age bracket) enrolled. Conversely, the age group of 3 to 4 year olds has the lowest likelihood of being enrolled in a private school, with 9 (100.0% in the age bracket) attending a public institution.
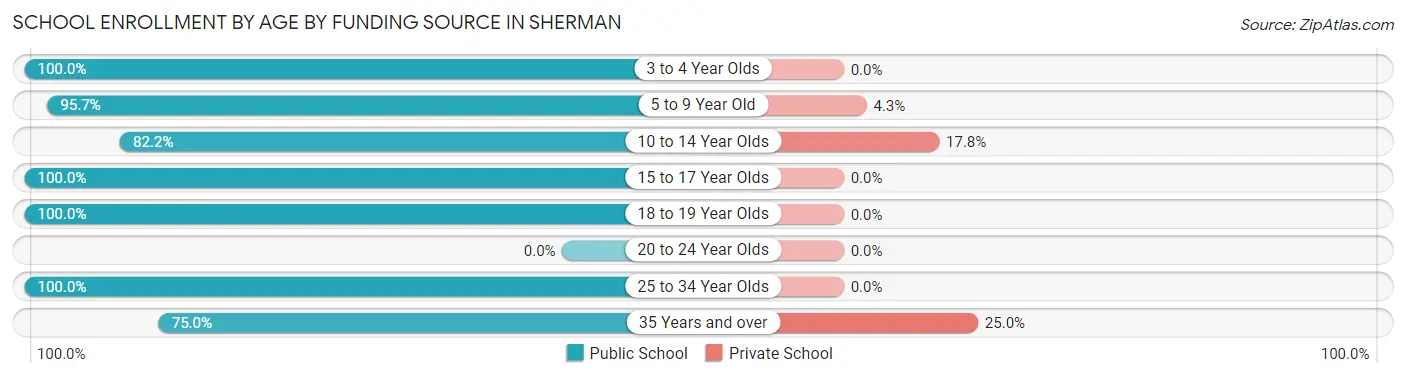
| Age Bracket | Public School | Private School |
| 3 to 4 Year Olds | 9 (100.0%) | 0 (0.0%) |
| 5 to 9 Year Old | 45 (95.7%) | 2 (4.3%) |
| 10 to 14 Year Olds | 37 (82.2%) | 8 (17.8%) |
| 15 to 17 Year Olds | 20 (100.0%) | 0 (0.0%) |
| 18 to 19 Year Olds | 7 (100.0%) | 0 (0.0%) |
| 20 to 24 Year Olds | 0 (0.0%) | 0 (0.0%) |
| 25 to 34 Year Olds | 6 (100.0%) | 0 (0.0%) |
| 35 Years and over | 6 (75.0%) | 2 (25.0%) |
| Total | 130 (91.5%) | 12 (8.5%) |
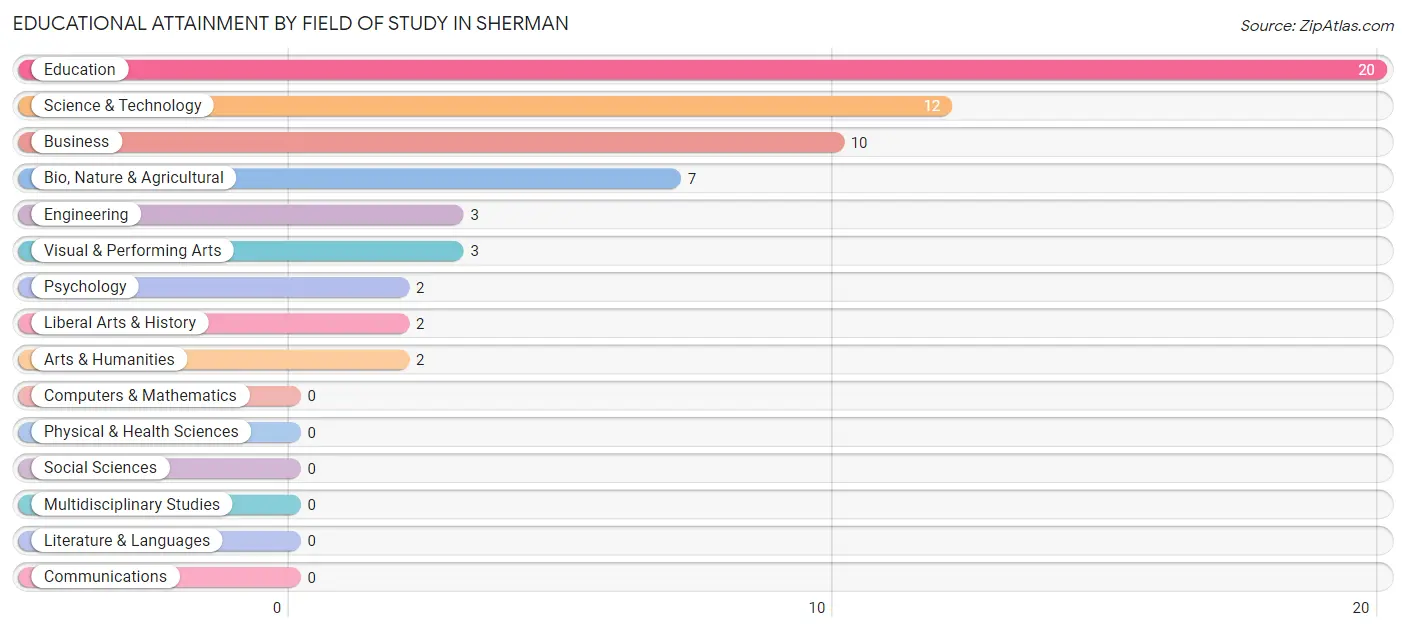
Educational Attainment by Field of Study in Sherman
Education (20 | 32.8%), science & technology (12 | 19.7%), business (10 | 16.4%), bio, nature & agricultural (7 | 11.5%), and engineering (3 | 4.9%) are the most common fields of study among 61 individuals in Sherman who have obtained a bachelor's degree or higher.
| Field of Study | # Graduates | % Graduates |
| Computers & Mathematics | 0 | 0.0% |
| Bio, Nature & Agricultural | 7 | 11.5% |
| Physical & Health Sciences | 0 | 0.0% |
| Psychology | 2 | 3.3% |
| Social Sciences | 0 | 0.0% |
| Engineering | 3 | 4.9% |
| Multidisciplinary Studies | 0 | 0.0% |
| Science & Technology | 12 | 19.7% |
| Business | 10 | 16.4% |
| Education | 20 | 32.8% |
| Literature & Languages | 0 | 0.0% |
| Liberal Arts & History | 2 | 3.3% |
| Visual & Performing Arts | 3 | 4.9% |
| Communications | 0 | 0.0% |
| Arts & Humanities | 2 | 3.3% |
| Total | 61 | 100.0% |
Transportation & Commute in Sherman
Vehicle Availability by Sex in Sherman
The most prevalent vehicle ownership categories in Sherman are males with 2 vehicles (78, accounting for 60.5%) and females with 2 vehicles (36, making up 81.2%).
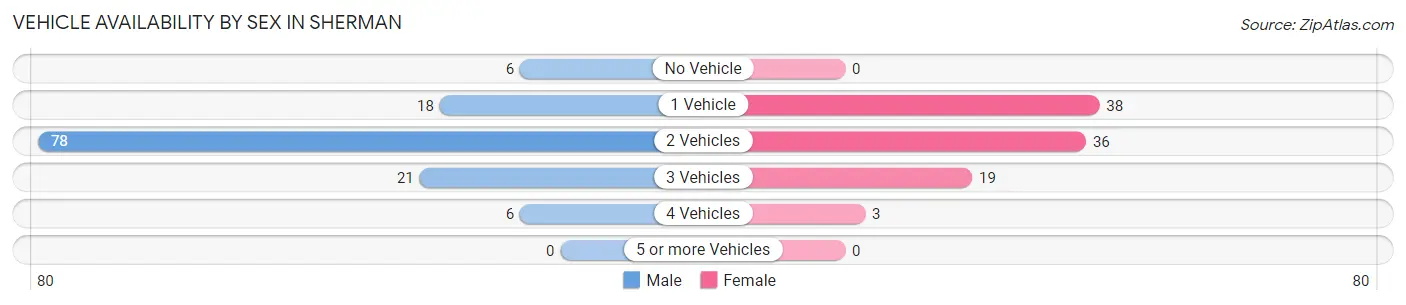
| Vehicles Available | Male | Female |
| No Vehicle | 6 (4.6%) | 0 (0.0%) |
| 1 Vehicle | 18 (14.0%) | 38 (39.6%) |
| 2 Vehicles | 78 (60.5%) | 36 (37.5%) |
| 3 Vehicles | 21 (16.3%) | 19 (19.8%) |
| 4 Vehicles | 6 (4.6%) | 3 (3.1%) |
| 5 or more Vehicles | 0 (0.0%) | 0 (0.0%) |
| Total | 129 (100.0%) | 96 (100.0%) |
Commute Time in Sherman
The most frequently occuring commute durations in Sherman are less than 5 minutes (39 commuters, 18.6%), 15 to 19 minutes (37 commuters, 17.6%), and 30 to 34 minutes (36 commuters, 17.1%).
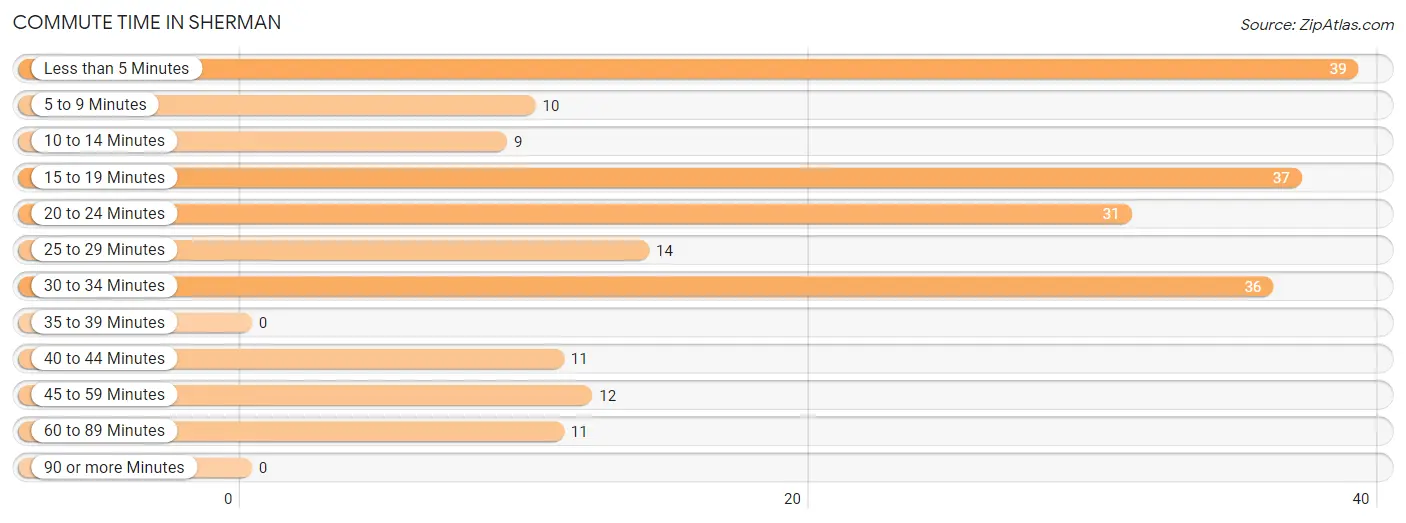
| Commute Time | # Commuters | % Commuters |
| Less than 5 Minutes | 39 | 18.6% |
| 5 to 9 Minutes | 10 | 4.8% |
| 10 to 14 Minutes | 9 | 4.3% |
| 15 to 19 Minutes | 37 | 17.6% |
| 20 to 24 Minutes | 31 | 14.8% |
| 25 to 29 Minutes | 14 | 6.7% |
| 30 to 34 Minutes | 36 | 17.1% |
| 35 to 39 Minutes | 0 | 0.0% |
| 40 to 44 Minutes | 11 | 5.2% |
| 45 to 59 Minutes | 12 | 5.7% |
| 60 to 89 Minutes | 11 | 5.2% |
| 90 or more Minutes | 0 | 0.0% |
Commute Time by Sex in Sherman
The most common commute times in Sherman are 15 to 19 minutes (31 commuters, 25.0%) for males and less than 5 minutes (28 commuters, 32.6%) for females.
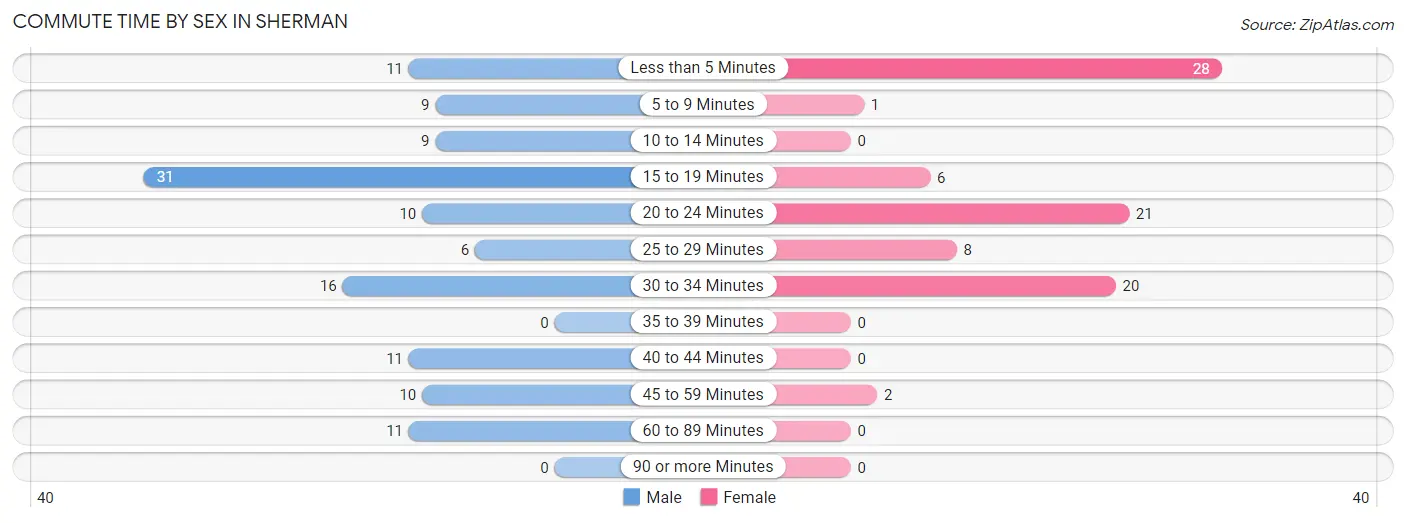
| Commute Time | Male | Female |
| Less than 5 Minutes | 11 (8.9%) | 28 (32.6%) |
| 5 to 9 Minutes | 9 (7.3%) | 1 (1.2%) |
| 10 to 14 Minutes | 9 (7.3%) | 0 (0.0%) |
| 15 to 19 Minutes | 31 (25.0%) | 6 (7.0%) |
| 20 to 24 Minutes | 10 (8.1%) | 21 (24.4%) |
| 25 to 29 Minutes | 6 (4.8%) | 8 (9.3%) |
| 30 to 34 Minutes | 16 (12.9%) | 20 (23.3%) |
| 35 to 39 Minutes | 0 (0.0%) | 0 (0.0%) |
| 40 to 44 Minutes | 11 (8.9%) | 0 (0.0%) |
| 45 to 59 Minutes | 10 (8.1%) | 2 (2.3%) |
| 60 to 89 Minutes | 11 (8.9%) | 0 (0.0%) |
| 90 or more Minutes | 0 (0.0%) | 0 (0.0%) |
Time of Departure to Work by Sex in Sherman
The most frequent times of departure to work in Sherman are 7:30 AM to 7:59 AM (40, 32.3%) for males and 7:30 AM to 7:59 AM (36, 41.9%) for females.
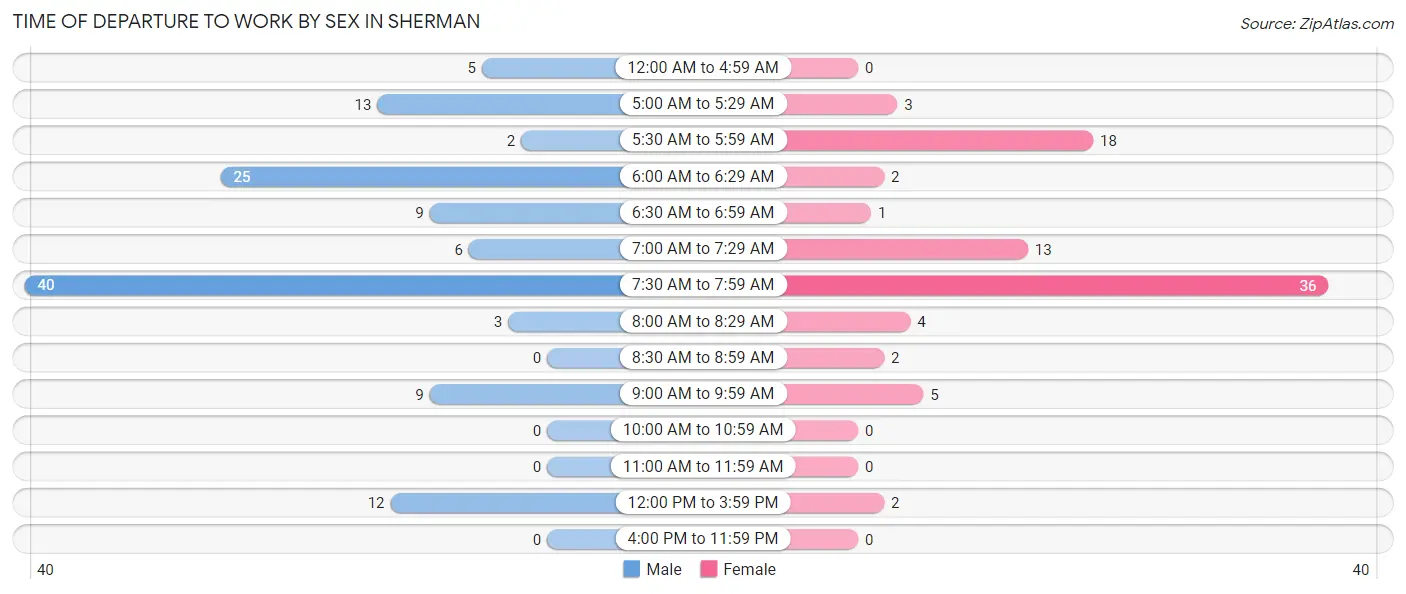
| Time of Departure | Male | Female |
| 12:00 AM to 4:59 AM | 5 (4.0%) | 0 (0.0%) |
| 5:00 AM to 5:29 AM | 13 (10.5%) | 3 (3.5%) |
| 5:30 AM to 5:59 AM | 2 (1.6%) | 18 (20.9%) |
| 6:00 AM to 6:29 AM | 25 (20.2%) | 2 (2.3%) |
| 6:30 AM to 6:59 AM | 9 (7.3%) | 1 (1.2%) |
| 7:00 AM to 7:29 AM | 6 (4.8%) | 13 (15.1%) |
| 7:30 AM to 7:59 AM | 40 (32.3%) | 36 (41.9%) |
| 8:00 AM to 8:29 AM | 3 (2.4%) | 4 (4.6%) |
| 8:30 AM to 8:59 AM | 0 (0.0%) | 2 (2.3%) |
| 9:00 AM to 9:59 AM | 9 (7.3%) | 5 (5.8%) |
| 10:00 AM to 10:59 AM | 0 (0.0%) | 0 (0.0%) |
| 11:00 AM to 11:59 AM | 0 (0.0%) | 0 (0.0%) |
| 12:00 PM to 3:59 PM | 12 (9.7%) | 2 (2.3%) |
| 4:00 PM to 11:59 PM | 0 (0.0%) | 0 (0.0%) |
| Total | 124 (100.0%) | 86 (100.0%) |
Housing Occupancy in Sherman
Occupancy by Ownership in Sherman
Of the total 243 dwellings in Sherman, owner-occupied units account for 159 (65.4%), while renter-occupied units make up 84 (34.6%).
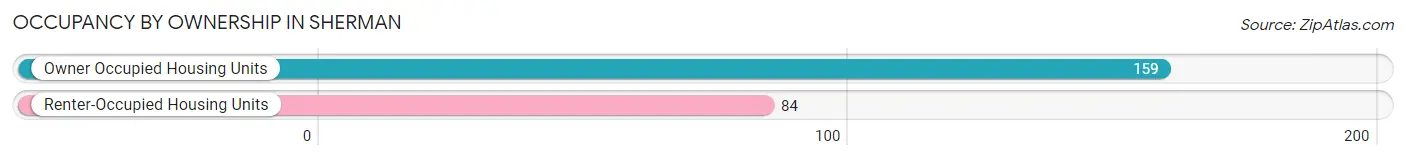
| Occupancy | # Housing Units | % Housing Units |
| Owner Occupied Housing Units | 159 | 65.4% |
| Renter-Occupied Housing Units | 84 | 34.6% |
| Total Occupied Housing Units | 243 | 100.0% |
Occupancy by Household Size in Sherman
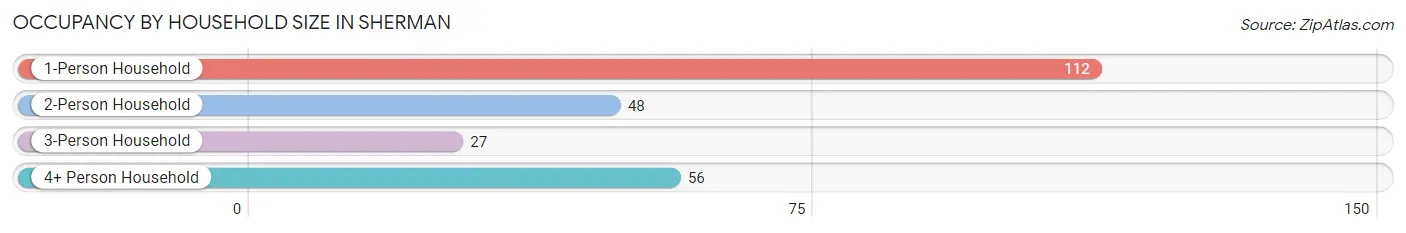
| Household Size | # Housing Units | % Housing Units |
| 1-Person Household | 112 | 46.1% |
| 2-Person Household | 48 | 19.8% |
| 3-Person Household | 27 | 11.1% |
| 4+ Person Household | 56 | 23.1% |
| Total Housing Units | 243 | 100.0% |
Occupancy by Ownership by Household Size in Sherman
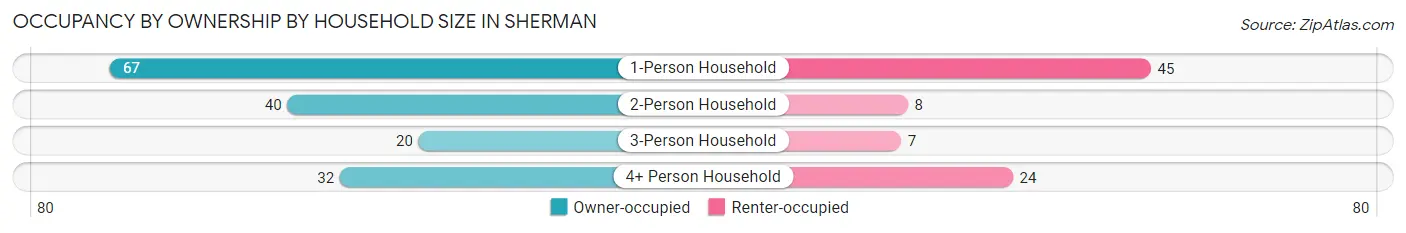
| Household Size | Owner-occupied | Renter-occupied |
| 1-Person Household | 67 (59.8%) | 45 (40.2%) |
| 2-Person Household | 40 (83.3%) | 8 (16.7%) |
| 3-Person Household | 20 (74.1%) | 7 (25.9%) |
| 4+ Person Household | 32 (57.1%) | 24 (42.9%) |
| Total Housing Units | 159 (65.4%) | 84 (34.6%) |
Occupancy by Educational Attainment in Sherman
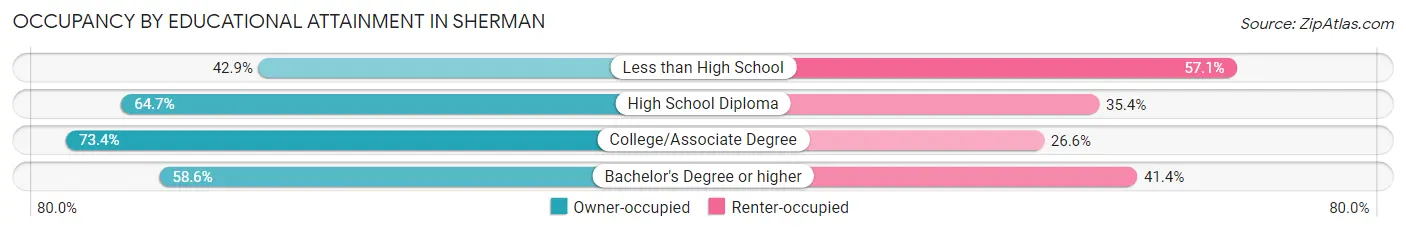
| Household Size | Owner-occupied | Renter-occupied |
| Less than High School | 9 (42.9%) | 12 (57.1%) |
| High School Diploma | 64 (64.6%) | 35 (35.3%) |
| College/Associate Degree | 69 (73.4%) | 25 (26.6%) |
| Bachelor's Degree or higher | 17 (58.6%) | 12 (41.4%) |
Occupancy by Age of Householder in Sherman
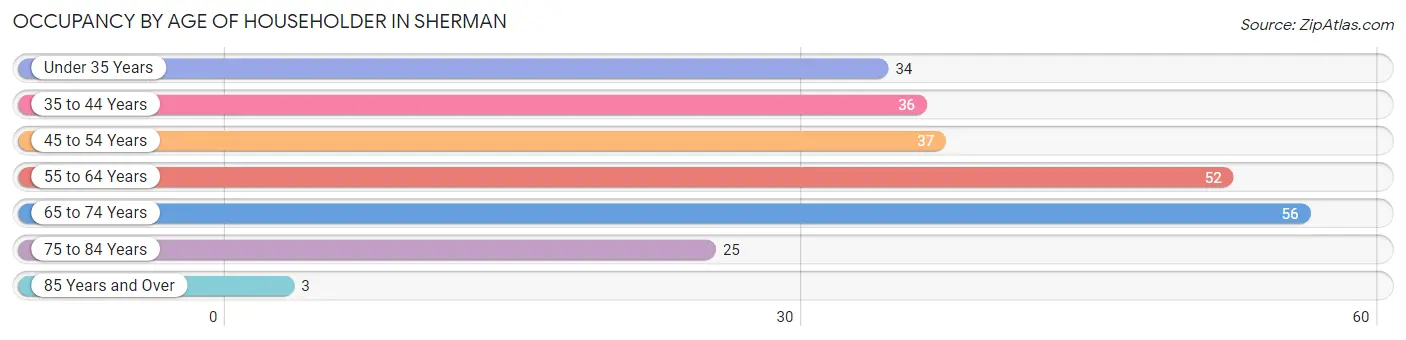
| Age Bracket | # Households | % Households |
| Under 35 Years | 34 | 14.0% |
| 35 to 44 Years | 36 | 14.8% |
| 45 to 54 Years | 37 | 15.2% |
| 55 to 64 Years | 52 | 21.4% |
| 65 to 74 Years | 56 | 23.1% |
| 75 to 84 Years | 25 | 10.3% |
| 85 Years and Over | 3 | 1.2% |
| Total | 243 | 100.0% |
Housing Finances in Sherman
Median Income by Occupancy in Sherman
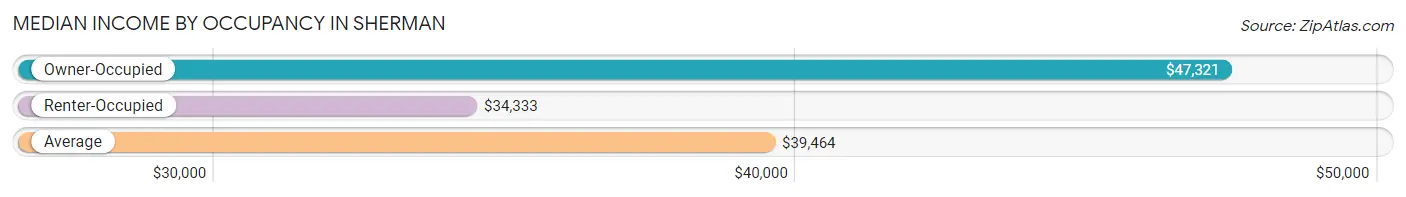
| Occupancy Type | # Households | Median Income |
| Owner-Occupied | 159 (65.4%) | $47,321 |
| Renter-Occupied | 84 (34.6%) | $34,333 |
| Average | 243 (100.0%) | $39,464 |
Occupancy by Householder Income Bracket in Sherman
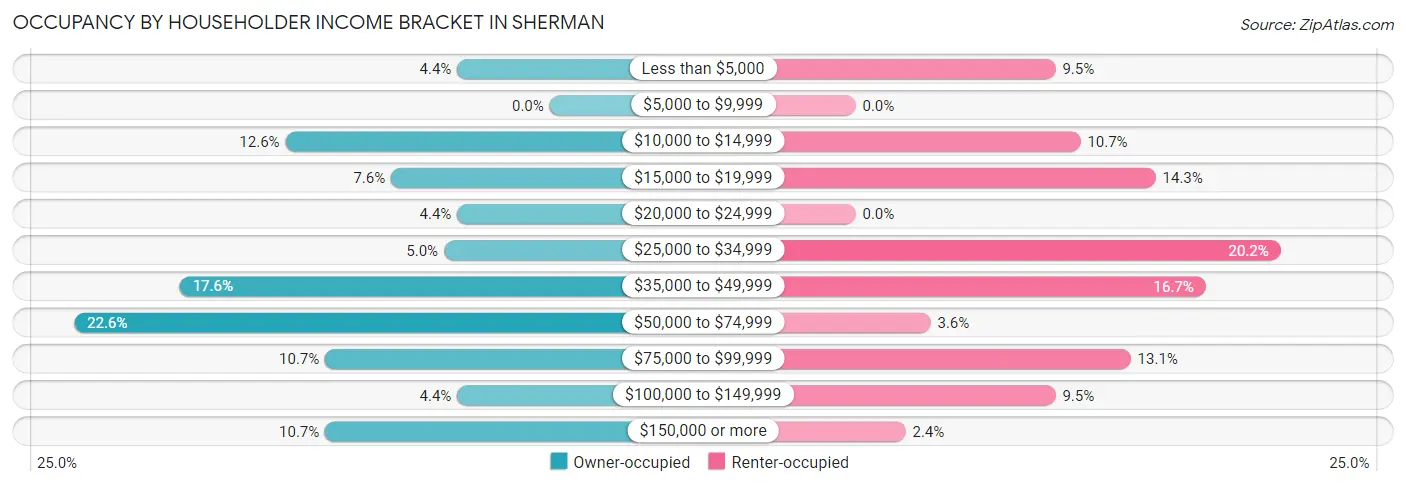
| Income Bracket | Owner-occupied | Renter-occupied |
| Less than $5,000 | 7 (4.4%) | 8 (9.5%) |
| $5,000 to $9,999 | 0 (0.0%) | 0 (0.0%) |
| $10,000 to $14,999 | 20 (12.6%) | 9 (10.7%) |
| $15,000 to $19,999 | 12 (7.5%) | 12 (14.3%) |
| $20,000 to $24,999 | 7 (4.4%) | 0 (0.0%) |
| $25,000 to $34,999 | 8 (5.0%) | 17 (20.2%) |
| $35,000 to $49,999 | 28 (17.6%) | 14 (16.7%) |
| $50,000 to $74,999 | 36 (22.6%) | 3 (3.6%) |
| $75,000 to $99,999 | 17 (10.7%) | 11 (13.1%) |
| $100,000 to $149,999 | 7 (4.4%) | 8 (9.5%) |
| $150,000 or more | 17 (10.7%) | 2 (2.4%) |
| Total | 159 (100.0%) | 84 (100.0%) |
Monthly Housing Cost Tiers in Sherman
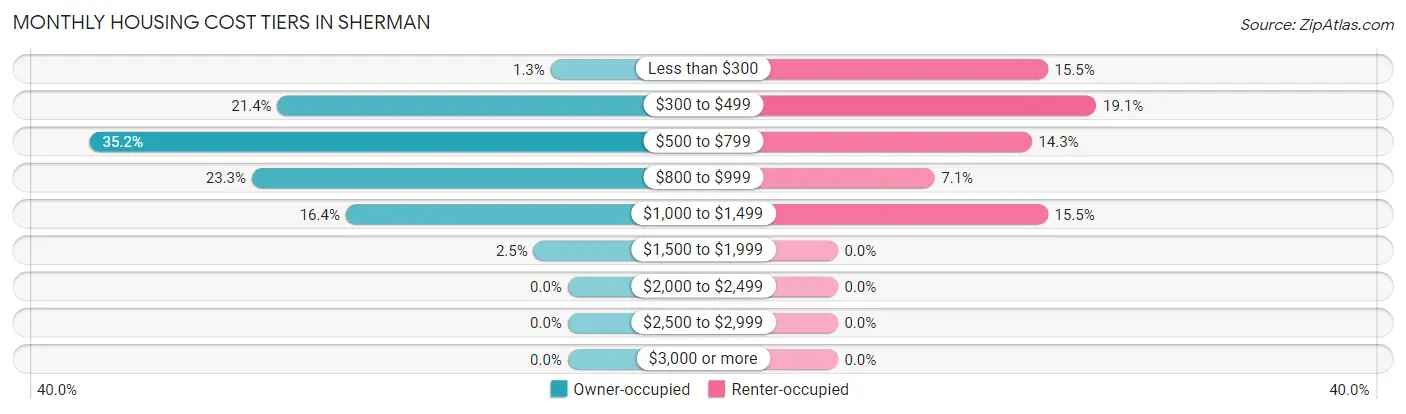
| Monthly Cost | Owner-occupied | Renter-occupied |
| Less than $300 | 2 (1.3%) | 13 (15.5%) |
| $300 to $499 | 34 (21.4%) | 16 (19.1%) |
| $500 to $799 | 56 (35.2%) | 12 (14.3%) |
| $800 to $999 | 37 (23.3%) | 6 (7.1%) |
| $1,000 to $1,499 | 26 (16.4%) | 13 (15.5%) |
| $1,500 to $1,999 | 4 (2.5%) | 0 (0.0%) |
| $2,000 to $2,499 | 0 (0.0%) | 0 (0.0%) |
| $2,500 to $2,999 | 0 (0.0%) | 0 (0.0%) |
| $3,000 or more | 0 (0.0%) | 0 (0.0%) |
| Total | 159 (100.0%) | 84 (100.0%) |
Physical Housing Characteristics in Sherman
Housing Structures in Sherman
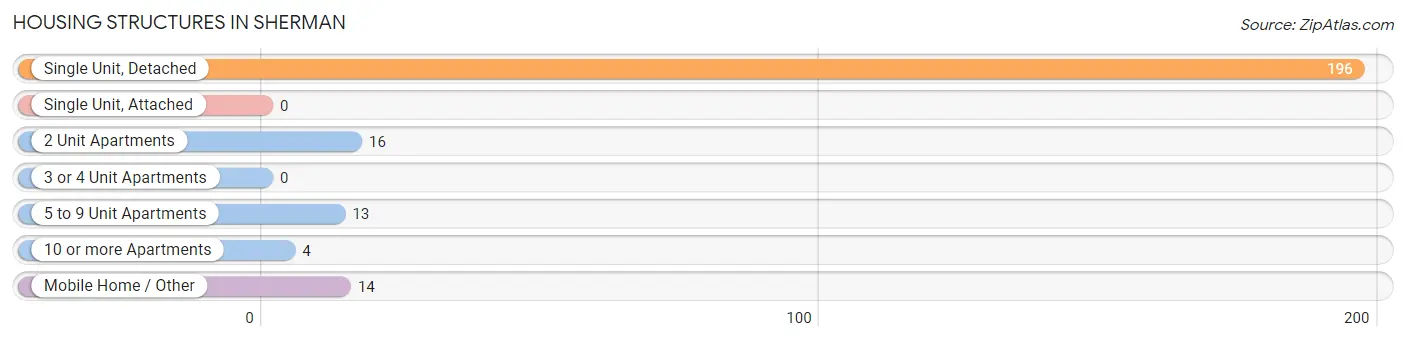
| Structure Type | # Housing Units | % Housing Units |
| Single Unit, Detached | 196 | 80.7% |
| Single Unit, Attached | 0 | 0.0% |
| 2 Unit Apartments | 16 | 6.6% |
| 3 or 4 Unit Apartments | 0 | 0.0% |
| 5 to 9 Unit Apartments | 13 | 5.3% |
| 10 or more Apartments | 4 | 1.7% |
| Mobile Home / Other | 14 | 5.8% |
| Total | 243 | 100.0% |
Housing Structures by Occupancy in Sherman
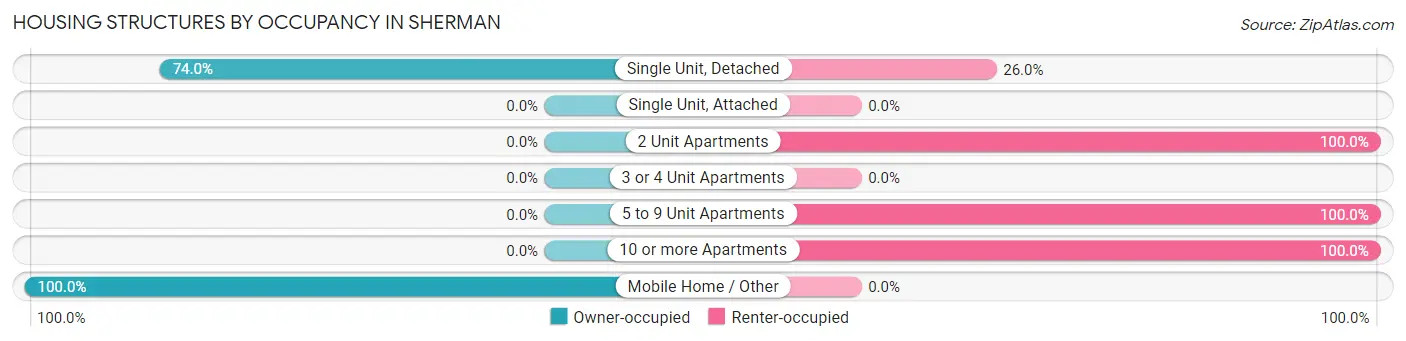
| Structure Type | Owner-occupied | Renter-occupied |
| Single Unit, Detached | 145 (74.0%) | 51 (26.0%) |
| Single Unit, Attached | 0 (0.0%) | 0 (0.0%) |
| 2 Unit Apartments | 0 (0.0%) | 16 (100.0%) |
| 3 or 4 Unit Apartments | 0 (0.0%) | 0 (0.0%) |
| 5 to 9 Unit Apartments | 0 (0.0%) | 13 (100.0%) |
| 10 or more Apartments | 0 (0.0%) | 4 (100.0%) |
| Mobile Home / Other | 14 (100.0%) | 0 (0.0%) |
| Total | 159 (65.4%) | 84 (34.6%) |
Housing Structures by Number of Rooms in Sherman
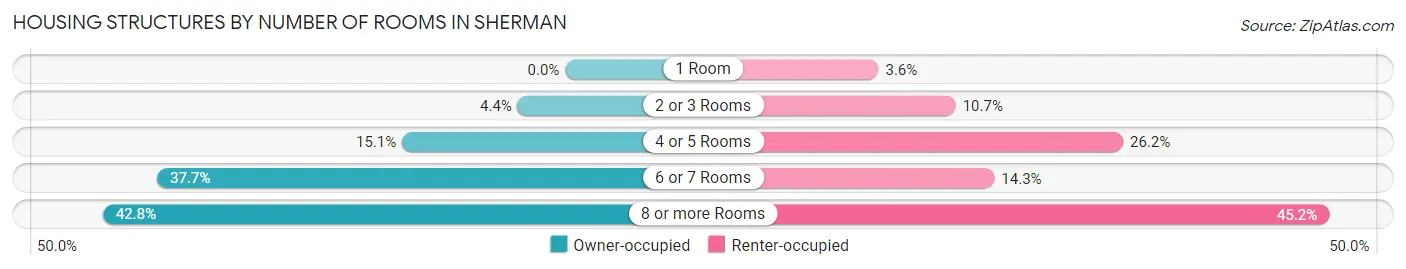
| Number of Rooms | Owner-occupied | Renter-occupied |
| 1 Room | 0 (0.0%) | 3 (3.6%) |
| 2 or 3 Rooms | 7 (4.4%) | 9 (10.7%) |
| 4 or 5 Rooms | 24 (15.1%) | 22 (26.2%) |
| 6 or 7 Rooms | 60 (37.7%) | 12 (14.3%) |
| 8 or more Rooms | 68 (42.8%) | 38 (45.2%) |
| Total | 159 (100.0%) | 84 (100.0%) |
Housing Structure by Heating Type in Sherman
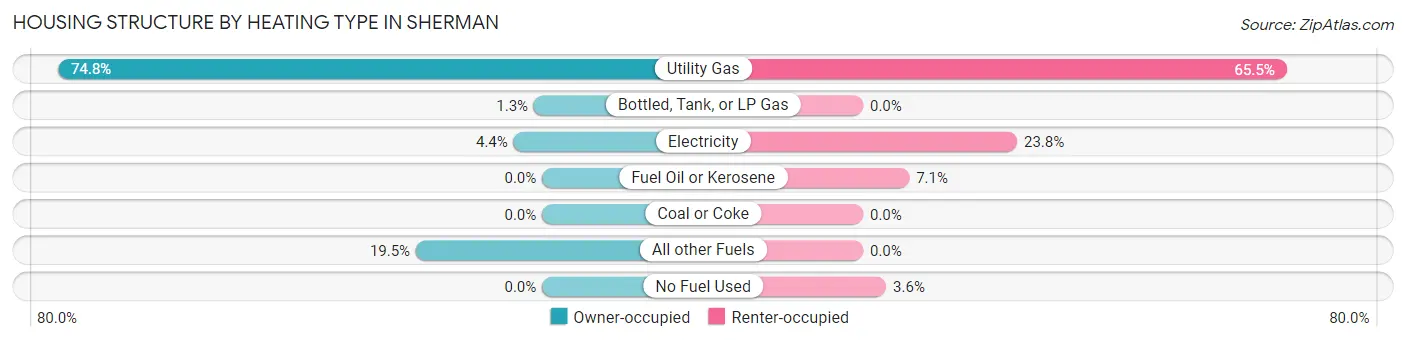
| Heating Type | Owner-occupied | Renter-occupied |
| Utility Gas | 119 (74.8%) | 55 (65.5%) |
| Bottled, Tank, or LP Gas | 2 (1.3%) | 0 (0.0%) |
| Electricity | 7 (4.4%) | 20 (23.8%) |
| Fuel Oil or Kerosene | 0 (0.0%) | 6 (7.1%) |
| Coal or Coke | 0 (0.0%) | 0 (0.0%) |
| All other Fuels | 31 (19.5%) | 0 (0.0%) |
| No Fuel Used | 0 (0.0%) | 3 (3.6%) |
| Total | 159 (100.0%) | 84 (100.0%) |
Household Vehicle Usage in Sherman
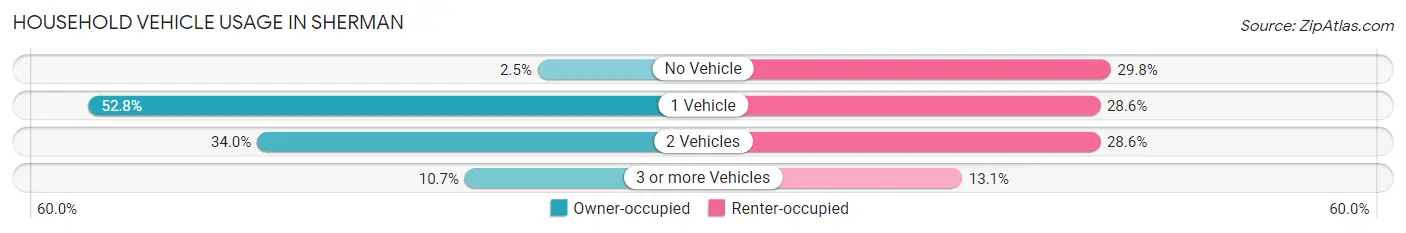
| Vehicles per Household | Owner-occupied | Renter-occupied |
| No Vehicle | 4 (2.5%) | 25 (29.8%) |
| 1 Vehicle | 84 (52.8%) | 24 (28.6%) |
| 2 Vehicles | 54 (34.0%) | 24 (28.6%) |
| 3 or more Vehicles | 17 (10.7%) | 11 (13.1%) |
| Total | 159 (100.0%) | 84 (100.0%) |
Real Estate & Mortgages in Sherman
Real Estate and Mortgage Overview in Sherman
| Characteristic | Without Mortgage | With Mortgage |
| Housing Units | 82 | 77 |
| Median Property Value | $75,000 | $87,900 |
| Median Household Income | $33,750 | $14 |
| Monthly Housing Costs | $580 | $0 |
| Real Estate Taxes | $2,389 | $0 |
Property Value by Mortgage Status in Sherman
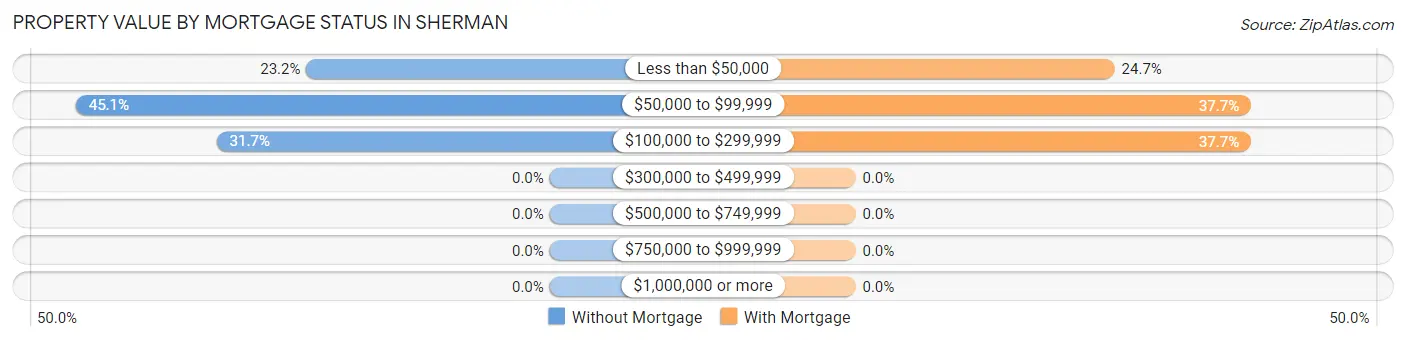
| Property Value | Without Mortgage | With Mortgage |
| Less than $50,000 | 19 (23.2%) | 19 (24.7%) |
| $50,000 to $99,999 | 37 (45.1%) | 29 (37.7%) |
| $100,000 to $299,999 | 26 (31.7%) | 29 (37.7%) |
| $300,000 to $499,999 | 0 (0.0%) | 0 (0.0%) |
| $500,000 to $749,999 | 0 (0.0%) | 0 (0.0%) |
| $750,000 to $999,999 | 0 (0.0%) | 0 (0.0%) |
| $1,000,000 or more | 0 (0.0%) | 0 (0.0%) |
| Total | 82 (100.0%) | 77 (100.0%) |
Household Income by Mortgage Status in Sherman
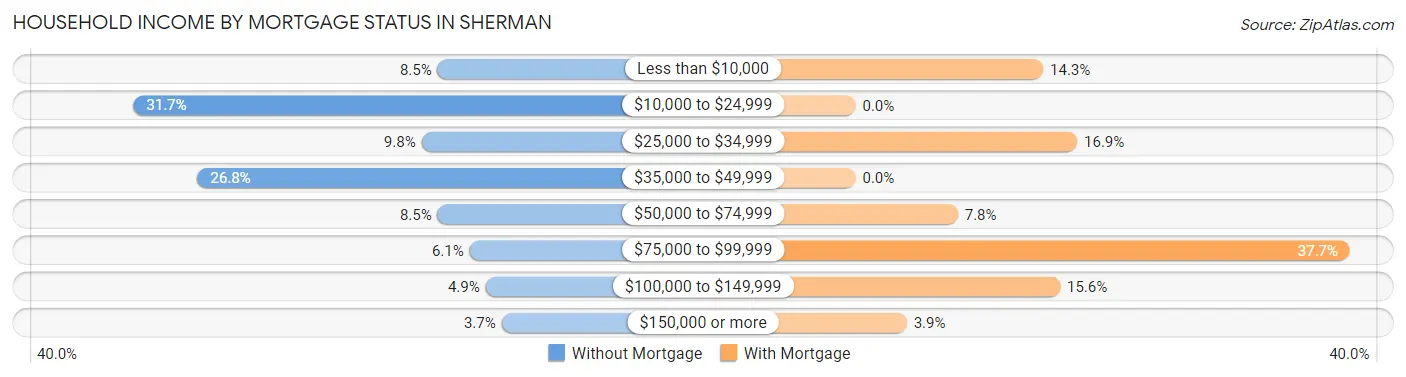
| Household Income | Without Mortgage | With Mortgage |
| Less than $10,000 | 7 (8.5%) | 11 (14.3%) |
| $10,000 to $24,999 | 26 (31.7%) | 0 (0.0%) |
| $25,000 to $34,999 | 8 (9.8%) | 13 (16.9%) |
| $35,000 to $49,999 | 22 (26.8%) | 0 (0.0%) |
| $50,000 to $74,999 | 7 (8.5%) | 6 (7.8%) |
| $75,000 to $99,999 | 5 (6.1%) | 29 (37.7%) |
| $100,000 to $149,999 | 4 (4.9%) | 12 (15.6%) |
| $150,000 or more | 3 (3.7%) | 3 (3.9%) |
| Total | 82 (100.0%) | 77 (100.0%) |
Property Value to Household Income Ratio in Sherman
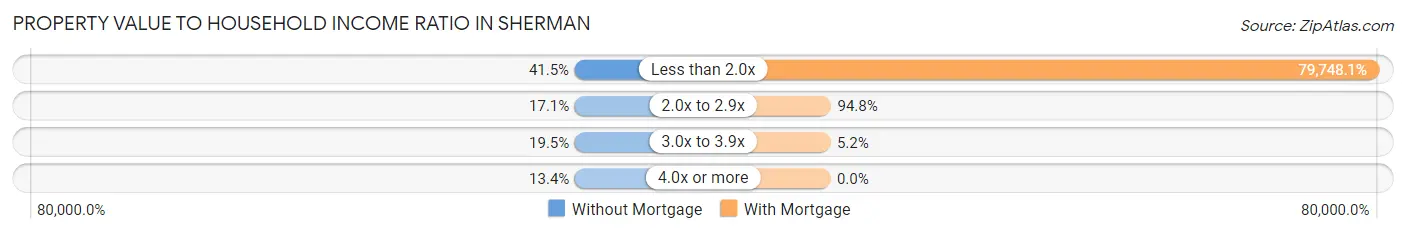
| Value-to-Income Ratio | Without Mortgage | With Mortgage |
| Less than 2.0x | 34 (41.5%) | 61,406 (79,748.1%) |
| 2.0x to 2.9x | 14 (17.1%) | 73 (94.8%) |
| 3.0x to 3.9x | 16 (19.5%) | 4 (5.2%) |
| 4.0x or more | 11 (13.4%) | 0 (0.0%) |
| Total | 82 (100.0%) | 77 (100.0%) |
Real Estate Taxes by Mortgage Status in Sherman
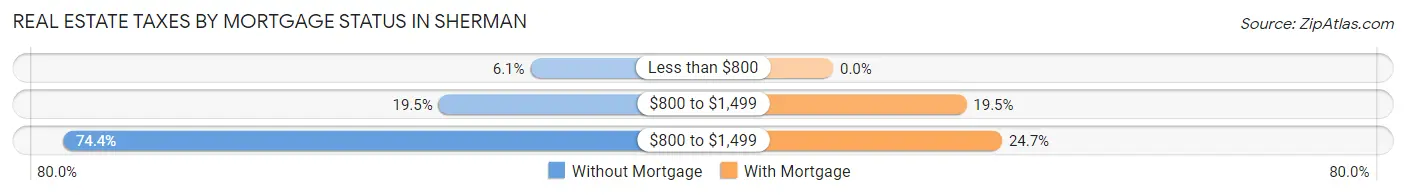
| Property Taxes | Without Mortgage | With Mortgage |
| Less than $800 | 5 (6.1%) | 0 (0.0%) |
| $800 to $1,499 | 16 (19.5%) | 15 (19.5%) |
| $800 to $1,499 | 61 (74.4%) | 19 (24.7%) |
| Total | 82 (100.0%) | 77 (100.0%) |
Health & Disability in Sherman
Health Insurance Coverage by Age in Sherman
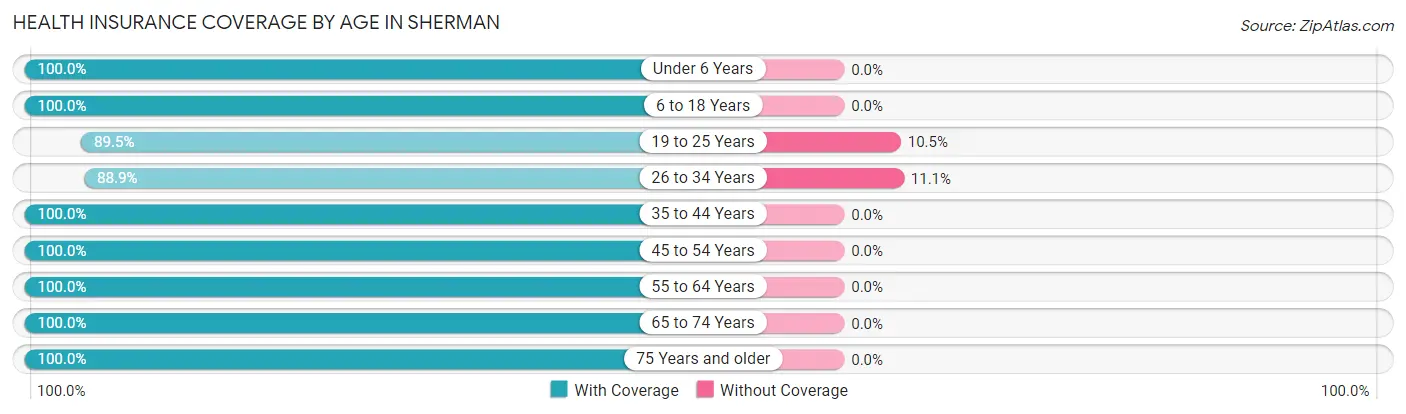
| Age Bracket | With Coverage | Without Coverage |
| Under 6 Years | 46 (100.0%) | 0 (0.0%) |
| 6 to 18 Years | 112 (100.0%) | 0 (0.0%) |
| 19 to 25 Years | 17 (89.5%) | 2 (10.5%) |
| 26 to 34 Years | 56 (88.9%) | 7 (11.1%) |
| 35 to 44 Years | 62 (100.0%) | 0 (0.0%) |
| 45 to 54 Years | 49 (100.0%) | 0 (0.0%) |
| 55 to 64 Years | 98 (100.0%) | 0 (0.0%) |
| 65 to 74 Years | 67 (100.0%) | 0 (0.0%) |
| 75 Years and older | 51 (100.0%) | 0 (0.0%) |
| Total | 558 (98.4%) | 9 (1.6%) |
Health Insurance Coverage by Citizenship Status in Sherman
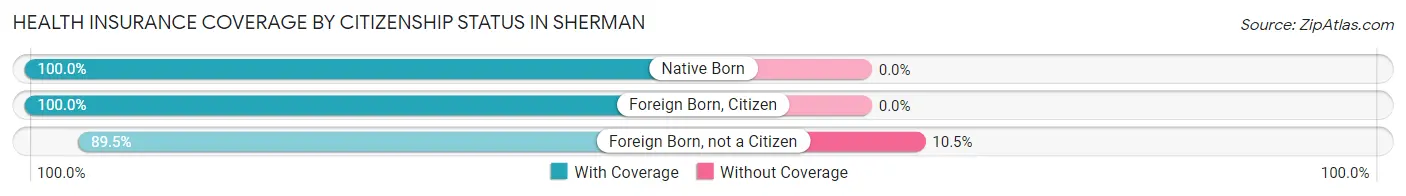
| Citizenship Status | With Coverage | Without Coverage |
| Native Born | 46 (100.0%) | 0 (0.0%) |
| Foreign Born, Citizen | 112 (100.0%) | 0 (0.0%) |
| Foreign Born, not a Citizen | 17 (89.5%) | 2 (10.5%) |
Health Insurance Coverage by Household Income in Sherman
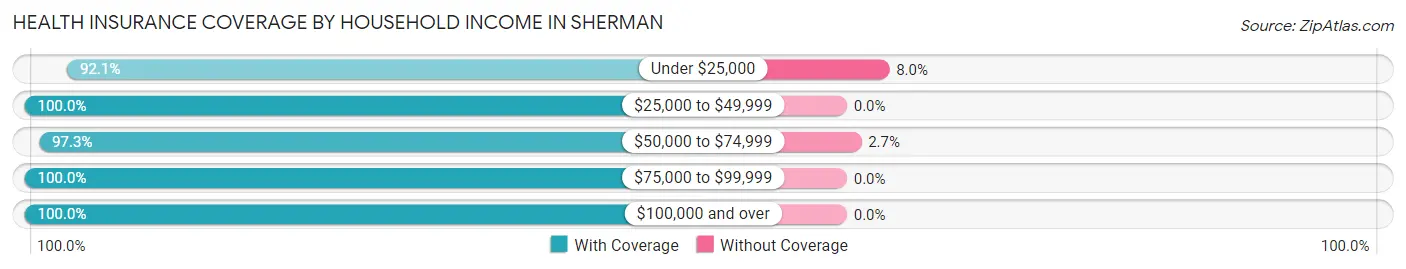
| Household Income | With Coverage | Without Coverage |
| Under $25,000 | 81 (92.0%) | 7 (8.0%) |
| $25,000 to $49,999 | 177 (100.0%) | 0 (0.0%) |
| $50,000 to $74,999 | 72 (97.3%) | 2 (2.7%) |
| $75,000 to $99,999 | 96 (100.0%) | 0 (0.0%) |
| $100,000 and over | 132 (100.0%) | 0 (0.0%) |
Public vs Private Health Insurance Coverage by Age in Sherman
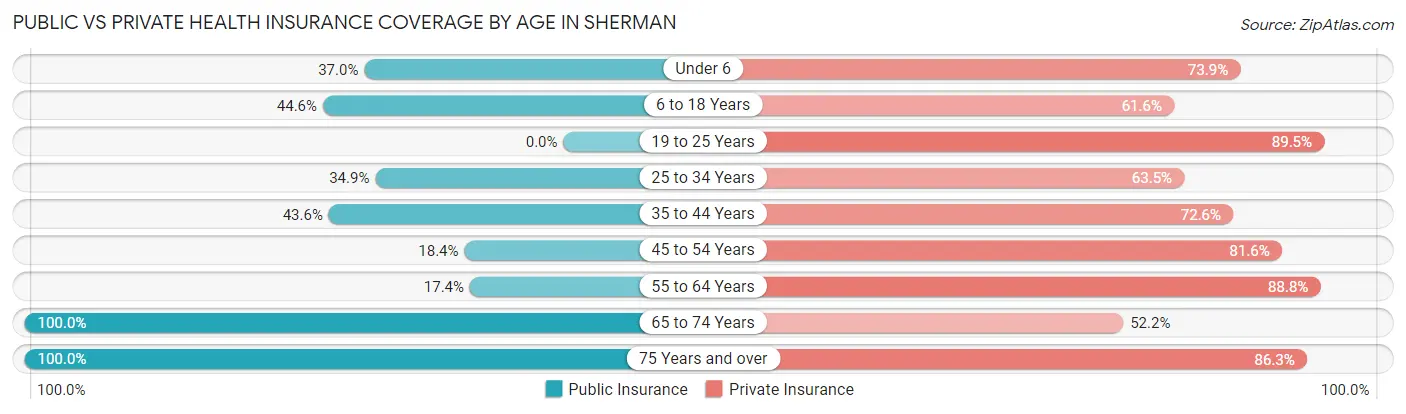
| Age Bracket | Public Insurance | Private Insurance |
| Under 6 | 17 (37.0%) | 34 (73.9%) |
| 6 to 18 Years | 50 (44.6%) | 69 (61.6%) |
| 19 to 25 Years | 0 (0.0%) | 17 (89.5%) |
| 25 to 34 Years | 22 (34.9%) | 40 (63.5%) |
| 35 to 44 Years | 27 (43.5%) | 45 (72.6%) |
| 45 to 54 Years | 9 (18.4%) | 40 (81.6%) |
| 55 to 64 Years | 17 (17.3%) | 87 (88.8%) |
| 65 to 74 Years | 67 (100.0%) | 35 (52.2%) |
| 75 Years and over | 51 (100.0%) | 44 (86.3%) |
| Total | 260 (45.9%) | 411 (72.5%) |
Disability Status by Sex by Age in Sherman
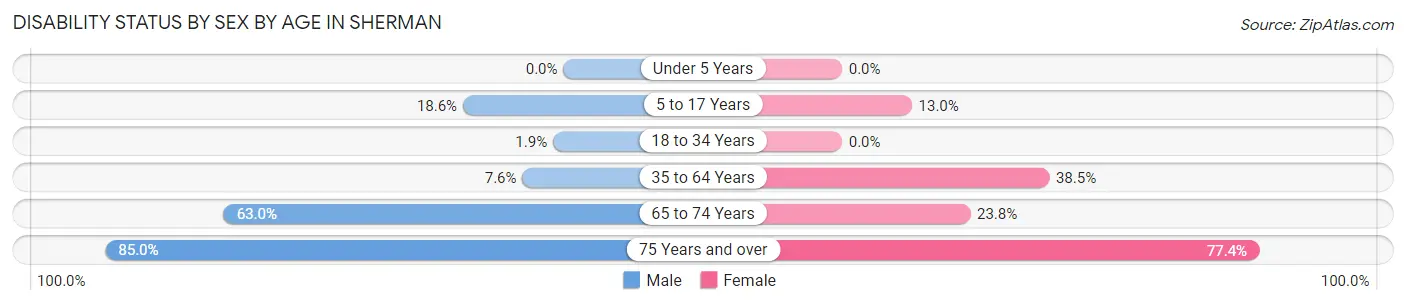
| Age Bracket | Male | Female |
| Under 5 Years | 0 (0.0%) | 0 (0.0%) |
| 5 to 17 Years | 11 (18.6%) | 7 (13.0%) |
| 18 to 34 Years | 1 (1.9%) | 0 (0.0%) |
| 35 to 64 Years | 7 (7.6%) | 45 (38.5%) |
| 65 to 74 Years | 29 (63.0%) | 5 (23.8%) |
| 75 Years and over | 17 (85.0%) | 24 (77.4%) |
Disability Class by Sex by Age in Sherman
Disability Class: Hearing Difficulty
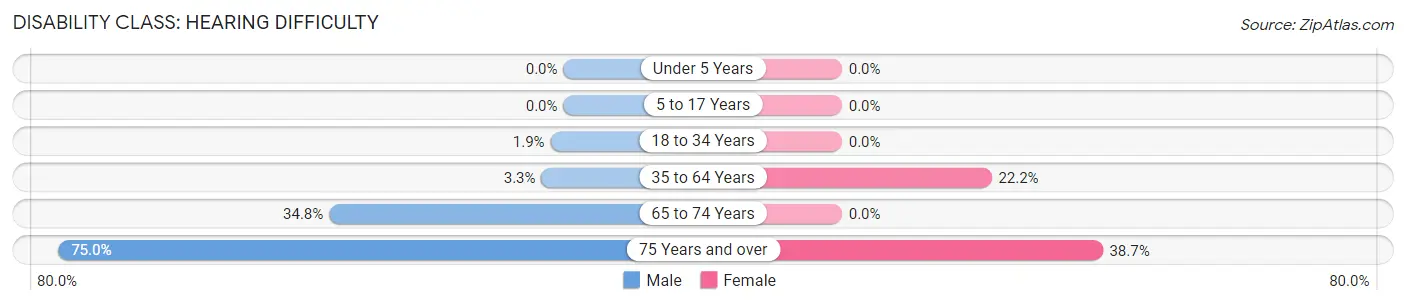
| Age Bracket | Male | Female |
| Under 5 Years | 0 (0.0%) | 0 (0.0%) |
| 5 to 17 Years | 0 (0.0%) | 0 (0.0%) |
| 18 to 34 Years | 1 (1.9%) | 0 (0.0%) |
| 35 to 64 Years | 3 (3.3%) | 26 (22.2%) |
| 65 to 74 Years | 16 (34.8%) | 0 (0.0%) |
| 75 Years and over | 15 (75.0%) | 12 (38.7%) |
Disability Class: Vision Difficulty
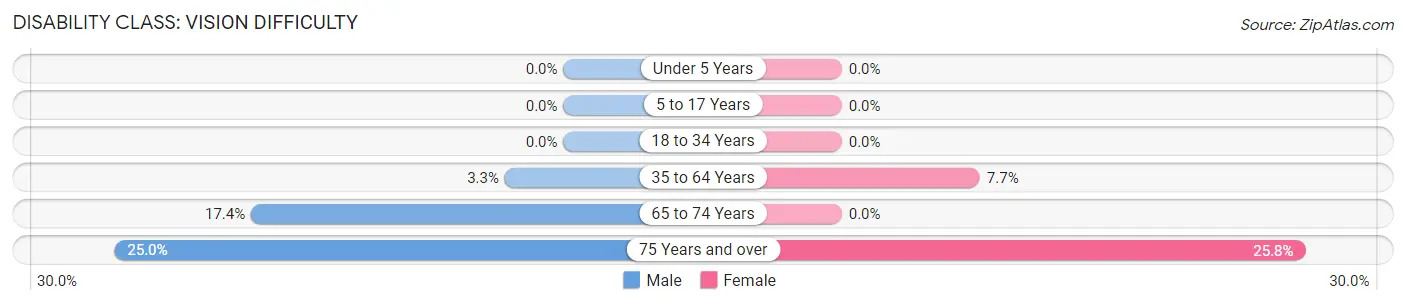
| Age Bracket | Male | Female |
| Under 5 Years | 0 (0.0%) | 0 (0.0%) |
| 5 to 17 Years | 0 (0.0%) | 0 (0.0%) |
| 18 to 34 Years | 0 (0.0%) | 0 (0.0%) |
| 35 to 64 Years | 3 (3.3%) | 9 (7.7%) |
| 65 to 74 Years | 8 (17.4%) | 0 (0.0%) |
| 75 Years and over | 5 (25.0%) | 8 (25.8%) |
Disability Class: Cognitive Difficulty
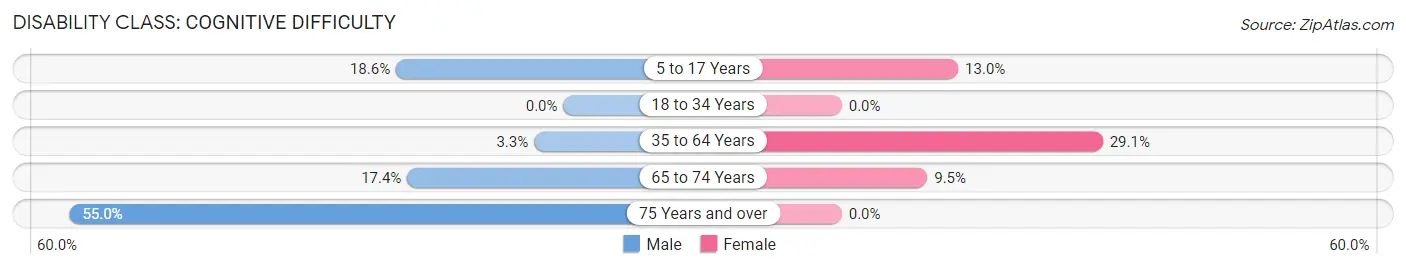
| Age Bracket | Male | Female |
| 5 to 17 Years | 11 (18.6%) | 7 (13.0%) |
| 18 to 34 Years | 0 (0.0%) | 0 (0.0%) |
| 35 to 64 Years | 3 (3.3%) | 34 (29.1%) |
| 65 to 74 Years | 8 (17.4%) | 2 (9.5%) |
| 75 Years and over | 11 (55.0%) | 0 (0.0%) |
Disability Class: Ambulatory Difficulty
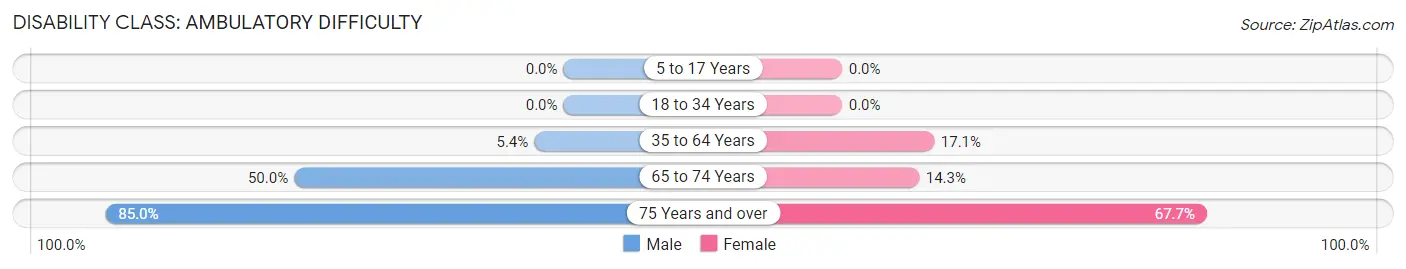
| Age Bracket | Male | Female |
| 5 to 17 Years | 0 (0.0%) | 0 (0.0%) |
| 18 to 34 Years | 0 (0.0%) | 0 (0.0%) |
| 35 to 64 Years | 5 (5.4%) | 20 (17.1%) |
| 65 to 74 Years | 23 (50.0%) | 3 (14.3%) |
| 75 Years and over | 17 (85.0%) | 21 (67.7%) |
Disability Class: Self-Care Difficulty
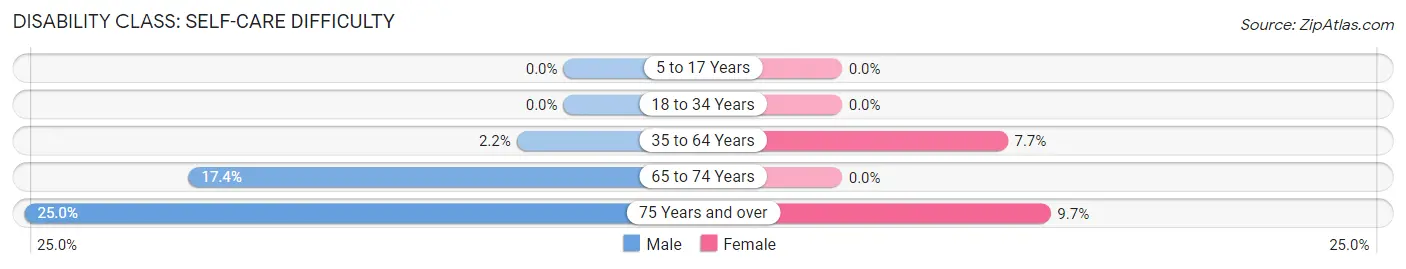
| Age Bracket | Male | Female |
| 5 to 17 Years | 0 (0.0%) | 0 (0.0%) |
| 18 to 34 Years | 0 (0.0%) | 0 (0.0%) |
| 35 to 64 Years | 2 (2.2%) | 9 (7.7%) |
| 65 to 74 Years | 8 (17.4%) | 0 (0.0%) |
| 75 Years and over | 5 (25.0%) | 3 (9.7%) |
Technology Access in Sherman
Computing Device Access in Sherman
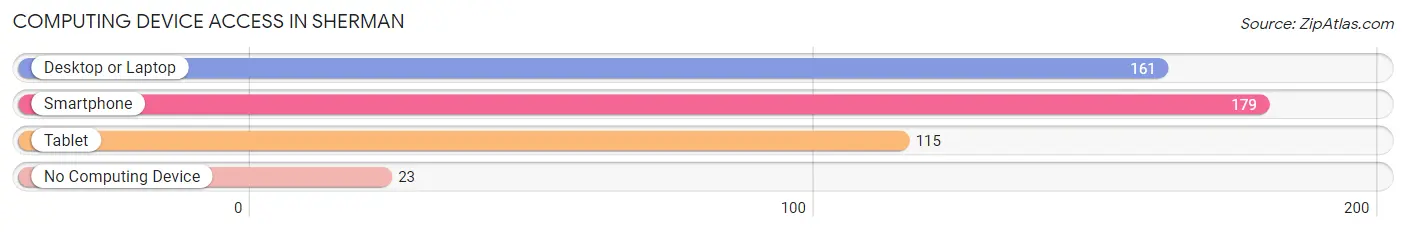
| Device Type | # Households | % Households |
| Desktop or Laptop | 161 | 66.3% |
| Smartphone | 179 | 73.7% |
| Tablet | 115 | 47.3% |
| No Computing Device | 23 | 9.5% |
| Total | 243 | 100.0% |
Internet Access in Sherman
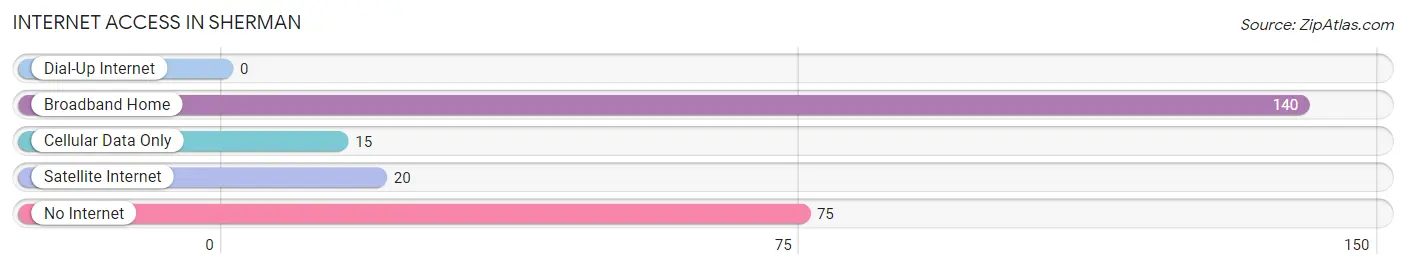
| Internet Type | # Households | % Households |
| Dial-Up Internet | 0 | 0.0% |
| Broadband Home | 140 | 57.6% |
| Cellular Data Only | 15 | 6.2% |
| Satellite Internet | 20 | 8.2% |
| No Internet | 75 | 30.9% |
| Total | 243 | 100.0% |
Sherman Summary
Sherman, New York is a small town located in the western part of Chautauqua County, New York. It is situated on the banks of the Conewango Creek, which is a tributary of the Allegheny River. The town was founded in 1820 and was named after General William Tecumseh Sherman, who was a prominent Union general during the American Civil War. The town has a population of approximately 1,400 people and covers an area of about 10 square miles.
Geography
Sherman is located in the western part of Chautauqua County, New York. It is situated on the banks of the Conewango Creek, which is a tributary of the Allegheny River. The town is located in the foothills of the Appalachian Mountains and is surrounded by rolling hills and forests. The town is located approximately 30 miles south of Buffalo and 60 miles east of Cleveland.
The climate in Sherman is generally mild, with cold winters and warm summers. The average annual temperature is around 50 degrees Fahrenheit. The average annual precipitation is around 40 inches.
Economy
The economy of Sherman is largely based on agriculture and tourism. The town is home to several small farms, which produce a variety of crops, including corn, soybeans, wheat, and hay. The town also has several small businesses, including a grocery store, a hardware store, and a few restaurants.
Tourism is an important part of the economy in Sherman. The town is home to several attractions, including the Sherman Historical Society Museum, the Sherman Town Hall, and the Sherman Opera House. The town also hosts several annual events, such as the Sherman Summer Festival and the Sherman Fall Festival.
Demographics
As of the 2010 census, the population of Sherman was 1,400. The racial makeup of the town was 97.3% White, 0.6% African American, 0.3% Native American, 0.3% Asian, 0.1% Pacific Islander, 0.3% from other races, and 1.3% from two or more races. Hispanic or Latino of any race were 1.3% of the population.
The median household income in Sherman was $41,250, and the median family income was $50,000. The per capita income for the town was $20,845. About 10.3% of families and 13.3% of the population were below the poverty line, including 17.3% of those under age 18 and 8.3% of those age 65 or over.
Conclusion
Sherman, New York is a small town located in the western part of Chautauqua County, New York. It is situated on the banks of the Conewango Creek, which is a tributary of the Allegheny River. The town was founded in 1820 and was named after General William Tecumseh Sherman, who was a prominent Union general during the American Civil War. The town has a population of approximately 1,400 people and covers an area of about 10 square miles. The economy of Sherman is largely based on agriculture and tourism. The town is home to several small farms, which produce a variety of crops, including corn, soybeans, wheat, and hay. The town also has several small businesses, including a grocery store, a hardware store, and a few restaurants. The racial makeup of the town was 97.3% White, 0.6% African American, 0.3% Native American, 0.3% Asian, 0.1% Pacific Islander, 0.3% from other races, and 1.3% from two or more races. The median household income in Sherman was $41,250, and the median family income was $50,000. Sherman is a small town with a rich history and a vibrant economy.
Common Questions
What is Per Capita Income in Sherman?
Per Capita income in Sherman is $28,035.
What is the Median Family Income in Sherman?
Median Family Income in Sherman is $61,875.
What is the Median Household income in Sherman?
Median Household Income in Sherman is $39,464.
What is Income or Wage Gap in Sherman?
Income or Wage Gap in Sherman is 7.1%.
Women in Sherman earn 92.9 cents for every dollar earned by a man.
What is Inequality or Gini Index in Sherman?
Inequality or Gini Index in Sherman is 0.51.
What is the Total Population of Sherman?
Total Population of Sherman is 567.
What is the Total Male Population of Sherman?
Total Male Population of Sherman is 287.
What is the Total Female Population of Sherman?
Total Female Population of Sherman is 280.
What is the Ratio of Males per 100 Females in Sherman?
There are 102.50 Males per 100 Females in Sherman.
What is the Ratio of Females per 100 Males in Sherman?
There are 97.56 Females per 100 Males in Sherman.
What is the Median Population Age in Sherman?
Median Population Age in Sherman is 39.6 Years.
What is the Average Family Size in Sherman
Average Family Size in Sherman is 3.4 People.
What is the Average Household Size in Sherman
Average Household Size in Sherman is 2.3 People.
How Large is the Labor Force in Sherman?
There are 232 People in the Labor Forcein in Sherman.
What is the Percentage of People in the Labor Force in Sherman?
53.3% of People are in the Labor Force in Sherman.
What is the Unemployment Rate in Sherman?
Unemployment Rate in Sherman is 3.0%.