Seneca Knolls, NY Map & Demographics
Seneca Knolls Map
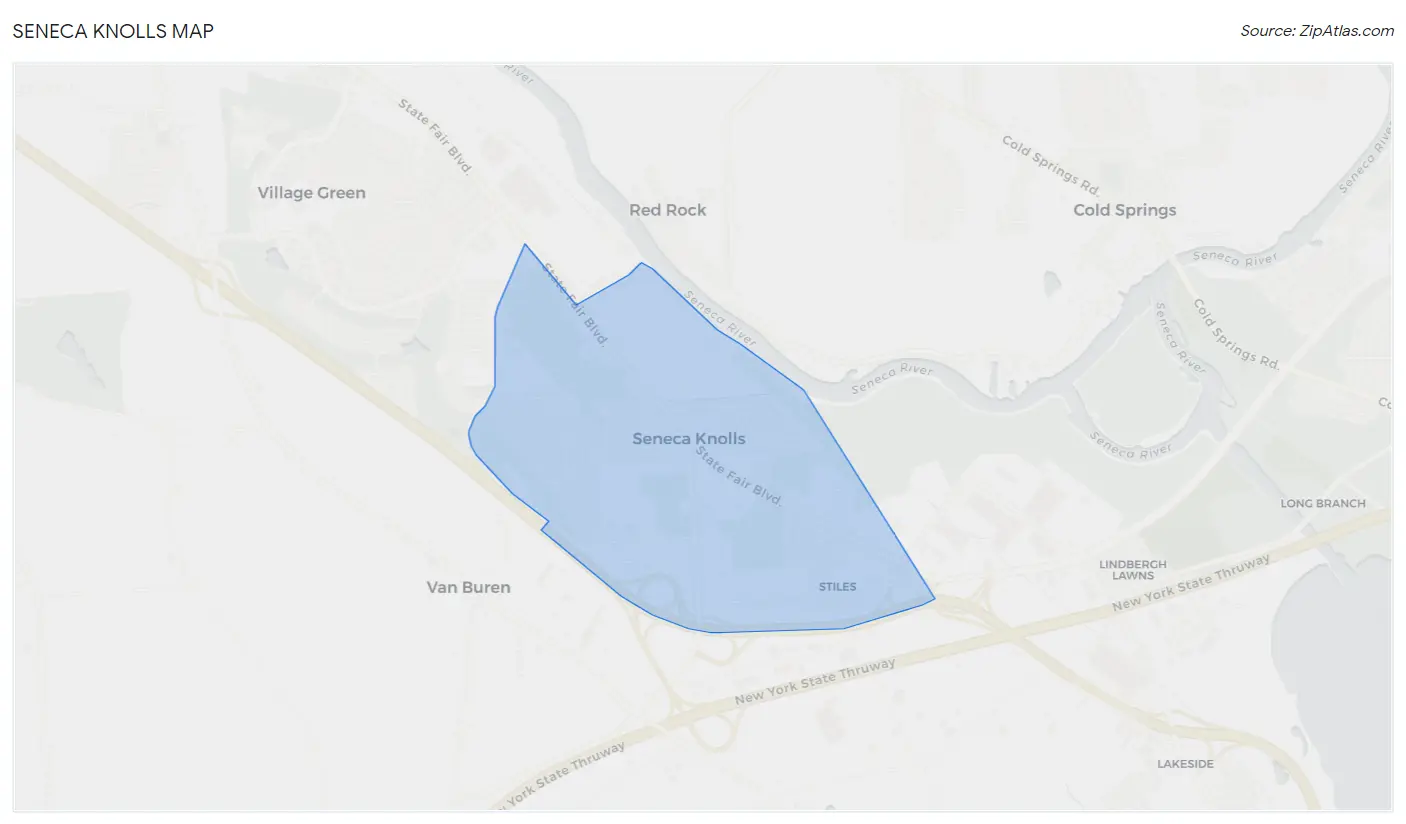
Seneca Knolls Overview
$31,256
PER CAPITA INCOME
$72,067
AVG FAMILY INCOME
$54,011
AVG HOUSEHOLD INCOME
10.9%
WAGE / INCOME GAP [ % ]
89.1¢/ $1
WAGE / INCOME GAP [ $ ]
0.39
INEQUALITY / GINI INDEX
2,085
TOTAL POPULATION
918
MALE POPULATION
1,167
FEMALE POPULATION
78.66
MALES / 100 FEMALES
127.12
FEMALES / 100 MALES
56.6
MEDIAN AGE
2.6
AVG FAMILY SIZE
2.1
AVG HOUSEHOLD SIZE
1,027
LABOR FORCE [ PEOPLE ]
52.4%
PERCENT IN LABOR FORCE
10.0%
UNEMPLOYMENT RATE
Income in Seneca Knolls
Income Overview in Seneca Knolls
Per Capita Income in Seneca Knolls is $31,256, while median incomes of families and households are $72,067 and $54,011 respectively.
| Characteristic | Number | Measure |
| Per Capita Income | 2,085 | $31,256 |
| Median Family Income | 632 | $72,067 |
| Mean Family Income | 632 | $76,736 |
| Median Household Income | 977 | $54,011 |
| Mean Household Income | 977 | $63,974 |
| Income Deficit | 632 | $0 |
| Wage / Income Gap (%) | 2,085 | 10.88% |
| Wage / Income Gap ($) | 2,085 | 89.12¢ per $1 |
| Gini / Inequality Index | 2,085 | 0.39 |
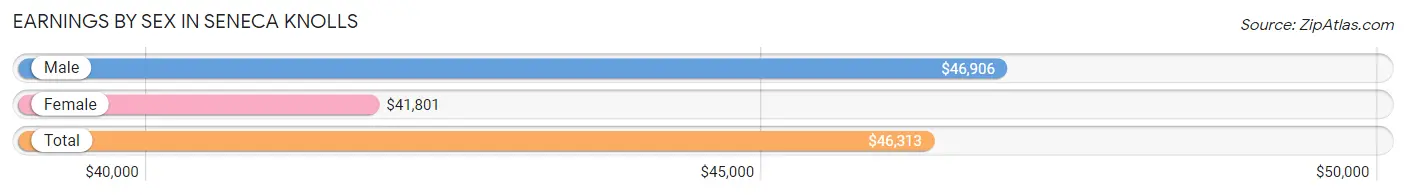
Earnings by Sex in Seneca Knolls
Average Earnings in Seneca Knolls are $46,313, $46,906 for men and $41,801 for women, a difference of 10.9%.
| Sex | Number | Average Earnings |
| Male | 511 (53.8%) | $46,906 |
| Female | 439 (46.2%) | $41,801 |
| Total | 950 (100.0%) | $46,313 |
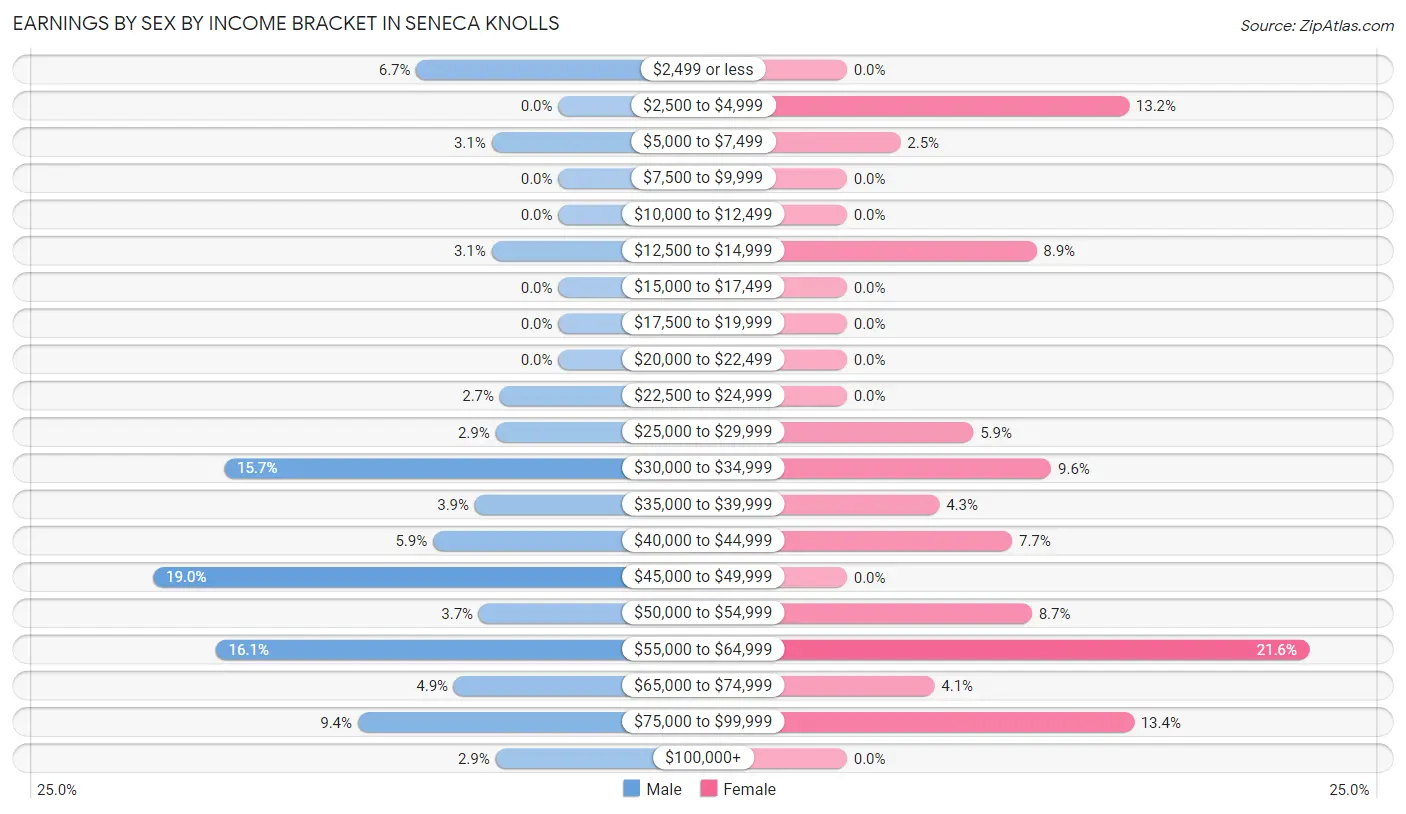
Earnings by Sex by Income Bracket in Seneca Knolls
The most common earnings brackets in Seneca Knolls are $45,000 to $49,999 for men (97 | 19.0%) and $55,000 to $64,999 for women (95 | 21.6%).
| Income | Male | Female |
| $2,499 or less | 34 (6.7%) | 0 (0.0%) |
| $2,500 to $4,999 | 0 (0.0%) | 58 (13.2%) |
| $5,000 to $7,499 | 16 (3.1%) | 11 (2.5%) |
| $7,500 to $9,999 | 0 (0.0%) | 0 (0.0%) |
| $10,000 to $12,499 | 0 (0.0%) | 0 (0.0%) |
| $12,500 to $14,999 | 16 (3.1%) | 39 (8.9%) |
| $15,000 to $17,499 | 0 (0.0%) | 0 (0.0%) |
| $17,500 to $19,999 | 0 (0.0%) | 0 (0.0%) |
| $20,000 to $22,499 | 0 (0.0%) | 0 (0.0%) |
| $22,500 to $24,999 | 14 (2.7%) | 0 (0.0%) |
| $25,000 to $29,999 | 15 (2.9%) | 26 (5.9%) |
| $30,000 to $34,999 | 80 (15.7%) | 42 (9.6%) |
| $35,000 to $39,999 | 20 (3.9%) | 19 (4.3%) |
| $40,000 to $44,999 | 30 (5.9%) | 34 (7.7%) |
| $45,000 to $49,999 | 97 (19.0%) | 0 (0.0%) |
| $50,000 to $54,999 | 19 (3.7%) | 38 (8.7%) |
| $55,000 to $64,999 | 82 (16.1%) | 95 (21.6%) |
| $65,000 to $74,999 | 25 (4.9%) | 18 (4.1%) |
| $75,000 to $99,999 | 48 (9.4%) | 59 (13.4%) |
| $100,000+ | 15 (2.9%) | 0 (0.0%) |
| Total | 511 (100.0%) | 439 (100.0%) |
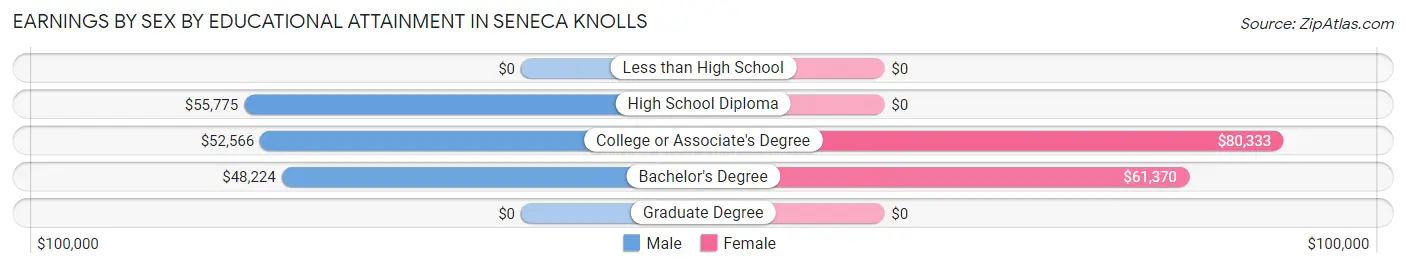
Earnings by Sex by Educational Attainment in Seneca Knolls
Average earnings in Seneca Knolls are $48,553 for men and $54,306 for women, a difference of 10.6%. Men with an educational attainment of high school diploma enjoy the highest average annual earnings of $55,775, while those with bachelor's degree education earn the least with $48,224. Women with an educational attainment of college or associate's degree earn the most with the average annual earnings of $80,333, while those with bachelor's degree education have the smallest earnings of $61,370.
| Educational Attainment | Male Income | Female Income |
| Less than High School | - | - |
| High School Diploma | $55,775 | $0 |
| College or Associate's Degree | $52,566 | $80,333 |
| Bachelor's Degree | $48,224 | $61,370 |
| Graduate Degree | - | - |
| Total | $48,553 | $54,306 |
Family Income in Seneca Knolls
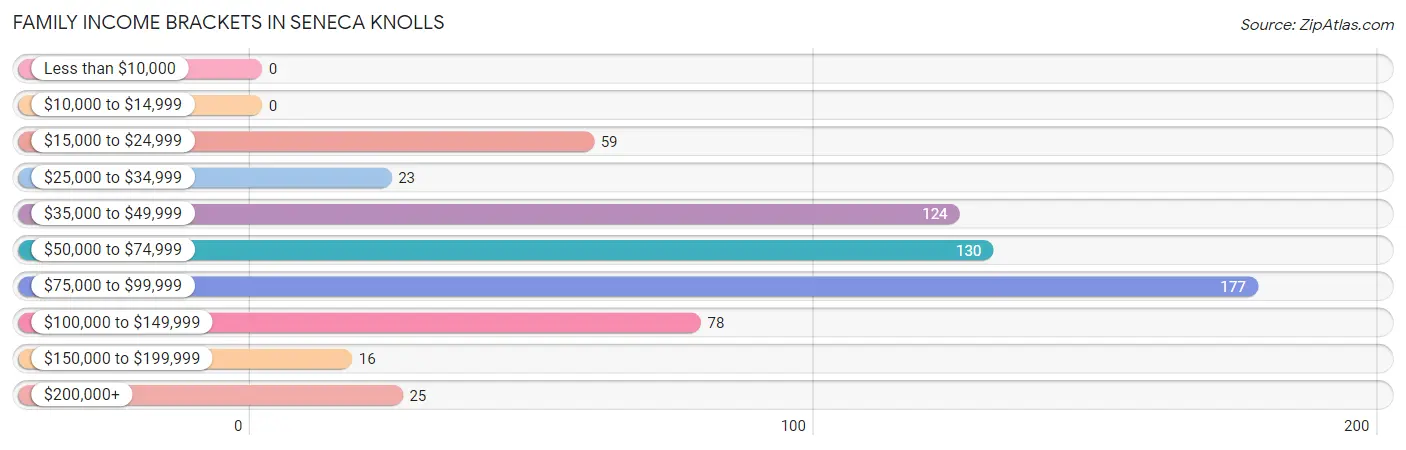
Family Income Brackets in Seneca Knolls
According to the Seneca Knolls family income data, there are 177 families falling into the $75,000 to $99,999 income range, which is the most common income bracket and makes up 28.0% of all families.
| Income Bracket | # Families | % Families |
| Less than $10,000 | 0 | 0.0% |
| $10,000 to $14,999 | 0 | 0.0% |
| $15,000 to $24,999 | 59 | 9.3% |
| $25,000 to $34,999 | 23 | 3.6% |
| $35,000 to $49,999 | 124 | 19.6% |
| $50,000 to $74,999 | 130 | 20.6% |
| $75,000 to $99,999 | 177 | 28.0% |
| $100,000 to $149,999 | 78 | 12.3% |
| $150,000 to $199,999 | 16 | 2.5% |
| $200,000+ | 25 | 4.0% |
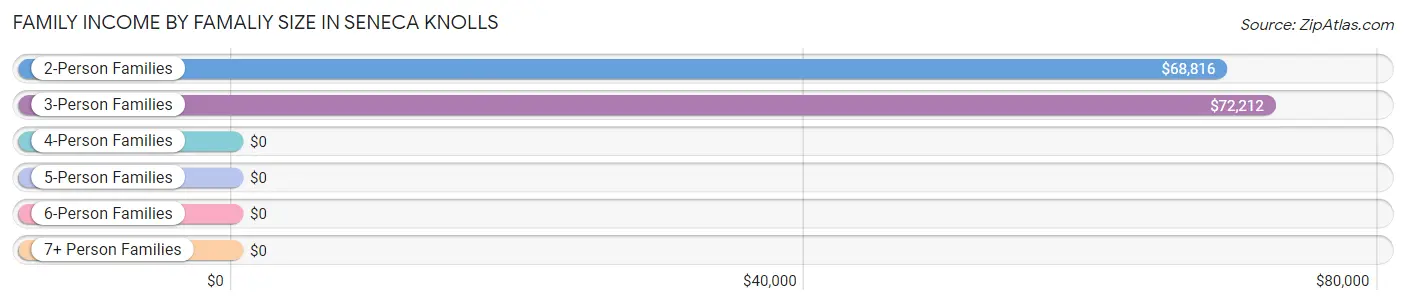
Family Income by Famaliy Size in Seneca Knolls
3-person families (194 | 30.7%) account for the highest median family income in Seneca Knolls with $72,212 per family, while 2-person families (402 | 63.6%) have the highest median income of $34,408 per family member.
| Income Bracket | # Families | Median Income |
| 2-Person Families | 402 (63.6%) | $68,816 |
| 3-Person Families | 194 (30.7%) | $72,212 |
| 4-Person Families | 24 (3.8%) | $0 |
| 5-Person Families | 0 (0.0%) | $0 |
| 6-Person Families | 0 (0.0%) | $0 |
| 7+ Person Families | 12 (1.9%) | $0 |
| Total | 632 (100.0%) | $72,067 |
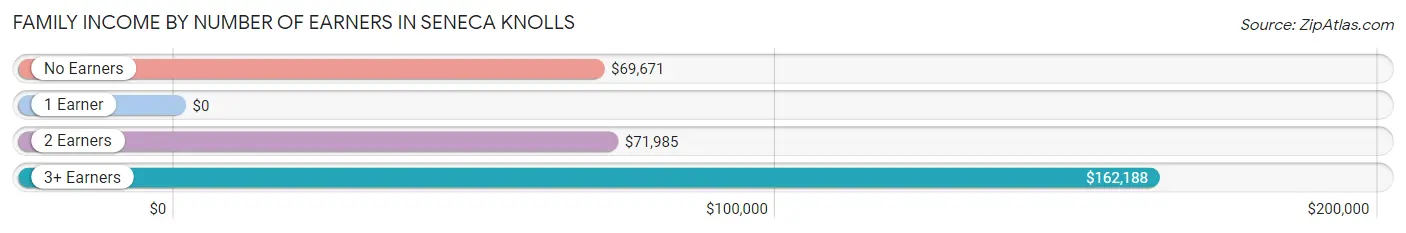
Family Income by Number of Earners in Seneca Knolls
| Number of Earners | # Families | Median Income |
| No Earners | 175 (27.7%) | $69,671 |
| 1 Earner | 235 (37.2%) | $0 |
| 2 Earners | 168 (26.6%) | $71,985 |
| 3+ Earners | 54 (8.5%) | $162,188 |
| Total | 632 (100.0%) | $72,067 |
Household Income in Seneca Knolls
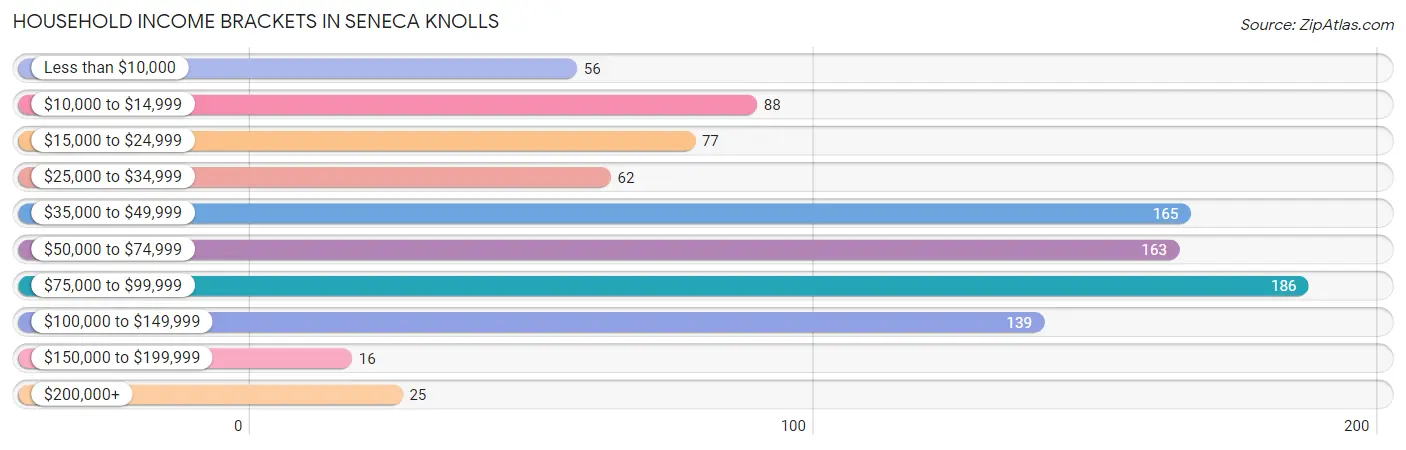
Household Income Brackets in Seneca Knolls
With 186 households falling in the category, the $75,000 to $99,999 income range is the most frequent in Seneca Knolls, accounting for 19.0% of all households. In contrast, only 16 households (1.6%) fall into the $150,000 to $199,999 income bracket, making it the least populous group.
| Income Bracket | # Households | % Households |
| Less than $10,000 | 56 | 5.7% |
| $10,000 to $14,999 | 88 | 9.0% |
| $15,000 to $24,999 | 77 | 7.9% |
| $25,000 to $34,999 | 62 | 6.3% |
| $35,000 to $49,999 | 165 | 16.9% |
| $50,000 to $74,999 | 163 | 16.7% |
| $75,000 to $99,999 | 186 | 19.0% |
| $100,000 to $149,999 | 139 | 14.2% |
| $150,000 to $199,999 | 16 | 1.6% |
| $200,000+ | 25 | 2.6% |
Household Income by Householder Age in Seneca Knolls
The median household income in Seneca Knolls is $54,011, with the highest median household income of $82,549 found in the 25 to 44 years age bracket for the primary householder. A total of 144 households (14.7%) fall into this category. Meanwhile, the 15 to 24 years age bracket for the primary householder has the lowest median household income of $0, with 57 households (5.8%) in this group.
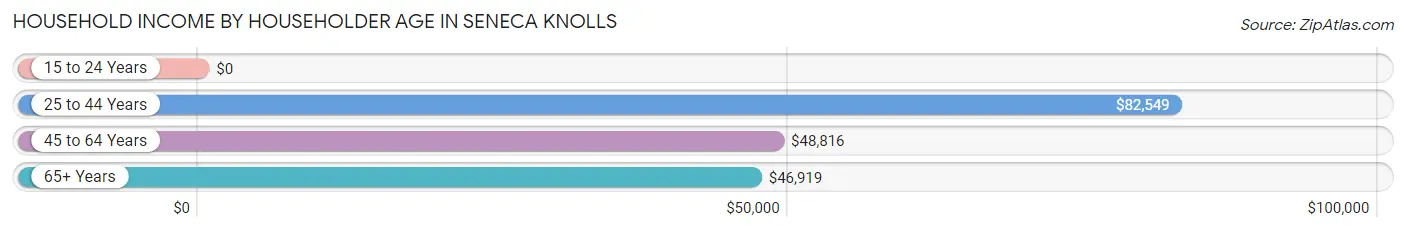
| Income Bracket | # Households | Median Income |
| 15 to 24 Years | 57 (5.8%) | $0 |
| 25 to 44 Years | 144 (14.7%) | $82,549 |
| 45 to 64 Years | 488 (49.9%) | $48,816 |
| 65+ Years | 288 (29.5%) | $46,919 |
| Total | 977 (100.0%) | $54,011 |
Poverty in Seneca Knolls
Income Below Poverty by Sex and Age in Seneca Knolls
With 3.0% poverty level for males and 13.7% for females among the residents of Seneca Knolls, 65 to 74 year old males and 35 to 44 year old females are the most vulnerable to poverty, with 14 males (16.9%) and 16 females (47.1%) in their respective age groups living below the poverty level.
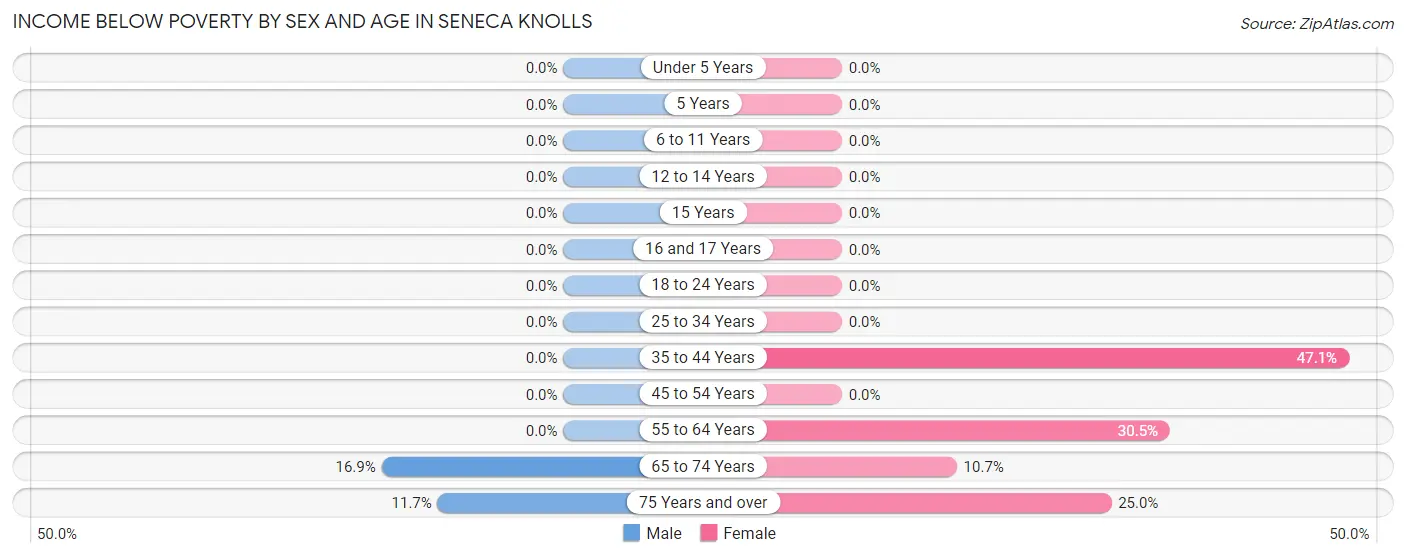
| Age Bracket | Male | Female |
| Under 5 Years | 0 (0.0%) | 0 (0.0%) |
| 5 Years | 0 (0.0%) | 0 (0.0%) |
| 6 to 11 Years | 0 (0.0%) | 0 (0.0%) |
| 12 to 14 Years | 0 (0.0%) | 0 (0.0%) |
| 15 Years | 0 (0.0%) | 0 (0.0%) |
| 16 and 17 Years | 0 (0.0%) | 0 (0.0%) |
| 18 to 24 Years | 0 (0.0%) | 0 (0.0%) |
| 25 to 34 Years | 0 (0.0%) | 0 (0.0%) |
| 35 to 44 Years | 0 (0.0%) | 16 (47.1%) |
| 45 to 54 Years | 0 (0.0%) | 0 (0.0%) |
| 55 to 64 Years | 0 (0.0%) | 109 (30.4%) |
| 65 to 74 Years | 14 (16.9%) | 21 (10.7%) |
| 75 Years and over | 14 (11.7%) | 14 (25.0%) |
| Total | 28 (3.0%) | 160 (13.7%) |
Income Above Poverty by Sex and Age in Seneca Knolls
According to the poverty statistics in Seneca Knolls, males aged under 5 years and females aged under 5 years are the age groups that are most secure financially, with 100.0% of males and 100.0% of females in these age groups living above the poverty line.
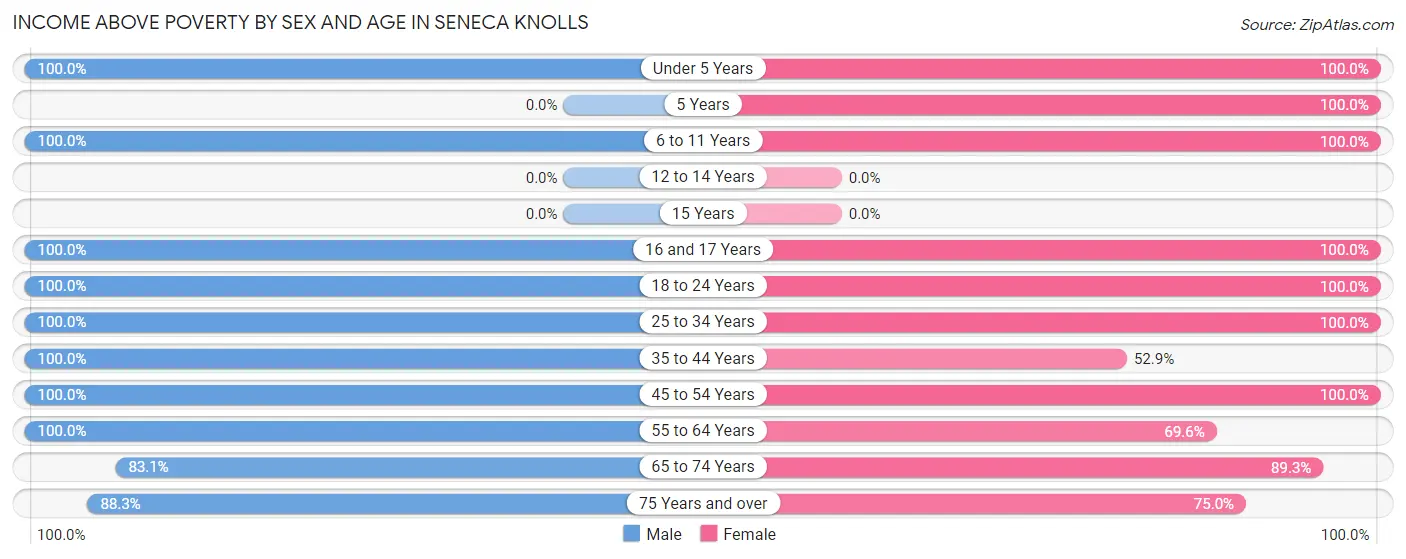
| Age Bracket | Male | Female |
| Under 5 Years | 23 (100.0%) | 63 (100.0%) |
| 5 Years | 0 (0.0%) | 12 (100.0%) |
| 6 to 11 Years | 11 (100.0%) | 17 (100.0%) |
| 12 to 14 Years | 0 (0.0%) | 0 (0.0%) |
| 15 Years | 0 (0.0%) | 0 (0.0%) |
| 16 and 17 Years | 13 (100.0%) | 13 (100.0%) |
| 18 to 24 Years | 81 (100.0%) | 205 (100.0%) |
| 25 to 34 Years | 106 (100.0%) | 84 (100.0%) |
| 35 to 44 Years | 128 (100.0%) | 18 (52.9%) |
| 45 to 54 Years | 73 (100.0%) | 128 (100.0%) |
| 55 to 64 Years | 280 (100.0%) | 249 (69.6%) |
| 65 to 74 Years | 69 (83.1%) | 176 (89.3%) |
| 75 Years and over | 106 (88.3%) | 42 (75.0%) |
| Total | 890 (97.0%) | 1,007 (86.3%) |
Income Below Poverty Among Married-Couple Families in Seneca Knolls
The poverty statistics for married-couple families in Seneca Knolls show that 2.8% or 14 of the total 506 families live below the poverty line. Families with no children have the highest poverty rate of 2.9%, comprising of 14 families. On the other hand, families with 1 or 2 children have the lowest poverty rate of 0.0%, which includes 0 families.
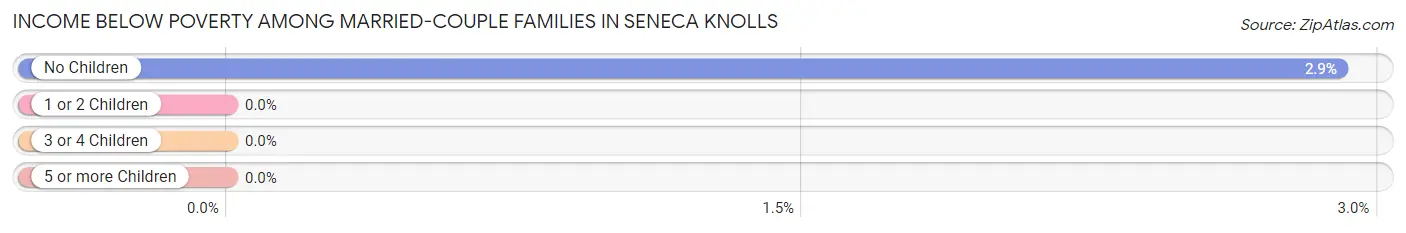
| Children | Above Poverty | Below Poverty |
| No Children | 469 (97.1%) | 14 (2.9%) |
| 1 or 2 Children | 23 (100.0%) | 0 (0.0%) |
| 3 or 4 Children | 0 (0.0%) | 0 (0.0%) |
| 5 or more Children | 0 (0.0%) | 0 (0.0%) |
| Total | 492 (97.2%) | 14 (2.8%) |
Income Below Poverty Among Single-Parent Households in Seneca Knolls
| Children | Single Father | Single Mother |
| No Children | 0 (0.0%) | 0 (0.0%) |
| 1 or 2 Children | 0 (0.0%) | 0 (0.0%) |
| 3 or 4 Children | 0 (0.0%) | 0 (0.0%) |
| 5 or more Children | 0 (0.0%) | 0 (0.0%) |
| Total | 0 (0.0%) | 0 (0.0%) |
Income Below Poverty Among Married-Couple vs Single-Parent Households in Seneca Knolls
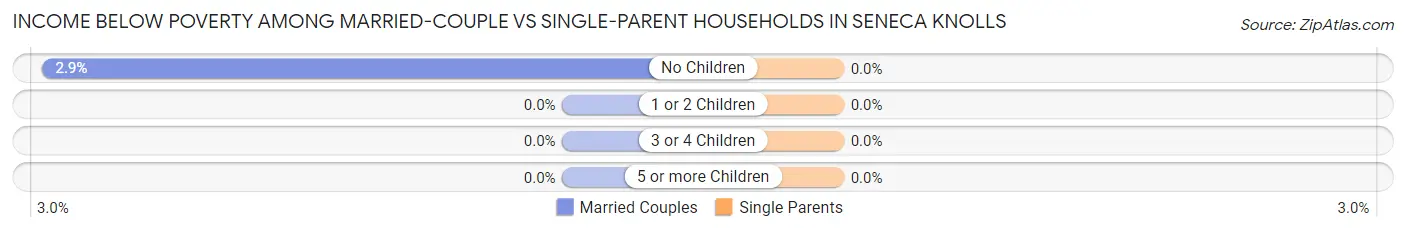
| Children | Married-Couple Families | Single-Parent Households |
| No Children | 14 (2.9%) | 0 (0.0%) |
| 1 or 2 Children | 0 (0.0%) | 0 (0.0%) |
| 3 or 4 Children | 0 (0.0%) | 0 (0.0%) |
| 5 or more Children | 0 (0.0%) | 0 (0.0%) |
| Total | 14 (2.8%) | 0 (0.0%) |
Race in Seneca Knolls
The most populous races in Seneca Knolls are White / Caucasian (1,921 | 92.1%), and Two or more Races (164 | 7.9%).
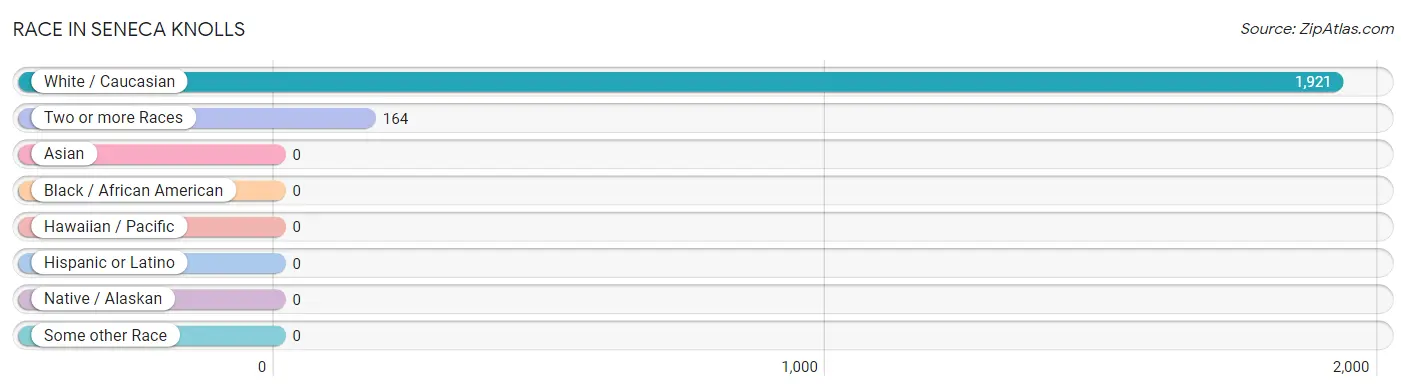
| Race | # Population | % Population |
| Asian | 0 | 0.0% |
| Black / African American | 0 | 0.0% |
| Hawaiian / Pacific | 0 | 0.0% |
| Hispanic or Latino | 0 | 0.0% |
| Native / Alaskan | 0 | 0.0% |
| White / Caucasian | 1,921 | 92.1% |
| Two or more Races | 164 | 7.9% |
| Some other Race | 0 | 0.0% |
| Total | 2,085 | 100.0% |
Ancestry in Seneca Knolls
The most populous ancestries reported in Seneca Knolls are Irish (389 | 18.7%), German (373 | 17.9%), English (198 | 9.5%), Italian (195 | 9.3%), and Scandinavian (159 | 7.6%), together accounting for 63.0% of all Seneca Knolls residents.
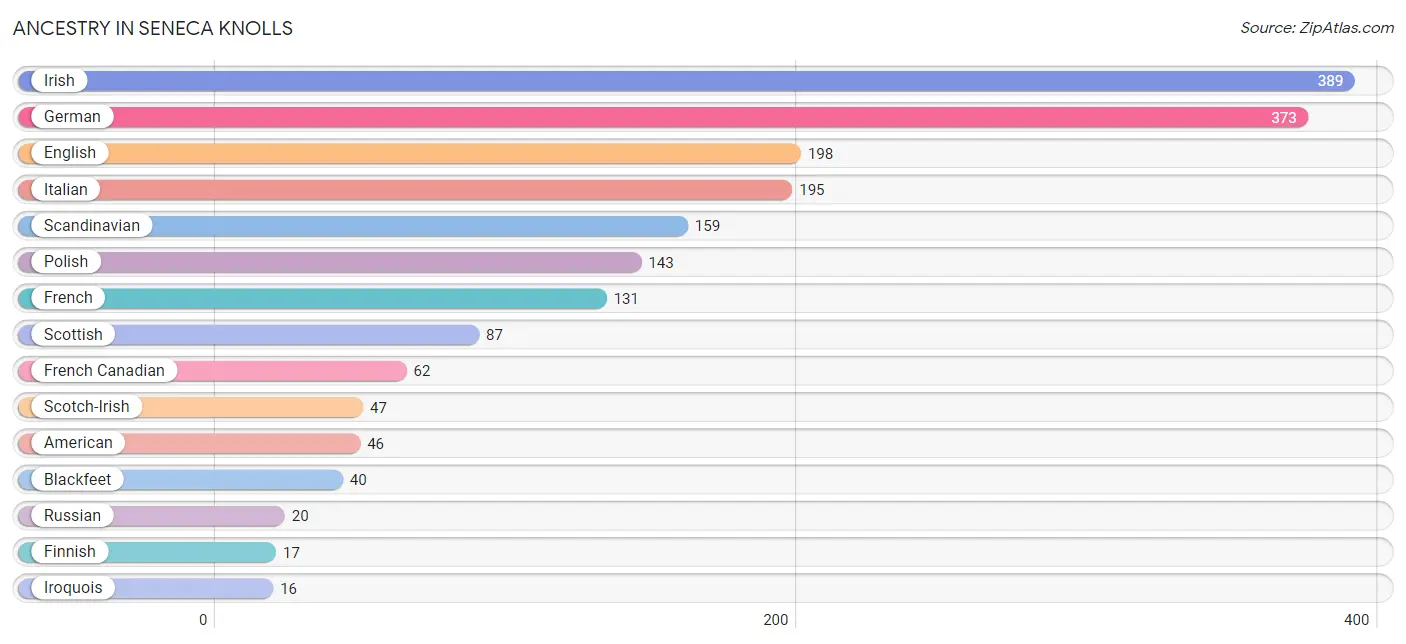
| Ancestry | # Population | % Population |
| American | 46 | 2.2% |
| Arab | 13 | 0.6% |
| Blackfeet | 40 | 1.9% |
| English | 198 | 9.5% |
| European | 13 | 0.6% |
| Finnish | 17 | 0.8% |
| French | 131 | 6.3% |
| French Canadian | 62 | 3.0% |
| German | 373 | 17.9% |
| Irish | 389 | 18.7% |
| Iroquois | 16 | 0.8% |
| Italian | 195 | 9.3% |
| Moroccan | 13 | 0.6% |
| Norwegian | 14 | 0.7% |
| Polish | 143 | 6.9% |
| Russian | 20 | 1.0% |
| Scandinavian | 159 | 7.6% |
| Scotch-Irish | 47 | 2.2% |
| Scottish | 87 | 4.2% | View All 19 Rows |
Immigrants in Seneca Knolls
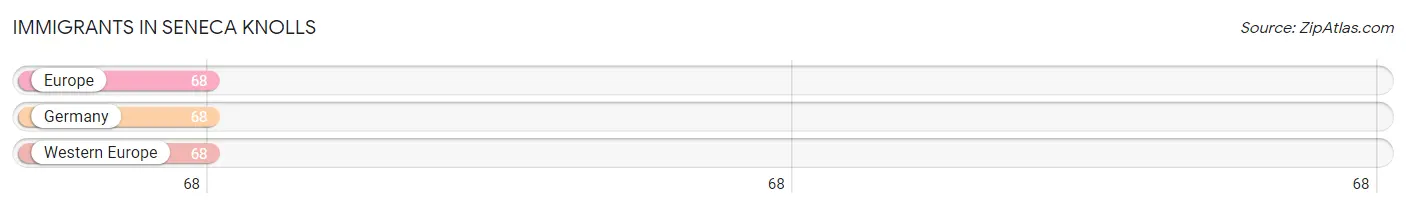
The most numerous immigrant groups reported in Seneca Knolls came from Europe (68 | 3.3%), Germany (68 | 3.3%), and Western Europe (68 | 3.3%), together accounting for 9.8% of all Seneca Knolls residents.
| Immigration Origin | # Population | % Population |
| Europe | 68 | 3.3% |
| Germany | 68 | 3.3% |
| Western Europe | 68 | 3.3% | View All 3 Rows |
Sex and Age in Seneca Knolls
Sex and Age in Seneca Knolls
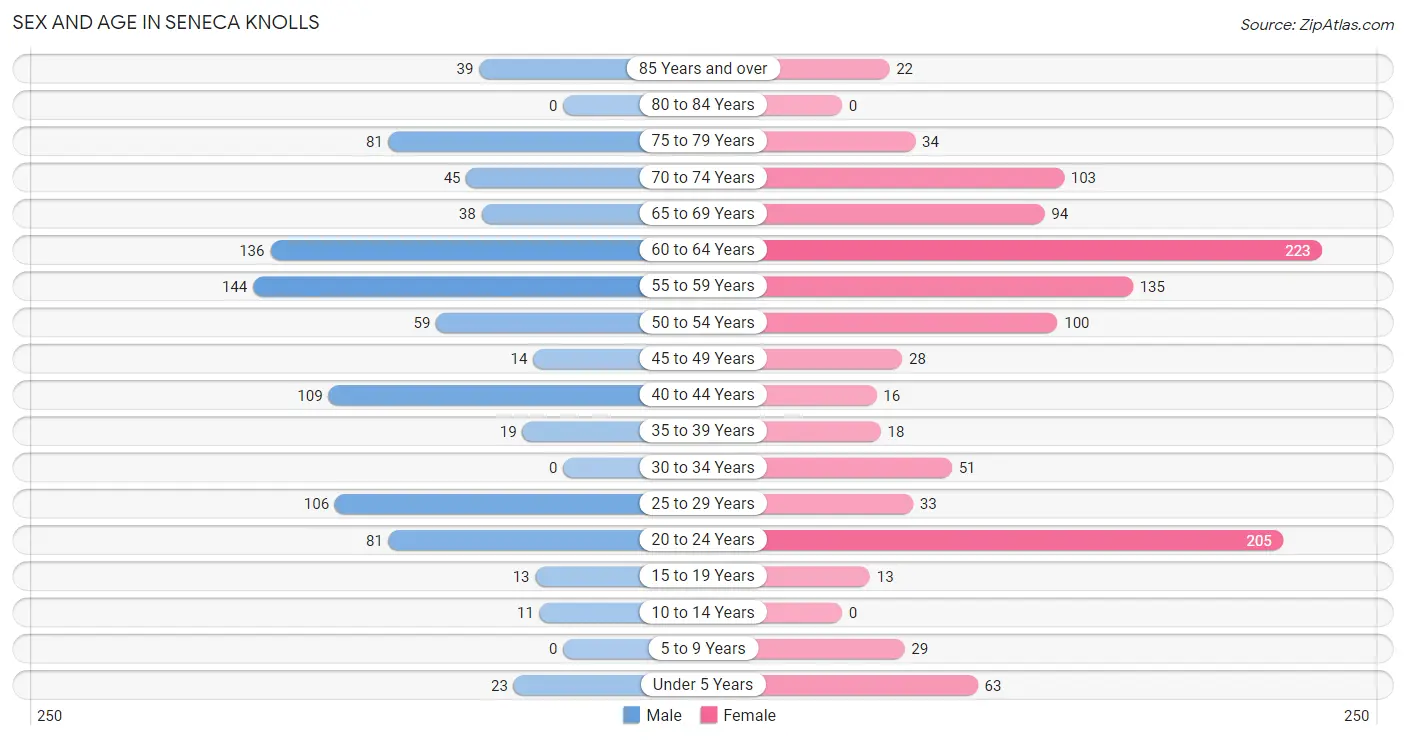
The most populous age groups in Seneca Knolls are 55 to 59 Years (144 | 15.7%) for men and 60 to 64 Years (223 | 19.1%) for women.
| Age Bracket | Male | Female |
| Under 5 Years | 23 (2.5%) | 63 (5.4%) |
| 5 to 9 Years | 0 (0.0%) | 29 (2.5%) |
| 10 to 14 Years | 11 (1.2%) | 0 (0.0%) |
| 15 to 19 Years | 13 (1.4%) | 13 (1.1%) |
| 20 to 24 Years | 81 (8.8%) | 205 (17.6%) |
| 25 to 29 Years | 106 (11.6%) | 33 (2.8%) |
| 30 to 34 Years | 0 (0.0%) | 51 (4.4%) |
| 35 to 39 Years | 19 (2.1%) | 18 (1.5%) |
| 40 to 44 Years | 109 (11.9%) | 16 (1.4%) |
| 45 to 49 Years | 14 (1.5%) | 28 (2.4%) |
| 50 to 54 Years | 59 (6.4%) | 100 (8.6%) |
| 55 to 59 Years | 144 (15.7%) | 135 (11.6%) |
| 60 to 64 Years | 136 (14.8%) | 223 (19.1%) |
| 65 to 69 Years | 38 (4.1%) | 94 (8.1%) |
| 70 to 74 Years | 45 (4.9%) | 103 (8.8%) |
| 75 to 79 Years | 81 (8.8%) | 34 (2.9%) |
| 80 to 84 Years | 0 (0.0%) | 0 (0.0%) |
| 85 Years and over | 39 (4.3%) | 22 (1.9%) |
| Total | 918 (100.0%) | 1,167 (100.0%) |
Families and Households in Seneca Knolls
Median Family Size in Seneca Knolls
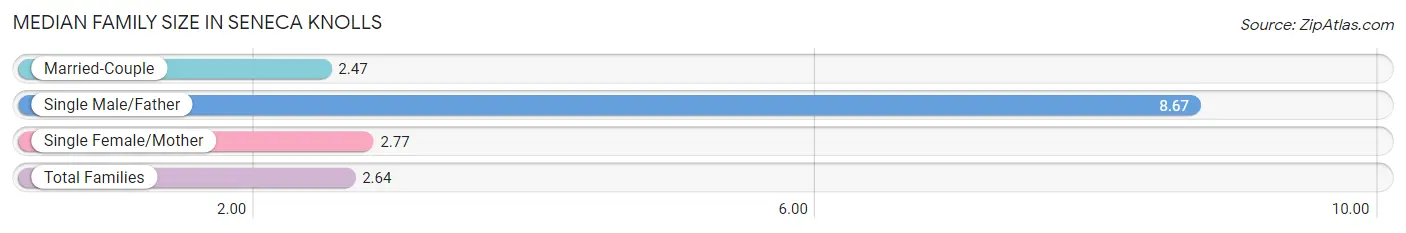
The median family size in Seneca Knolls is 2.64 persons per family, with single male/father families (12 | 1.9%) accounting for the largest median family size of 8.67 persons per family. On the other hand, married-couple families (506 | 80.1%) represent the smallest median family size with 2.47 persons per family.
| Family Type | # Families | Family Size |
| Married-Couple | 506 (80.1%) | 2.47 |
| Single Male/Father | 12 (1.9%) | 8.67 |
| Single Female/Mother | 114 (18.0%) | 2.77 |
| Total Families | 632 (100.0%) | 2.64 |
Median Household Size in Seneca Knolls
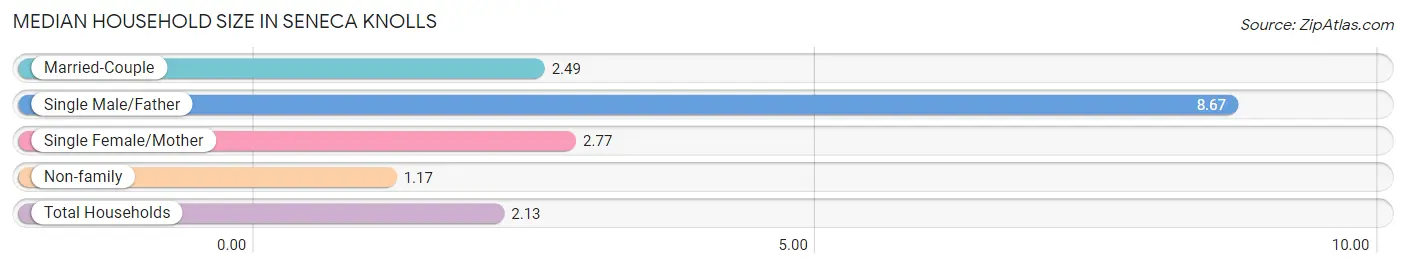
The median household size in Seneca Knolls is 2.13 persons per household, with single male/father households (12 | 1.2%) accounting for the largest median household size of 8.67 persons per household. non-family households (345 | 35.3%) represent the smallest median household size with 1.17 persons per household.
| Household Type | # Households | Household Size |
| Married-Couple | 506 (51.8%) | 2.49 |
| Single Male/Father | 12 (1.2%) | 8.67 |
| Single Female/Mother | 114 (11.7%) | 2.77 |
| Non-family | 345 (35.3%) | 1.17 |
| Total Households | 977 (100.0%) | 2.13 |
Household Size by Marriage Status in Seneca Knolls
Out of a total of 977 households in Seneca Knolls, 632 (64.7%) are family households, while 345 (35.3%) are nonfamily households. The most numerous type of family households are 2-person households, comprising 402, and the most common type of nonfamily households are 1-person households, comprising 291.
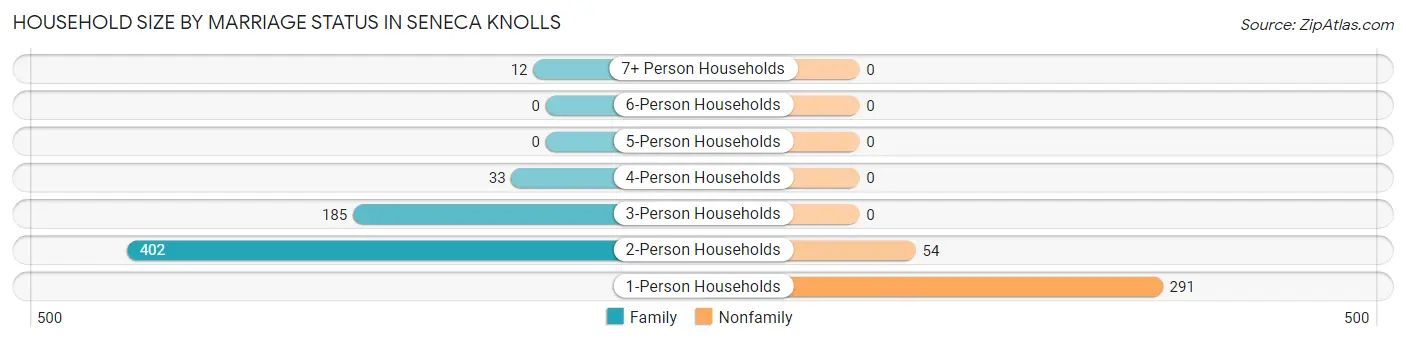
| Household Size | Family Households | Nonfamily Households |
| 1-Person Households | - | 291 (29.8%) |
| 2-Person Households | 402 (41.1%) | 54 (5.5%) |
| 3-Person Households | 185 (18.9%) | 0 (0.0%) |
| 4-Person Households | 33 (3.4%) | 0 (0.0%) |
| 5-Person Households | 0 (0.0%) | 0 (0.0%) |
| 6-Person Households | 0 (0.0%) | 0 (0.0%) |
| 7+ Person Households | 12 (1.2%) | 0 (0.0%) |
| Total | 632 (64.7%) | 345 (35.3%) |
Female Fertility in Seneca Knolls
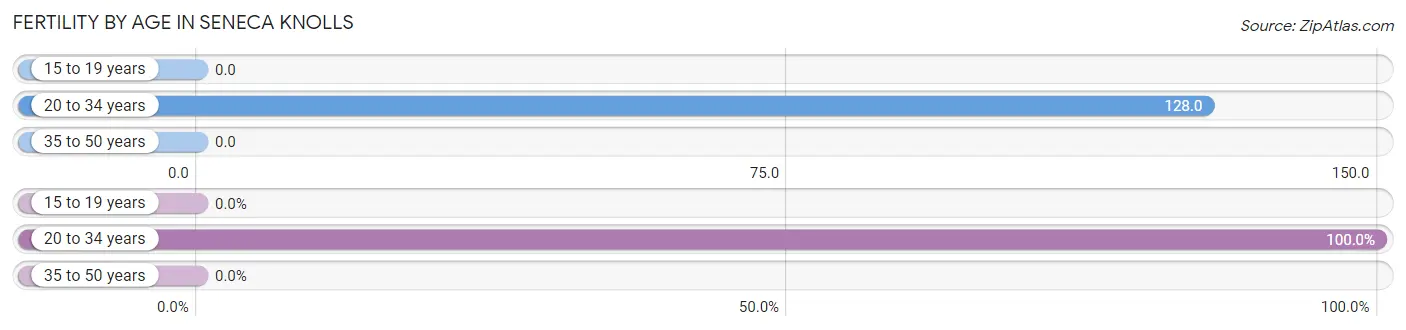
Fertility by Age in Seneca Knolls
Average fertility rate in Seneca Knolls is 98.0 births per 1,000 women. Women in the age bracket of 20 to 34 years have the highest fertility rate with 128.0 births per 1,000 women. Women in the age bracket of 20 to 34 years acount for 100.0% of all women with births.
| Age Bracket | Women with Births | Births / 1,000 Women |
| 15 to 19 years | 0 (0.0%) | 0.0 |
| 20 to 34 years | 37 (100.0%) | 128.0 |
| 35 to 50 years | 0 (0.0%) | 0.0 |
| Total | 37 (100.0%) | 98.0 |
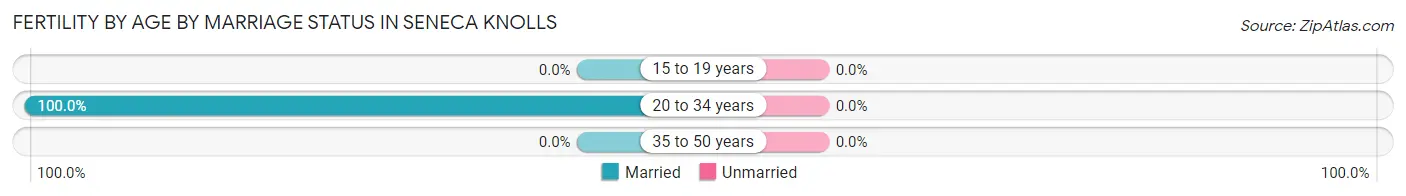
Fertility by Age by Marriage Status in Seneca Knolls
| Age Bracket | Married | Unmarried |
| 15 to 19 years | 0 (0.0%) | 0 (0.0%) |
| 20 to 34 years | 37 (100.0%) | 0 (0.0%) |
| 35 to 50 years | 0 (0.0%) | 0 (0.0%) |
| Total | 37 (100.0%) | 0 (0.0%) |
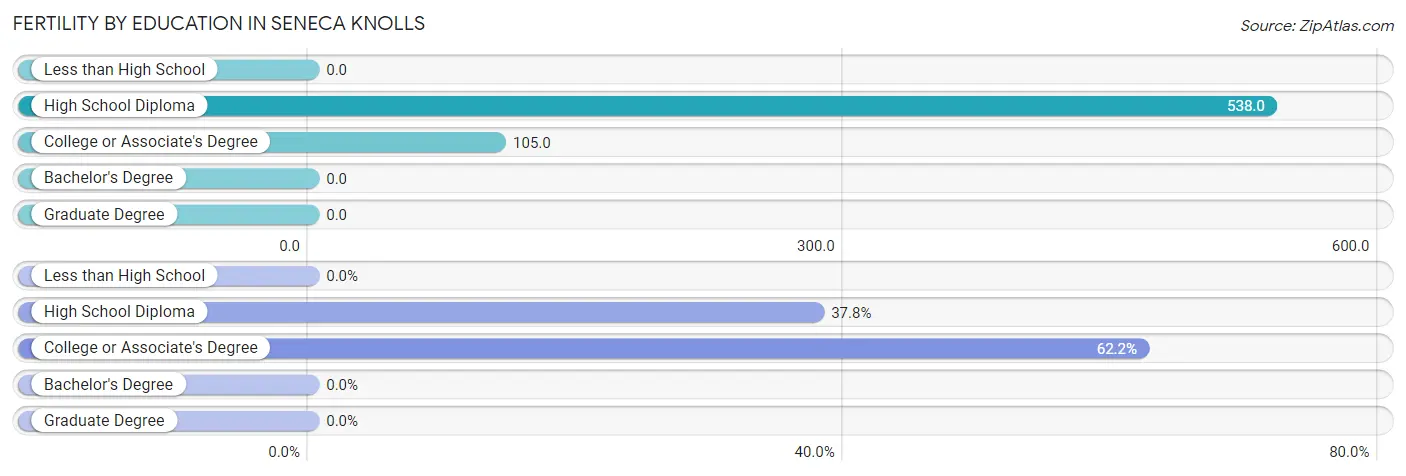
Fertility by Education in Seneca Knolls
| Educational Attainment | Women with Births | Births / 1,000 Women |
| Less than High School | 0 (0.0%) | 0.0 |
| High School Diploma | 14 (37.8%) | 538.0 |
| College or Associate's Degree | 23 (62.2%) | 105.0 |
| Bachelor's Degree | 0 (0.0%) | 0.0 |
| Graduate Degree | 0 (0.0%) | 0.0 |
| Total | 37 (100.0%) | 98.0 |
Fertility by Education by Marriage Status in Seneca Knolls
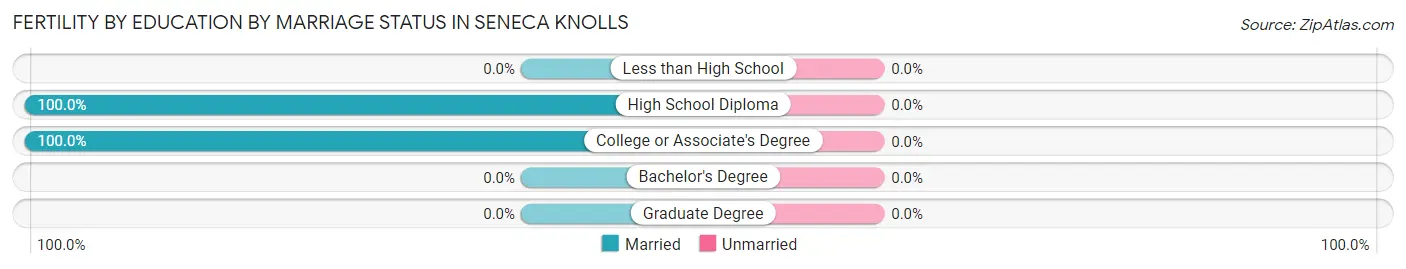
| Educational Attainment | Married | Unmarried |
| Less than High School | 0 (0.0%) | 0 (0.0%) |
| High School Diploma | 14 (100.0%) | 0 (0.0%) |
| College or Associate's Degree | 23 (100.0%) | 0 (0.0%) |
| Bachelor's Degree | 0 (0.0%) | 0 (0.0%) |
| Graduate Degree | 0 (0.0%) | 0 (0.0%) |
| Total | 37 (100.0%) | 0 (0.0%) |
Employment Characteristics in Seneca Knolls
Employment by Class of Employer in Seneca Knolls
Among the 910 employed individuals in Seneca Knolls, private company employees (524 | 57.6%), state government employees (140 | 15.4%), and not-for-profit organizations (121 | 13.3%) make up the most common classes of employment.
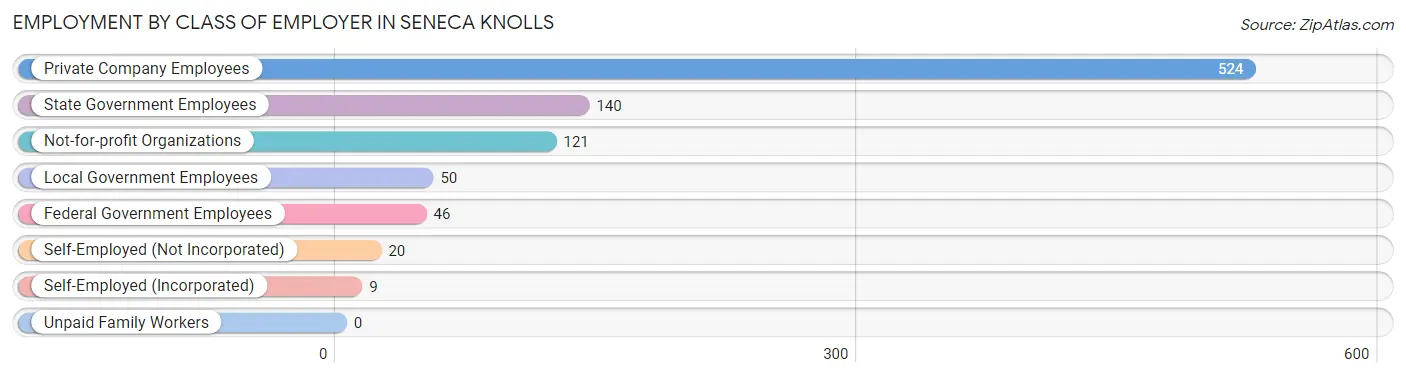
| Employer Class | # Employees | % Employees |
| Private Company Employees | 524 | 57.6% |
| Self-Employed (Incorporated) | 9 | 1.0% |
| Self-Employed (Not Incorporated) | 20 | 2.2% |
| Not-for-profit Organizations | 121 | 13.3% |
| Local Government Employees | 50 | 5.5% |
| State Government Employees | 140 | 15.4% |
| Federal Government Employees | 46 | 5.1% |
| Unpaid Family Workers | 0 | 0.0% |
| Total | 910 | 100.0% |
Employment Status by Age in Seneca Knolls
According to the labor force statistics for Seneca Knolls, out of the total population over 16 years of age (1,959), 52.4% or 1,027 individuals are in the labor force, with 10.0% or 103 of them unemployed. The age group with the highest labor force participation rate is 25 to 29 years, with 100.0% or 139 individuals in the labor force. Within the labor force, the 35 to 44 years age range has the highest percentage of unemployed individuals, with 46.3% or 75 of them being unemployed.
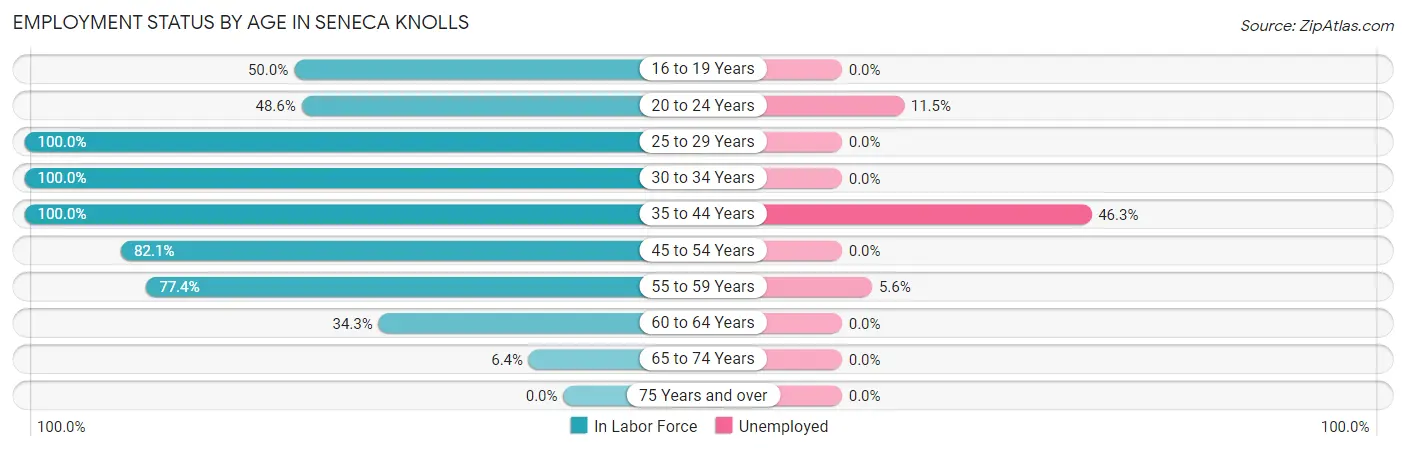
| Age Bracket | In Labor Force | Unemployed |
| 16 to 19 Years | 13 (50.0%) | 0 (0.0%) |
| 20 to 24 Years | 139 (48.6%) | 16 (11.5%) |
| 25 to 29 Years | 139 (100.0%) | 0 (0.0%) |
| 30 to 34 Years | 51 (100.0%) | 0 (0.0%) |
| 35 to 44 Years | 162 (100.0%) | 75 (46.3%) |
| 45 to 54 Years | 165 (82.1%) | 0 (0.0%) |
| 55 to 59 Years | 216 (77.4%) | 12 (5.6%) |
| 60 to 64 Years | 123 (34.3%) | 0 (0.0%) |
| 65 to 74 Years | 18 (6.4%) | 0 (0.0%) |
| 75 Years and over | 0 (0.0%) | 0 (0.0%) |
| Total | 1,027 (52.4%) | 103 (10.0%) |
Employment Status by Educational Attainment in Seneca Knolls
According to labor force statistics for Seneca Knolls, 71.9% of individuals (856) out of the total population between 25 and 64 years of age (1,191) are in the labor force, with 10.2% or 87 of them being unemployed. The group with the highest labor force participation rate are those with the educational attainment of bachelor's degree or higher, with 100.0% or 259 individuals in the labor force. Within the labor force, individuals with college / associate degree education have the highest percentage of unemployment, with 33.2% or 71 of them being unemployed.
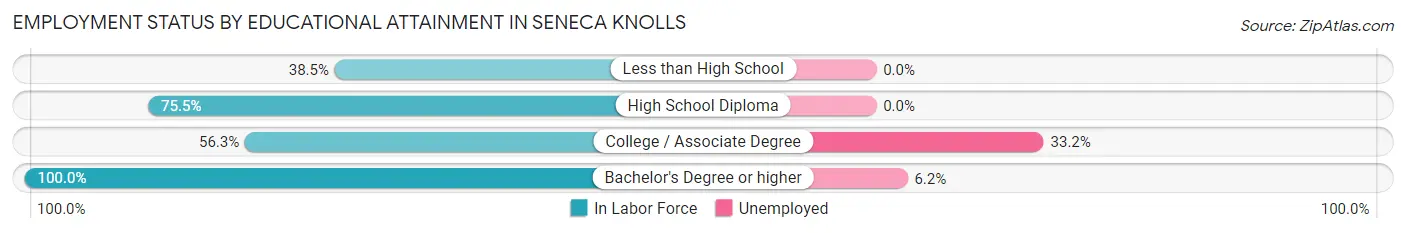
| Educational Attainment | In Labor Force | Unemployed |
| Less than High School | 35 (38.5%) | 0 (0.0%) |
| High School Diploma | 348 (75.5%) | 0 (0.0%) |
| College / Associate Degree | 214 (56.3%) | 126 (33.2%) |
| Bachelor's Degree or higher | 259 (100.0%) | 16 (6.2%) |
| Total | 856 (71.9%) | 121 (10.2%) |
Employment Occupations by Sex in Seneca Knolls
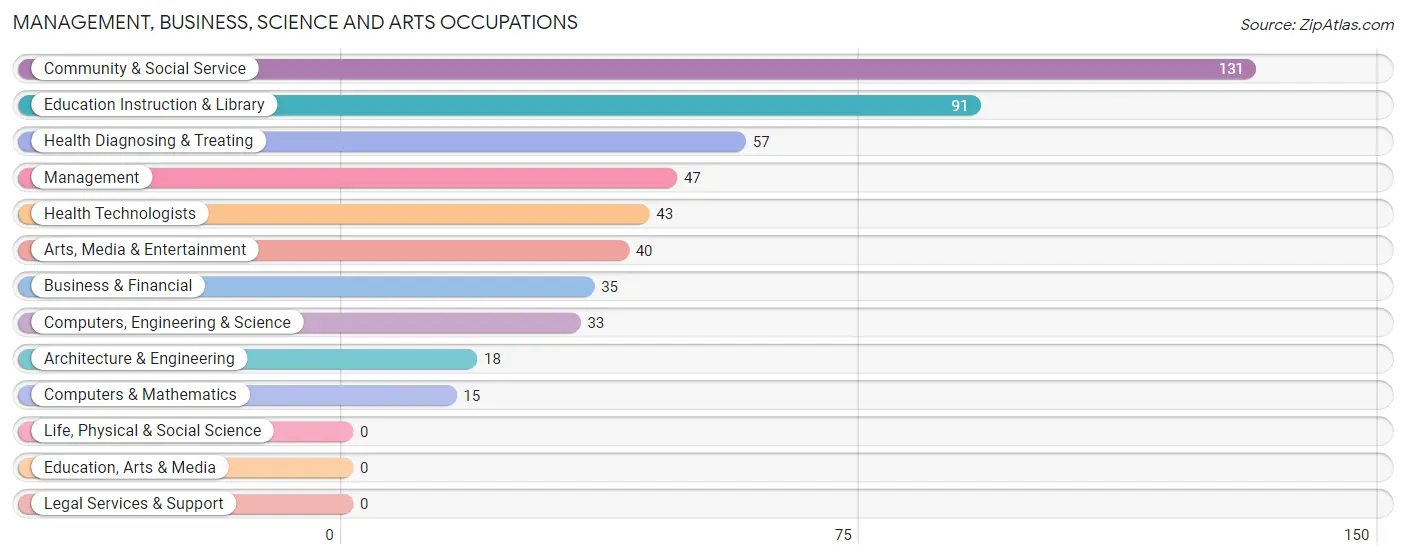
Management, Business, Science and Arts Occupations
The most common Management, Business, Science and Arts occupations in Seneca Knolls are Community & Social Service (131 | 14.2%), Education Instruction & Library (91 | 9.9%), Health Diagnosing & Treating (57 | 6.2%), Management (47 | 5.1%), and Health Technologists (43 | 4.7%).
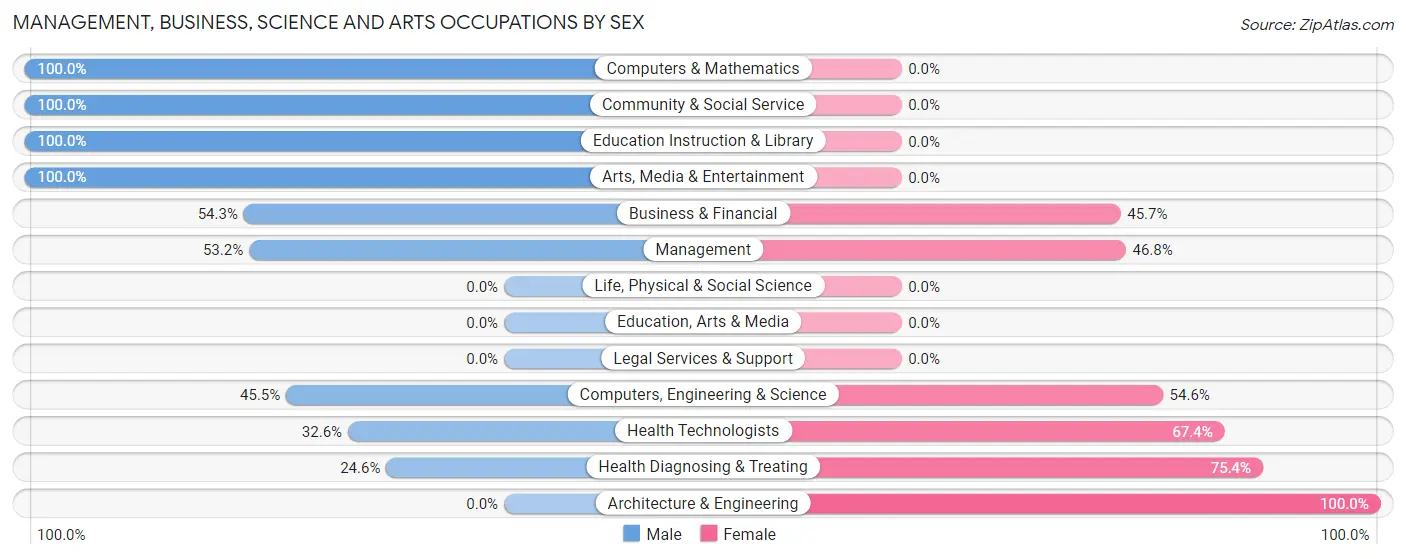
Management, Business, Science and Arts Occupations by Sex
Within the Management, Business, Science and Arts occupations in Seneca Knolls, the most male-oriented occupations are Computers & Mathematics (100.0%), Community & Social Service (100.0%), and Education Instruction & Library (100.0%), while the most female-oriented occupations are Architecture & Engineering (100.0%), Health Diagnosing & Treating (75.4%), and Health Technologists (67.4%).
| Occupation | Male | Female |
| Management | 25 (53.2%) | 22 (46.8%) |
| Business & Financial | 19 (54.3%) | 16 (45.7%) |
| Computers, Engineering & Science | 15 (45.5%) | 18 (54.5%) |
| Computers & Mathematics | 15 (100.0%) | 0 (0.0%) |
| Architecture & Engineering | 0 (0.0%) | 18 (100.0%) |
| Life, Physical & Social Science | 0 (0.0%) | 0 (0.0%) |
| Community & Social Service | 131 (100.0%) | 0 (0.0%) |
| Education, Arts & Media | 0 (0.0%) | 0 (0.0%) |
| Legal Services & Support | 0 (0.0%) | 0 (0.0%) |
| Education Instruction & Library | 91 (100.0%) | 0 (0.0%) |
| Arts, Media & Entertainment | 40 (100.0%) | 0 (0.0%) |
| Health Diagnosing & Treating | 14 (24.6%) | 43 (75.4%) |
| Health Technologists | 14 (32.6%) | 29 (67.4%) |
| Total (Category) | 204 (67.3%) | 99 (32.7%) |
| Total (Overall) | 495 (53.6%) | 428 (46.4%) |
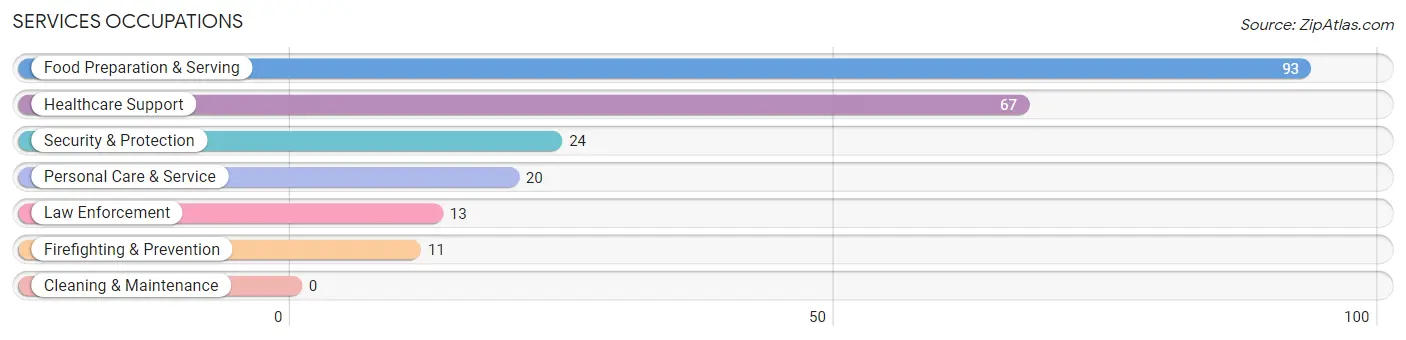
Services Occupations
The most common Services occupations in Seneca Knolls are Food Preparation & Serving (93 | 10.1%), Healthcare Support (67 | 7.3%), Security & Protection (24 | 2.6%), Personal Care & Service (20 | 2.2%), and Law Enforcement (13 | 1.4%).
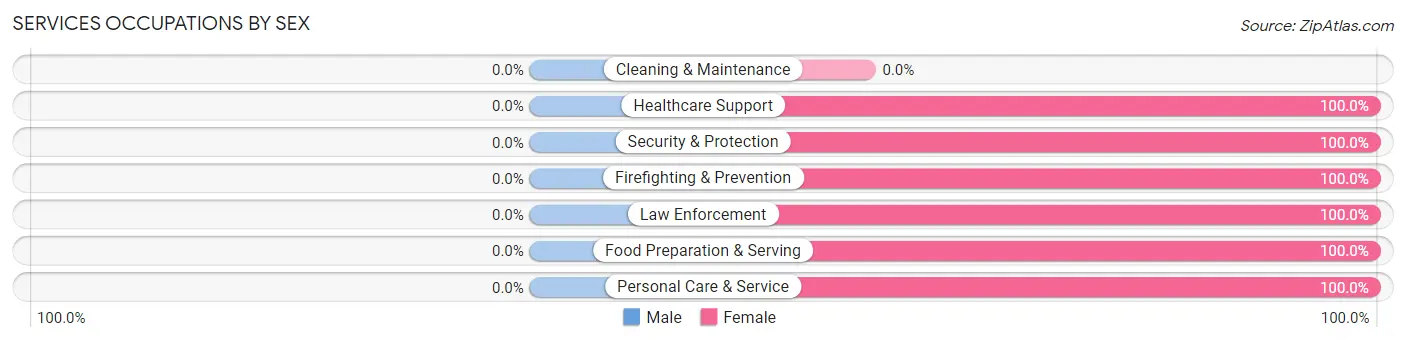
Services Occupations by Sex
| Occupation | Male | Female |
| Healthcare Support | 0 (0.0%) | 67 (100.0%) |
| Security & Protection | 0 (0.0%) | 24 (100.0%) |
| Firefighting & Prevention | 0 (0.0%) | 11 (100.0%) |
| Law Enforcement | 0 (0.0%) | 13 (100.0%) |
| Food Preparation & Serving | 0 (0.0%) | 93 (100.0%) |
| Cleaning & Maintenance | 0 (0.0%) | 0 (0.0%) |
| Personal Care & Service | 0 (0.0%) | 20 (100.0%) |
| Total (Category) | 0 (0.0%) | 204 (100.0%) |
| Total (Overall) | 495 (53.6%) | 428 (46.4%) |
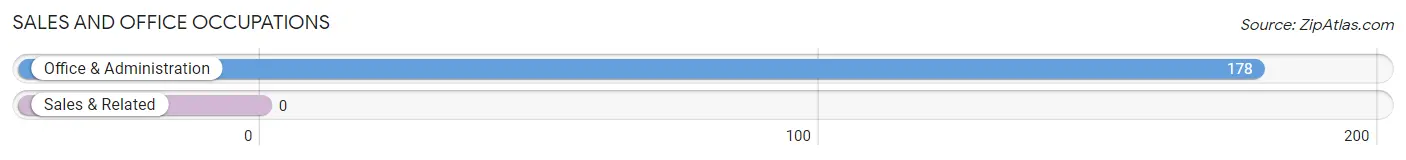
Sales and Office Occupations
The most common Sales and Office occupations in Seneca Knolls are , and Office & Administration (178 | 19.3%).
Sales and Office Occupations by Sex
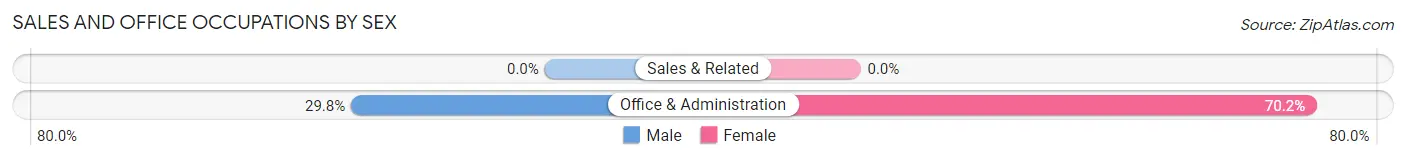
| Occupation | Male | Female |
| Sales & Related | 0 (0.0%) | 0 (0.0%) |
| Office & Administration | 53 (29.8%) | 125 (70.2%) |
| Total (Category) | 53 (29.8%) | 125 (70.2%) |
| Total (Overall) | 495 (53.6%) | 428 (46.4%) |
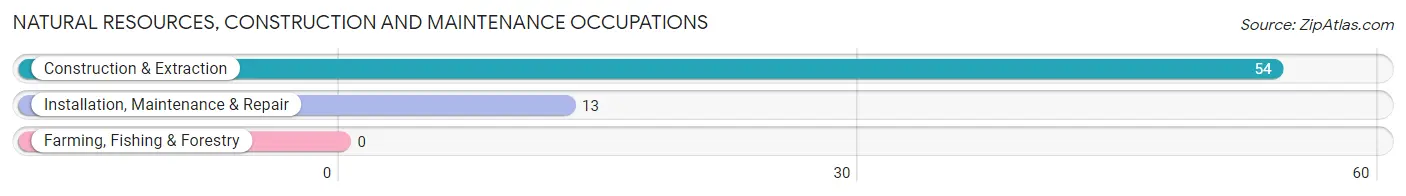
Natural Resources, Construction and Maintenance Occupations
The most common Natural Resources, Construction and Maintenance occupations in Seneca Knolls are Construction & Extraction (54 | 5.9%), and Installation, Maintenance & Repair (13 | 1.4%).
Natural Resources, Construction and Maintenance Occupations by Sex
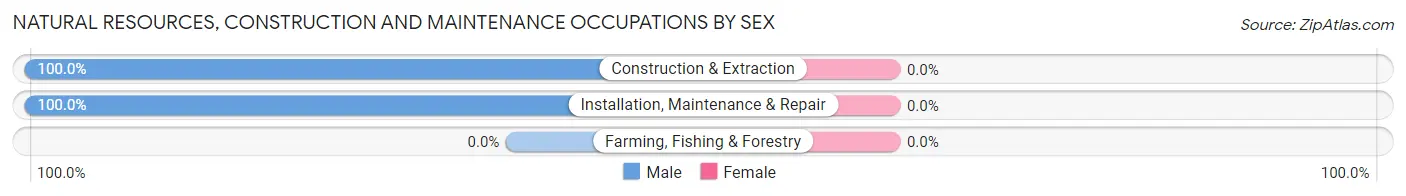
| Occupation | Male | Female |
| Farming, Fishing & Forestry | 0 (0.0%) | 0 (0.0%) |
| Construction & Extraction | 54 (100.0%) | 0 (0.0%) |
| Installation, Maintenance & Repair | 13 (100.0%) | 0 (0.0%) |
| Total (Category) | 67 (100.0%) | 0 (0.0%) |
| Total (Overall) | 495 (53.6%) | 428 (46.4%) |
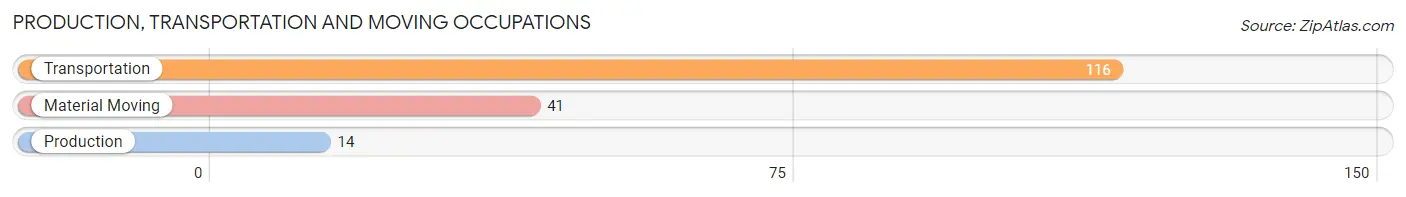
Production, Transportation and Moving Occupations
The most common Production, Transportation and Moving occupations in Seneca Knolls are Transportation (116 | 12.6%), Material Moving (41 | 4.4%), and Production (14 | 1.5%).
Production, Transportation and Moving Occupations by Sex
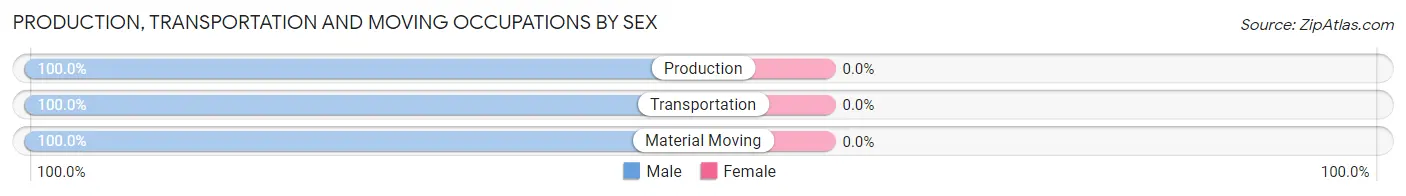
| Occupation | Male | Female |
| Production | 14 (100.0%) | 0 (0.0%) |
| Transportation | 116 (100.0%) | 0 (0.0%) |
| Material Moving | 41 (100.0%) | 0 (0.0%) |
| Total (Category) | 171 (100.0%) | 0 (0.0%) |
| Total (Overall) | 495 (53.6%) | 428 (46.4%) |
Employment Industries by Sex in Seneca Knolls
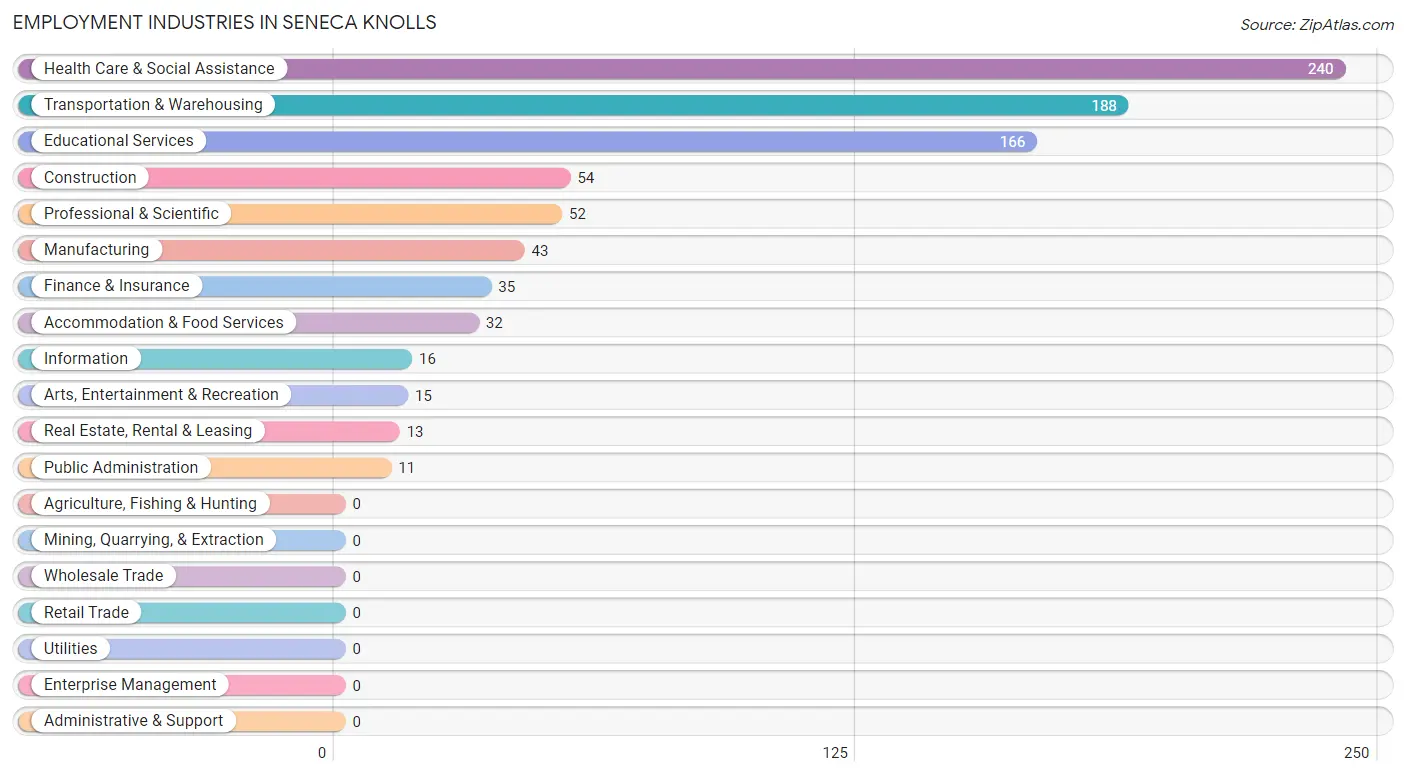
Employment Industries in Seneca Knolls
The major employment industries in Seneca Knolls include Health Care & Social Assistance (240 | 26.0%), Transportation & Warehousing (188 | 20.4%), Educational Services (166 | 18.0%), Construction (54 | 5.9%), and Professional & Scientific (52 | 5.6%).
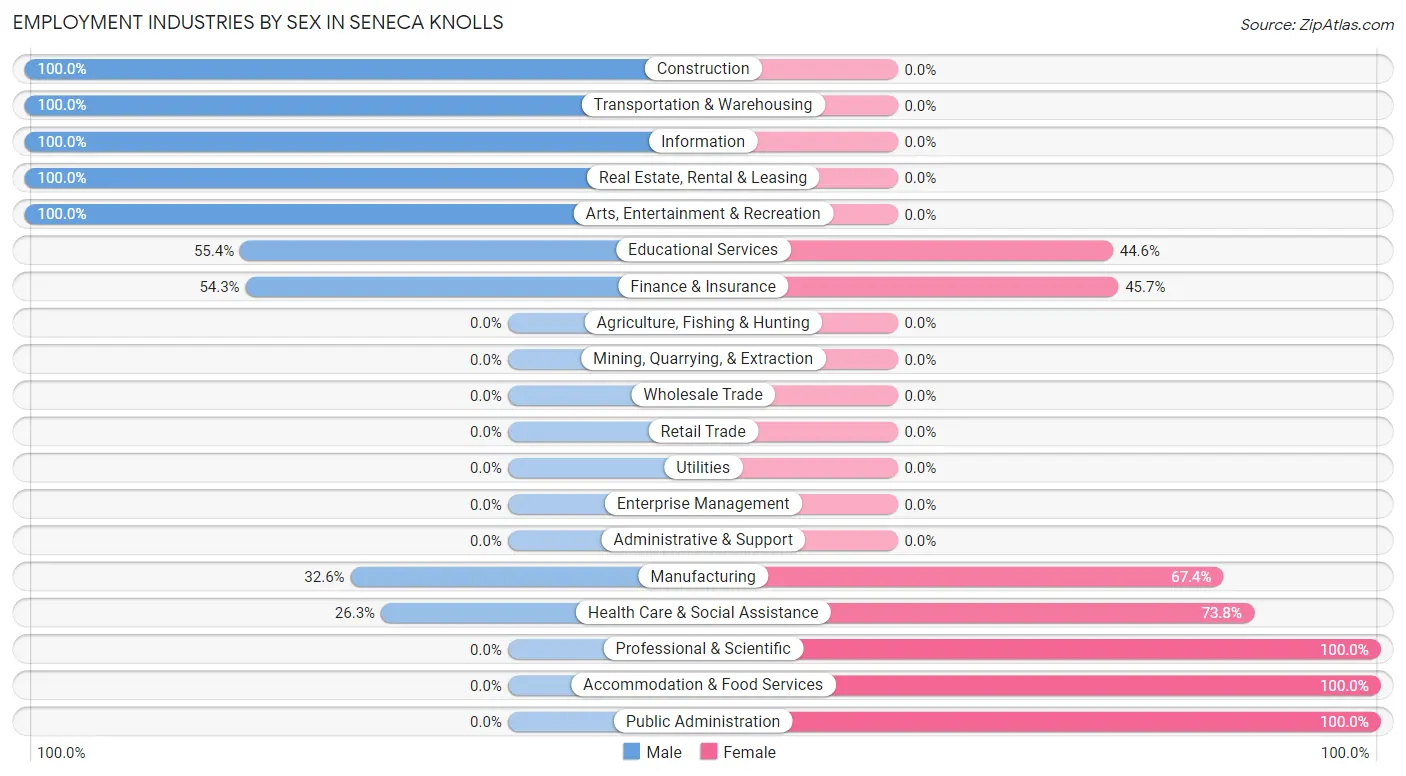
Employment Industries by Sex in Seneca Knolls
The Seneca Knolls industries that see more men than women are Construction (100.0%), Transportation & Warehousing (100.0%), and Information (100.0%), whereas the industries that tend to have a higher number of women are Professional & Scientific (100.0%), Accommodation & Food Services (100.0%), and Public Administration (100.0%).
| Industry | Male | Female |
| Agriculture, Fishing & Hunting | 0 (0.0%) | 0 (0.0%) |
| Mining, Quarrying, & Extraction | 0 (0.0%) | 0 (0.0%) |
| Construction | 54 (100.0%) | 0 (0.0%) |
| Manufacturing | 14 (32.6%) | 29 (67.4%) |
| Wholesale Trade | 0 (0.0%) | 0 (0.0%) |
| Retail Trade | 0 (0.0%) | 0 (0.0%) |
| Transportation & Warehousing | 188 (100.0%) | 0 (0.0%) |
| Utilities | 0 (0.0%) | 0 (0.0%) |
| Information | 16 (100.0%) | 0 (0.0%) |
| Finance & Insurance | 19 (54.3%) | 16 (45.7%) |
| Real Estate, Rental & Leasing | 13 (100.0%) | 0 (0.0%) |
| Professional & Scientific | 0 (0.0%) | 52 (100.0%) |
| Enterprise Management | 0 (0.0%) | 0 (0.0%) |
| Administrative & Support | 0 (0.0%) | 0 (0.0%) |
| Educational Services | 92 (55.4%) | 74 (44.6%) |
| Health Care & Social Assistance | 63 (26.3%) | 177 (73.8%) |
| Arts, Entertainment & Recreation | 15 (100.0%) | 0 (0.0%) |
| Accommodation & Food Services | 0 (0.0%) | 32 (100.0%) |
| Public Administration | 0 (0.0%) | 11 (100.0%) |
| Total | 495 (53.6%) | 428 (46.4%) |
Education in Seneca Knolls
School Enrollment in Seneca Knolls
The most common levels of schooling among the 135 students in Seneca Knolls are college / undergraduate (64 | 47.4%), elementary school (28 | 20.7%), and high school (26 | 19.3%).
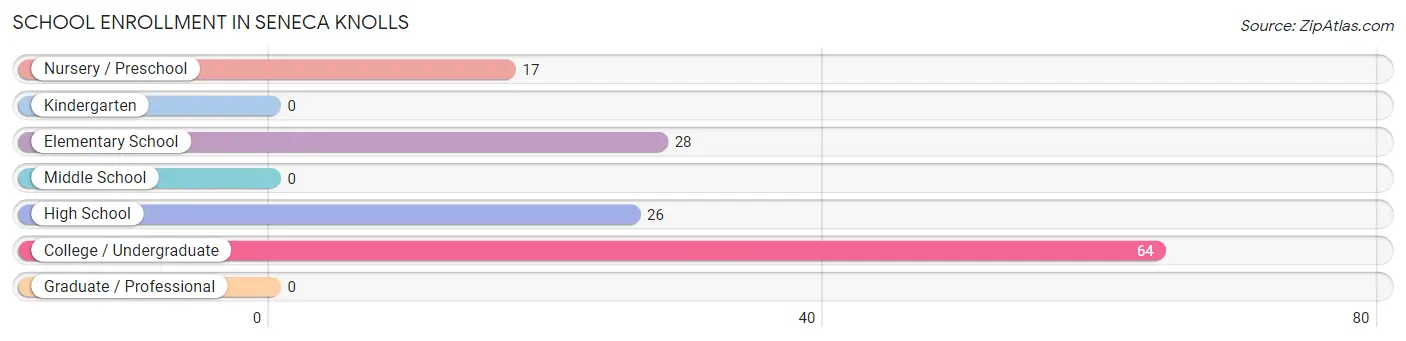
| School Level | # Students | % Students |
| Nursery / Preschool | 17 | 12.6% |
| Kindergarten | 0 | 0.0% |
| Elementary School | 28 | 20.7% |
| Middle School | 0 | 0.0% |
| High School | 26 | 19.3% |
| College / Undergraduate | 64 | 47.4% |
| Graduate / Professional | 0 | 0.0% |
| Total | 135 | 100.0% |
School Enrollment by Age by Funding Source in Seneca Knolls
Out of a total of 135 students who are enrolled in schools in Seneca Knolls, 14 (10.4%) attend a private institution, while the remaining 121 (89.6%) are enrolled in public schools. The age group of 20 to 24 year olds has the highest likelihood of being enrolled in private schools, with 14 (48.3% in the age bracket) enrolled. Conversely, the age group of 3 to 4 year olds has the lowest likelihood of being enrolled in a private school, with 17 (100.0% in the age bracket) attending a public institution.
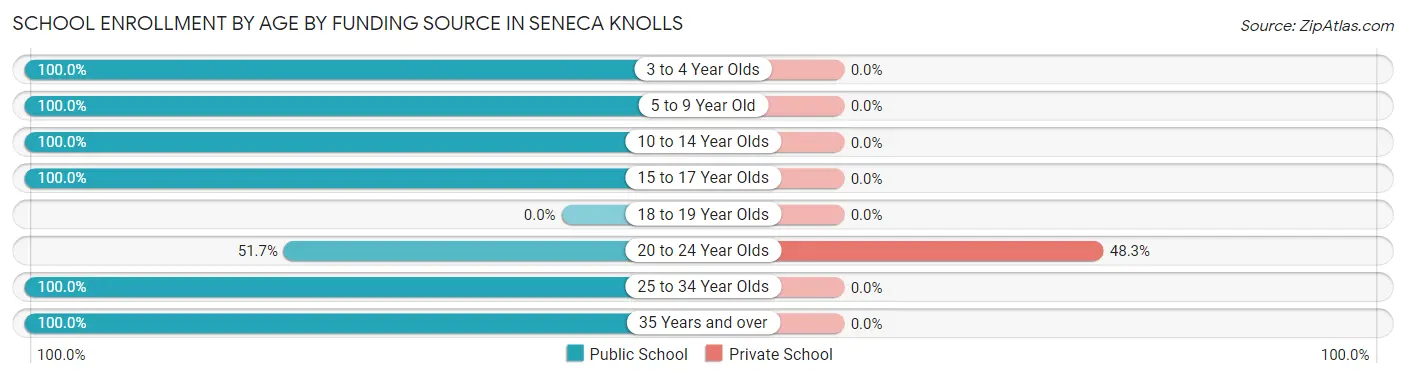
| Age Bracket | Public School | Private School |
| 3 to 4 Year Olds | 17 (100.0%) | 0 (0.0%) |
| 5 to 9 Year Old | 17 (100.0%) | 0 (0.0%) |
| 10 to 14 Year Olds | 11 (100.0%) | 0 (0.0%) |
| 15 to 17 Year Olds | 26 (100.0%) | 0 (0.0%) |
| 18 to 19 Year Olds | 0 (0.0%) | 0 (0.0%) |
| 20 to 24 Year Olds | 15 (51.7%) | 14 (48.3%) |
| 25 to 34 Year Olds | 22 (100.0%) | 0 (0.0%) |
| 35 Years and over | 13 (100.0%) | 0 (0.0%) |
| Total | 121 (89.6%) | 14 (10.4%) |
Educational Attainment by Field of Study in Seneca Knolls
Science & technology (111 | 36.4%), psychology (57 | 18.7%), business (53 | 17.4%), arts & humanities (53 | 17.4%), and literature & languages (16 | 5.2%) are the most common fields of study among 305 individuals in Seneca Knolls who have obtained a bachelor's degree or higher.
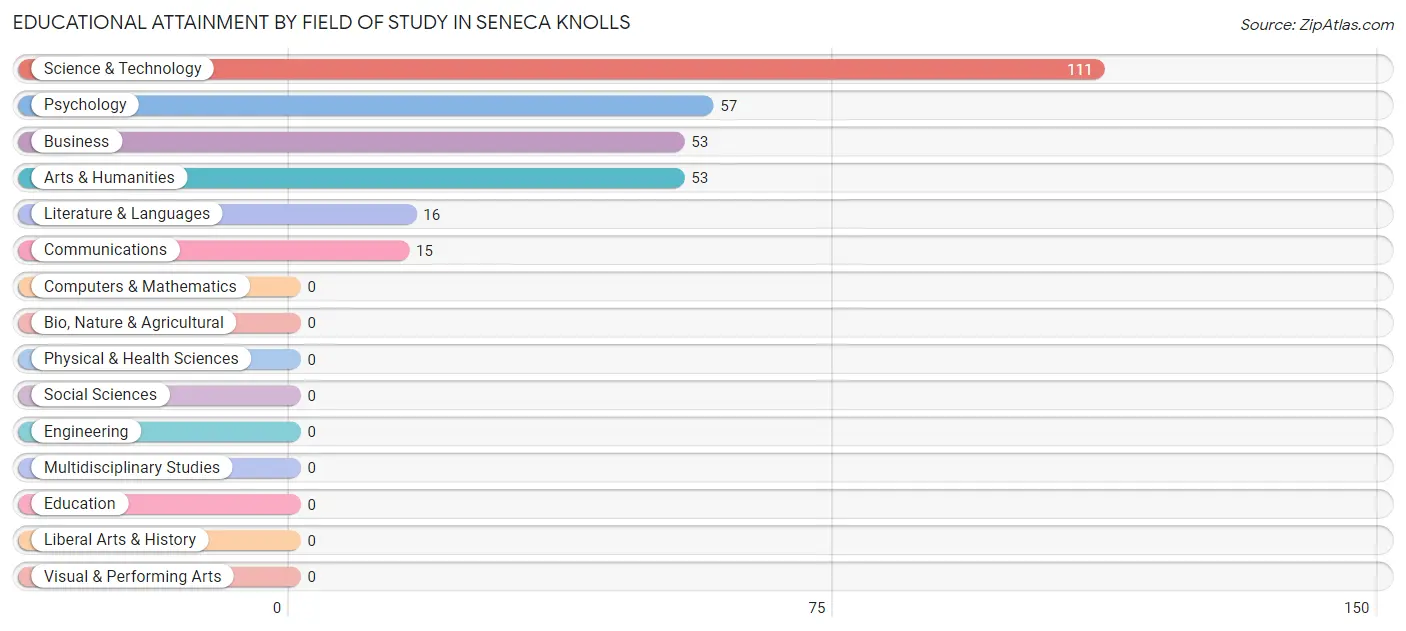
| Field of Study | # Graduates | % Graduates |
| Computers & Mathematics | 0 | 0.0% |
| Bio, Nature & Agricultural | 0 | 0.0% |
| Physical & Health Sciences | 0 | 0.0% |
| Psychology | 57 | 18.7% |
| Social Sciences | 0 | 0.0% |
| Engineering | 0 | 0.0% |
| Multidisciplinary Studies | 0 | 0.0% |
| Science & Technology | 111 | 36.4% |
| Business | 53 | 17.4% |
| Education | 0 | 0.0% |
| Literature & Languages | 16 | 5.2% |
| Liberal Arts & History | 0 | 0.0% |
| Visual & Performing Arts | 0 | 0.0% |
| Communications | 15 | 4.9% |
| Arts & Humanities | 53 | 17.4% |
| Total | 305 | 100.0% |
Transportation & Commute in Seneca Knolls
Vehicle Availability by Sex in Seneca Knolls
The most prevalent vehicle ownership categories in Seneca Knolls are males with 3 vehicles (183, accounting for 37.0%) and females with 3 vehicles (111, making up 44.1%).
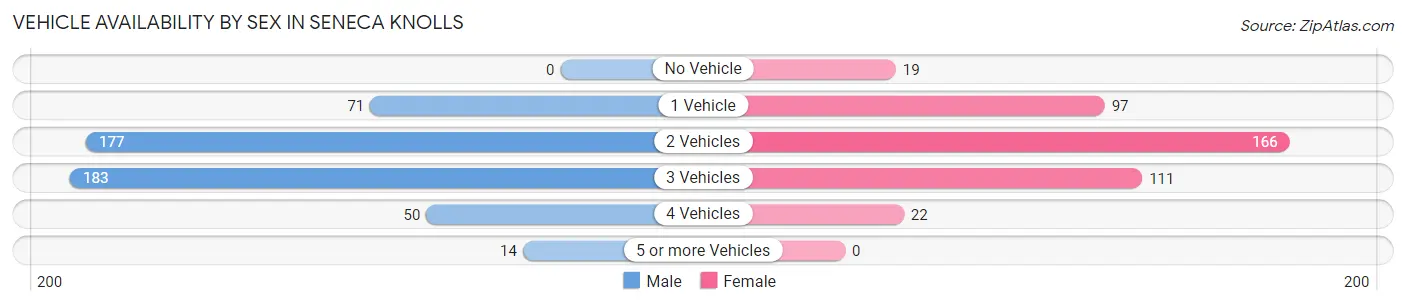
| Vehicles Available | Male | Female |
| No Vehicle | 0 (0.0%) | 19 (4.6%) |
| 1 Vehicle | 71 (14.3%) | 97 (23.4%) |
| 2 Vehicles | 177 (35.8%) | 166 (40.0%) |
| 3 Vehicles | 183 (37.0%) | 111 (26.8%) |
| 4 Vehicles | 50 (10.1%) | 22 (5.3%) |
| 5 or more Vehicles | 14 (2.8%) | 0 (0.0%) |
| Total | 495 (100.0%) | 415 (100.0%) |
Commute Time in Seneca Knolls
The most frequently occuring commute durations in Seneca Knolls are 15 to 19 minutes (223 commuters, 25.8%), 10 to 14 minutes (173 commuters, 20.0%), and 20 to 24 minutes (106 commuters, 12.3%).
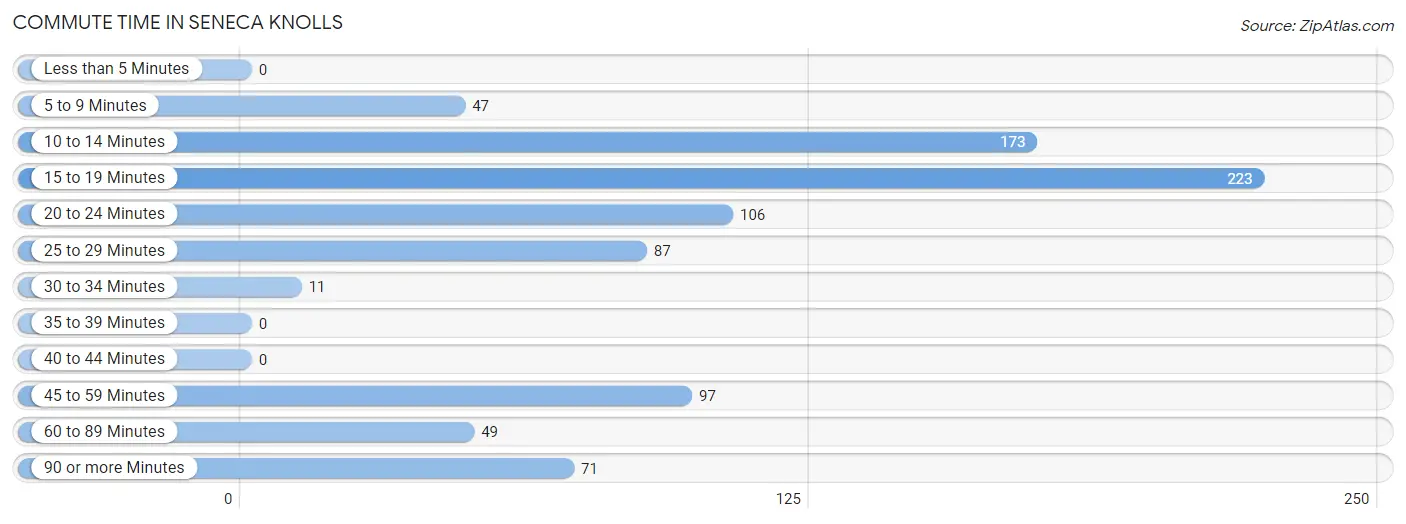
| Commute Time | # Commuters | % Commuters |
| Less than 5 Minutes | 0 | 0.0% |
| 5 to 9 Minutes | 47 | 5.4% |
| 10 to 14 Minutes | 173 | 20.0% |
| 15 to 19 Minutes | 223 | 25.8% |
| 20 to 24 Minutes | 106 | 12.3% |
| 25 to 29 Minutes | 87 | 10.1% |
| 30 to 34 Minutes | 11 | 1.3% |
| 35 to 39 Minutes | 0 | 0.0% |
| 40 to 44 Minutes | 0 | 0.0% |
| 45 to 59 Minutes | 97 | 11.2% |
| 60 to 89 Minutes | 49 | 5.7% |
| 90 or more Minutes | 71 | 8.2% |
Commute Time by Sex in Seneca Knolls
The most common commute times in Seneca Knolls are 10 to 14 minutes (125 commuters, 25.3%) for males and 15 to 19 minutes (122 commuters, 33.1%) for females.
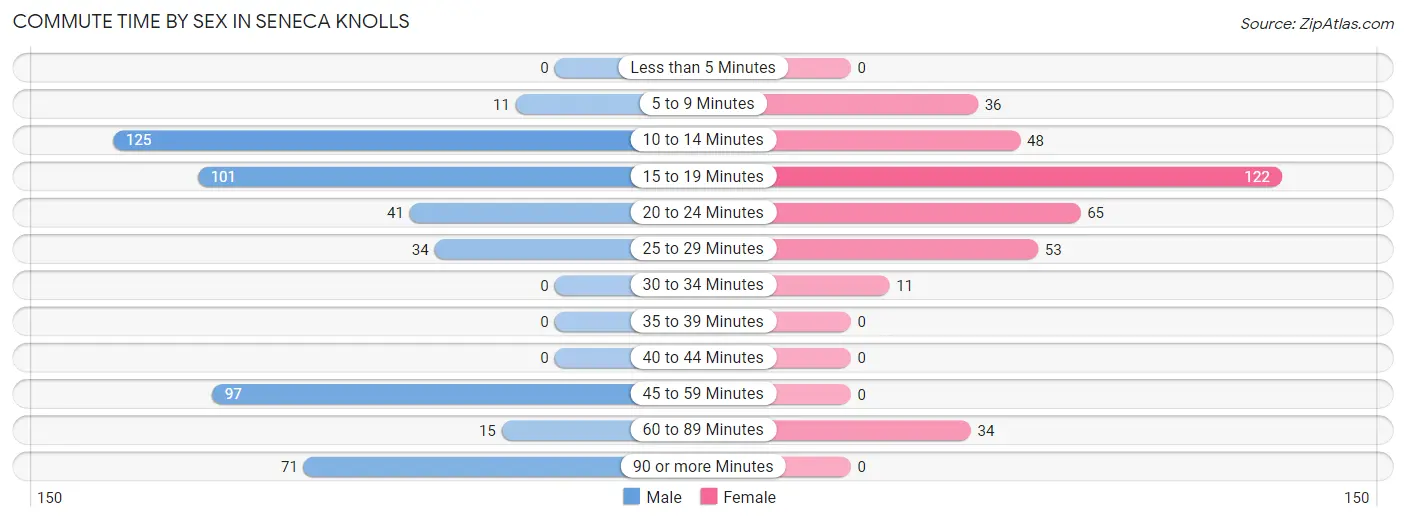
| Commute Time | Male | Female |
| Less than 5 Minutes | 0 (0.0%) | 0 (0.0%) |
| 5 to 9 Minutes | 11 (2.2%) | 36 (9.8%) |
| 10 to 14 Minutes | 125 (25.3%) | 48 (13.0%) |
| 15 to 19 Minutes | 101 (20.4%) | 122 (33.1%) |
| 20 to 24 Minutes | 41 (8.3%) | 65 (17.6%) |
| 25 to 29 Minutes | 34 (6.9%) | 53 (14.4%) |
| 30 to 34 Minutes | 0 (0.0%) | 11 (3.0%) |
| 35 to 39 Minutes | 0 (0.0%) | 0 (0.0%) |
| 40 to 44 Minutes | 0 (0.0%) | 0 (0.0%) |
| 45 to 59 Minutes | 97 (19.6%) | 0 (0.0%) |
| 60 to 89 Minutes | 15 (3.0%) | 34 (9.2%) |
| 90 or more Minutes | 71 (14.3%) | 0 (0.0%) |
Time of Departure to Work by Sex in Seneca Knolls
The most frequent times of departure to work in Seneca Knolls are 12:00 AM to 4:59 AM (101, 20.4%) for males and 6:30 AM to 6:59 AM (89, 24.1%) for females.
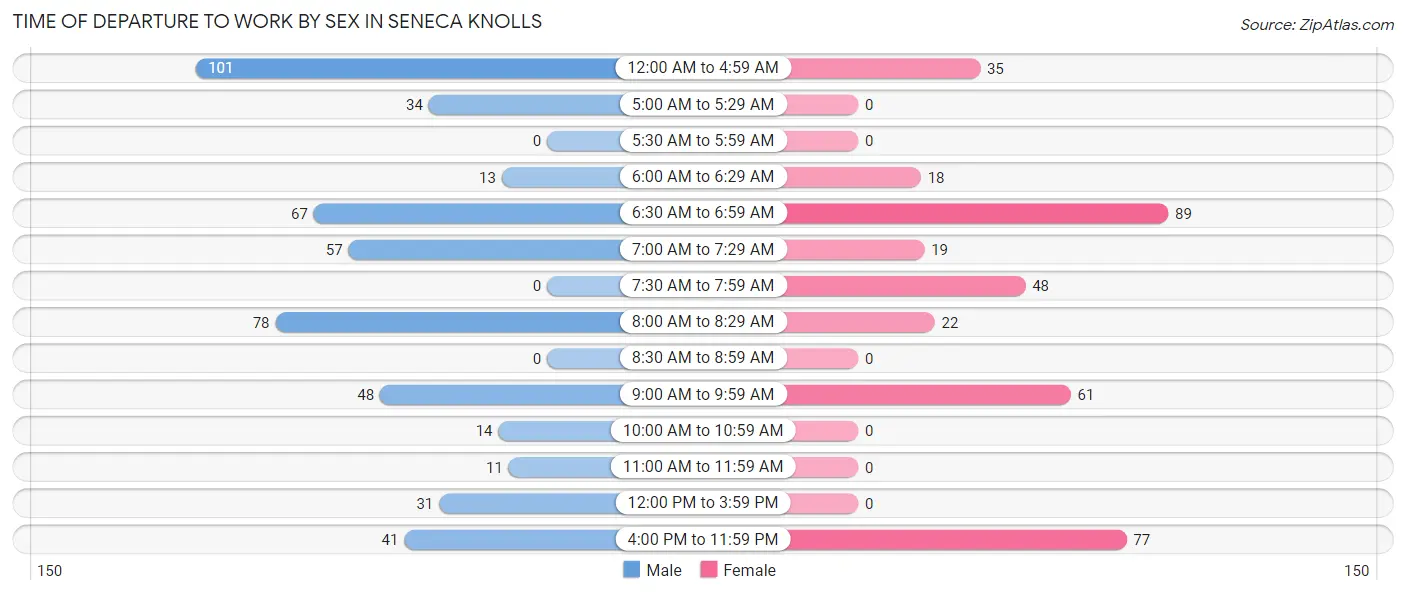
| Time of Departure | Male | Female |
| 12:00 AM to 4:59 AM | 101 (20.4%) | 35 (9.5%) |
| 5:00 AM to 5:29 AM | 34 (6.9%) | 0 (0.0%) |
| 5:30 AM to 5:59 AM | 0 (0.0%) | 0 (0.0%) |
| 6:00 AM to 6:29 AM | 13 (2.6%) | 18 (4.9%) |
| 6:30 AM to 6:59 AM | 67 (13.5%) | 89 (24.1%) |
| 7:00 AM to 7:29 AM | 57 (11.5%) | 19 (5.1%) |
| 7:30 AM to 7:59 AM | 0 (0.0%) | 48 (13.0%) |
| 8:00 AM to 8:29 AM | 78 (15.8%) | 22 (6.0%) |
| 8:30 AM to 8:59 AM | 0 (0.0%) | 0 (0.0%) |
| 9:00 AM to 9:59 AM | 48 (9.7%) | 61 (16.5%) |
| 10:00 AM to 10:59 AM | 14 (2.8%) | 0 (0.0%) |
| 11:00 AM to 11:59 AM | 11 (2.2%) | 0 (0.0%) |
| 12:00 PM to 3:59 PM | 31 (6.3%) | 0 (0.0%) |
| 4:00 PM to 11:59 PM | 41 (8.3%) | 77 (20.9%) |
| Total | 495 (100.0%) | 369 (100.0%) |
Housing Occupancy in Seneca Knolls
Occupancy by Ownership in Seneca Knolls
Of the total 977 dwellings in Seneca Knolls, owner-occupied units account for 952 (97.4%), while renter-occupied units make up 25 (2.6%).
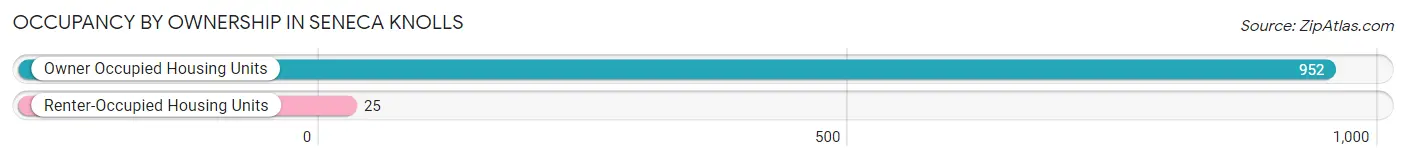
| Occupancy | # Housing Units | % Housing Units |
| Owner Occupied Housing Units | 952 | 97.4% |
| Renter-Occupied Housing Units | 25 | 2.6% |
| Total Occupied Housing Units | 977 | 100.0% |
Occupancy by Household Size in Seneca Knolls
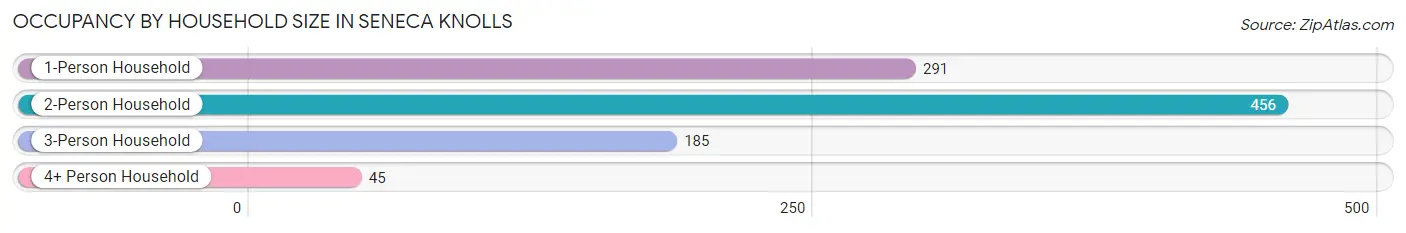
| Household Size | # Housing Units | % Housing Units |
| 1-Person Household | 291 | 29.8% |
| 2-Person Household | 456 | 46.7% |
| 3-Person Household | 185 | 18.9% |
| 4+ Person Household | 45 | 4.6% |
| Total Housing Units | 977 | 100.0% |
Occupancy by Ownership by Household Size in Seneca Knolls
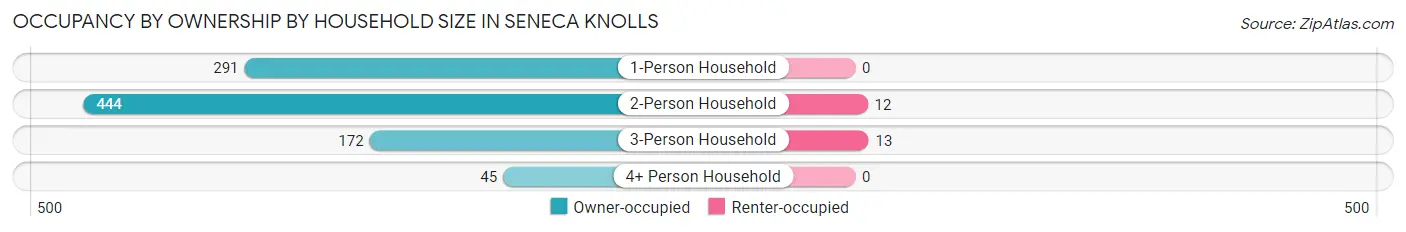
| Household Size | Owner-occupied | Renter-occupied |
| 1-Person Household | 291 (100.0%) | 0 (0.0%) |
| 2-Person Household | 444 (97.4%) | 12 (2.6%) |
| 3-Person Household | 172 (93.0%) | 13 (7.0%) |
| 4+ Person Household | 45 (100.0%) | 0 (0.0%) |
| Total Housing Units | 952 (97.4%) | 25 (2.6%) |
Occupancy by Educational Attainment in Seneca Knolls
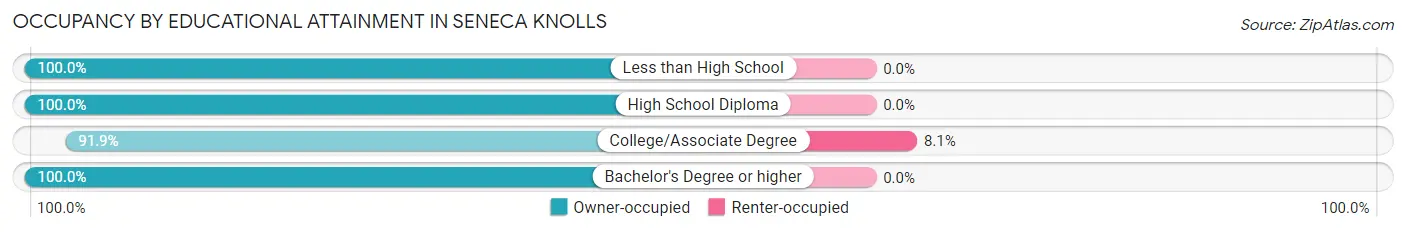
| Household Size | Owner-occupied | Renter-occupied |
| Less than High School | 75 (100.0%) | 0 (0.0%) |
| High School Diploma | 391 (100.0%) | 0 (0.0%) |
| College/Associate Degree | 284 (91.9%) | 25 (8.1%) |
| Bachelor's Degree or higher | 202 (100.0%) | 0 (0.0%) |
Occupancy by Age of Householder in Seneca Knolls
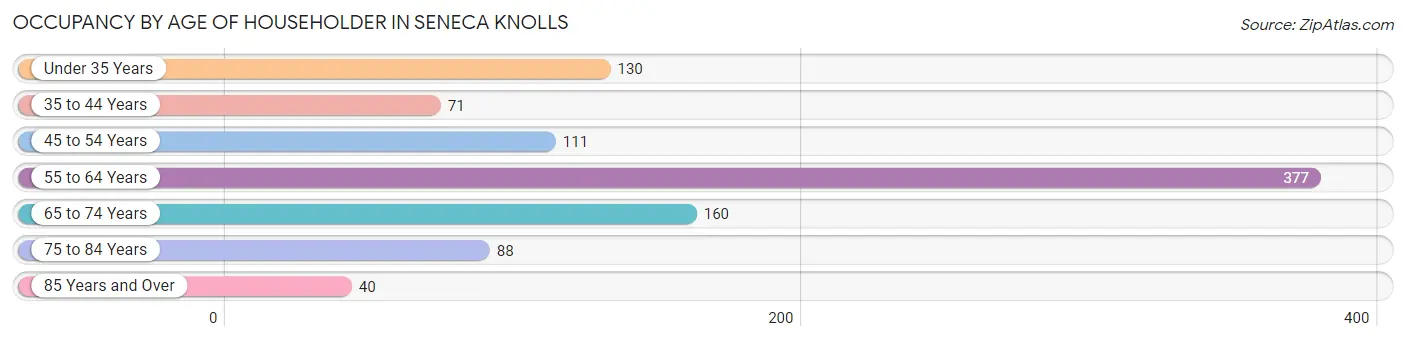
| Age Bracket | # Households | % Households |
| Under 35 Years | 130 | 13.3% |
| 35 to 44 Years | 71 | 7.3% |
| 45 to 54 Years | 111 | 11.4% |
| 55 to 64 Years | 377 | 38.6% |
| 65 to 74 Years | 160 | 16.4% |
| 75 to 84 Years | 88 | 9.0% |
| 85 Years and Over | 40 | 4.1% |
| Total | 977 | 100.0% |
Housing Finances in Seneca Knolls
Median Income by Occupancy in Seneca Knolls
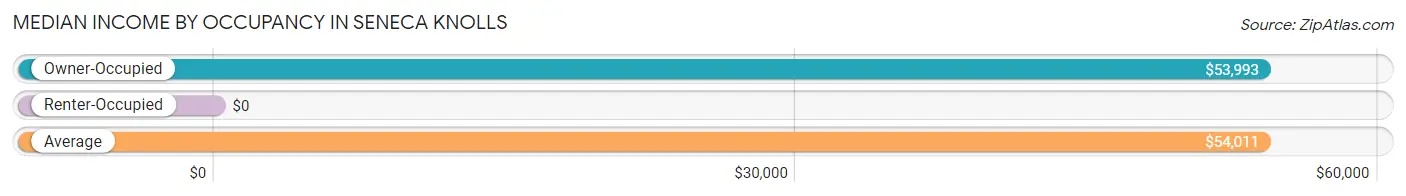
| Occupancy Type | # Households | Median Income |
| Owner-Occupied | 952 (97.4%) | $53,993 |
| Renter-Occupied | 25 (2.6%) | $0 |
| Average | 977 (100.0%) | $54,011 |
Occupancy by Householder Income Bracket in Seneca Knolls
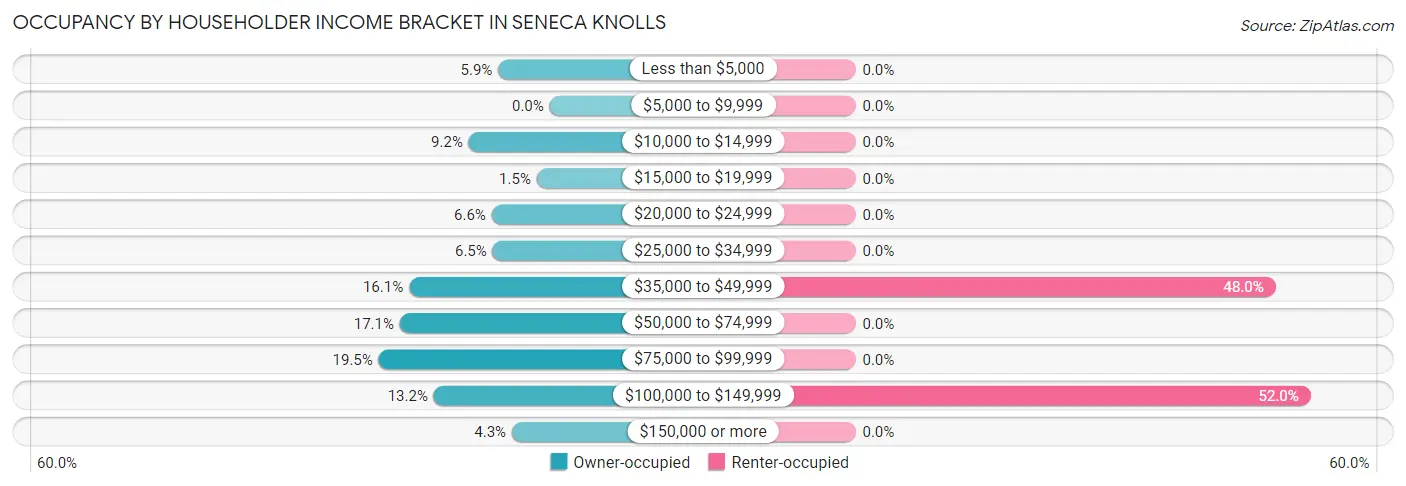
| Income Bracket | Owner-occupied | Renter-occupied |
| Less than $5,000 | 56 (5.9%) | 0 (0.0%) |
| $5,000 to $9,999 | 0 (0.0%) | 0 (0.0%) |
| $10,000 to $14,999 | 88 (9.2%) | 0 (0.0%) |
| $15,000 to $19,999 | 14 (1.5%) | 0 (0.0%) |
| $20,000 to $24,999 | 63 (6.6%) | 0 (0.0%) |
| $25,000 to $34,999 | 62 (6.5%) | 0 (0.0%) |
| $35,000 to $49,999 | 153 (16.1%) | 12 (48.0%) |
| $50,000 to $74,999 | 163 (17.1%) | 0 (0.0%) |
| $75,000 to $99,999 | 186 (19.5%) | 0 (0.0%) |
| $100,000 to $149,999 | 126 (13.2%) | 13 (52.0%) |
| $150,000 or more | 41 (4.3%) | 0 (0.0%) |
| Total | 952 (100.0%) | 25 (100.0%) |
Monthly Housing Cost Tiers in Seneca Knolls
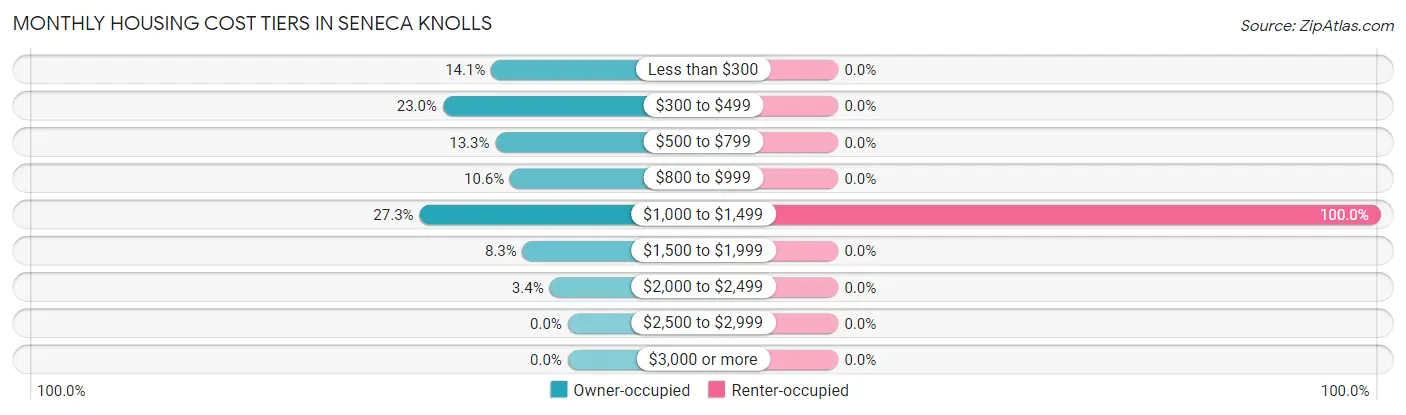
| Monthly Cost | Owner-occupied | Renter-occupied |
| Less than $300 | 134 (14.1%) | 0 (0.0%) |
| $300 to $499 | 219 (23.0%) | 0 (0.0%) |
| $500 to $799 | 127 (13.3%) | 0 (0.0%) |
| $800 to $999 | 101 (10.6%) | 0 (0.0%) |
| $1,000 to $1,499 | 260 (27.3%) | 25 (100.0%) |
| $1,500 to $1,999 | 79 (8.3%) | 0 (0.0%) |
| $2,000 to $2,499 | 32 (3.4%) | 0 (0.0%) |
| $2,500 to $2,999 | 0 (0.0%) | 0 (0.0%) |
| $3,000 or more | 0 (0.0%) | 0 (0.0%) |
| Total | 952 (100.0%) | 25 (100.0%) |
Physical Housing Characteristics in Seneca Knolls
Housing Structures in Seneca Knolls
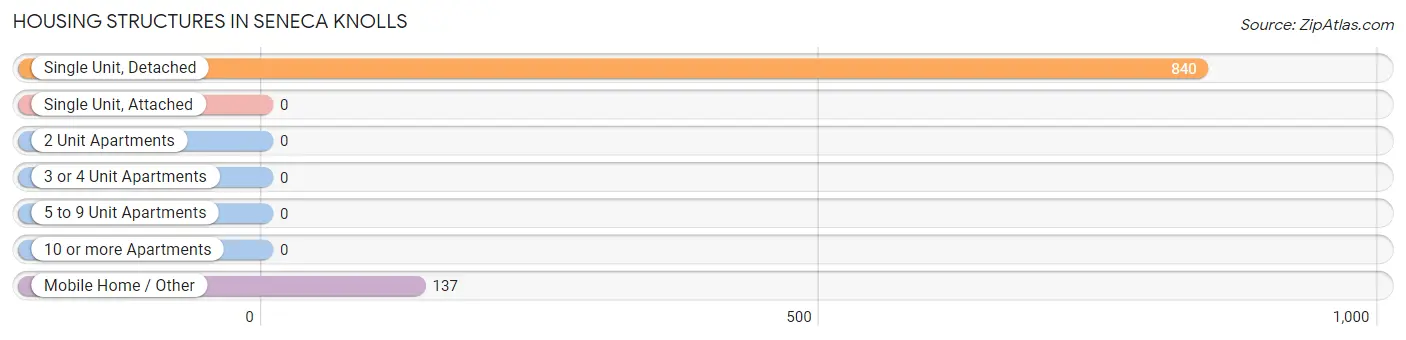
| Structure Type | # Housing Units | % Housing Units |
| Single Unit, Detached | 840 | 86.0% |
| Single Unit, Attached | 0 | 0.0% |
| 2 Unit Apartments | 0 | 0.0% |
| 3 or 4 Unit Apartments | 0 | 0.0% |
| 5 to 9 Unit Apartments | 0 | 0.0% |
| 10 or more Apartments | 0 | 0.0% |
| Mobile Home / Other | 137 | 14.0% |
| Total | 977 | 100.0% |
Housing Structures by Occupancy in Seneca Knolls
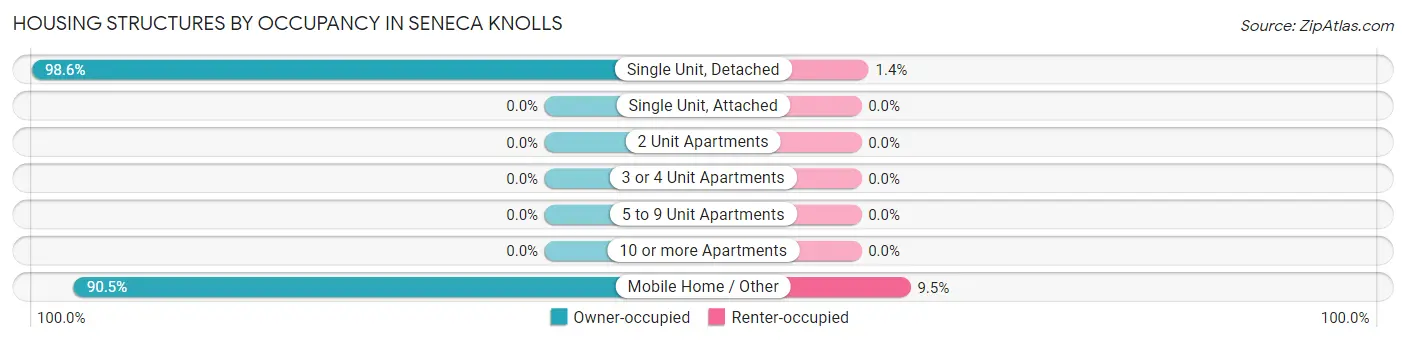
| Structure Type | Owner-occupied | Renter-occupied |
| Single Unit, Detached | 828 (98.6%) | 12 (1.4%) |
| Single Unit, Attached | 0 (0.0%) | 0 (0.0%) |
| 2 Unit Apartments | 0 (0.0%) | 0 (0.0%) |
| 3 or 4 Unit Apartments | 0 (0.0%) | 0 (0.0%) |
| 5 to 9 Unit Apartments | 0 (0.0%) | 0 (0.0%) |
| 10 or more Apartments | 0 (0.0%) | 0 (0.0%) |
| Mobile Home / Other | 124 (90.5%) | 13 (9.5%) |
| Total | 952 (97.4%) | 25 (2.6%) |
Housing Structures by Number of Rooms in Seneca Knolls
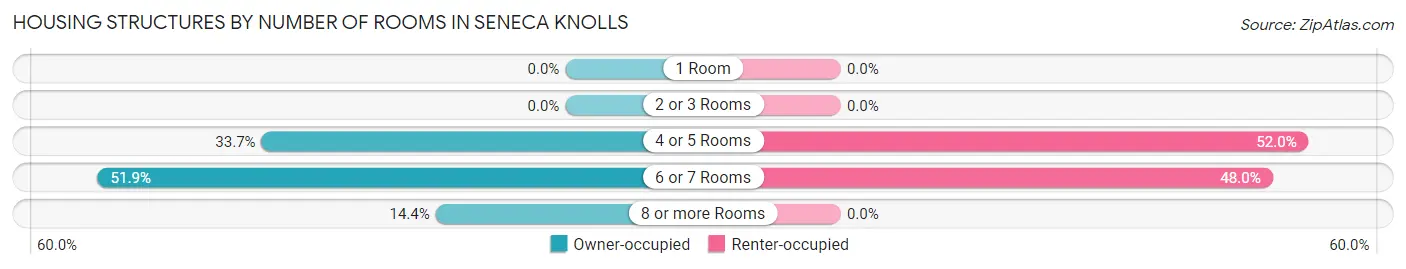
| Number of Rooms | Owner-occupied | Renter-occupied |
| 1 Room | 0 (0.0%) | 0 (0.0%) |
| 2 or 3 Rooms | 0 (0.0%) | 0 (0.0%) |
| 4 or 5 Rooms | 321 (33.7%) | 13 (52.0%) |
| 6 or 7 Rooms | 494 (51.9%) | 12 (48.0%) |
| 8 or more Rooms | 137 (14.4%) | 0 (0.0%) |
| Total | 952 (100.0%) | 25 (100.0%) |
Housing Structure by Heating Type in Seneca Knolls
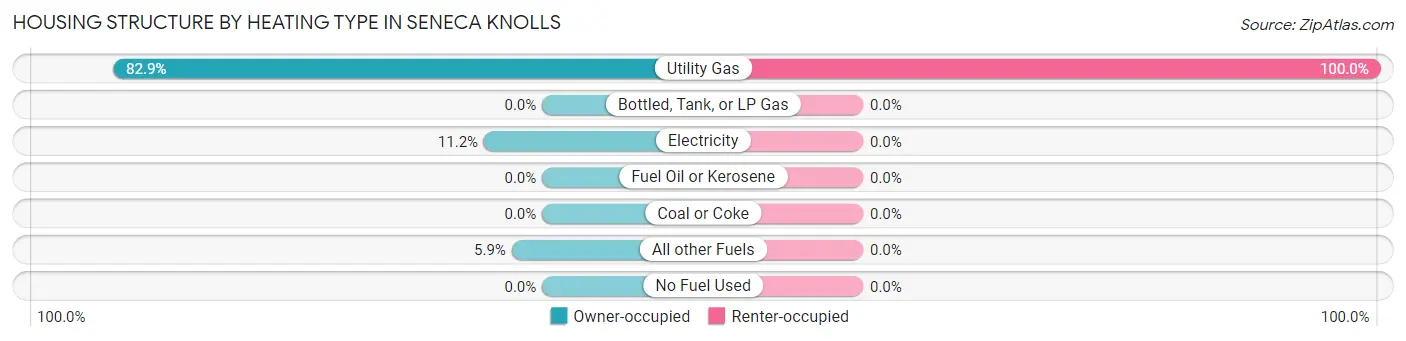
| Heating Type | Owner-occupied | Renter-occupied |
| Utility Gas | 789 (82.9%) | 25 (100.0%) |
| Bottled, Tank, or LP Gas | 0 (0.0%) | 0 (0.0%) |
| Electricity | 107 (11.2%) | 0 (0.0%) |
| Fuel Oil or Kerosene | 0 (0.0%) | 0 (0.0%) |
| Coal or Coke | 0 (0.0%) | 0 (0.0%) |
| All other Fuels | 56 (5.9%) | 0 (0.0%) |
| No Fuel Used | 0 (0.0%) | 0 (0.0%) |
| Total | 952 (100.0%) | 25 (100.0%) |
Household Vehicle Usage in Seneca Knolls
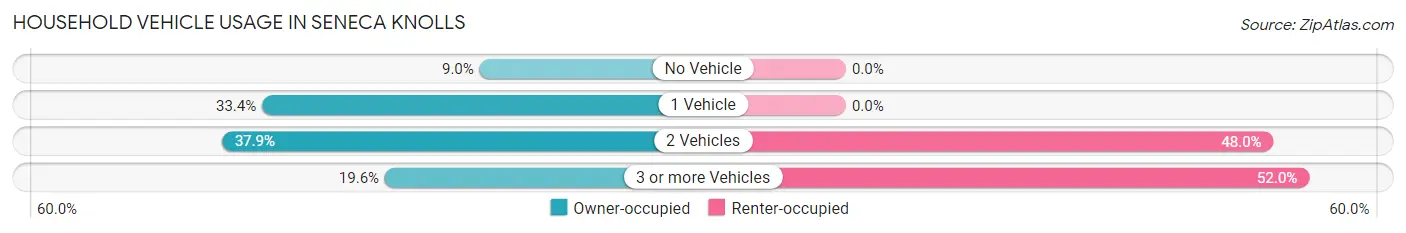
| Vehicles per Household | Owner-occupied | Renter-occupied |
| No Vehicle | 86 (9.0%) | 0 (0.0%) |
| 1 Vehicle | 318 (33.4%) | 0 (0.0%) |
| 2 Vehicles | 361 (37.9%) | 12 (48.0%) |
| 3 or more Vehicles | 187 (19.6%) | 13 (52.0%) |
| Total | 952 (100.0%) | 25 (100.0%) |
Real Estate & Mortgages in Seneca Knolls
Real Estate and Mortgage Overview in Seneca Knolls
| Characteristic | Without Mortgage | With Mortgage |
| Housing Units | 346 | 606 |
| Median Property Value | $92,300 | $123,200 |
| Median Household Income | - | - |
| Monthly Housing Costs | $366 | $0 |
| Real Estate Taxes | $1,878 | $71 |
Property Value by Mortgage Status in Seneca Knolls
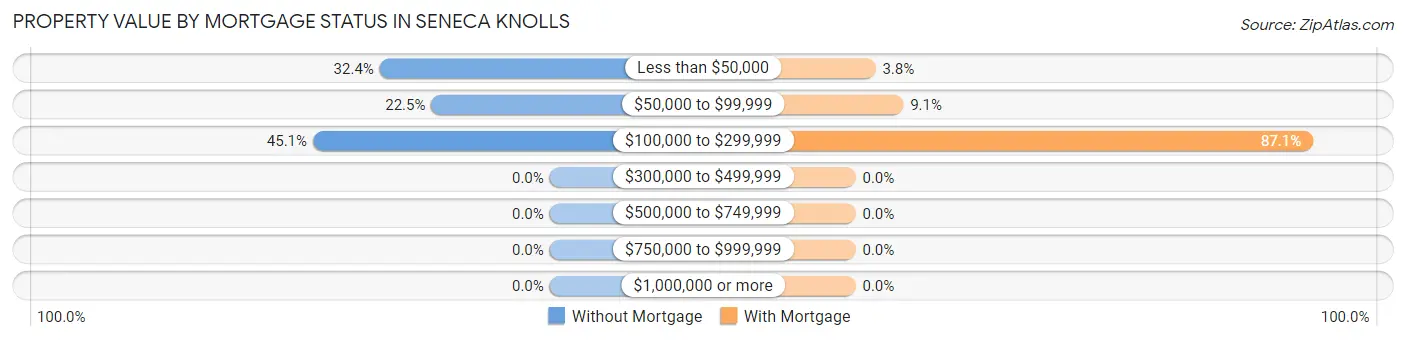
| Property Value | Without Mortgage | With Mortgage |
| Less than $50,000 | 112 (32.4%) | 23 (3.8%) |
| $50,000 to $99,999 | 78 (22.5%) | 55 (9.1%) |
| $100,000 to $299,999 | 156 (45.1%) | 528 (87.1%) |
| $300,000 to $499,999 | 0 (0.0%) | 0 (0.0%) |
| $500,000 to $749,999 | 0 (0.0%) | 0 (0.0%) |
| $750,000 to $999,999 | 0 (0.0%) | 0 (0.0%) |
| $1,000,000 or more | 0 (0.0%) | 0 (0.0%) |
| Total | 346 (100.0%) | 606 (100.0%) |
Household Income by Mortgage Status in Seneca Knolls
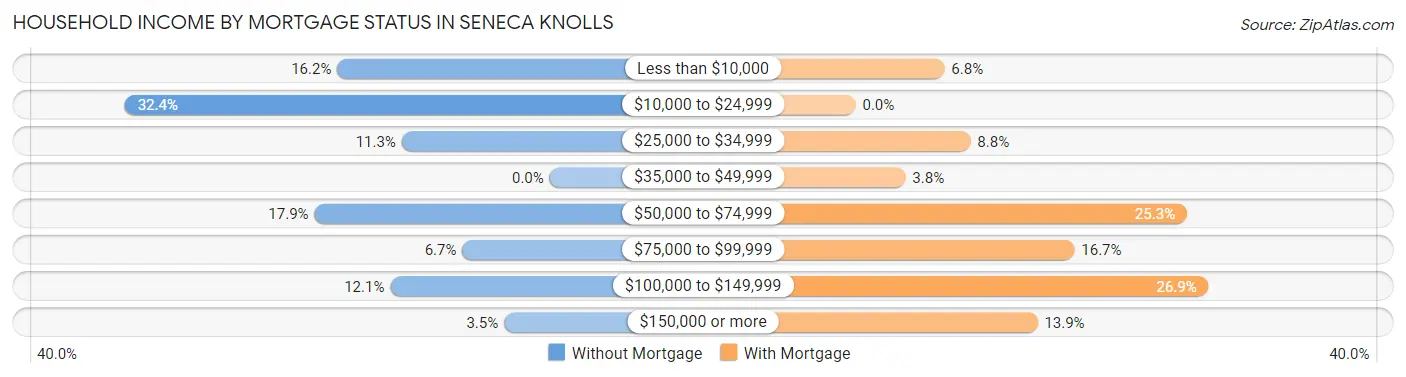
| Household Income | Without Mortgage | With Mortgage |
| Less than $10,000 | 56 (16.2%) | 41 (6.8%) |
| $10,000 to $24,999 | 112 (32.4%) | 0 (0.0%) |
| $25,000 to $34,999 | 39 (11.3%) | 53 (8.7%) |
| $35,000 to $49,999 | 0 (0.0%) | 23 (3.8%) |
| $50,000 to $74,999 | 62 (17.9%) | 153 (25.3%) |
| $75,000 to $99,999 | 23 (6.7%) | 101 (16.7%) |
| $100,000 to $149,999 | 42 (12.1%) | 163 (26.9%) |
| $150,000 or more | 12 (3.5%) | 84 (13.9%) |
| Total | 346 (100.0%) | 606 (100.0%) |
Property Value to Household Income Ratio in Seneca Knolls
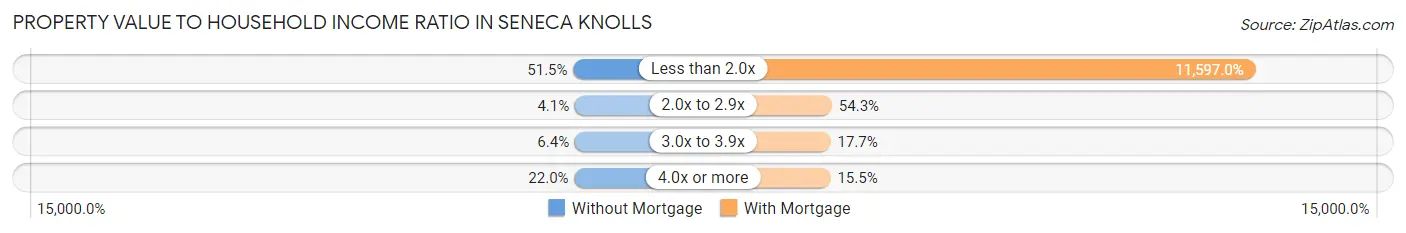
| Value-to-Income Ratio | Without Mortgage | With Mortgage |
| Less than 2.0x | 178 (51.4%) | 70,278 (11,597.0%) |
| 2.0x to 2.9x | 14 (4.1%) | 329 (54.3%) |
| 3.0x to 3.9x | 22 (6.4%) | 107 (17.7%) |
| 4.0x or more | 76 (22.0%) | 94 (15.5%) |
| Total | 346 (100.0%) | 606 (100.0%) |
Real Estate Taxes by Mortgage Status in Seneca Knolls
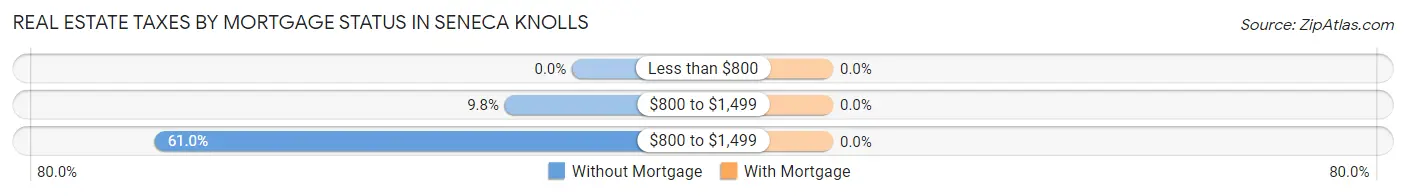
| Property Taxes | Without Mortgage | With Mortgage |
| Less than $800 | 0 (0.0%) | 0 (0.0%) |
| $800 to $1,499 | 34 (9.8%) | 0 (0.0%) |
| $800 to $1,499 | 211 (61.0%) | 0 (0.0%) |
| Total | 346 (100.0%) | 606 (100.0%) |
Health & Disability in Seneca Knolls
Health Insurance Coverage by Age in Seneca Knolls

| Age Bracket | With Coverage | Without Coverage |
| Under 6 Years | 87 (88.8%) | 11 (11.2%) |
| 6 to 18 Years | 54 (100.0%) | 0 (0.0%) |
| 19 to 25 Years | 296 (94.9%) | 16 (5.1%) |
| 26 to 34 Years | 153 (93.3%) | 11 (6.7%) |
| 35 to 44 Years | 162 (100.0%) | 0 (0.0%) |
| 45 to 54 Years | 201 (100.0%) | 0 (0.0%) |
| 55 to 64 Years | 618 (96.9%) | 20 (3.1%) |
| 65 to 74 Years | 280 (100.0%) | 0 (0.0%) |
| 75 Years and older | 176 (100.0%) | 0 (0.0%) |
| Total | 2,027 (97.2%) | 58 (2.8%) |
Health Insurance Coverage by Citizenship Status in Seneca Knolls
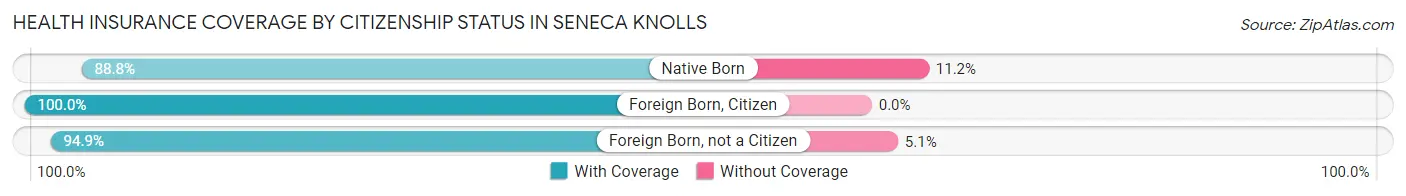
| Citizenship Status | With Coverage | Without Coverage |
| Native Born | 87 (88.8%) | 11 (11.2%) |
| Foreign Born, Citizen | 54 (100.0%) | 0 (0.0%) |
| Foreign Born, not a Citizen | 296 (94.9%) | 16 (5.1%) |
Health Insurance Coverage by Household Income in Seneca Knolls
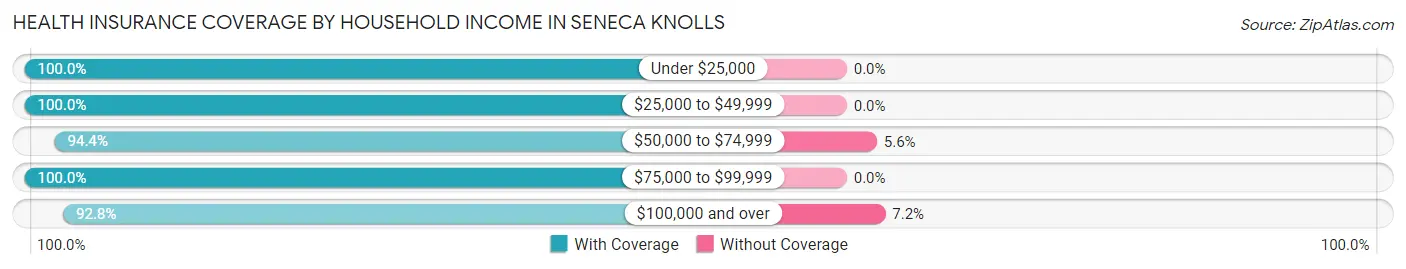
| Household Income | With Coverage | Without Coverage |
| Under $25,000 | 295 (100.0%) | 0 (0.0%) |
| $25,000 to $49,999 | 401 (100.0%) | 0 (0.0%) |
| $50,000 to $74,999 | 335 (94.4%) | 20 (5.6%) |
| $75,000 to $99,999 | 508 (100.0%) | 0 (0.0%) |
| $100,000 and over | 488 (92.8%) | 38 (7.2%) |
Public vs Private Health Insurance Coverage by Age in Seneca Knolls
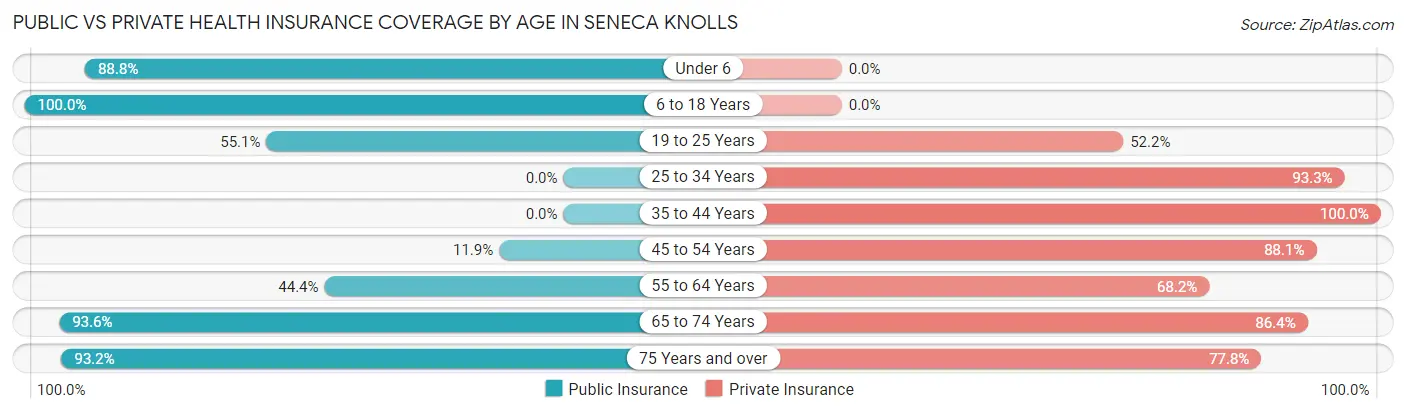
| Age Bracket | Public Insurance | Private Insurance |
| Under 6 | 87 (88.8%) | 0 (0.0%) |
| 6 to 18 Years | 54 (100.0%) | 0 (0.0%) |
| 19 to 25 Years | 172 (55.1%) | 163 (52.2%) |
| 25 to 34 Years | 0 (0.0%) | 153 (93.3%) |
| 35 to 44 Years | 0 (0.0%) | 162 (100.0%) |
| 45 to 54 Years | 24 (11.9%) | 177 (88.1%) |
| 55 to 64 Years | 283 (44.4%) | 435 (68.2%) |
| 65 to 74 Years | 262 (93.6%) | 242 (86.4%) |
| 75 Years and over | 164 (93.2%) | 137 (77.8%) |
| Total | 1,046 (50.2%) | 1,469 (70.5%) |
Disability Status by Sex by Age in Seneca Knolls
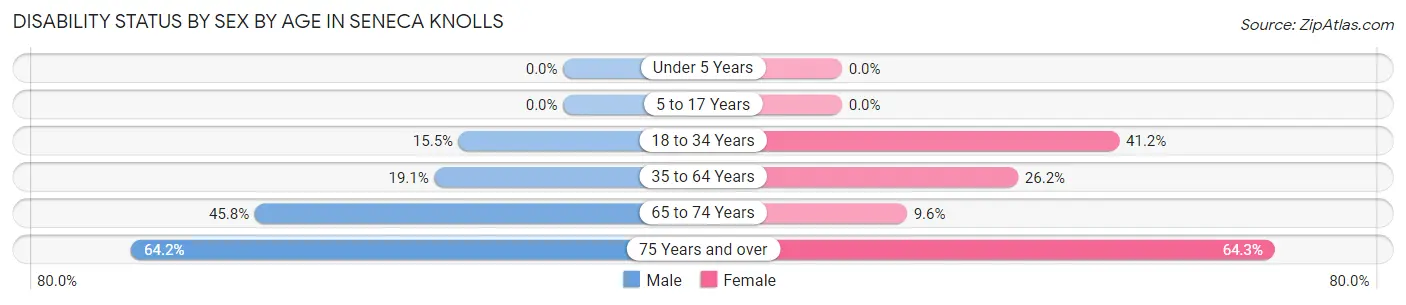
| Age Bracket | Male | Female |
| Under 5 Years | 0 (0.0%) | 0 (0.0%) |
| 5 to 17 Years | 0 (0.0%) | 0 (0.0%) |
| 18 to 34 Years | 29 (15.5%) | 119 (41.2%) |
| 35 to 64 Years | 92 (19.1%) | 136 (26.2%) |
| 65 to 74 Years | 38 (45.8%) | 19 (9.6%) |
| 75 Years and over | 77 (64.2%) | 36 (64.3%) |
Disability Class by Sex by Age in Seneca Knolls
Disability Class: Hearing Difficulty
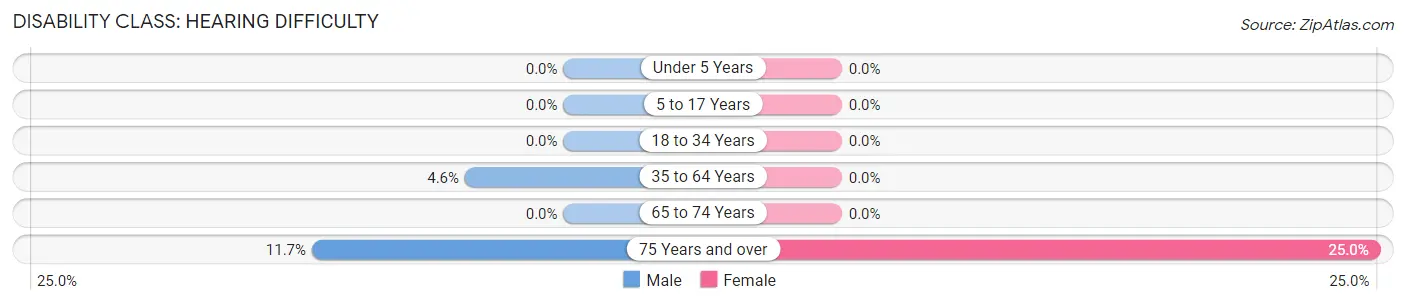
| Age Bracket | Male | Female |
| Under 5 Years | 0 (0.0%) | 0 (0.0%) |
| 5 to 17 Years | 0 (0.0%) | 0 (0.0%) |
| 18 to 34 Years | 0 (0.0%) | 0 (0.0%) |
| 35 to 64 Years | 22 (4.6%) | 0 (0.0%) |
| 65 to 74 Years | 0 (0.0%) | 0 (0.0%) |
| 75 Years and over | 14 (11.7%) | 14 (25.0%) |
Disability Class: Vision Difficulty
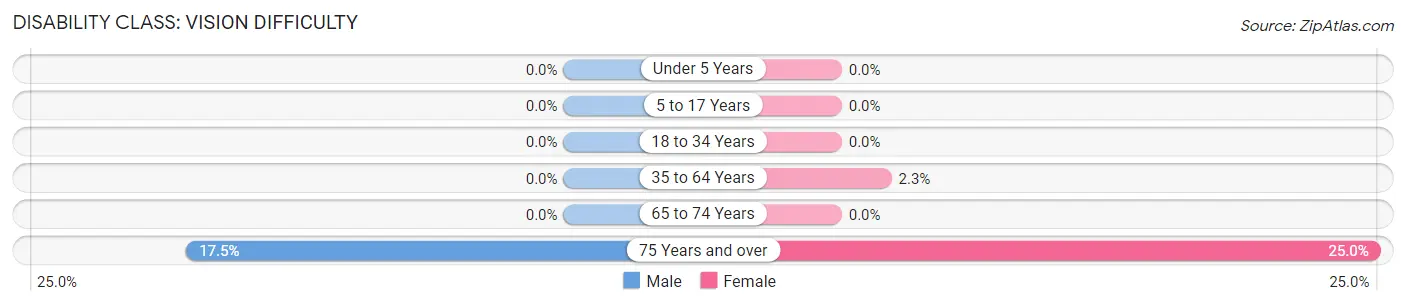
| Age Bracket | Male | Female |
| Under 5 Years | 0 (0.0%) | 0 (0.0%) |
| 5 to 17 Years | 0 (0.0%) | 0 (0.0%) |
| 18 to 34 Years | 0 (0.0%) | 0 (0.0%) |
| 35 to 64 Years | 0 (0.0%) | 12 (2.3%) |
| 65 to 74 Years | 0 (0.0%) | 0 (0.0%) |
| 75 Years and over | 21 (17.5%) | 14 (25.0%) |
Disability Class: Cognitive Difficulty
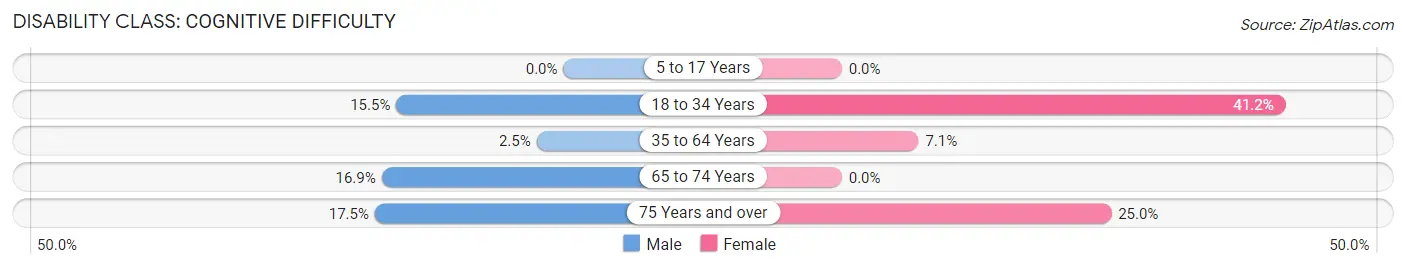
| Age Bracket | Male | Female |
| 5 to 17 Years | 0 (0.0%) | 0 (0.0%) |
| 18 to 34 Years | 29 (15.5%) | 119 (41.2%) |
| 35 to 64 Years | 12 (2.5%) | 37 (7.1%) |
| 65 to 74 Years | 14 (16.9%) | 0 (0.0%) |
| 75 Years and over | 21 (17.5%) | 14 (25.0%) |
Disability Class: Ambulatory Difficulty
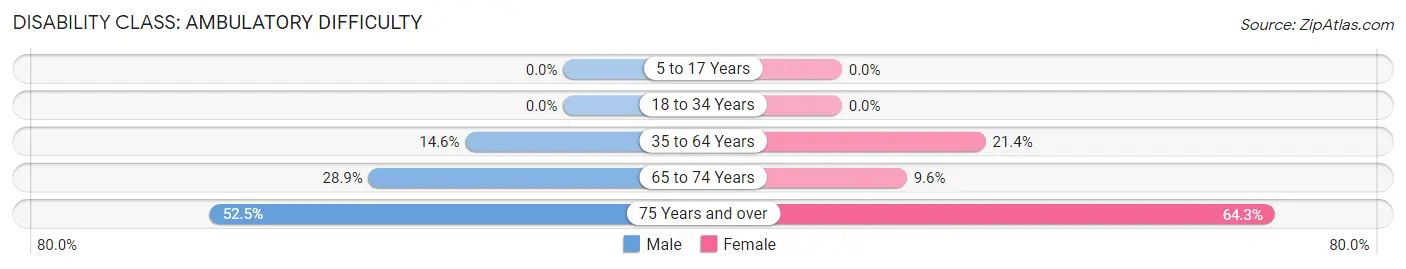
| Age Bracket | Male | Female |
| 5 to 17 Years | 0 (0.0%) | 0 (0.0%) |
| 18 to 34 Years | 0 (0.0%) | 0 (0.0%) |
| 35 to 64 Years | 70 (14.5%) | 111 (21.3%) |
| 65 to 74 Years | 24 (28.9%) | 19 (9.6%) |
| 75 Years and over | 63 (52.5%) | 36 (64.3%) |
Disability Class: Self-Care Difficulty
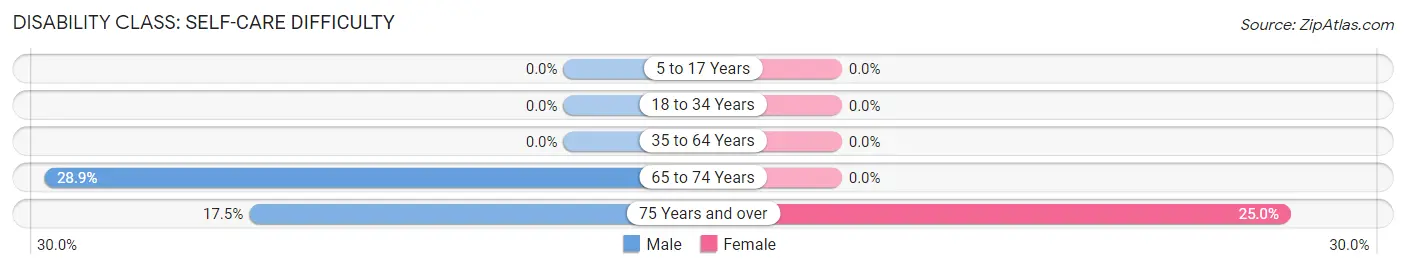
| Age Bracket | Male | Female |
| 5 to 17 Years | 0 (0.0%) | 0 (0.0%) |
| 18 to 34 Years | 0 (0.0%) | 0 (0.0%) |
| 35 to 64 Years | 0 (0.0%) | 0 (0.0%) |
| 65 to 74 Years | 24 (28.9%) | 0 (0.0%) |
| 75 Years and over | 21 (17.5%) | 14 (25.0%) |
Technology Access in Seneca Knolls
Computing Device Access in Seneca Knolls
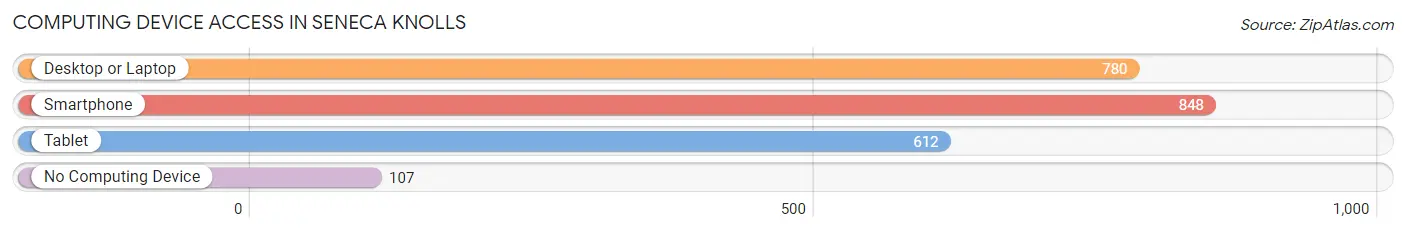
| Device Type | # Households | % Households |
| Desktop or Laptop | 780 | 79.8% |
| Smartphone | 848 | 86.8% |
| Tablet | 612 | 62.6% |
| No Computing Device | 107 | 11.0% |
| Total | 977 | 100.0% |
Internet Access in Seneca Knolls
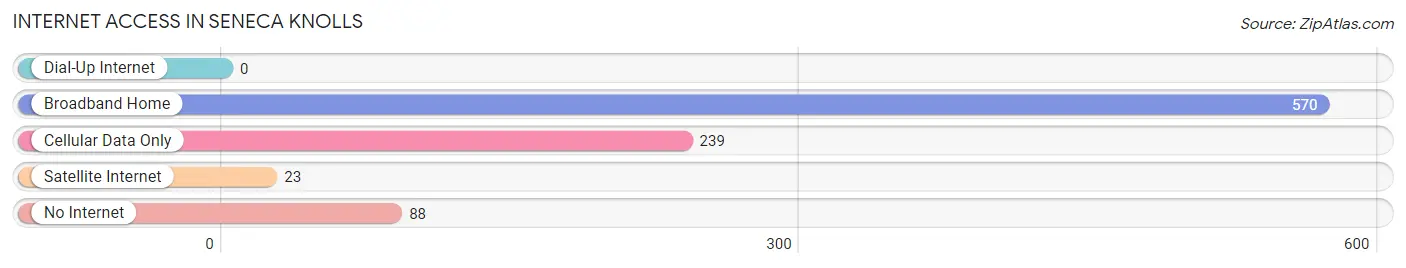
| Internet Type | # Households | % Households |
| Dial-Up Internet | 0 | 0.0% |
| Broadband Home | 570 | 58.3% |
| Cellular Data Only | 239 | 24.5% |
| Satellite Internet | 23 | 2.4% |
| No Internet | 88 | 9.0% |
| Total | 977 | 100.0% |
Seneca Knolls Summary
Seneca Knolls is a hamlet located in Onondaga County, New York. It is situated in the town of Onondaga, and is part of the Syracuse Metropolitan Statistical Area. The hamlet is located on the northern edge of Onondaga Lake, and is bordered by the towns of Clay and Cicero.
History
The area that is now Seneca Knolls was originally inhabited by the Onondaga Nation, a member of the Iroquois Confederacy. The Onondaga Nation was one of the original five nations of the Iroquois Confederacy, and was the most powerful of the five. The Onondaga Nation was known for its agricultural prowess, and the area around Seneca Knolls was used for farming and hunting.
In the late 1700s, the area was settled by European settlers, primarily of German and Dutch descent. The settlers established farms and businesses, and the area began to grow. In 1848, the hamlet was officially incorporated as Seneca Knolls.
Geography
Seneca Knolls is located in Onondaga County, New York. It is situated in the town of Onondaga, and is part of the Syracuse Metropolitan Statistical Area. The hamlet is located on the northern edge of Onondaga Lake, and is bordered by the towns of Clay and Cicero.
The hamlet is located in a hilly area, with elevations ranging from 400 to 600 feet above sea level. The highest point in the hamlet is located at the intersection of Seneca Knolls Road and Onondaga Lake Parkway, at an elevation of 602 feet.
The hamlet is located in a temperate climate, with hot summers and cold winters. The average annual temperature is around 50 degrees Fahrenheit, and the average annual precipitation is around 40 inches.
Economy
The economy of Seneca Knolls is primarily based on agriculture and tourism. The hamlet is home to several farms, which produce a variety of crops, including corn, soybeans, and hay. The hamlet is also home to several wineries, which produce a variety of wines.
The hamlet is also a popular tourist destination, due to its proximity to Onondaga Lake. The lake is a popular spot for fishing, boating, and swimming. The hamlet is also home to several parks, which offer a variety of recreational activities.
Demographics
As of the 2010 census, the population of Seneca Knolls was 2,845. The population is primarily white (94.3%), with a small percentage of African Americans (2.2%) and Hispanics (2.1%). The median household income is $60,000, and the median home value is $170,000.
The hamlet is served by the Onondaga Central School District, which includes two elementary schools, one middle school, and one high school. The hamlet is also home to several churches, including the Seneca Knolls United Methodist Church and the Seneca Knolls Presbyterian Church.
Common Questions
What is Per Capita Income in Seneca Knolls?
Per Capita income in Seneca Knolls is $31,256.
What is the Median Family Income in Seneca Knolls?
Median Family Income in Seneca Knolls is $72,067.
What is the Median Household income in Seneca Knolls?
Median Household Income in Seneca Knolls is $54,011.
What is Income or Wage Gap in Seneca Knolls?
Income or Wage Gap in Seneca Knolls is 10.9%.
Women in Seneca Knolls earn 89.1 cents for every dollar earned by a man.
What is Inequality or Gini Index in Seneca Knolls?
Inequality or Gini Index in Seneca Knolls is 0.39.
What is the Total Population of Seneca Knolls?
Total Population of Seneca Knolls is 2,085.
What is the Total Male Population of Seneca Knolls?
Total Male Population of Seneca Knolls is 918.
What is the Total Female Population of Seneca Knolls?
Total Female Population of Seneca Knolls is 1,167.
What is the Ratio of Males per 100 Females in Seneca Knolls?
There are 78.66 Males per 100 Females in Seneca Knolls.
What is the Ratio of Females per 100 Males in Seneca Knolls?
There are 127.12 Females per 100 Males in Seneca Knolls.
What is the Median Population Age in Seneca Knolls?
Median Population Age in Seneca Knolls is 56.6 Years.
What is the Average Family Size in Seneca Knolls
Average Family Size in Seneca Knolls is 2.6 People.
What is the Average Household Size in Seneca Knolls
Average Household Size in Seneca Knolls is 2.1 People.
How Large is the Labor Force in Seneca Knolls?
There are 1,027 People in the Labor Forcein in Seneca Knolls.
What is the Percentage of People in the Labor Force in Seneca Knolls?
52.4% of People are in the Labor Force in Seneca Knolls.
What is the Unemployment Rate in Seneca Knolls?
Unemployment Rate in Seneca Knolls is 10.0%.