Scio, NY Map & Demographics
Scio Map
Scio Overview
$27,640
PER CAPITA INCOME
$87,969
AVG FAMILY INCOME
35.9%
WAGE / INCOME GAP [ % ]
64.1¢/ $1
WAGE / INCOME GAP [ $ ]
0.53
INEQUALITY / GINI INDEX
589
TOTAL POPULATION
352
MALE POPULATION
237
FEMALE POPULATION
148.52
MALES / 100 FEMALES
67.33
FEMALES / 100 MALES
56.4
MEDIAN AGE
2.8
AVG FAMILY SIZE
1.9
AVG HOUSEHOLD SIZE
276
LABOR FORCE [ PEOPLE ]
51.1%
PERCENT IN LABOR FORCE
13.0%
UNEMPLOYMENT RATE
Scio Zip Codes
Income in Scio
Income Overview in Scio
| Characteristic | Number | Measure |
| Per Capita Income | 589 | $27,640 |
| Median Family Income | 154 | $87,969 |
| Mean Family Income | 154 | $78,595 |
| Median Household Income | 303 | $0 |
| Mean Household Income | 303 | $50,364 |
| Income Deficit | 154 | $0 |
| Wage / Income Gap (%) | 589 | 35.89% |
| Wage / Income Gap ($) | 589 | 64.11¢ per $1 |
| Gini / Inequality Index | 589 | 0.53 |
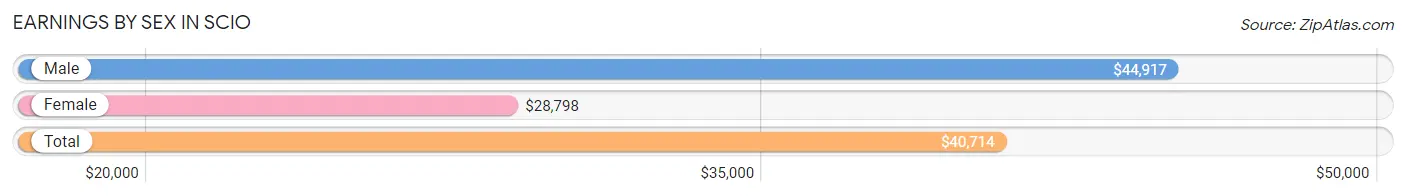
Earnings by Sex in Scio
Average Earnings in Scio are $40,714, $44,917 for men and $28,798 for women, a difference of 35.9%.
| Sex | Number | Average Earnings |
| Male | 159 (57.6%) | $44,917 |
| Female | 117 (42.4%) | $28,798 |
| Total | 276 (100.0%) | $40,714 |
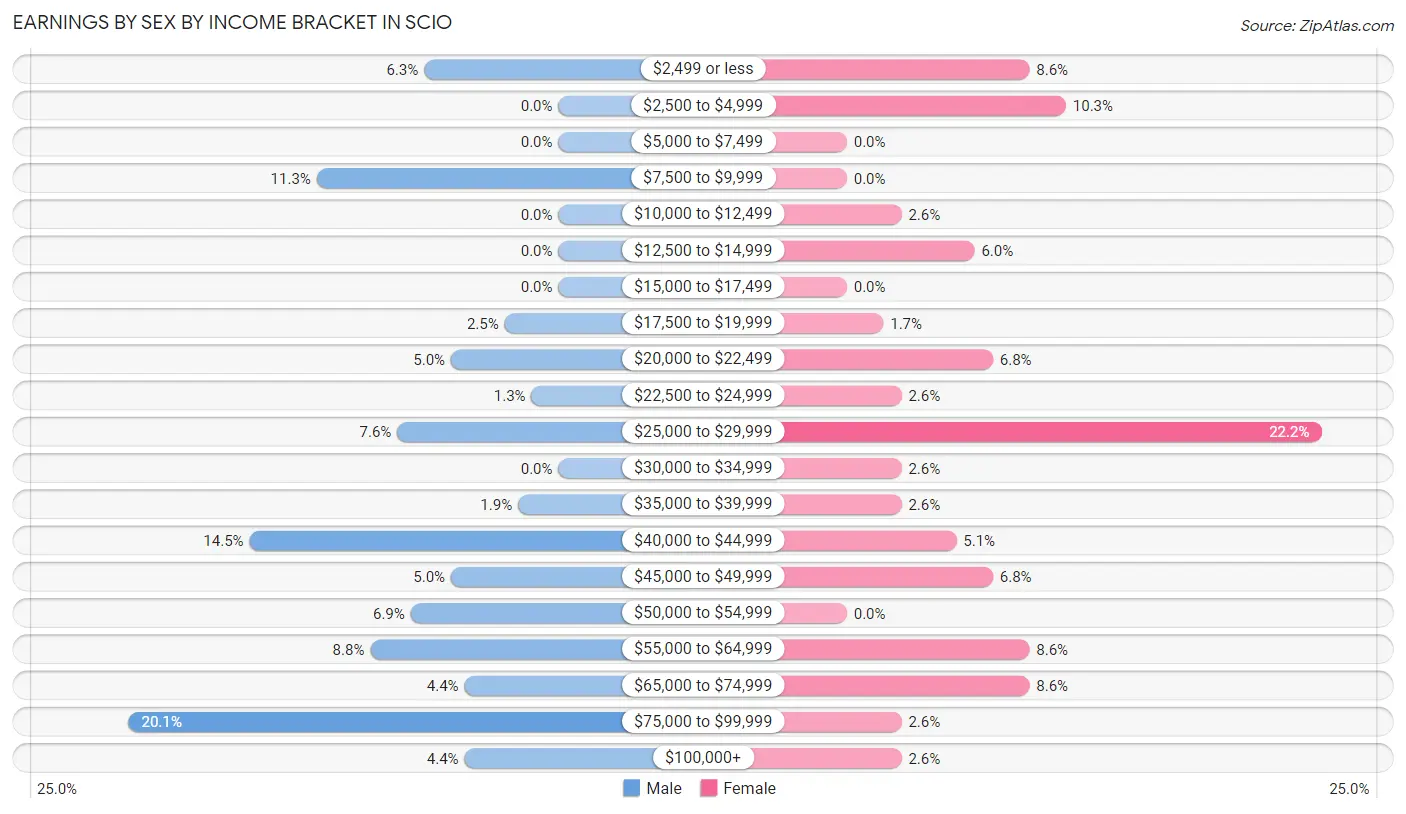
Earnings by Sex by Income Bracket in Scio
The most common earnings brackets in Scio are $75,000 to $99,999 for men (32 | 20.1%) and $25,000 to $29,999 for women (26 | 22.2%).
| Income | Male | Female |
| $2,499 or less | 10 (6.3%) | 10 (8.6%) |
| $2,500 to $4,999 | 0 (0.0%) | 12 (10.3%) |
| $5,000 to $7,499 | 0 (0.0%) | 0 (0.0%) |
| $7,500 to $9,999 | 18 (11.3%) | 0 (0.0%) |
| $10,000 to $12,499 | 0 (0.0%) | 3 (2.6%) |
| $12,500 to $14,999 | 0 (0.0%) | 7 (6.0%) |
| $15,000 to $17,499 | 0 (0.0%) | 0 (0.0%) |
| $17,500 to $19,999 | 4 (2.5%) | 2 (1.7%) |
| $20,000 to $22,499 | 8 (5.0%) | 8 (6.8%) |
| $22,500 to $24,999 | 2 (1.3%) | 3 (2.6%) |
| $25,000 to $29,999 | 12 (7.5%) | 26 (22.2%) |
| $30,000 to $34,999 | 0 (0.0%) | 3 (2.6%) |
| $35,000 to $39,999 | 3 (1.9%) | 3 (2.6%) |
| $40,000 to $44,999 | 23 (14.5%) | 6 (5.1%) |
| $45,000 to $49,999 | 8 (5.0%) | 8 (6.8%) |
| $50,000 to $54,999 | 11 (6.9%) | 0 (0.0%) |
| $55,000 to $64,999 | 14 (8.8%) | 10 (8.6%) |
| $65,000 to $74,999 | 7 (4.4%) | 10 (8.6%) |
| $75,000 to $99,999 | 32 (20.1%) | 3 (2.6%) |
| $100,000+ | 7 (4.4%) | 3 (2.6%) |
| Total | 159 (100.0%) | 117 (100.0%) |
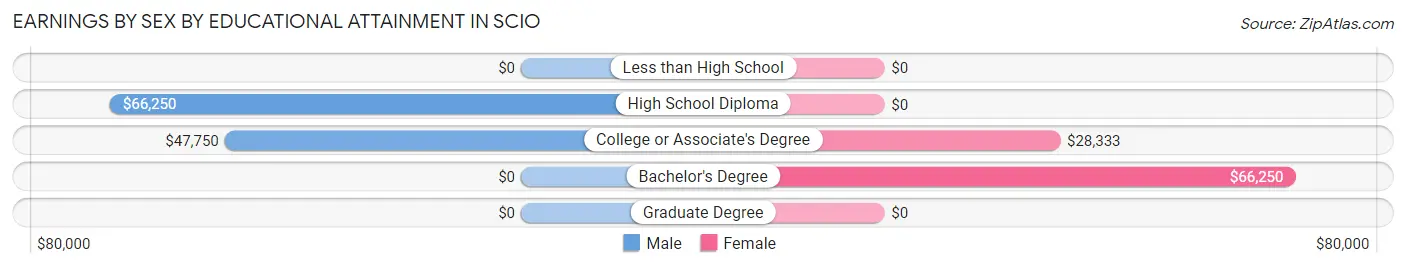
Earnings by Sex by Educational Attainment in Scio
Average earnings in Scio are $53,068 for men and $28,798 for women, a difference of 45.7%. Men with an educational attainment of high school diploma enjoy the highest average annual earnings of $66,250, while those with college or associate's degree education earn the least with $47,750. Women with an educational attainment of bachelor's degree earn the most with the average annual earnings of $66,250, while those with college or associate's degree education have the smallest earnings of $28,333.
| Educational Attainment | Male Income | Female Income |
| Less than High School | - | - |
| High School Diploma | $66,250 | $0 |
| College or Associate's Degree | $47,750 | $28,333 |
| Bachelor's Degree | - | - |
| Graduate Degree | - | - |
| Total | $53,068 | $28,798 |
Family Income in Scio
Family Income Brackets in Scio
According to the Scio family income data, there are 54 families falling into the $75,000 to $99,999 income range, which is the most common income bracket and makes up 35.1% of all families. Conversely, the $200,000+ income bracket is the least frequent group with only 1 families (0.6%) belonging to this category.
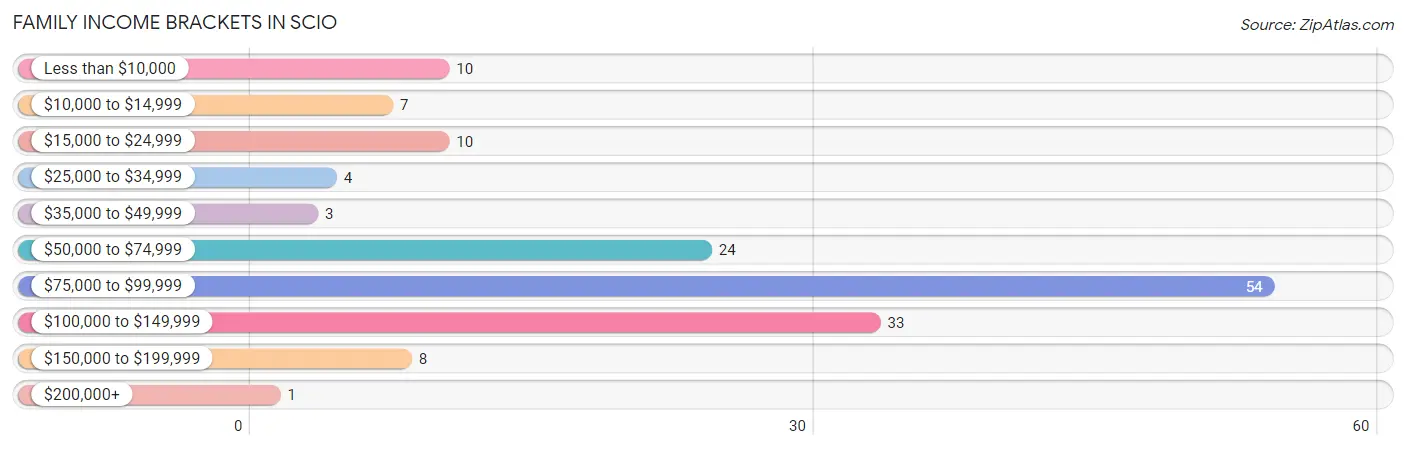
| Income Bracket | # Families | % Families |
| Less than $10,000 | 10 | 6.5% |
| $10,000 to $14,999 | 7 | 4.5% |
| $15,000 to $24,999 | 10 | 6.5% |
| $25,000 to $34,999 | 4 | 2.6% |
| $35,000 to $49,999 | 3 | 1.9% |
| $50,000 to $74,999 | 24 | 15.6% |
| $75,000 to $99,999 | 54 | 35.1% |
| $100,000 to $149,999 | 33 | 21.4% |
| $150,000 to $199,999 | 8 | 5.2% |
| $200,000+ | 1 | 0.6% |
Family Income by Famaliy Size in Scio
3-person families (13 | 8.4%) account for the highest median family income in Scio with $87,917 per family, while 2-person families (115 | 74.7%) have the highest median income of $41,094 per family member.
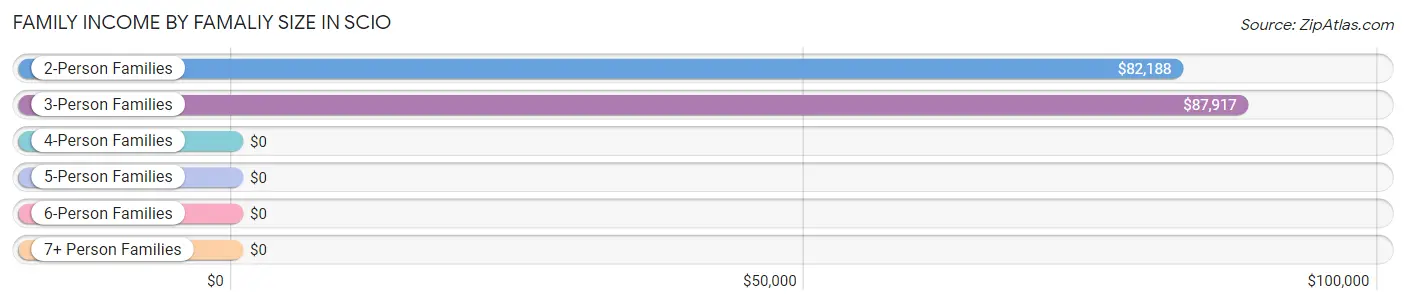
| Income Bracket | # Families | Median Income |
| 2-Person Families | 115 (74.7%) | $82,188 |
| 3-Person Families | 13 (8.4%) | $87,917 |
| 4-Person Families | 16 (10.4%) | $0 |
| 5-Person Families | 10 (6.5%) | $0 |
| 6-Person Families | 0 (0.0%) | $0 |
| 7+ Person Families | 0 (0.0%) | $0 |
| Total | 154 (100.0%) | $87,969 |
Family Income by Number of Earners in Scio
The median family income in Scio is $87,969, with families comprising 3+ earners (19) having the highest median family income of $111,406, while families with 1 earner (43) have the lowest median family income of $53,125, accounting for 12.3% and 27.9% of families, respectively.
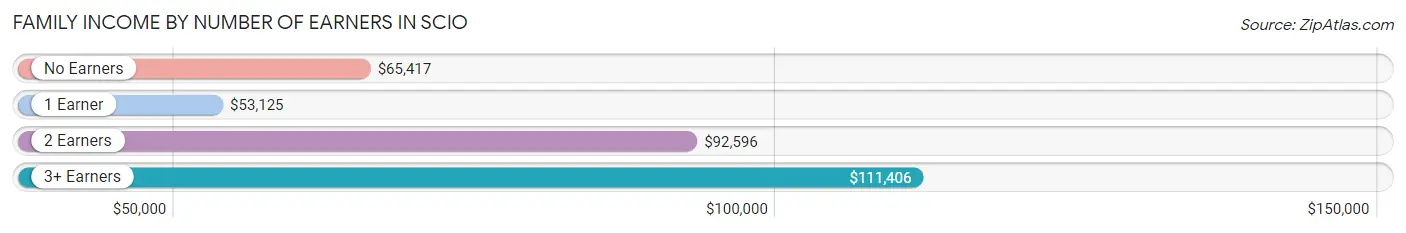
| Number of Earners | # Families | Median Income |
| No Earners | 31 (20.1%) | $65,417 |
| 1 Earner | 43 (27.9%) | $53,125 |
| 2 Earners | 61 (39.6%) | $92,596 |
| 3+ Earners | 19 (12.3%) | $111,406 |
| Total | 154 (100.0%) | $87,969 |
Household Income in Scio
Household Income Brackets in Scio
With 115 households falling in the category, the less than $10,000 income range is the most frequent in Scio, accounting for 38.0% of all households. In contrast, only 1 households (0.3%) fall into the $200,000+ income bracket, making it the least populous group.
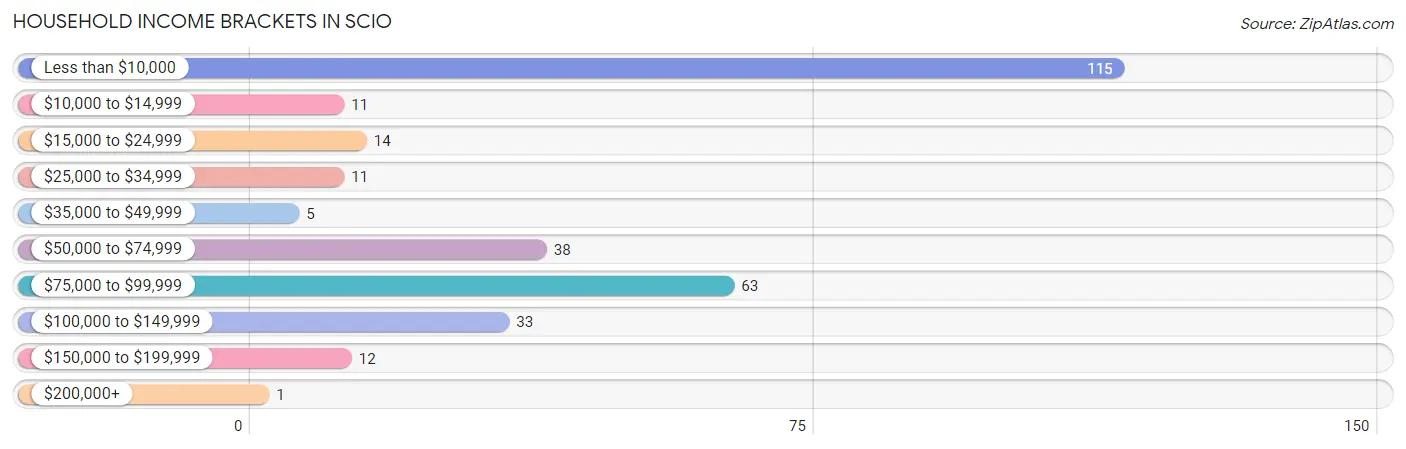
| Income Bracket | # Households | % Households |
| Less than $10,000 | 115 | 38.0% |
| $10,000 to $14,999 | 11 | 3.6% |
| $15,000 to $24,999 | 14 | 4.6% |
| $25,000 to $34,999 | 11 | 3.6% |
| $35,000 to $49,999 | 5 | 1.7% |
| $50,000 to $74,999 | 38 | 12.5% |
| $75,000 to $99,999 | 63 | 20.8% |
| $100,000 to $149,999 | 33 | 10.9% |
| $150,000 to $199,999 | 12 | 4.0% |
| $200,000+ | 1 | 0.3% |
Household Income by Householder Age in Scio
The median household income in Scio is $0, with the highest median household income of $60,972 found in the 65+ years age bracket for the primary householder. A total of 69 households (22.8%) fall into this category. Meanwhile, the 15 to 24 years age bracket for the primary householder has the lowest median household income of $0, with 2 households (0.7%) in this group.
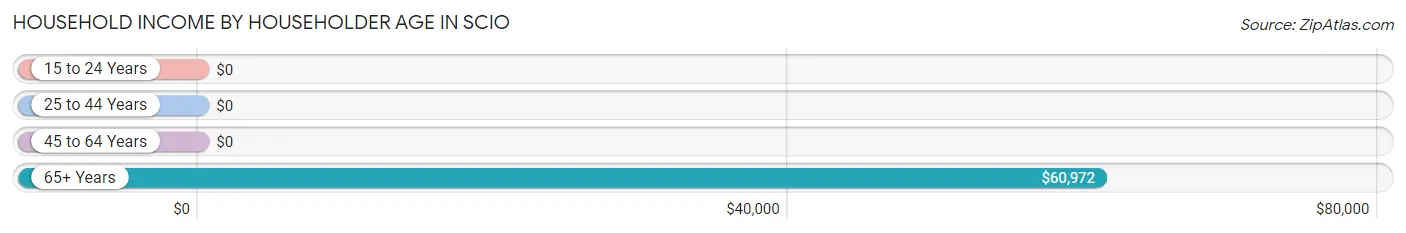
| Income Bracket | # Households | Median Income |
| 15 to 24 Years | 2 (0.7%) | $0 |
| 25 to 44 Years | 34 (11.2%) | $0 |
| 45 to 64 Years | 198 (65.3%) | $0 |
| 65+ Years | 69 (22.8%) | $60,972 |
| Total | 303 (100.0%) | $0 |
Poverty in Scio
Income Below Poverty by Sex and Age in Scio
With 45.7% poverty level for males and 10.1% for females among the residents of Scio, 15 year old males and 35 to 44 year old females are the most vulnerable to poverty, with 7 males (100.0%) and 17 females (36.2%) in their respective age groups living below the poverty level.
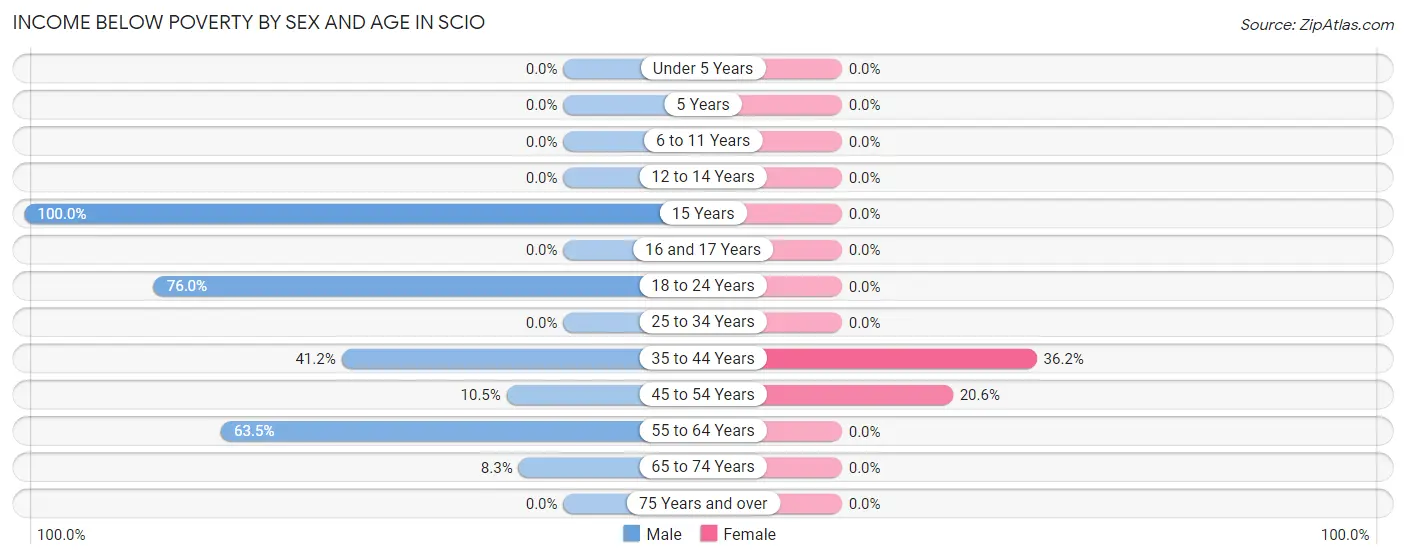
| Age Bracket | Male | Female |
| Under 5 Years | 0 (0.0%) | 0 (0.0%) |
| 5 Years | 0 (0.0%) | 0 (0.0%) |
| 6 to 11 Years | 0 (0.0%) | 0 (0.0%) |
| 12 to 14 Years | 0 (0.0%) | 0 (0.0%) |
| 15 Years | 7 (100.0%) | 0 (0.0%) |
| 16 and 17 Years | 0 (0.0%) | 0 (0.0%) |
| 18 to 24 Years | 38 (76.0%) | 0 (0.0%) |
| 25 to 34 Years | 0 (0.0%) | 0 (0.0%) |
| 35 to 44 Years | 7 (41.2%) | 17 (36.2%) |
| 45 to 54 Years | 4 (10.5%) | 7 (20.6%) |
| 55 to 64 Years | 101 (63.5%) | 0 (0.0%) |
| 65 to 74 Years | 4 (8.3%) | 0 (0.0%) |
| 75 Years and over | 0 (0.0%) | 0 (0.0%) |
| Total | 161 (45.7%) | 24 (10.1%) |
Income Above Poverty by Sex and Age in Scio
According to the poverty statistics in Scio, males aged under 5 years and females aged under 5 years are the age groups that are most secure financially, with 100.0% of males and 100.0% of females in these age groups living above the poverty line.
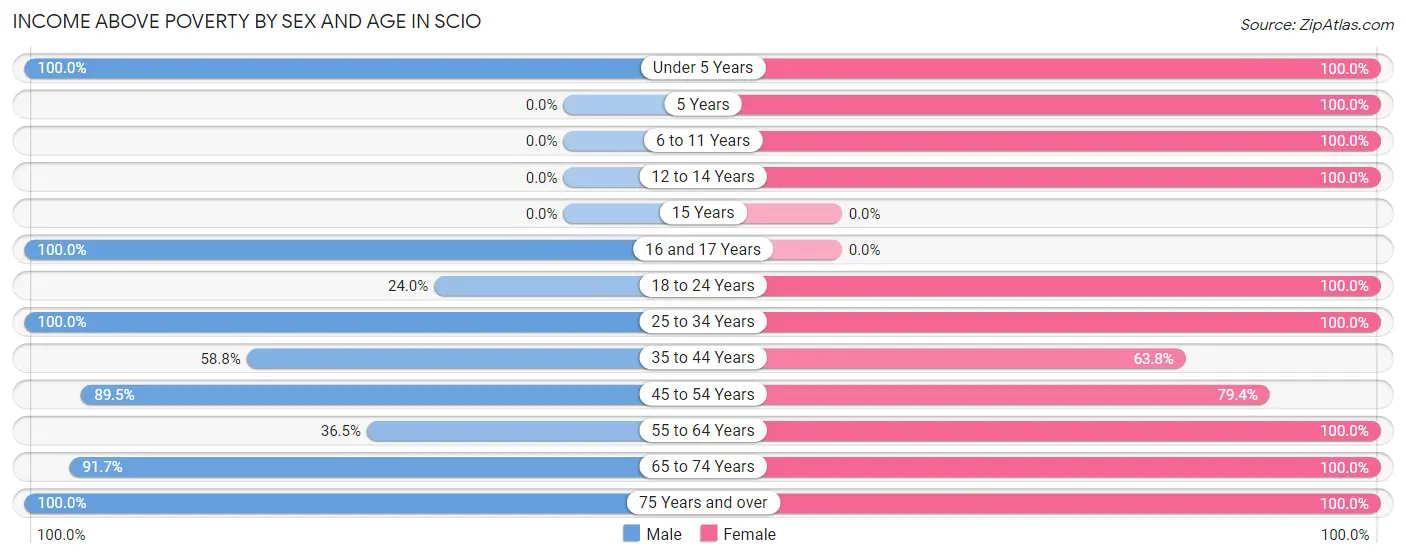
| Age Bracket | Male | Female |
| Under 5 Years | 7 (100.0%) | 19 (100.0%) |
| 5 Years | 0 (0.0%) | 3 (100.0%) |
| 6 to 11 Years | 0 (0.0%) | 10 (100.0%) |
| 12 to 14 Years | 0 (0.0%) | 3 (100.0%) |
| 15 Years | 0 (0.0%) | 0 (0.0%) |
| 16 and 17 Years | 1 (100.0%) | 0 (0.0%) |
| 18 to 24 Years | 12 (24.0%) | 4 (100.0%) |
| 25 to 34 Years | 16 (100.0%) | 5 (100.0%) |
| 35 to 44 Years | 10 (58.8%) | 30 (63.8%) |
| 45 to 54 Years | 34 (89.5%) | 27 (79.4%) |
| 55 to 64 Years | 58 (36.5%) | 64 (100.0%) |
| 65 to 74 Years | 44 (91.7%) | 21 (100.0%) |
| 75 Years and over | 9 (100.0%) | 27 (100.0%) |
| Total | 191 (54.3%) | 213 (89.9%) |
Income Below Poverty Among Married-Couple Families in Scio
The poverty statistics for married-couple families in Scio show that 5.4% or 7 of the total 130 families live below the poverty line. Families with 1 or 2 children have the highest poverty rate of 29.2%, comprising of 7 families. On the other hand, families with no children have the lowest poverty rate of 0.0%, which includes 0 families.
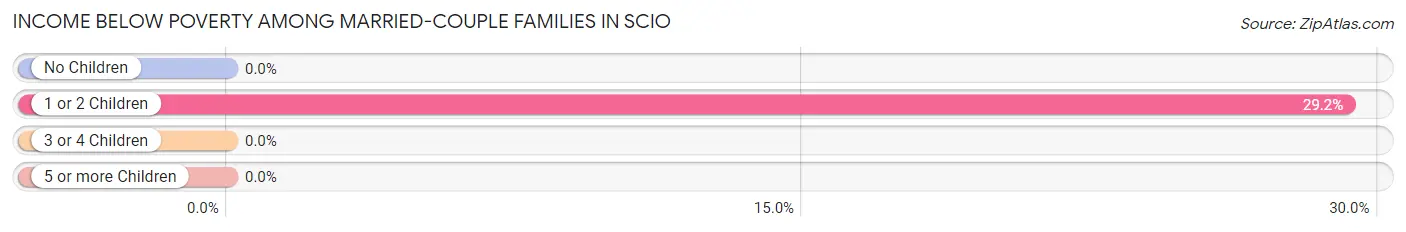
| Children | Above Poverty | Below Poverty |
| No Children | 104 (100.0%) | 0 (0.0%) |
| 1 or 2 Children | 17 (70.8%) | 7 (29.2%) |
| 3 or 4 Children | 2 (100.0%) | 0 (0.0%) |
| 5 or more Children | 0 (0.0%) | 0 (0.0%) |
| Total | 123 (94.6%) | 7 (5.4%) |
Income Below Poverty Among Single-Parent Households in Scio
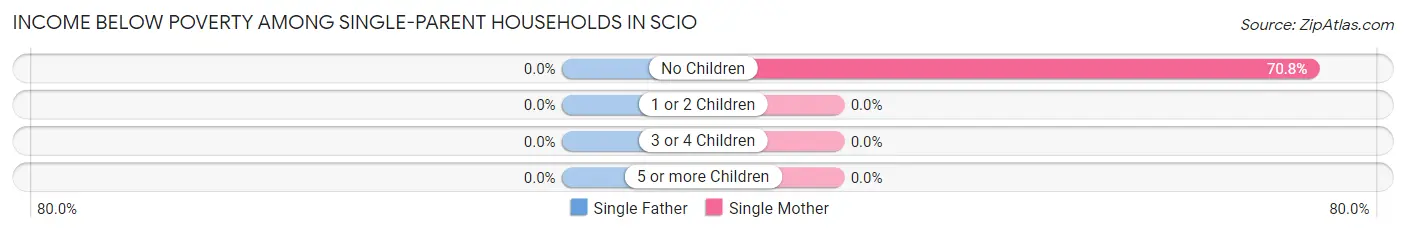
| Children | Single Father | Single Mother |
| No Children | 0 (0.0%) | 17 (70.8%) |
| 1 or 2 Children | 0 (0.0%) | 0 (0.0%) |
| 3 or 4 Children | 0 (0.0%) | 0 (0.0%) |
| 5 or more Children | 0 (0.0%) | 0 (0.0%) |
| Total | 0 (0.0%) | 17 (70.8%) |
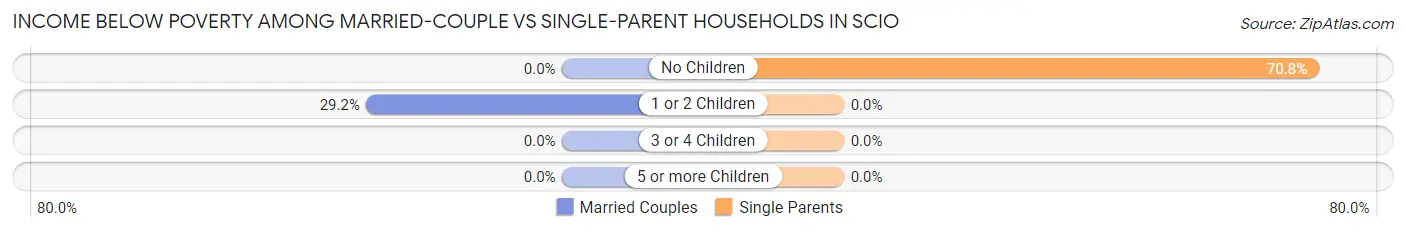
Income Below Poverty Among Married-Couple vs Single-Parent Households in Scio
The poverty data for Scio shows that 7 of the married-couple family households (5.4%) and 17 of the single-parent households (70.8%) are living below the poverty level. Within the married-couple family households, those with 1 or 2 children have the highest poverty rate, with 7 households (29.2%) falling below the poverty line. Among the single-parent households, those with no children have the highest poverty rate, with 17 household (70.8%) living below poverty.
| Children | Married-Couple Families | Single-Parent Households |
| No Children | 0 (0.0%) | 17 (70.8%) |
| 1 or 2 Children | 7 (29.2%) | 0 (0.0%) |
| 3 or 4 Children | 0 (0.0%) | 0 (0.0%) |
| 5 or more Children | 0 (0.0%) | 0 (0.0%) |
| Total | 7 (5.4%) | 17 (70.8%) |
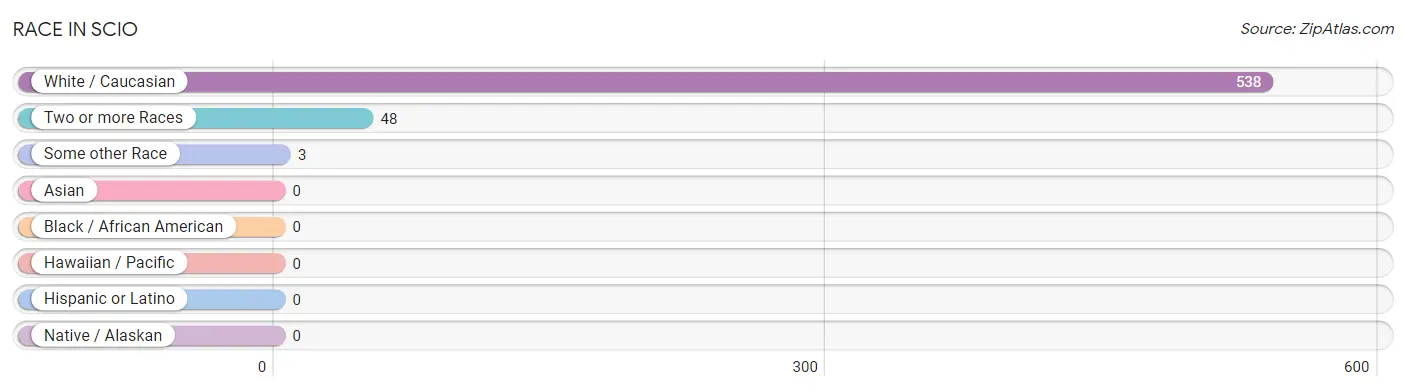
Race in Scio
The most populous races in Scio are White / Caucasian (538 | 91.3%), Two or more Races (48 | 8.2%), and Some other Race (3 | 0.5%).
| Race | # Population | % Population |
| Asian | 0 | 0.0% |
| Black / African American | 0 | 0.0% |
| Hawaiian / Pacific | 0 | 0.0% |
| Hispanic or Latino | 0 | 0.0% |
| Native / Alaskan | 0 | 0.0% |
| White / Caucasian | 538 | 91.3% |
| Two or more Races | 48 | 8.2% |
| Some other Race | 3 | 0.5% |
| Total | 589 | 100.0% |
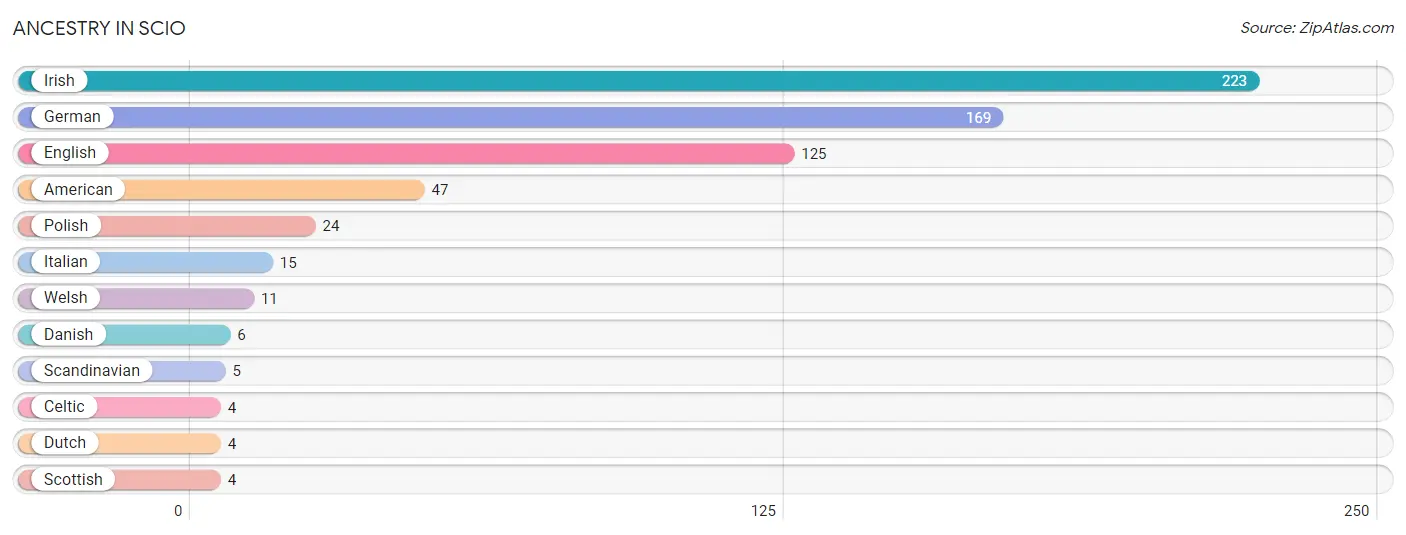
Ancestry in Scio
The most populous ancestries reported in Scio are Irish (223 | 37.9%), German (169 | 28.7%), English (125 | 21.2%), American (47 | 8.0%), and Polish (24 | 4.1%), together accounting for 99.8% of all Scio residents.
| Ancestry | # Population | % Population |
| American | 47 | 8.0% |
| Celtic | 4 | 0.7% |
| Danish | 6 | 1.0% |
| Dutch | 4 | 0.7% |
| English | 125 | 21.2% |
| German | 169 | 28.7% |
| Irish | 223 | 37.9% |
| Italian | 15 | 2.5% |
| Polish | 24 | 4.1% |
| Scandinavian | 5 | 0.9% |
| Scottish | 4 | 0.7% |
| Welsh | 11 | 1.9% | View All 12 Rows |
Immigrants in Scio

| Immigration Origin | # Population | % Population | View All 0 Rows |
Sex and Age in Scio
Sex and Age in Scio
The most populous age groups in Scio are 60 to 64 Years (121 | 34.4%) for men and 55 to 59 Years (45 | 19.0%) for women.
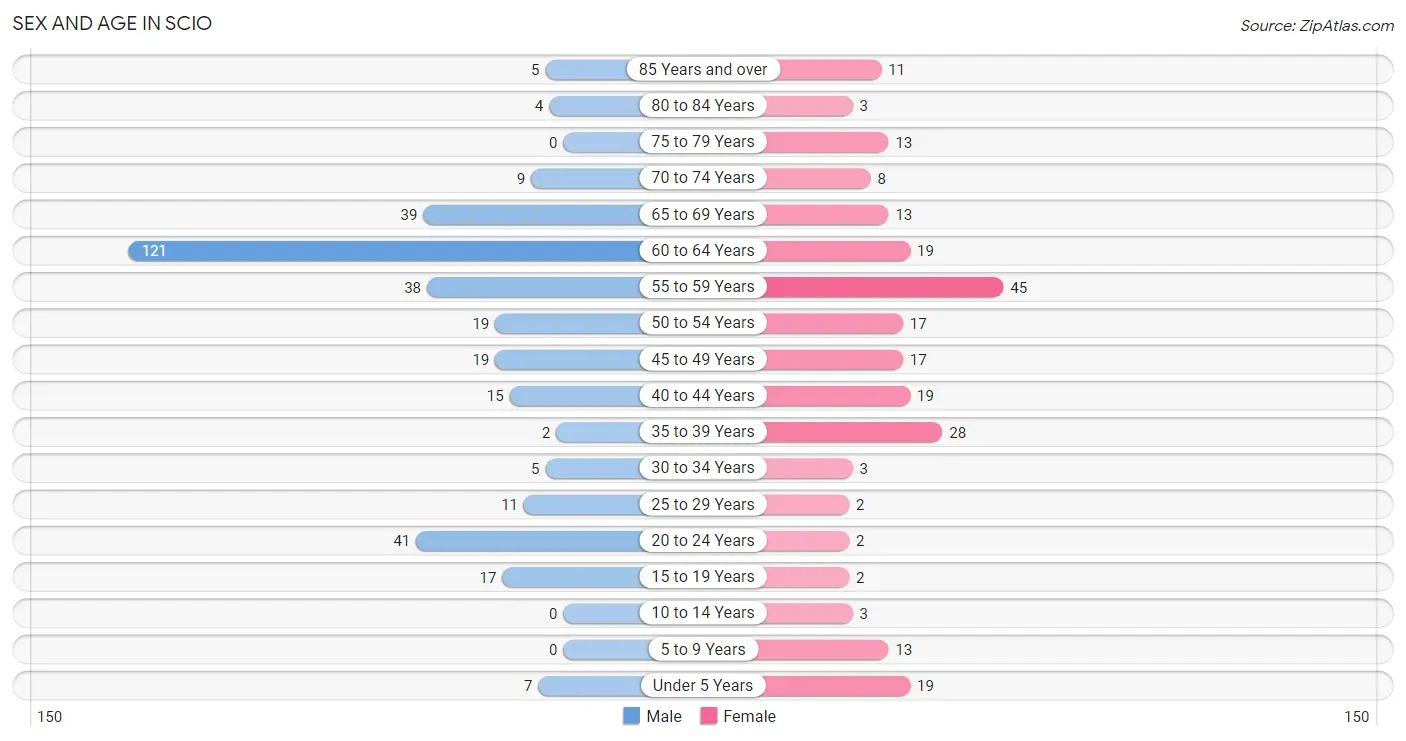
| Age Bracket | Male | Female |
| Under 5 Years | 7 (2.0%) | 19 (8.0%) |
| 5 to 9 Years | 0 (0.0%) | 13 (5.5%) |
| 10 to 14 Years | 0 (0.0%) | 3 (1.3%) |
| 15 to 19 Years | 17 (4.8%) | 2 (0.8%) |
| 20 to 24 Years | 41 (11.7%) | 2 (0.8%) |
| 25 to 29 Years | 11 (3.1%) | 2 (0.8%) |
| 30 to 34 Years | 5 (1.4%) | 3 (1.3%) |
| 35 to 39 Years | 2 (0.6%) | 28 (11.8%) |
| 40 to 44 Years | 15 (4.3%) | 19 (8.0%) |
| 45 to 49 Years | 19 (5.4%) | 17 (7.2%) |
| 50 to 54 Years | 19 (5.4%) | 17 (7.2%) |
| 55 to 59 Years | 38 (10.8%) | 45 (19.0%) |
| 60 to 64 Years | 121 (34.4%) | 19 (8.0%) |
| 65 to 69 Years | 39 (11.1%) | 13 (5.5%) |
| 70 to 74 Years | 9 (2.6%) | 8 (3.4%) |
| 75 to 79 Years | 0 (0.0%) | 13 (5.5%) |
| 80 to 84 Years | 4 (1.1%) | 3 (1.3%) |
| 85 Years and over | 5 (1.4%) | 11 (4.6%) |
| Total | 352 (100.0%) | 237 (100.0%) |
Families and Households in Scio
Median Family Size in Scio
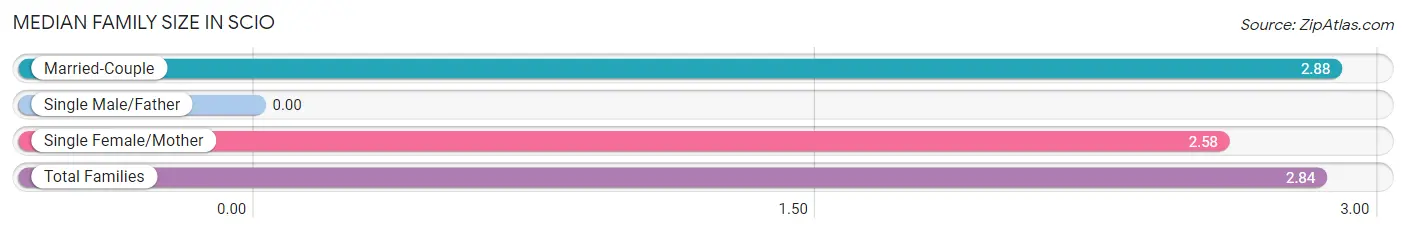
| Family Type | # Families | Family Size |
| Married-Couple | 130 (84.4%) | 2.88 |
| Single Male/Father | 0 (0.0%) | - |
| Single Female/Mother | 24 (15.6%) | 2.58 |
| Total Families | 154 (100.0%) | 2.84 |
Median Household Size in Scio
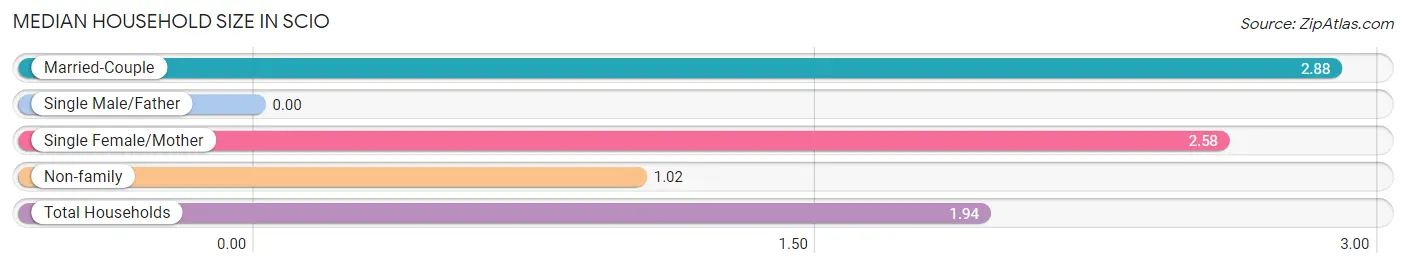
| Household Type | # Households | Household Size |
| Married-Couple | 130 (42.9%) | 2.88 |
| Single Male/Father | 0 (0.0%) | - |
| Single Female/Mother | 24 (7.9%) | 2.58 |
| Non-family | 149 (49.2%) | 1.02 |
| Total Households | 303 (100.0%) | 1.94 |
Household Size by Marriage Status in Scio
Out of a total of 303 households in Scio, 154 (50.8%) are family households, while 149 (49.2%) are nonfamily households. The most numerous type of family households are 2-person households, comprising 115, and the most common type of nonfamily households are 1-person households, comprising 145.
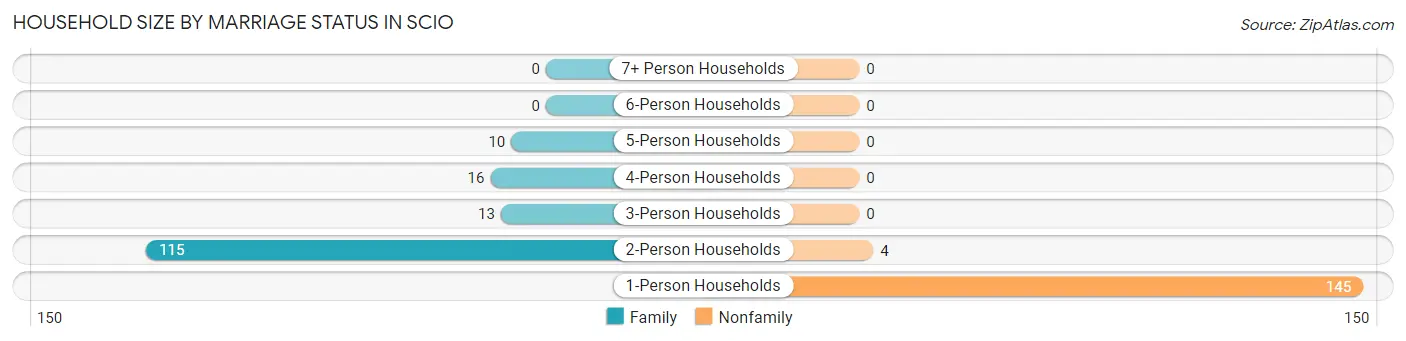
| Household Size | Family Households | Nonfamily Households |
| 1-Person Households | - | 145 (47.8%) |
| 2-Person Households | 115 (38.0%) | 4 (1.3%) |
| 3-Person Households | 13 (4.3%) | 0 (0.0%) |
| 4-Person Households | 16 (5.3%) | 0 (0.0%) |
| 5-Person Households | 10 (3.3%) | 0 (0.0%) |
| 6-Person Households | 0 (0.0%) | 0 (0.0%) |
| 7+ Person Households | 0 (0.0%) | 0 (0.0%) |
| Total | 154 (50.8%) | 149 (49.2%) |
Female Fertility in Scio
Fertility by Age in Scio
Average fertility rate in Scio is 27.0 births per 1,000 women. Women in the age bracket of 20 to 34 years have the highest fertility rate with 286.0 births per 1,000 women. Women in the age bracket of 20 to 34 years acount for 100.0% of all women with births.
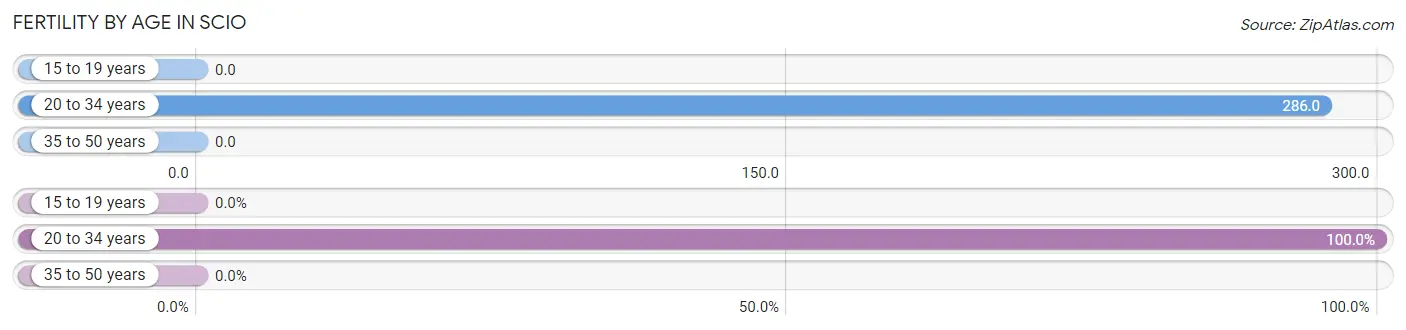
| Age Bracket | Women with Births | Births / 1,000 Women |
| 15 to 19 years | 0 (0.0%) | 0.0 |
| 20 to 34 years | 2 (100.0%) | 286.0 |
| 35 to 50 years | 0 (0.0%) | 0.0 |
| Total | 2 (100.0%) | 27.0 |
Fertility by Age by Marriage Status in Scio
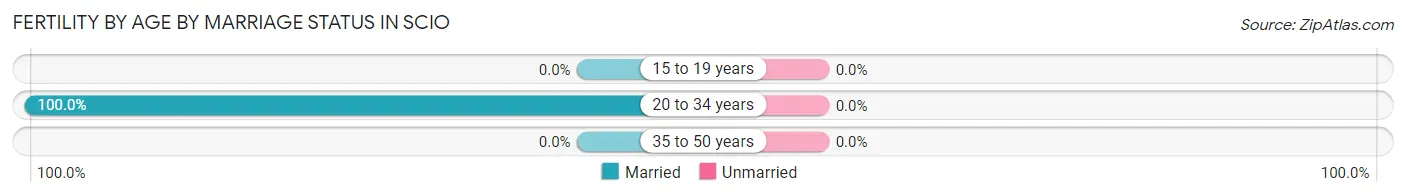
| Age Bracket | Married | Unmarried |
| 15 to 19 years | 0 (0.0%) | 0 (0.0%) |
| 20 to 34 years | 2 (100.0%) | 0 (0.0%) |
| 35 to 50 years | 0 (0.0%) | 0 (0.0%) |
| Total | 2 (100.0%) | 0 (0.0%) |
Fertility by Education in Scio
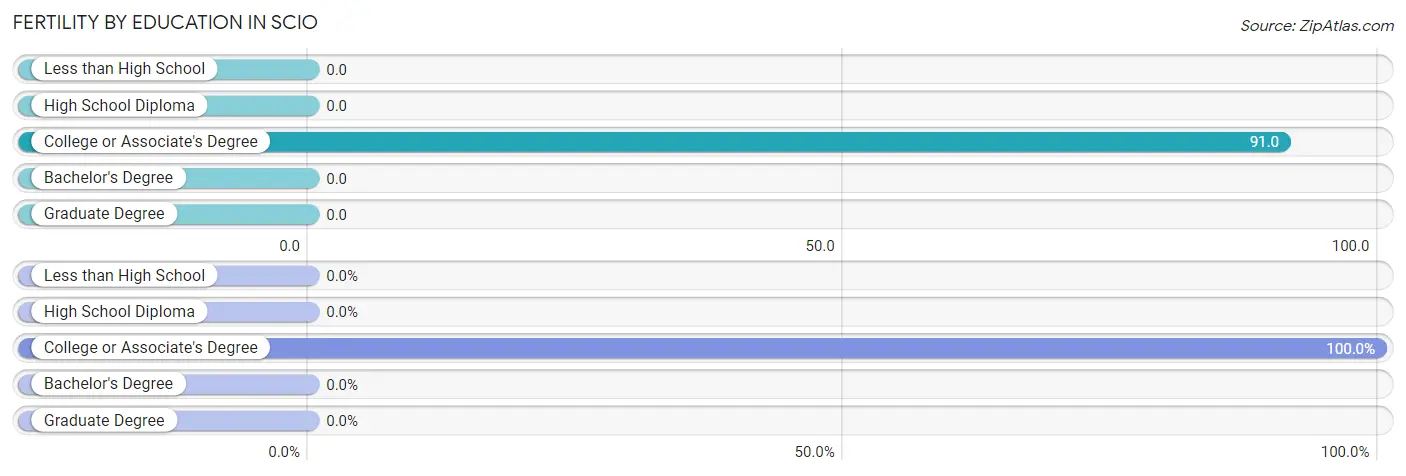
| Educational Attainment | Women with Births | Births / 1,000 Women |
| Less than High School | 0 (0.0%) | 0.0 |
| High School Diploma | 0 (0.0%) | 0.0 |
| College or Associate's Degree | 2 (100.0%) | 91.0 |
| Bachelor's Degree | 0 (0.0%) | 0.0 |
| Graduate Degree | 0 (0.0%) | 0.0 |
| Total | 2 (100.0%) | 27.0 |
Fertility by Education by Marriage Status in Scio
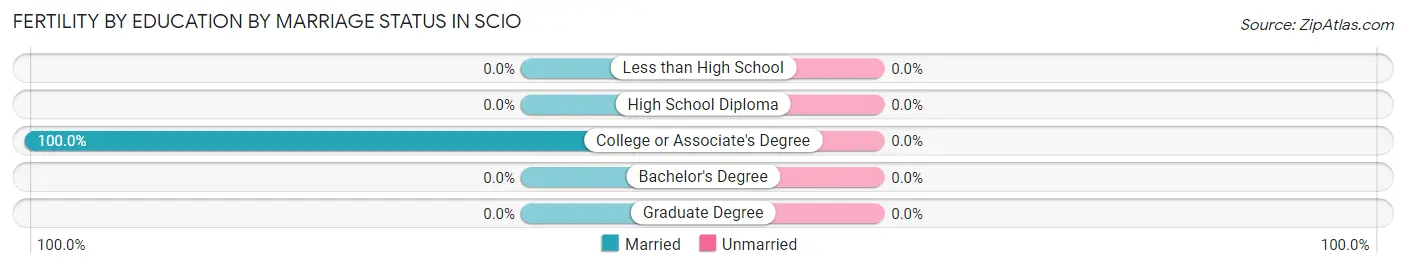
| Educational Attainment | Married | Unmarried |
| Less than High School | 0 (0.0%) | 0 (0.0%) |
| High School Diploma | 0 (0.0%) | 0 (0.0%) |
| College or Associate's Degree | 2 (100.0%) | 0 (0.0%) |
| Bachelor's Degree | 0 (0.0%) | 0 (0.0%) |
| Graduate Degree | 0 (0.0%) | 0 (0.0%) |
| Total | 2 (100.0%) | 0 (0.0%) |
Employment Characteristics in Scio
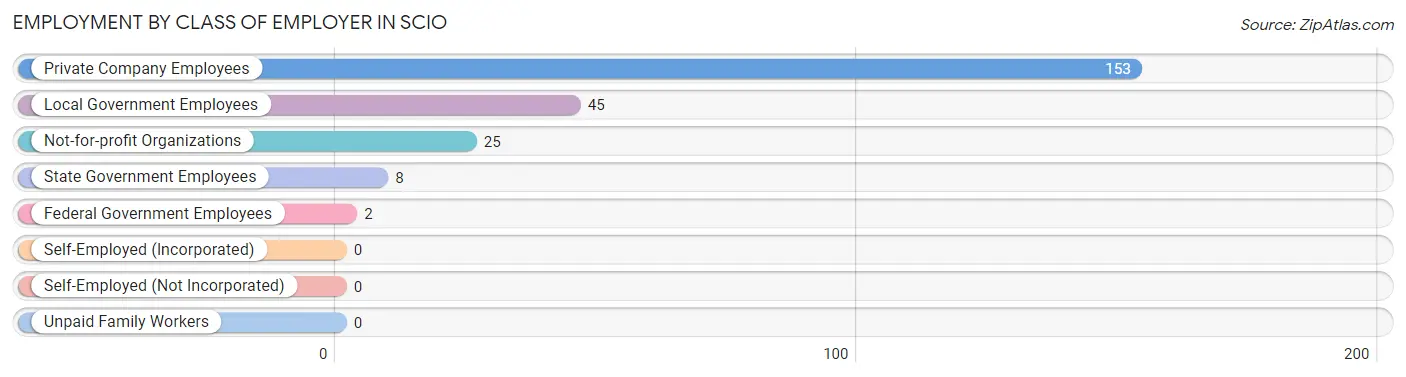
Employment by Class of Employer in Scio
Among the 233 employed individuals in Scio, private company employees (153 | 65.7%), local government employees (45 | 19.3%), and not-for-profit organizations (25 | 10.7%) make up the most common classes of employment.
| Employer Class | # Employees | % Employees |
| Private Company Employees | 153 | 65.7% |
| Self-Employed (Incorporated) | 0 | 0.0% |
| Self-Employed (Not Incorporated) | 0 | 0.0% |
| Not-for-profit Organizations | 25 | 10.7% |
| Local Government Employees | 45 | 19.3% |
| State Government Employees | 8 | 3.4% |
| Federal Government Employees | 2 | 0.9% |
| Unpaid Family Workers | 0 | 0.0% |
| Total | 233 | 100.0% |
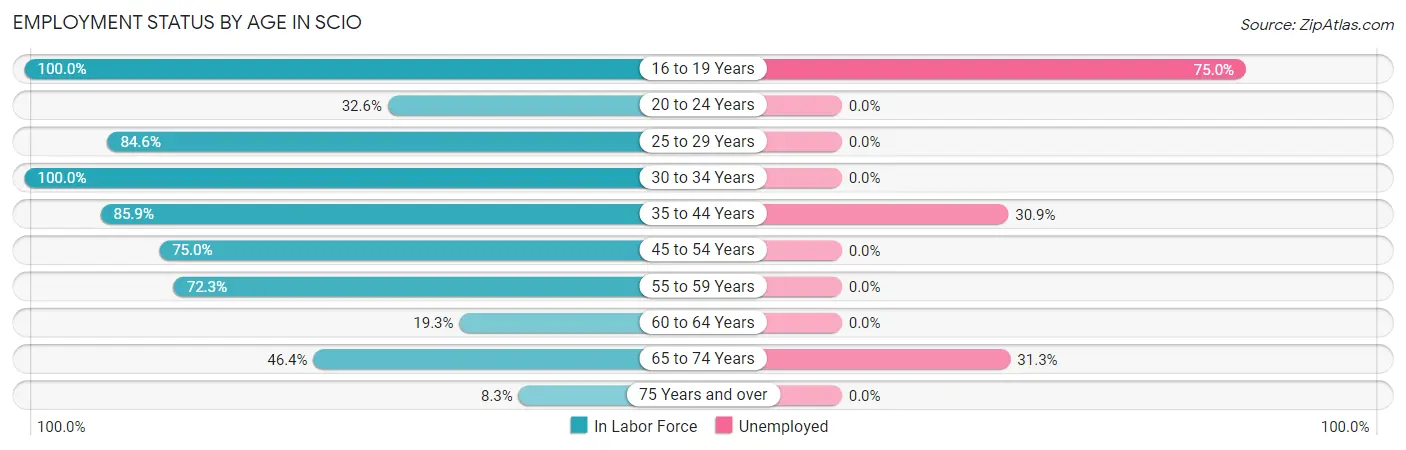
Employment Status by Age in Scio
According to the labor force statistics for Scio, out of the total population over 16 years of age (540), 51.1% or 276 individuals are in the labor force, with 13.0% or 36 of them unemployed. The age group with the highest labor force participation rate is 16 to 19 years, with 100.0% or 12 individuals in the labor force. Within the labor force, the 16 to 19 years age range has the highest percentage of unemployed individuals, with 75.0% or 9 of them being unemployed.
| Age Bracket | In Labor Force | Unemployed |
| 16 to 19 Years | 12 (100.0%) | 9 (75.0%) |
| 20 to 24 Years | 14 (32.6%) | 0 (0.0%) |
| 25 to 29 Years | 11 (84.6%) | 0 (0.0%) |
| 30 to 34 Years | 8 (100.0%) | 0 (0.0%) |
| 35 to 44 Years | 55 (85.9%) | 17 (30.9%) |
| 45 to 54 Years | 54 (75.0%) | 0 (0.0%) |
| 55 to 59 Years | 60 (72.3%) | 0 (0.0%) |
| 60 to 64 Years | 27 (19.3%) | 0 (0.0%) |
| 65 to 74 Years | 32 (46.4%) | 10 (31.3%) |
| 75 Years and over | 3 (8.3%) | 0 (0.0%) |
| Total | 276 (51.1%) | 36 (13.0%) |
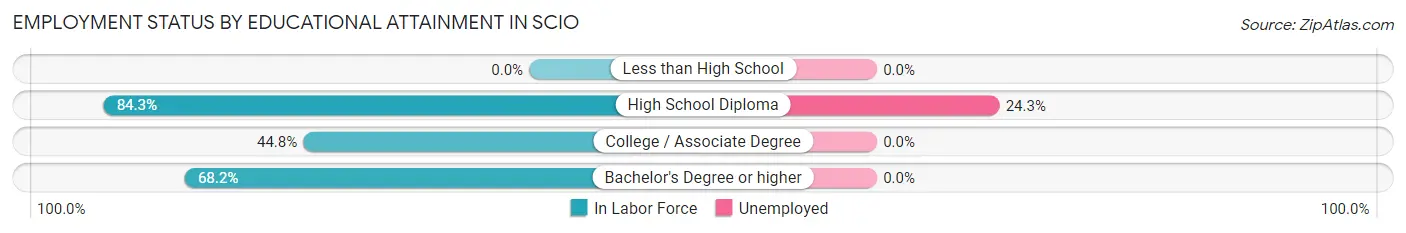
Employment Status by Educational Attainment in Scio
According to labor force statistics for Scio, 56.6% of individuals (215) out of the total population between 25 and 64 years of age (380) are in the labor force, with 7.9% or 17 of them being unemployed. The group with the highest labor force participation rate are those with the educational attainment of high school diploma, with 84.3% or 70 individuals in the labor force. Within the labor force, individuals with high school diploma education have the highest percentage of unemployment, with 24.3% or 17 of them being unemployed.
| Educational Attainment | In Labor Force | Unemployed |
| Less than High School | 0 (0.0%) | 0 (0.0%) |
| High School Diploma | 70 (84.3%) | 20 (24.3%) |
| College / Associate Degree | 100 (44.8%) | 0 (0.0%) |
| Bachelor's Degree or higher | 45 (68.2%) | 0 (0.0%) |
| Total | 215 (56.6%) | 30 (7.9%) |
Employment Occupations by Sex in Scio
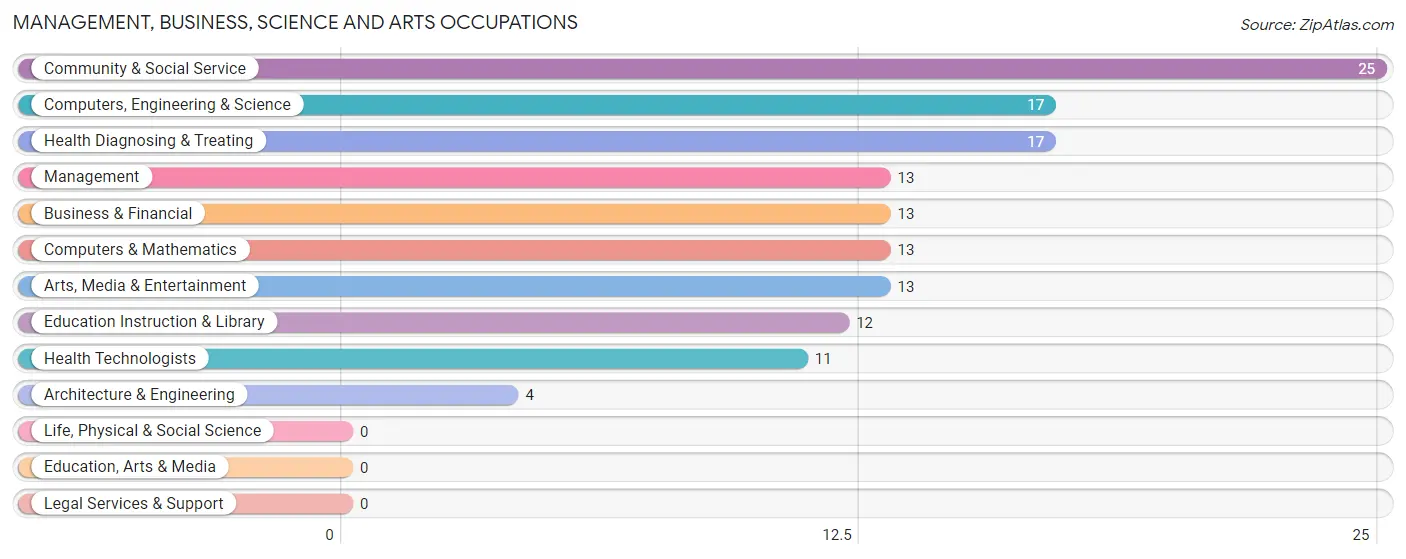
Management, Business, Science and Arts Occupations
The most common Management, Business, Science and Arts occupations in Scio are Community & Social Service (25 | 10.4%), Computers, Engineering & Science (17 | 7.1%), Health Diagnosing & Treating (17 | 7.1%), Management (13 | 5.4%), and Business & Financial (13 | 5.4%).
Management, Business, Science and Arts Occupations by Sex
Within the Management, Business, Science and Arts occupations in Scio, the most male-oriented occupations are Architecture & Engineering (100.0%), Arts, Media & Entertainment (76.9%), and Health Technologists (72.7%), while the most female-oriented occupations are Education Instruction & Library (100.0%), Computers & Mathematics (76.9%), and Management (69.2%).
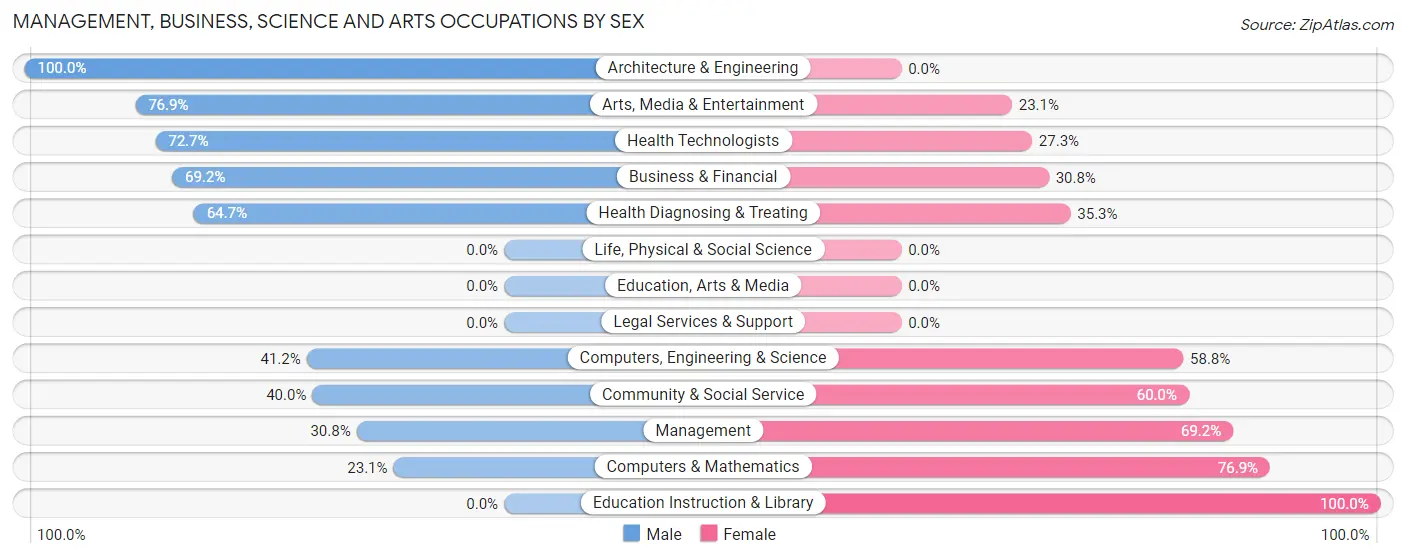
| Occupation | Male | Female |
| Management | 4 (30.8%) | 9 (69.2%) |
| Business & Financial | 9 (69.2%) | 4 (30.8%) |
| Computers, Engineering & Science | 7 (41.2%) | 10 (58.8%) |
| Computers & Mathematics | 3 (23.1%) | 10 (76.9%) |
| Architecture & Engineering | 4 (100.0%) | 0 (0.0%) |
| Life, Physical & Social Science | 0 (0.0%) | 0 (0.0%) |
| Community & Social Service | 10 (40.0%) | 15 (60.0%) |
| Education, Arts & Media | 0 (0.0%) | 0 (0.0%) |
| Legal Services & Support | 0 (0.0%) | 0 (0.0%) |
| Education Instruction & Library | 0 (0.0%) | 12 (100.0%) |
| Arts, Media & Entertainment | 10 (76.9%) | 3 (23.1%) |
| Health Diagnosing & Treating | 11 (64.7%) | 6 (35.3%) |
| Health Technologists | 8 (72.7%) | 3 (27.3%) |
| Total (Category) | 41 (48.2%) | 44 (51.8%) |
| Total (Overall) | 133 (55.4%) | 107 (44.6%) |
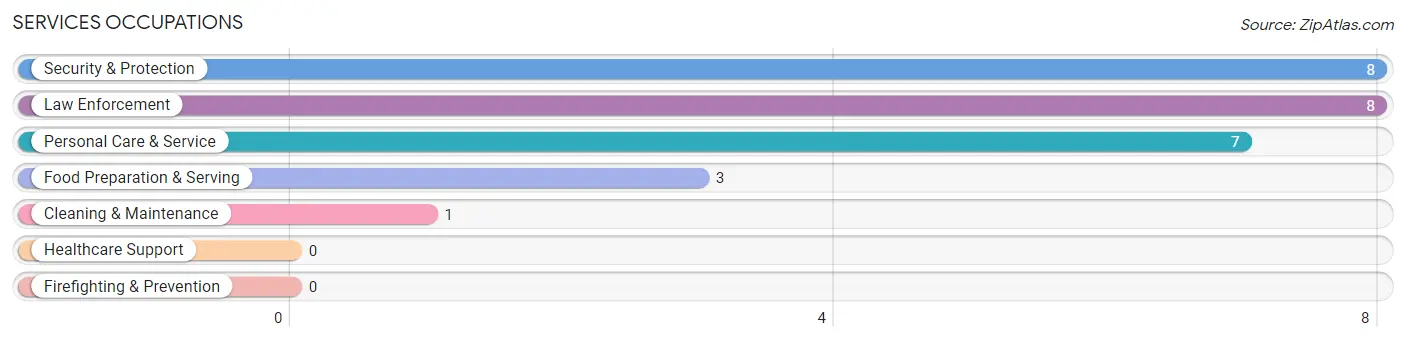
Services Occupations
The most common Services occupations in Scio are Security & Protection (8 | 3.3%), Law Enforcement (8 | 3.3%), Personal Care & Service (7 | 2.9%), Food Preparation & Serving (3 | 1.3%), and Cleaning & Maintenance (1 | 0.4%).
Services Occupations by Sex
Within the Services occupations in Scio, the most male-oriented occupations are Cleaning & Maintenance (100.0%), Security & Protection (62.5%), and Law Enforcement (62.5%), while the most female-oriented occupations are Food Preparation & Serving (100.0%), Personal Care & Service (100.0%), and Security & Protection (37.5%).
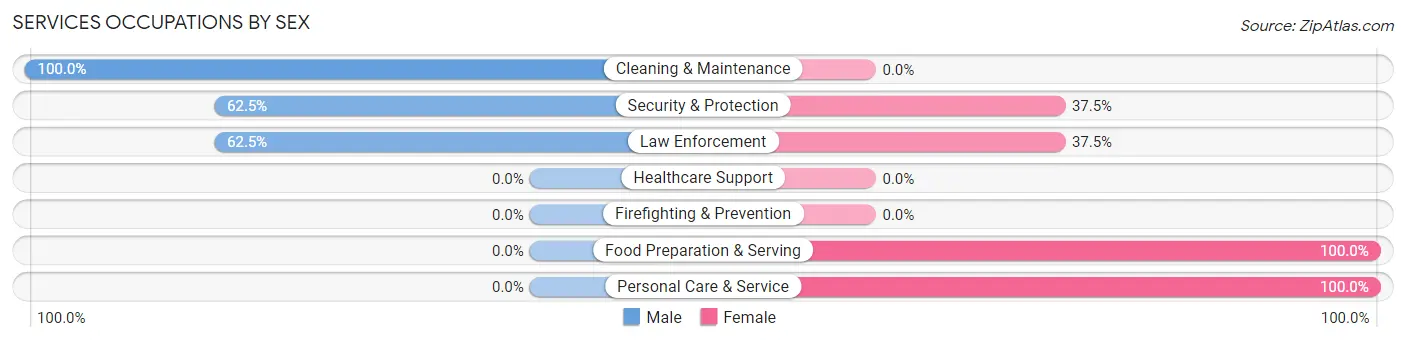
| Occupation | Male | Female |
| Healthcare Support | 0 (0.0%) | 0 (0.0%) |
| Security & Protection | 5 (62.5%) | 3 (37.5%) |
| Firefighting & Prevention | 0 (0.0%) | 0 (0.0%) |
| Law Enforcement | 5 (62.5%) | 3 (37.5%) |
| Food Preparation & Serving | 0 (0.0%) | 3 (100.0%) |
| Cleaning & Maintenance | 1 (100.0%) | 0 (0.0%) |
| Personal Care & Service | 0 (0.0%) | 7 (100.0%) |
| Total (Category) | 6 (31.6%) | 13 (68.4%) |
| Total (Overall) | 133 (55.4%) | 107 (44.6%) |
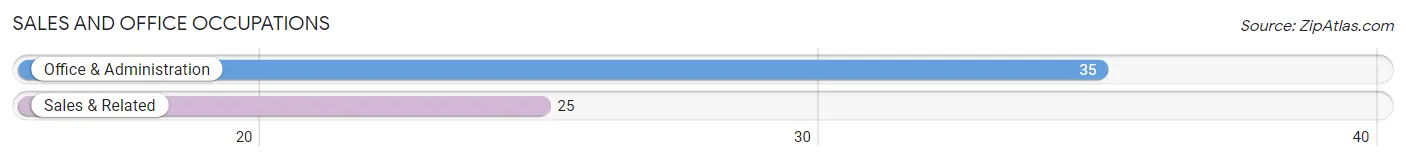
Sales and Office Occupations
The most common Sales and Office occupations in Scio are Office & Administration (35 | 14.6%), and Sales & Related (25 | 10.4%).
Sales and Office Occupations by Sex

| Occupation | Male | Female |
| Sales & Related | 15 (60.0%) | 10 (40.0%) |
| Office & Administration | 0 (0.0%) | 35 (100.0%) |
| Total (Category) | 15 (25.0%) | 45 (75.0%) |
| Total (Overall) | 133 (55.4%) | 107 (44.6%) |
Natural Resources, Construction and Maintenance Occupations
The most common Natural Resources, Construction and Maintenance occupations in Scio are Construction & Extraction (18 | 7.5%), Installation, Maintenance & Repair (11 | 4.6%), and Farming, Fishing & Forestry (4 | 1.7%).
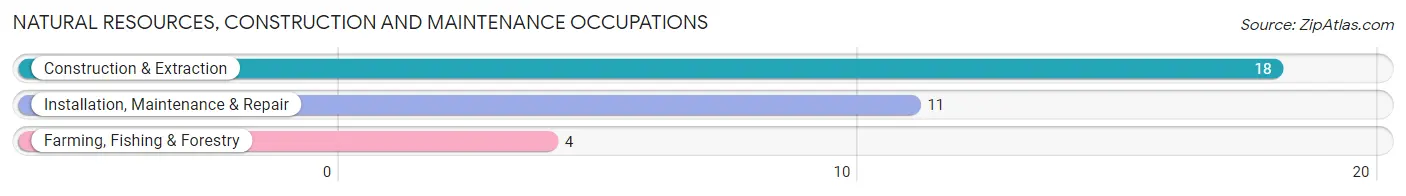
Natural Resources, Construction and Maintenance Occupations by Sex
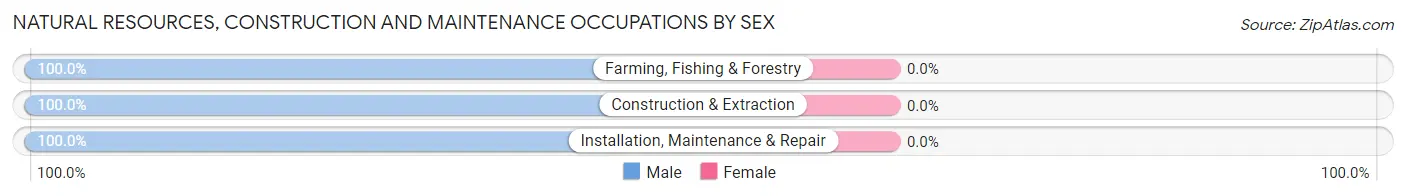
| Occupation | Male | Female |
| Farming, Fishing & Forestry | 4 (100.0%) | 0 (0.0%) |
| Construction & Extraction | 18 (100.0%) | 0 (0.0%) |
| Installation, Maintenance & Repair | 11 (100.0%) | 0 (0.0%) |
| Total (Category) | 33 (100.0%) | 0 (0.0%) |
| Total (Overall) | 133 (55.4%) | 107 (44.6%) |
Production, Transportation and Moving Occupations
The most common Production, Transportation and Moving occupations in Scio are Transportation (26 | 10.8%), Production (14 | 5.8%), and Material Moving (3 | 1.3%).
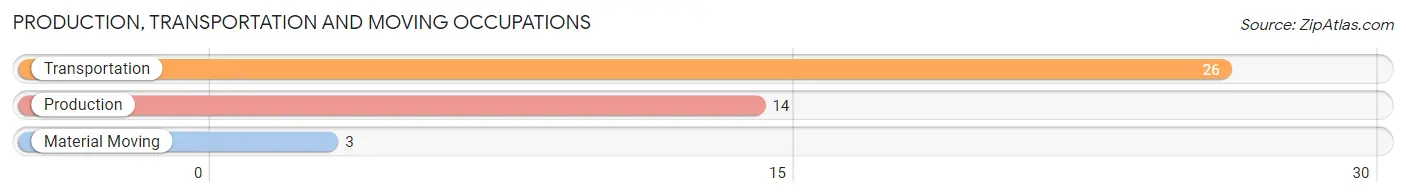
Production, Transportation and Moving Occupations by Sex
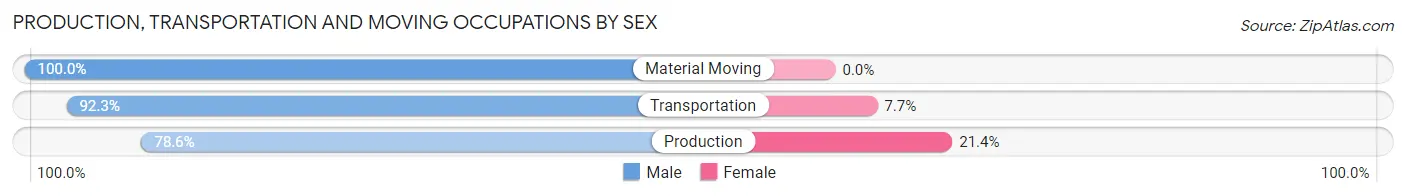
| Occupation | Male | Female |
| Production | 11 (78.6%) | 3 (21.4%) |
| Transportation | 24 (92.3%) | 2 (7.7%) |
| Material Moving | 3 (100.0%) | 0 (0.0%) |
| Total (Category) | 38 (88.4%) | 5 (11.6%) |
| Total (Overall) | 133 (55.4%) | 107 (44.6%) |
Employment Industries by Sex in Scio
Employment Industries in Scio
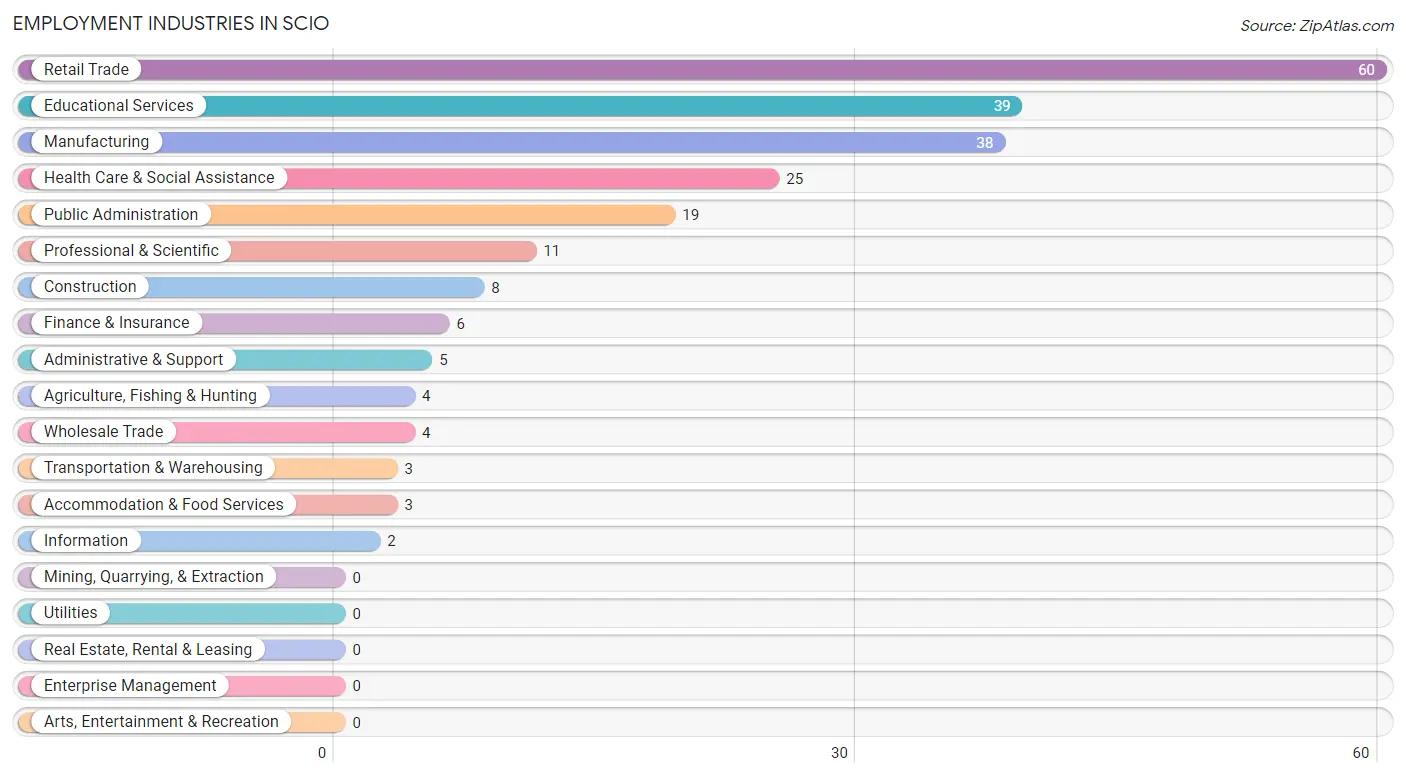
The major employment industries in Scio include Retail Trade (60 | 25.0%), Educational Services (39 | 16.3%), Manufacturing (38 | 15.8%), Health Care & Social Assistance (25 | 10.4%), and Public Administration (19 | 7.9%).
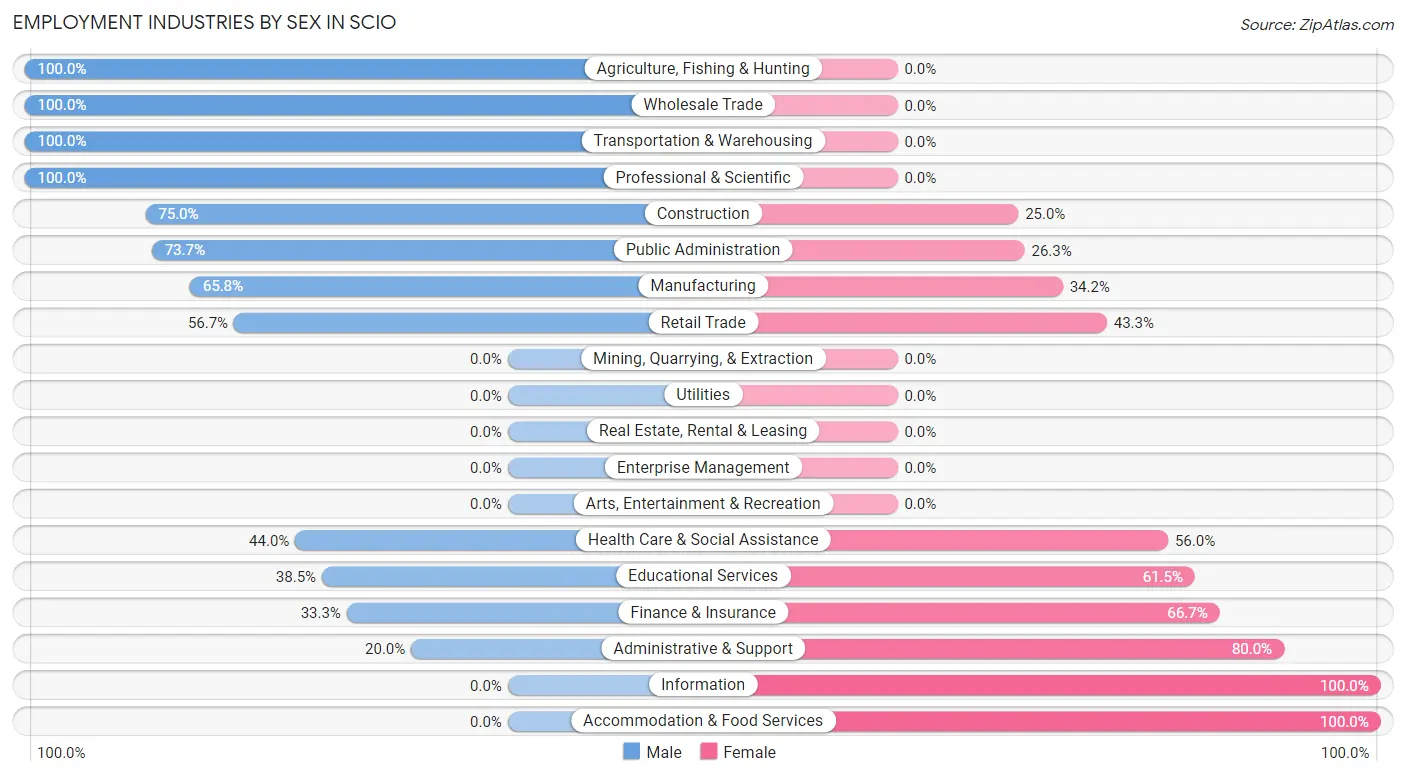
Employment Industries by Sex in Scio
The Scio industries that see more men than women are Agriculture, Fishing & Hunting (100.0%), Wholesale Trade (100.0%), and Transportation & Warehousing (100.0%), whereas the industries that tend to have a higher number of women are Information (100.0%), Accommodation & Food Services (100.0%), and Administrative & Support (80.0%).
| Industry | Male | Female |
| Agriculture, Fishing & Hunting | 4 (100.0%) | 0 (0.0%) |
| Mining, Quarrying, & Extraction | 0 (0.0%) | 0 (0.0%) |
| Construction | 6 (75.0%) | 2 (25.0%) |
| Manufacturing | 25 (65.8%) | 13 (34.2%) |
| Wholesale Trade | 4 (100.0%) | 0 (0.0%) |
| Retail Trade | 34 (56.7%) | 26 (43.3%) |
| Transportation & Warehousing | 3 (100.0%) | 0 (0.0%) |
| Utilities | 0 (0.0%) | 0 (0.0%) |
| Information | 0 (0.0%) | 2 (100.0%) |
| Finance & Insurance | 2 (33.3%) | 4 (66.7%) |
| Real Estate, Rental & Leasing | 0 (0.0%) | 0 (0.0%) |
| Professional & Scientific | 11 (100.0%) | 0 (0.0%) |
| Enterprise Management | 0 (0.0%) | 0 (0.0%) |
| Administrative & Support | 1 (20.0%) | 4 (80.0%) |
| Educational Services | 15 (38.5%) | 24 (61.5%) |
| Health Care & Social Assistance | 11 (44.0%) | 14 (56.0%) |
| Arts, Entertainment & Recreation | 0 (0.0%) | 0 (0.0%) |
| Accommodation & Food Services | 0 (0.0%) | 3 (100.0%) |
| Public Administration | 14 (73.7%) | 5 (26.3%) |
| Total | 133 (55.4%) | 107 (44.6%) |
Education in Scio
School Enrollment in Scio
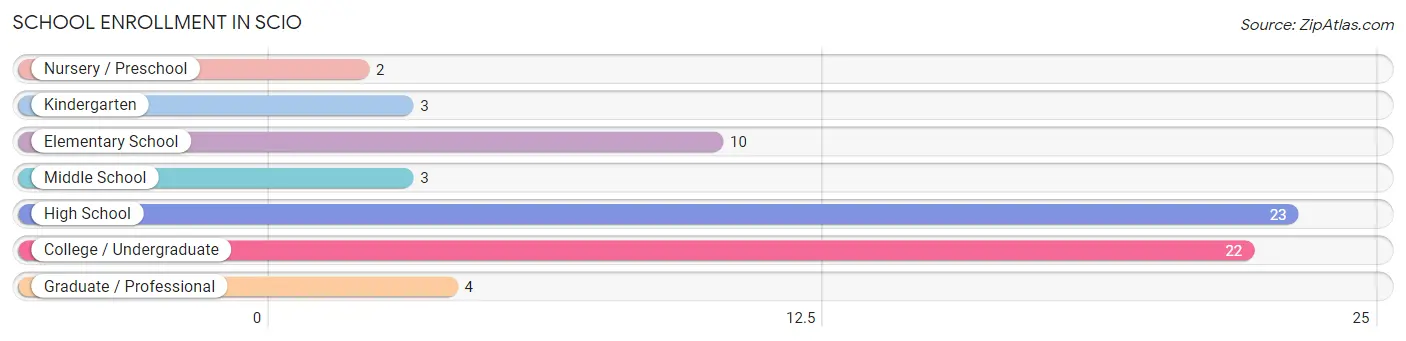
The most common levels of schooling among the 67 students in Scio are high school (23 | 34.3%), college / undergraduate (22 | 32.8%), and elementary school (10 | 14.9%).
| School Level | # Students | % Students |
| Nursery / Preschool | 2 | 3.0% |
| Kindergarten | 3 | 4.5% |
| Elementary School | 10 | 14.9% |
| Middle School | 3 | 4.5% |
| High School | 23 | 34.3% |
| College / Undergraduate | 22 | 32.8% |
| Graduate / Professional | 4 | 6.0% |
| Total | 67 | 100.0% |
School Enrollment by Age by Funding Source in Scio
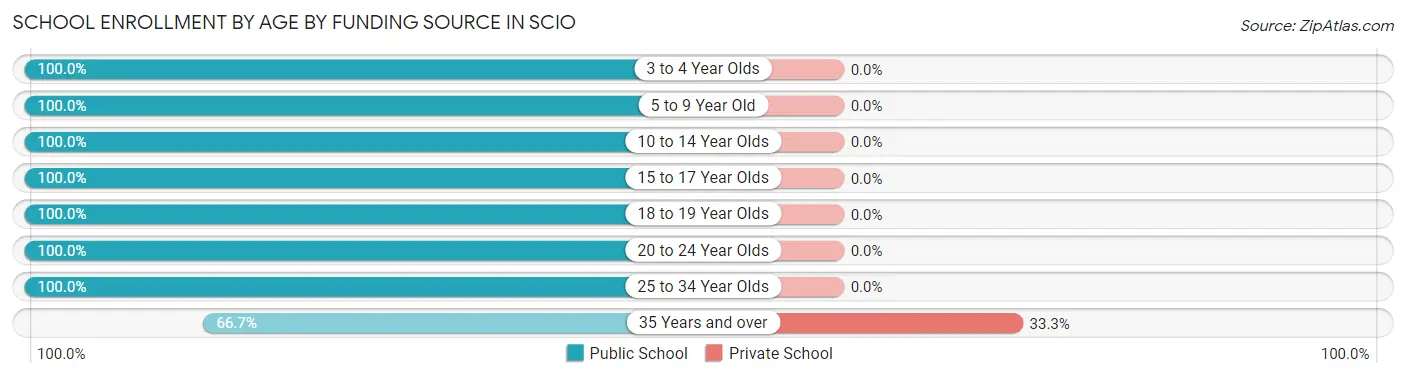
Out of a total of 67 students who are enrolled in schools in Scio, 4 (6.0%) attend a private institution, while the remaining 63 (94.0%) are enrolled in public schools. The age group of 35 years and over has the highest likelihood of being enrolled in private schools, with 4 (33.3% in the age bracket) enrolled. Conversely, the age group of 3 to 4 year olds has the lowest likelihood of being enrolled in a private school, with 2 (100.0% in the age bracket) attending a public institution.
| Age Bracket | Public School | Private School |
| 3 to 4 Year Olds | 2 (100.0%) | 0 (0.0%) |
| 5 to 9 Year Old | 13 (100.0%) | 0 (0.0%) |
| 10 to 14 Year Olds | 3 (100.0%) | 0 (0.0%) |
| 15 to 17 Year Olds | 8 (100.0%) | 0 (0.0%) |
| 18 to 19 Year Olds | 2 (100.0%) | 0 (0.0%) |
| 20 to 24 Year Olds | 22 (100.0%) | 0 (0.0%) |
| 25 to 34 Year Olds | 5 (100.0%) | 0 (0.0%) |
| 35 Years and over | 8 (66.7%) | 4 (33.3%) |
| Total | 63 (94.0%) | 4 (6.0%) |
Educational Attainment by Field of Study in Scio
Education (20 | 19.6%), psychology (14 | 13.7%), business (14 | 13.7%), engineering (12 | 11.8%), and computers & mathematics (10 | 9.8%) are the most common fields of study among 102 individuals in Scio who have obtained a bachelor's degree or higher.
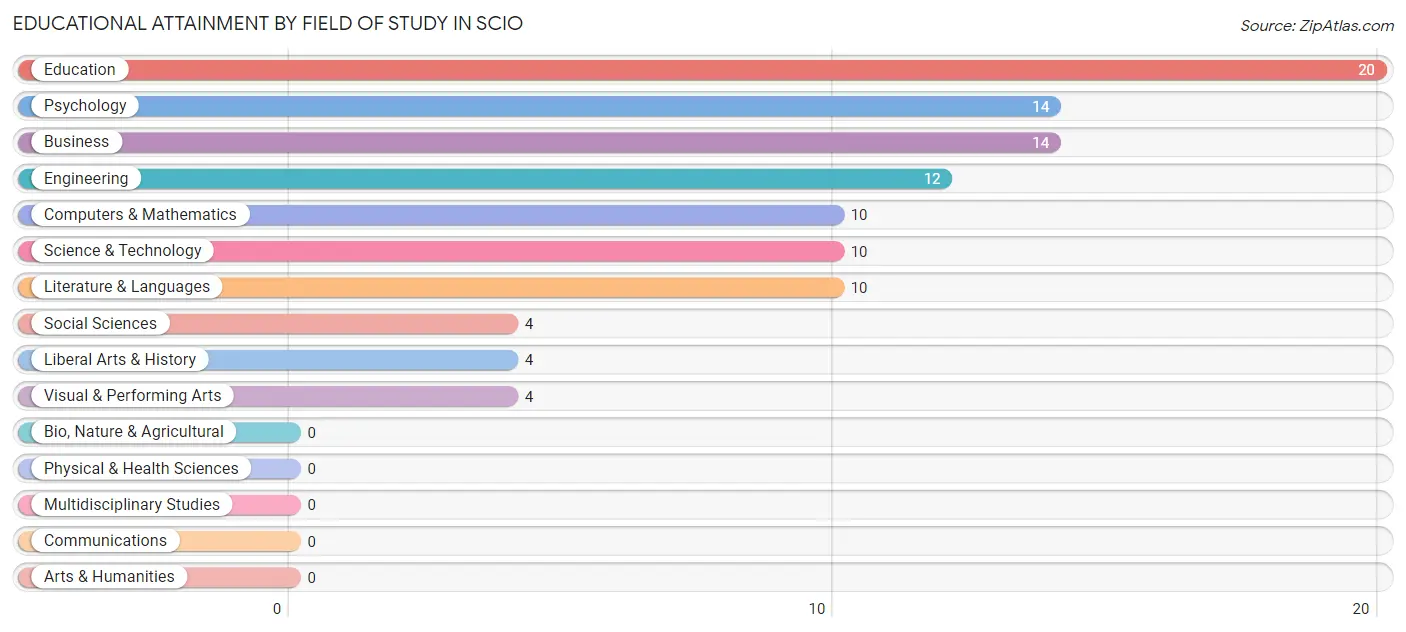
| Field of Study | # Graduates | % Graduates |
| Computers & Mathematics | 10 | 9.8% |
| Bio, Nature & Agricultural | 0 | 0.0% |
| Physical & Health Sciences | 0 | 0.0% |
| Psychology | 14 | 13.7% |
| Social Sciences | 4 | 3.9% |
| Engineering | 12 | 11.8% |
| Multidisciplinary Studies | 0 | 0.0% |
| Science & Technology | 10 | 9.8% |
| Business | 14 | 13.7% |
| Education | 20 | 19.6% |
| Literature & Languages | 10 | 9.8% |
| Liberal Arts & History | 4 | 3.9% |
| Visual & Performing Arts | 4 | 3.9% |
| Communications | 0 | 0.0% |
| Arts & Humanities | 0 | 0.0% |
| Total | 102 | 100.0% |
Transportation & Commute in Scio
Vehicle Availability by Sex in Scio
The most prevalent vehicle ownership categories in Scio are males with 2 vehicles (59, accounting for 44.4%) and females with 2 vehicles (49, making up 59.0%).
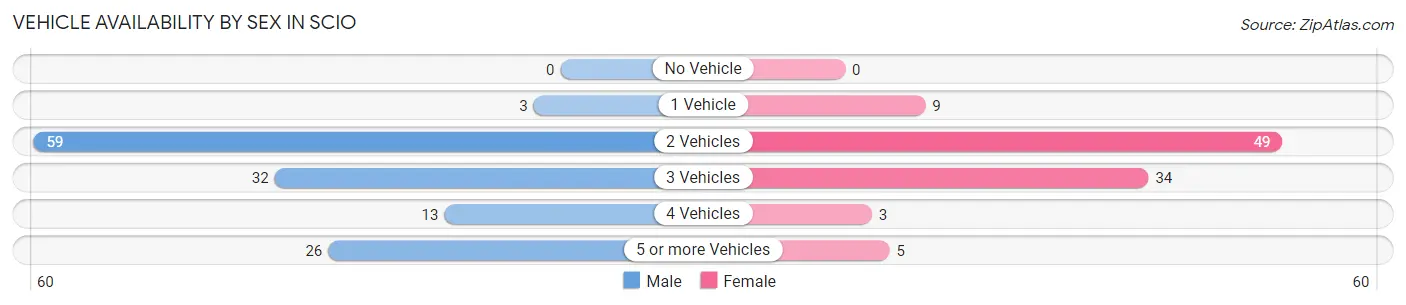
| Vehicles Available | Male | Female |
| No Vehicle | 0 (0.0%) | 0 (0.0%) |
| 1 Vehicle | 3 (2.3%) | 9 (9.0%) |
| 2 Vehicles | 59 (44.4%) | 49 (49.0%) |
| 3 Vehicles | 32 (24.1%) | 34 (34.0%) |
| 4 Vehicles | 13 (9.8%) | 3 (3.0%) |
| 5 or more Vehicles | 26 (19.6%) | 5 (5.0%) |
| Total | 133 (100.0%) | 100 (100.0%) |
Commute Time in Scio
The most frequently occuring commute durations in Scio are 10 to 14 minutes (77 commuters, 33.1%), 15 to 19 minutes (48 commuters, 20.6%), and 5 to 9 minutes (28 commuters, 12.0%).
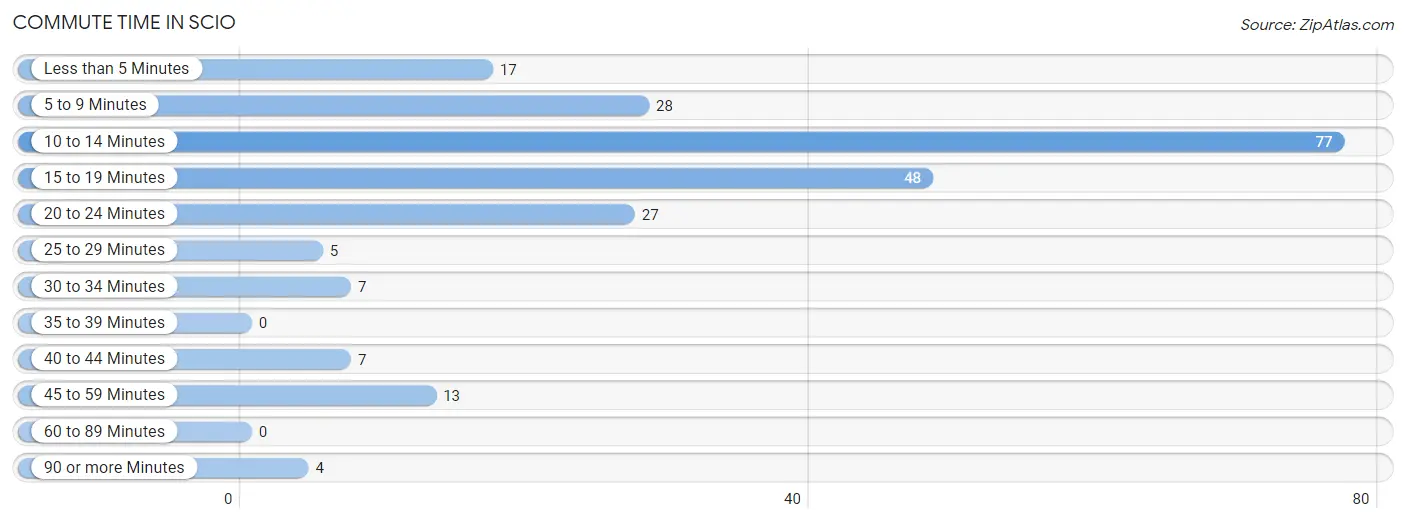
| Commute Time | # Commuters | % Commuters |
| Less than 5 Minutes | 17 | 7.3% |
| 5 to 9 Minutes | 28 | 12.0% |
| 10 to 14 Minutes | 77 | 33.1% |
| 15 to 19 Minutes | 48 | 20.6% |
| 20 to 24 Minutes | 27 | 11.6% |
| 25 to 29 Minutes | 5 | 2.1% |
| 30 to 34 Minutes | 7 | 3.0% |
| 35 to 39 Minutes | 0 | 0.0% |
| 40 to 44 Minutes | 7 | 3.0% |
| 45 to 59 Minutes | 13 | 5.6% |
| 60 to 89 Minutes | 0 | 0.0% |
| 90 or more Minutes | 4 | 1.7% |
Commute Time by Sex in Scio
The most common commute times in Scio are 10 to 14 minutes (37 commuters, 27.8%) for males and 10 to 14 minutes (40 commuters, 40.0%) for females.
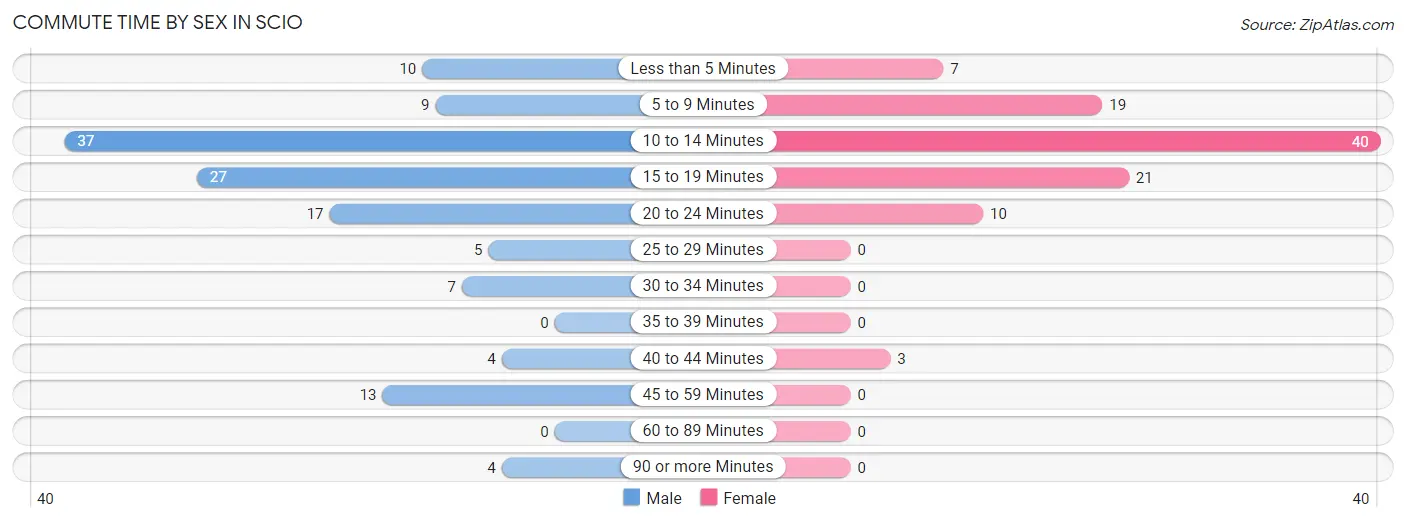
| Commute Time | Male | Female |
| Less than 5 Minutes | 10 (7.5%) | 7 (7.0%) |
| 5 to 9 Minutes | 9 (6.8%) | 19 (19.0%) |
| 10 to 14 Minutes | 37 (27.8%) | 40 (40.0%) |
| 15 to 19 Minutes | 27 (20.3%) | 21 (21.0%) |
| 20 to 24 Minutes | 17 (12.8%) | 10 (10.0%) |
| 25 to 29 Minutes | 5 (3.8%) | 0 (0.0%) |
| 30 to 34 Minutes | 7 (5.3%) | 0 (0.0%) |
| 35 to 39 Minutes | 0 (0.0%) | 0 (0.0%) |
| 40 to 44 Minutes | 4 (3.0%) | 3 (3.0%) |
| 45 to 59 Minutes | 13 (9.8%) | 0 (0.0%) |
| 60 to 89 Minutes | 0 (0.0%) | 0 (0.0%) |
| 90 or more Minutes | 4 (3.0%) | 0 (0.0%) |
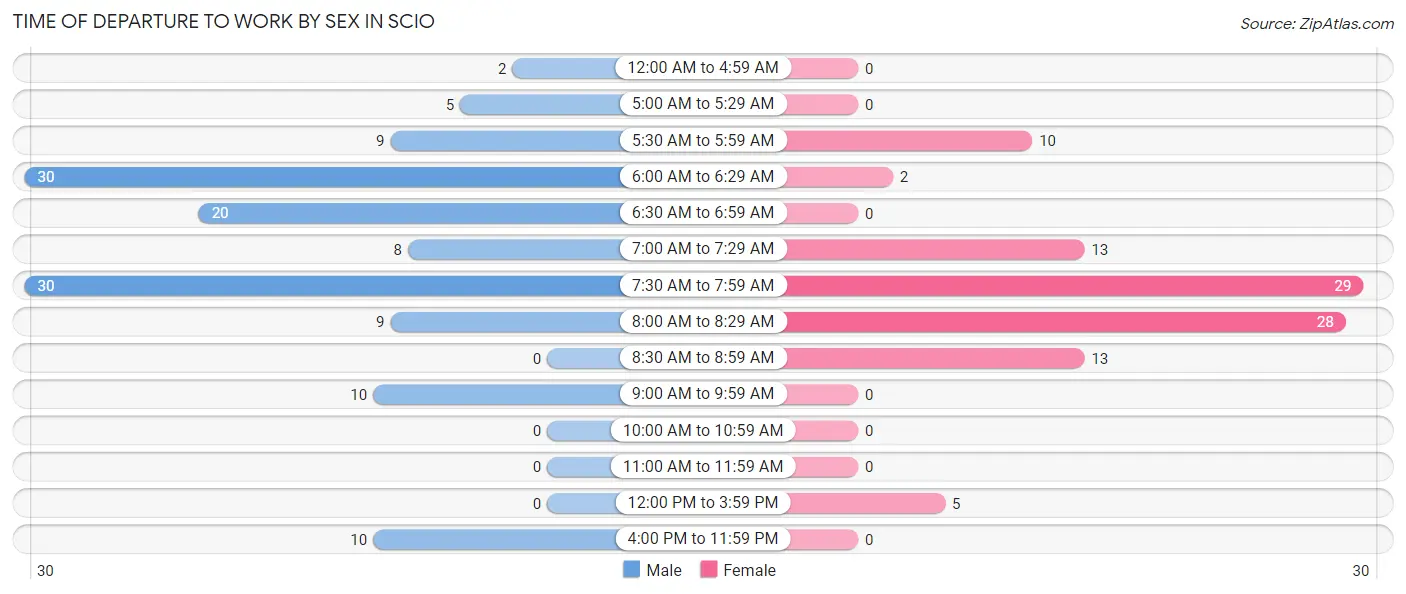
Time of Departure to Work by Sex in Scio
The most frequent times of departure to work in Scio are 6:00 AM to 6:29 AM (30, 22.6%) for males and 7:30 AM to 7:59 AM (29, 29.0%) for females.
| Time of Departure | Male | Female |
| 12:00 AM to 4:59 AM | 2 (1.5%) | 0 (0.0%) |
| 5:00 AM to 5:29 AM | 5 (3.8%) | 0 (0.0%) |
| 5:30 AM to 5:59 AM | 9 (6.8%) | 10 (10.0%) |
| 6:00 AM to 6:29 AM | 30 (22.6%) | 2 (2.0%) |
| 6:30 AM to 6:59 AM | 20 (15.0%) | 0 (0.0%) |
| 7:00 AM to 7:29 AM | 8 (6.0%) | 13 (13.0%) |
| 7:30 AM to 7:59 AM | 30 (22.6%) | 29 (29.0%) |
| 8:00 AM to 8:29 AM | 9 (6.8%) | 28 (28.0%) |
| 8:30 AM to 8:59 AM | 0 (0.0%) | 13 (13.0%) |
| 9:00 AM to 9:59 AM | 10 (7.5%) | 0 (0.0%) |
| 10:00 AM to 10:59 AM | 0 (0.0%) | 0 (0.0%) |
| 11:00 AM to 11:59 AM | 0 (0.0%) | 0 (0.0%) |
| 12:00 PM to 3:59 PM | 0 (0.0%) | 5 (5.0%) |
| 4:00 PM to 11:59 PM | 10 (7.5%) | 0 (0.0%) |
| Total | 133 (100.0%) | 100 (100.0%) |
Housing Occupancy in Scio
Occupancy by Ownership in Scio
Of the total 303 dwellings in Scio, owner-occupied units account for 282 (93.1%), while renter-occupied units make up 21 (6.9%).
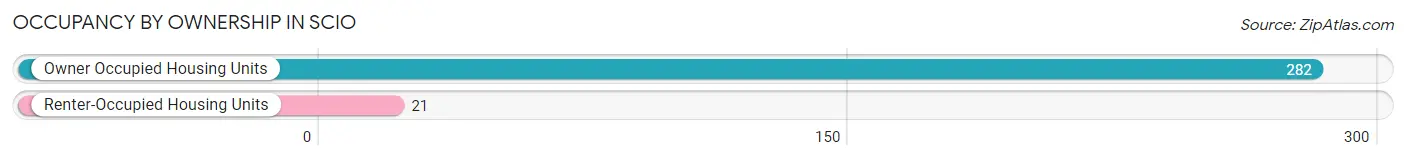
| Occupancy | # Housing Units | % Housing Units |
| Owner Occupied Housing Units | 282 | 93.1% |
| Renter-Occupied Housing Units | 21 | 6.9% |
| Total Occupied Housing Units | 303 | 100.0% |
Occupancy by Household Size in Scio
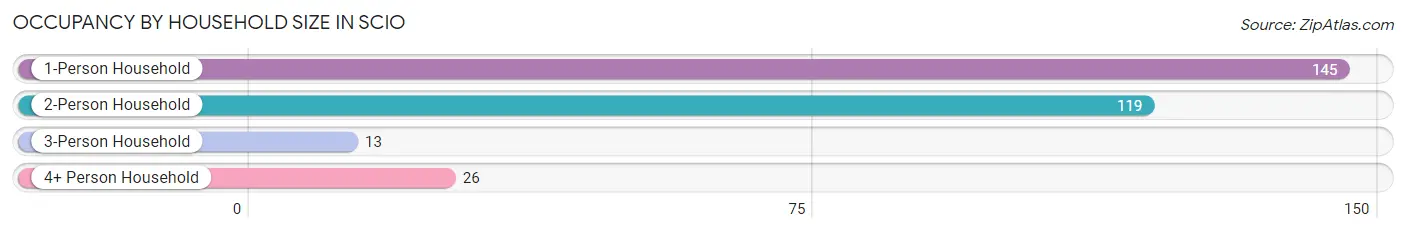
| Household Size | # Housing Units | % Housing Units |
| 1-Person Household | 145 | 47.8% |
| 2-Person Household | 119 | 39.3% |
| 3-Person Household | 13 | 4.3% |
| 4+ Person Household | 26 | 8.6% |
| Total Housing Units | 303 | 100.0% |
Occupancy by Ownership by Household Size in Scio
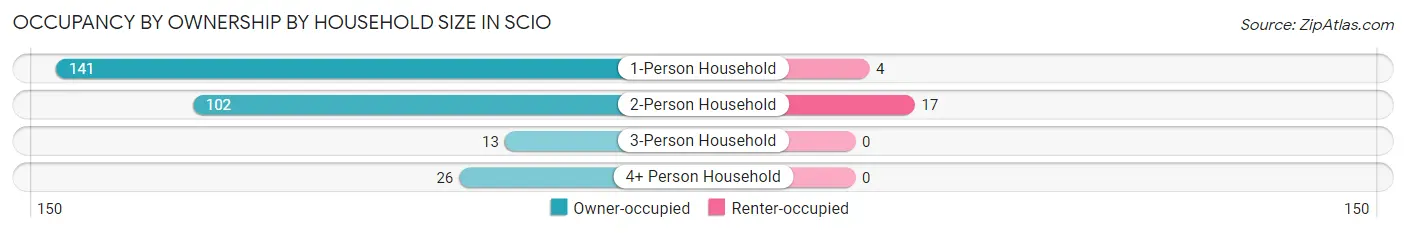
| Household Size | Owner-occupied | Renter-occupied |
| 1-Person Household | 141 (97.2%) | 4 (2.8%) |
| 2-Person Household | 102 (85.7%) | 17 (14.3%) |
| 3-Person Household | 13 (100.0%) | 0 (0.0%) |
| 4+ Person Household | 26 (100.0%) | 0 (0.0%) |
| Total Housing Units | 282 (93.1%) | 21 (6.9%) |
Occupancy by Educational Attainment in Scio
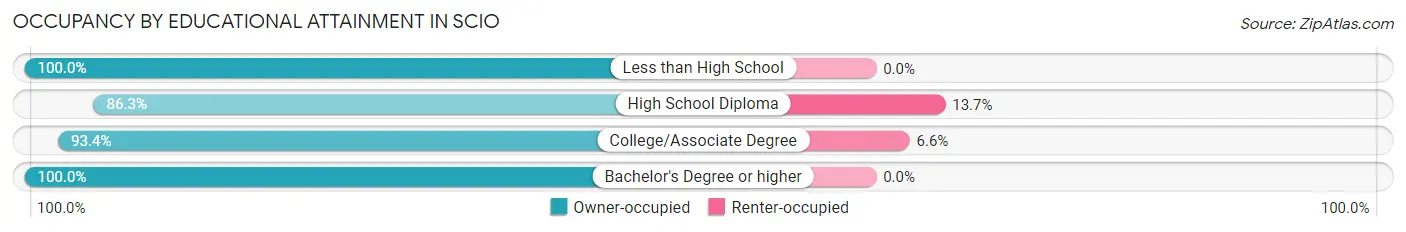
| Household Size | Owner-occupied | Renter-occupied |
| Less than High School | 3 (100.0%) | 0 (0.0%) |
| High School Diploma | 63 (86.3%) | 10 (13.7%) |
| College/Associate Degree | 155 (93.4%) | 11 (6.6%) |
| Bachelor's Degree or higher | 61 (100.0%) | 0 (0.0%) |
Occupancy by Age of Householder in Scio
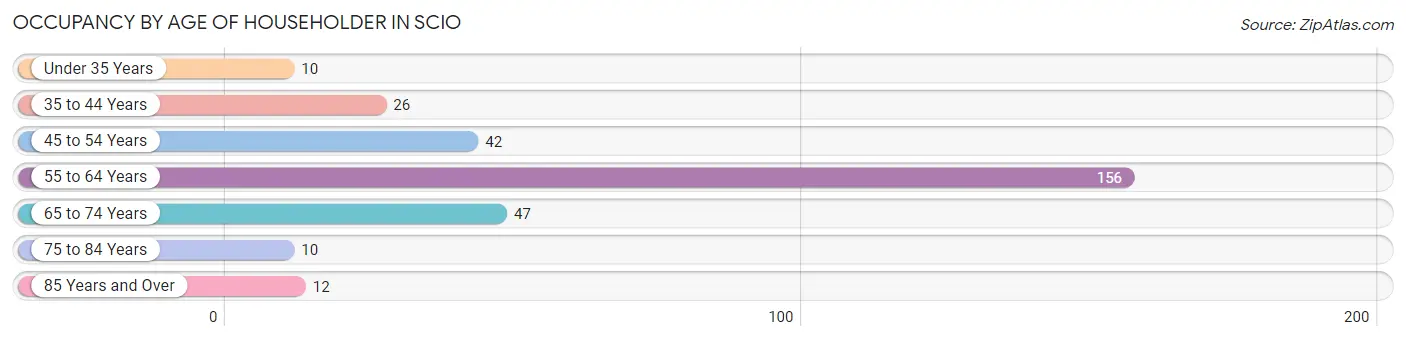
| Age Bracket | # Households | % Households |
| Under 35 Years | 10 | 3.3% |
| 35 to 44 Years | 26 | 8.6% |
| 45 to 54 Years | 42 | 13.9% |
| 55 to 64 Years | 156 | 51.5% |
| 65 to 74 Years | 47 | 15.5% |
| 75 to 84 Years | 10 | 3.3% |
| 85 Years and Over | 12 | 4.0% |
| Total | 303 | 100.0% |
Housing Finances in Scio
Median Income by Occupancy in Scio
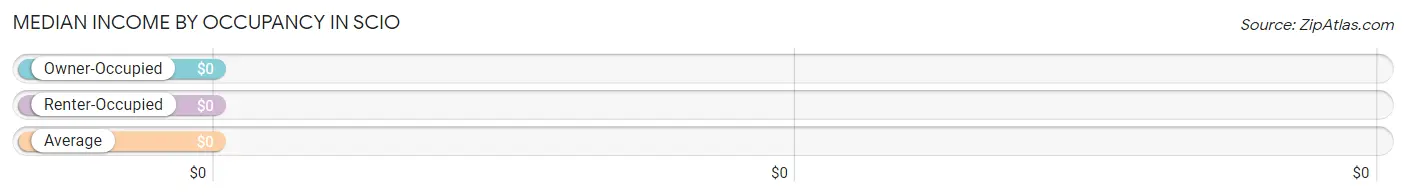
| Occupancy Type | # Households | Median Income |
| Owner-Occupied | 282 (93.1%) | $0 |
| Renter-Occupied | 21 (6.9%) | $0 |
| Average | 303 (100.0%) | $0 |
Occupancy by Householder Income Bracket in Scio
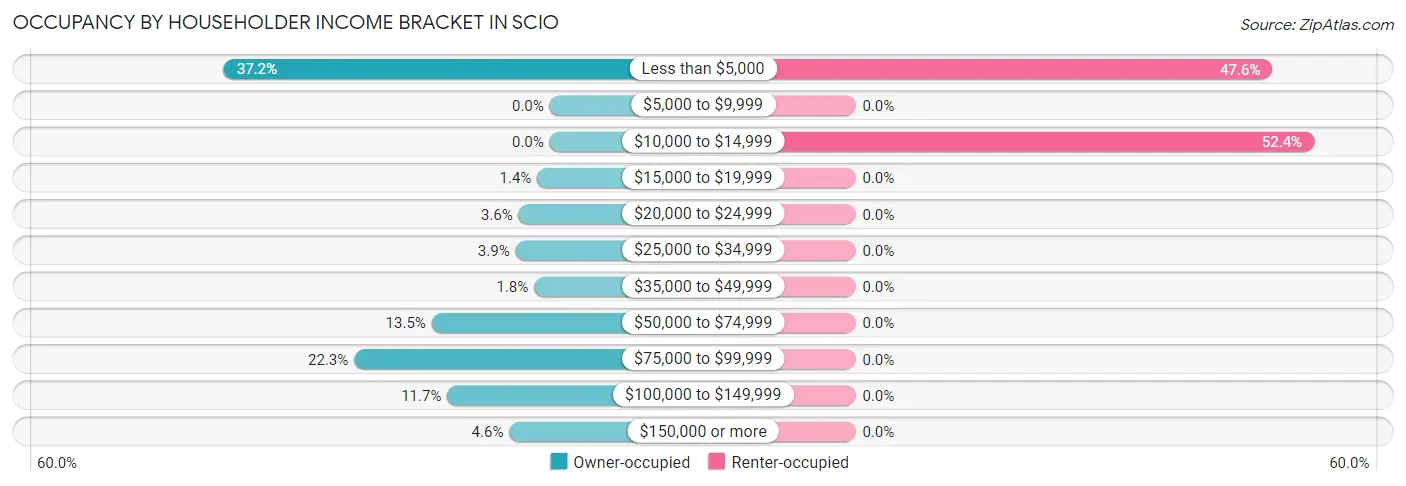
| Income Bracket | Owner-occupied | Renter-occupied |
| Less than $5,000 | 105 (37.2%) | 10 (47.6%) |
| $5,000 to $9,999 | 0 (0.0%) | 0 (0.0%) |
| $10,000 to $14,999 | 0 (0.0%) | 11 (52.4%) |
| $15,000 to $19,999 | 4 (1.4%) | 0 (0.0%) |
| $20,000 to $24,999 | 10 (3.5%) | 0 (0.0%) |
| $25,000 to $34,999 | 11 (3.9%) | 0 (0.0%) |
| $35,000 to $49,999 | 5 (1.8%) | 0 (0.0%) |
| $50,000 to $74,999 | 38 (13.5%) | 0 (0.0%) |
| $75,000 to $99,999 | 63 (22.3%) | 0 (0.0%) |
| $100,000 to $149,999 | 33 (11.7%) | 0 (0.0%) |
| $150,000 or more | 13 (4.6%) | 0 (0.0%) |
| Total | 282 (100.0%) | 21 (100.0%) |
Monthly Housing Cost Tiers in Scio
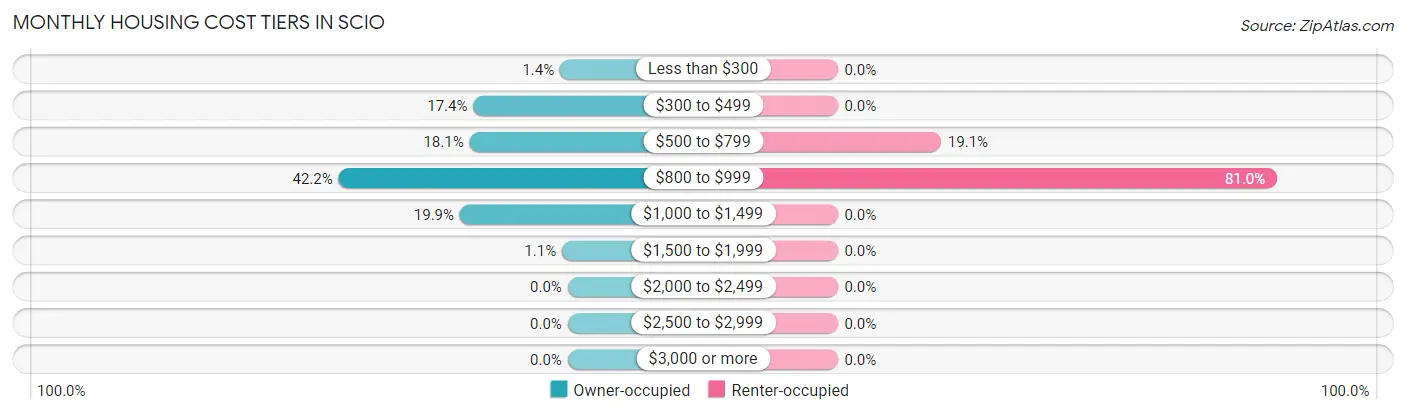
| Monthly Cost | Owner-occupied | Renter-occupied |
| Less than $300 | 4 (1.4%) | 0 (0.0%) |
| $300 to $499 | 49 (17.4%) | 0 (0.0%) |
| $500 to $799 | 51 (18.1%) | 4 (19.1%) |
| $800 to $999 | 119 (42.2%) | 17 (80.9%) |
| $1,000 to $1,499 | 56 (19.9%) | 0 (0.0%) |
| $1,500 to $1,999 | 3 (1.1%) | 0 (0.0%) |
| $2,000 to $2,499 | 0 (0.0%) | 0 (0.0%) |
| $2,500 to $2,999 | 0 (0.0%) | 0 (0.0%) |
| $3,000 or more | 0 (0.0%) | 0 (0.0%) |
| Total | 282 (100.0%) | 21 (100.0%) |
Physical Housing Characteristics in Scio
Housing Structures in Scio
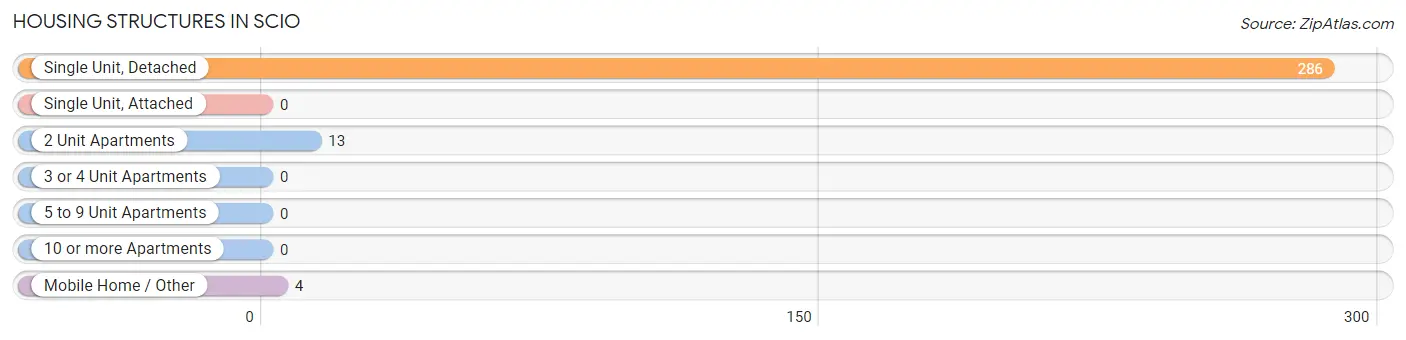
| Structure Type | # Housing Units | % Housing Units |
| Single Unit, Detached | 286 | 94.4% |
| Single Unit, Attached | 0 | 0.0% |
| 2 Unit Apartments | 13 | 4.3% |
| 3 or 4 Unit Apartments | 0 | 0.0% |
| 5 to 9 Unit Apartments | 0 | 0.0% |
| 10 or more Apartments | 0 | 0.0% |
| Mobile Home / Other | 4 | 1.3% |
| Total | 303 | 100.0% |
Housing Structures by Occupancy in Scio
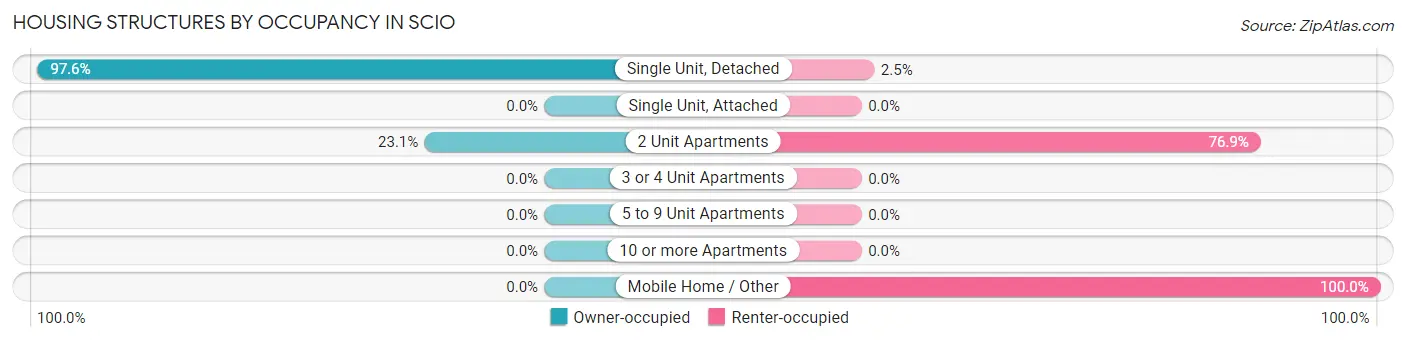
| Structure Type | Owner-occupied | Renter-occupied |
| Single Unit, Detached | 279 (97.6%) | 7 (2.5%) |
| Single Unit, Attached | 0 (0.0%) | 0 (0.0%) |
| 2 Unit Apartments | 3 (23.1%) | 10 (76.9%) |
| 3 or 4 Unit Apartments | 0 (0.0%) | 0 (0.0%) |
| 5 to 9 Unit Apartments | 0 (0.0%) | 0 (0.0%) |
| 10 or more Apartments | 0 (0.0%) | 0 (0.0%) |
| Mobile Home / Other | 0 (0.0%) | 4 (100.0%) |
| Total | 282 (93.1%) | 21 (6.9%) |
Housing Structures by Number of Rooms in Scio
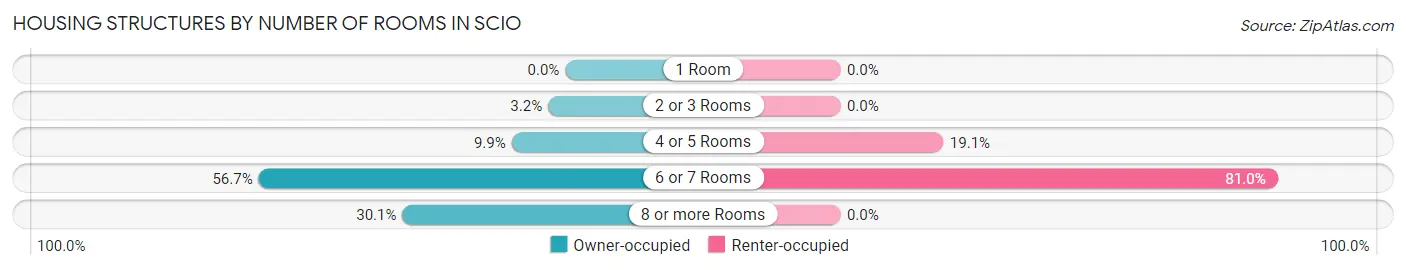
| Number of Rooms | Owner-occupied | Renter-occupied |
| 1 Room | 0 (0.0%) | 0 (0.0%) |
| 2 or 3 Rooms | 9 (3.2%) | 0 (0.0%) |
| 4 or 5 Rooms | 28 (9.9%) | 4 (19.1%) |
| 6 or 7 Rooms | 160 (56.7%) | 17 (80.9%) |
| 8 or more Rooms | 85 (30.1%) | 0 (0.0%) |
| Total | 282 (100.0%) | 21 (100.0%) |
Housing Structure by Heating Type in Scio
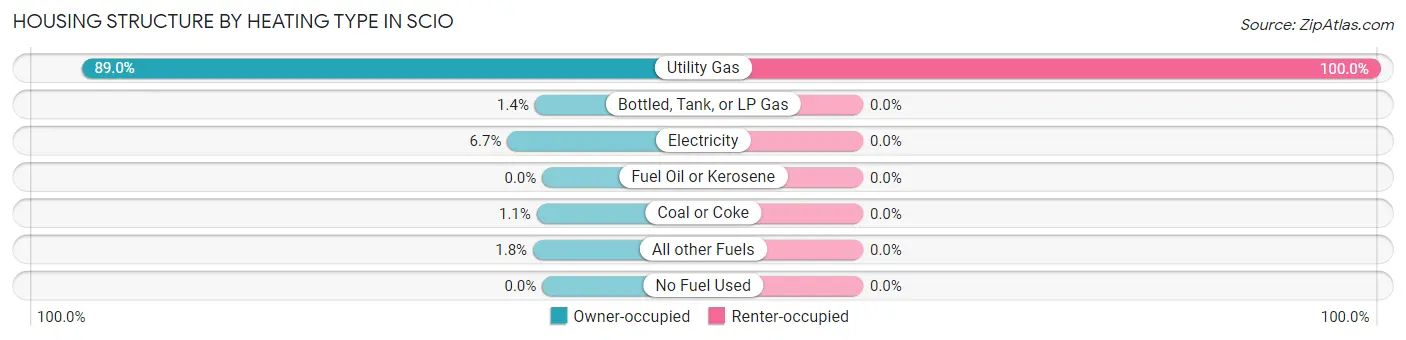
| Heating Type | Owner-occupied | Renter-occupied |
| Utility Gas | 251 (89.0%) | 21 (100.0%) |
| Bottled, Tank, or LP Gas | 4 (1.4%) | 0 (0.0%) |
| Electricity | 19 (6.7%) | 0 (0.0%) |
| Fuel Oil or Kerosene | 0 (0.0%) | 0 (0.0%) |
| Coal or Coke | 3 (1.1%) | 0 (0.0%) |
| All other Fuels | 5 (1.8%) | 0 (0.0%) |
| No Fuel Used | 0 (0.0%) | 0 (0.0%) |
| Total | 282 (100.0%) | 21 (100.0%) |
Household Vehicle Usage in Scio
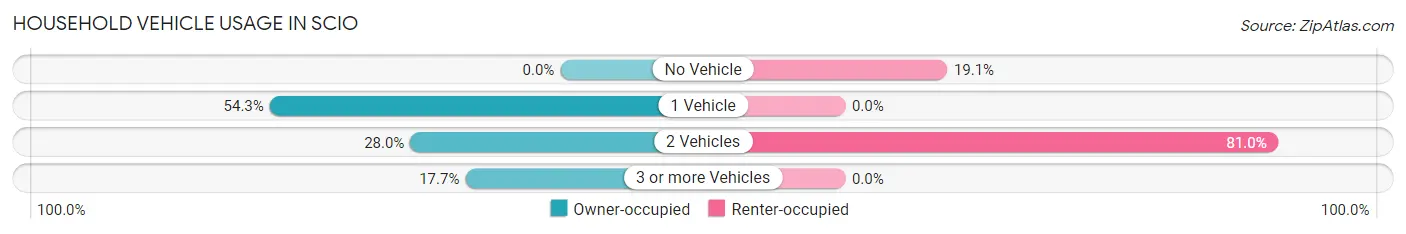
| Vehicles per Household | Owner-occupied | Renter-occupied |
| No Vehicle | 0 (0.0%) | 4 (19.1%) |
| 1 Vehicle | 153 (54.3%) | 0 (0.0%) |
| 2 Vehicles | 79 (28.0%) | 17 (80.9%) |
| 3 or more Vehicles | 50 (17.7%) | 0 (0.0%) |
| Total | 282 (100.0%) | 21 (100.0%) |
Real Estate & Mortgages in Scio
Real Estate and Mortgage Overview in Scio
| Characteristic | Without Mortgage | With Mortgage |
| Housing Units | 201 | 81 |
| Median Property Value | $129,900 | $97,900 |
| Median Household Income | - | - |
| Monthly Housing Costs | $900 | $0 |
| Real Estate Taxes | $7,562 | $0 |
Property Value by Mortgage Status in Scio
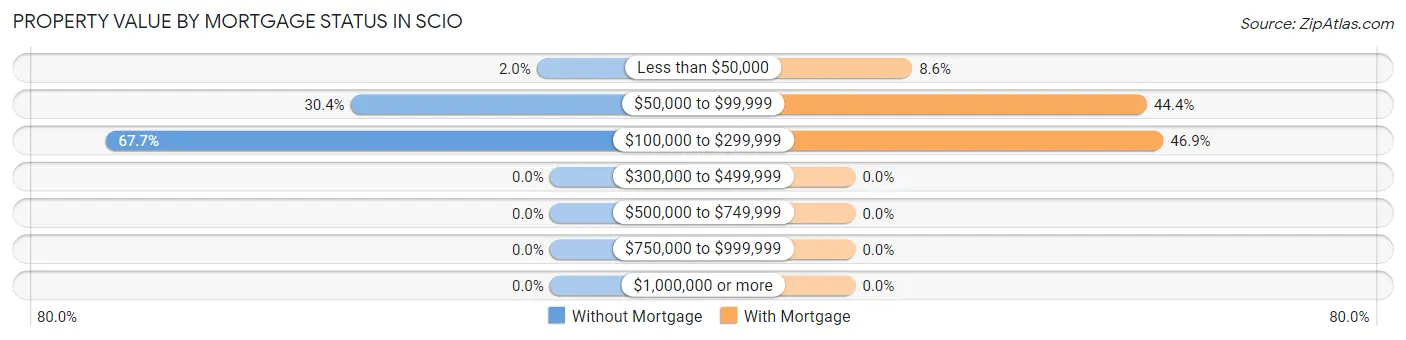
| Property Value | Without Mortgage | With Mortgage |
| Less than $50,000 | 4 (2.0%) | 7 (8.6%) |
| $50,000 to $99,999 | 61 (30.3%) | 36 (44.4%) |
| $100,000 to $299,999 | 136 (67.7%) | 38 (46.9%) |
| $300,000 to $499,999 | 0 (0.0%) | 0 (0.0%) |
| $500,000 to $749,999 | 0 (0.0%) | 0 (0.0%) |
| $750,000 to $999,999 | 0 (0.0%) | 0 (0.0%) |
| $1,000,000 or more | 0 (0.0%) | 0 (0.0%) |
| Total | 201 (100.0%) | 81 (100.0%) |
Household Income by Mortgage Status in Scio
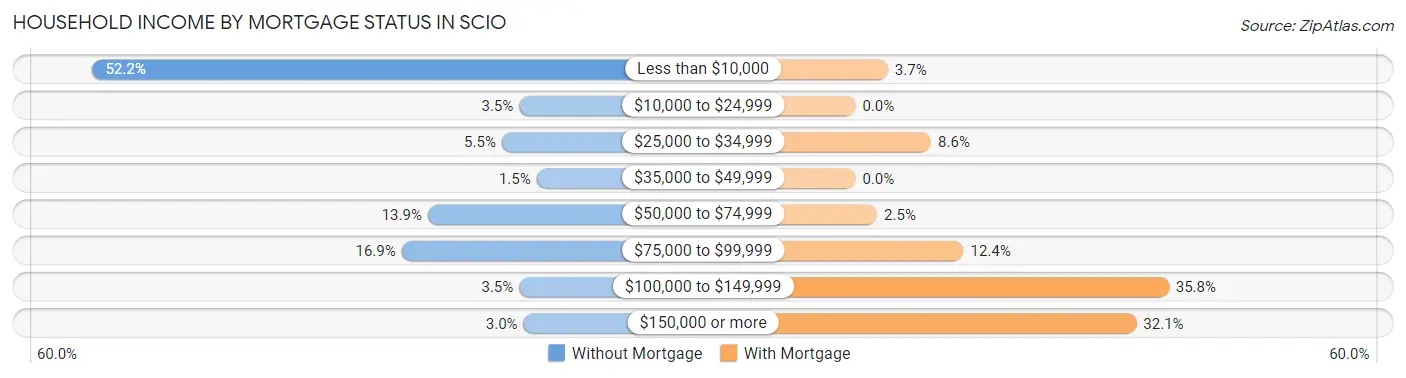
| Household Income | Without Mortgage | With Mortgage |
| Less than $10,000 | 105 (52.2%) | 3 (3.7%) |
| $10,000 to $24,999 | 7 (3.5%) | 0 (0.0%) |
| $25,000 to $34,999 | 11 (5.5%) | 7 (8.6%) |
| $35,000 to $49,999 | 3 (1.5%) | 0 (0.0%) |
| $50,000 to $74,999 | 28 (13.9%) | 2 (2.5%) |
| $75,000 to $99,999 | 34 (16.9%) | 10 (12.3%) |
| $100,000 to $149,999 | 7 (3.5%) | 29 (35.8%) |
| $150,000 or more | 6 (3.0%) | 26 (32.1%) |
| Total | 201 (100.0%) | 81 (100.0%) |
Property Value to Household Income Ratio in Scio
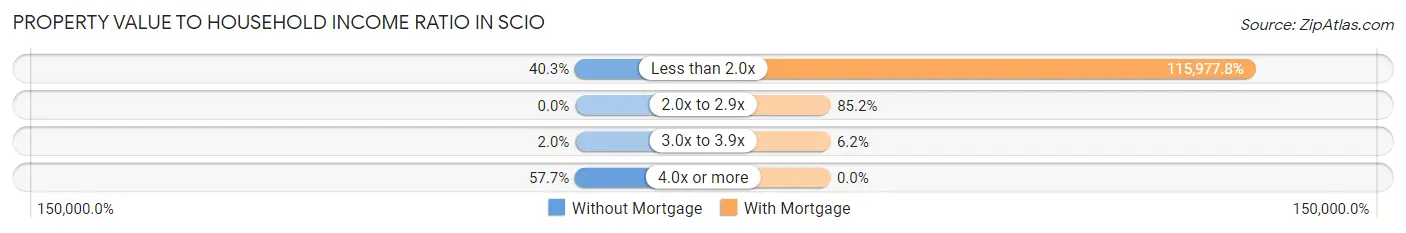
| Value-to-Income Ratio | Without Mortgage | With Mortgage |
| Less than 2.0x | 81 (40.3%) | 93,942 (115,977.8%) |
| 2.0x to 2.9x | 0 (0.0%) | 69 (85.2%) |
| 3.0x to 3.9x | 4 (2.0%) | 5 (6.2%) |
| 4.0x or more | 116 (57.7%) | 0 (0.0%) |
| Total | 201 (100.0%) | 81 (100.0%) |
Real Estate Taxes by Mortgage Status in Scio
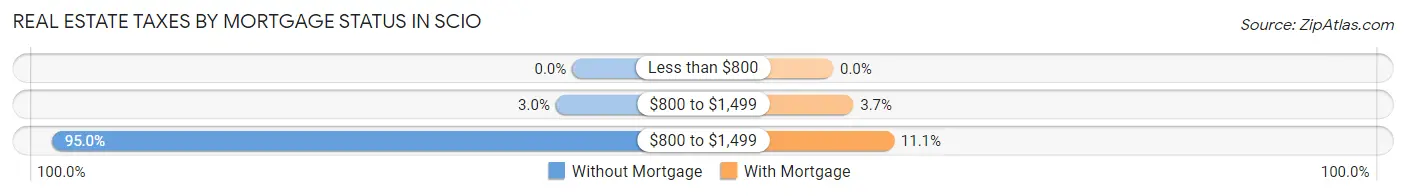
| Property Taxes | Without Mortgage | With Mortgage |
| Less than $800 | 0 (0.0%) | 0 (0.0%) |
| $800 to $1,499 | 6 (3.0%) | 3 (3.7%) |
| $800 to $1,499 | 191 (95.0%) | 9 (11.1%) |
| Total | 201 (100.0%) | 81 (100.0%) |
Health & Disability in Scio
Health Insurance Coverage by Age in Scio
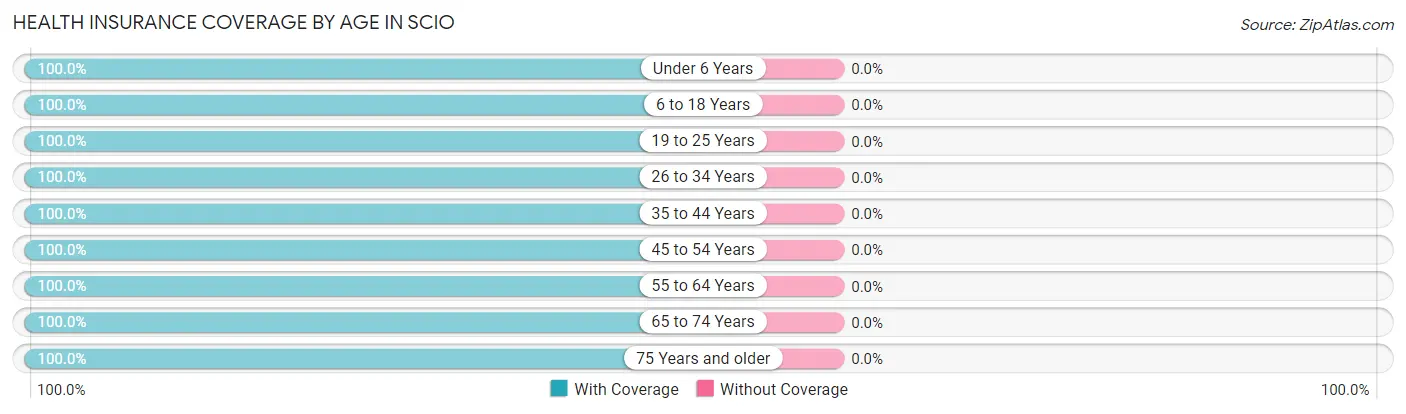
| Age Bracket | With Coverage | Without Coverage |
| Under 6 Years | 29 (100.0%) | 0 (0.0%) |
| 6 to 18 Years | 32 (100.0%) | 0 (0.0%) |
| 19 to 25 Years | 48 (100.0%) | 0 (0.0%) |
| 26 to 34 Years | 16 (100.0%) | 0 (0.0%) |
| 35 to 44 Years | 64 (100.0%) | 0 (0.0%) |
| 45 to 54 Years | 72 (100.0%) | 0 (0.0%) |
| 55 to 64 Years | 223 (100.0%) | 0 (0.0%) |
| 65 to 74 Years | 69 (100.0%) | 0 (0.0%) |
| 75 Years and older | 36 (100.0%) | 0 (0.0%) |
| Total | 589 (100.0%) | 0 (0.0%) |
Health Insurance Coverage by Citizenship Status in Scio
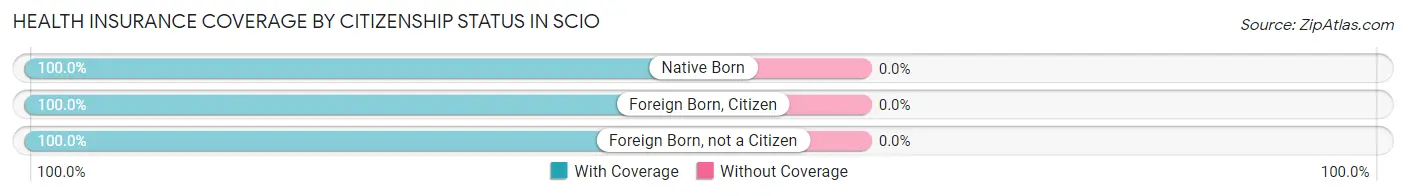
| Citizenship Status | With Coverage | Without Coverage |
| Native Born | 29 (100.0%) | 0 (0.0%) |
| Foreign Born, Citizen | 32 (100.0%) | 0 (0.0%) |
| Foreign Born, not a Citizen | 48 (100.0%) | 0 (0.0%) |
Health Insurance Coverage by Household Income in Scio
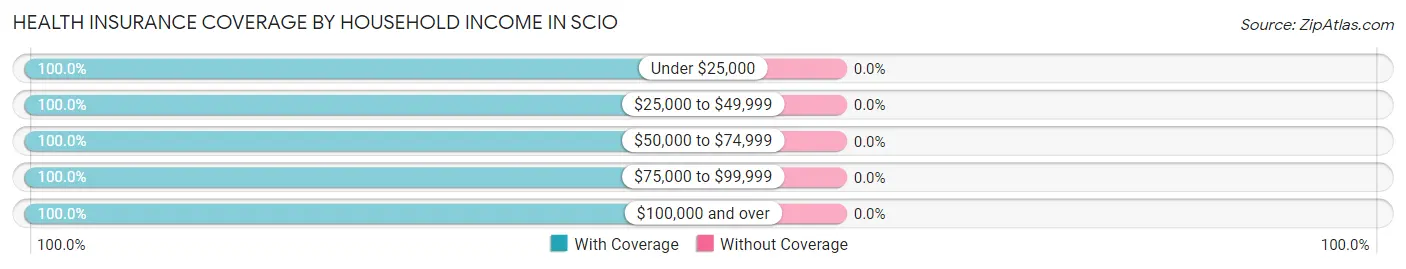
| Household Income | With Coverage | Without Coverage |
| Under $25,000 | 198 (100.0%) | 0 (0.0%) |
| $25,000 to $49,999 | 27 (100.0%) | 0 (0.0%) |
| $50,000 to $74,999 | 76 (100.0%) | 0 (0.0%) |
| $75,000 to $99,999 | 124 (100.0%) | 0 (0.0%) |
| $100,000 and over | 164 (100.0%) | 0 (0.0%) |
Public vs Private Health Insurance Coverage by Age in Scio
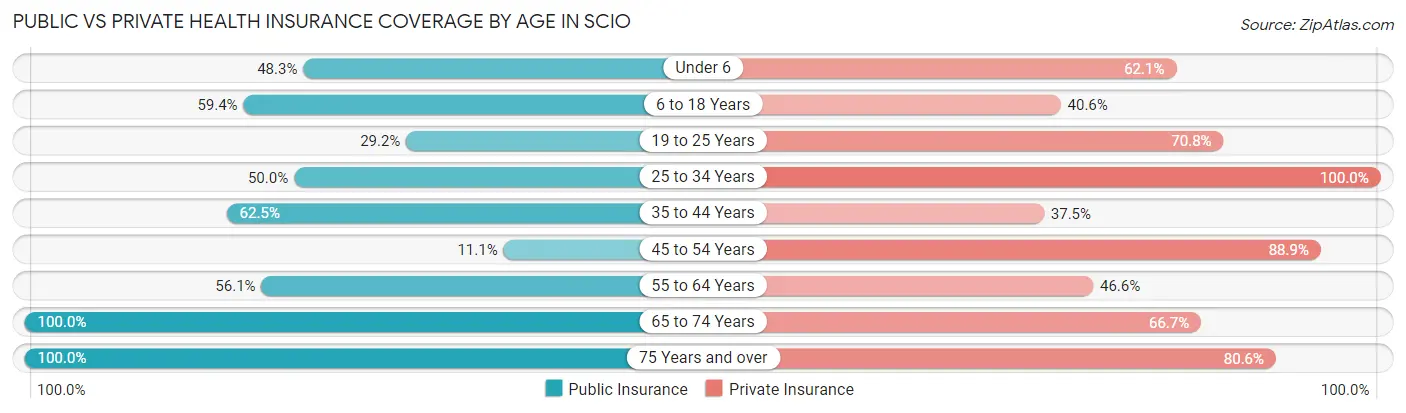
| Age Bracket | Public Insurance | Private Insurance |
| Under 6 | 14 (48.3%) | 18 (62.1%) |
| 6 to 18 Years | 19 (59.4%) | 13 (40.6%) |
| 19 to 25 Years | 14 (29.2%) | 34 (70.8%) |
| 25 to 34 Years | 8 (50.0%) | 16 (100.0%) |
| 35 to 44 Years | 40 (62.5%) | 24 (37.5%) |
| 45 to 54 Years | 8 (11.1%) | 64 (88.9%) |
| 55 to 64 Years | 125 (56.0%) | 104 (46.6%) |
| 65 to 74 Years | 69 (100.0%) | 46 (66.7%) |
| 75 Years and over | 36 (100.0%) | 29 (80.6%) |
| Total | 333 (56.5%) | 348 (59.1%) |
Disability Status by Sex by Age in Scio
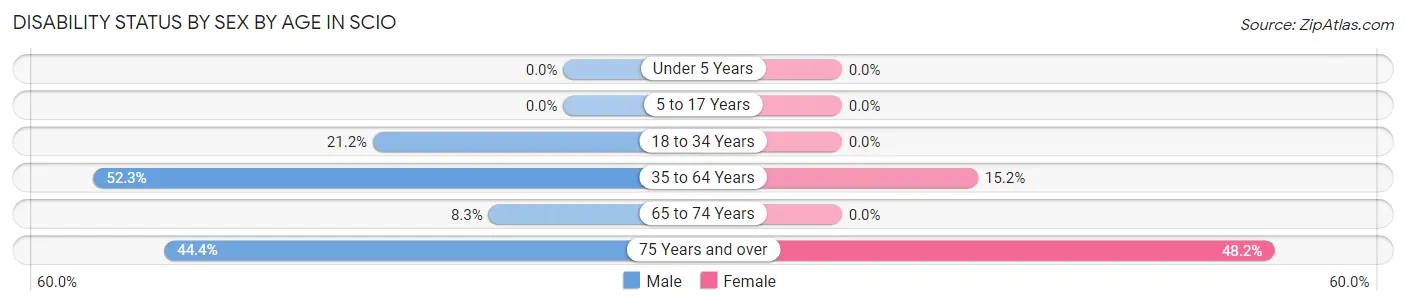
| Age Bracket | Male | Female |
| Under 5 Years | 0 (0.0%) | 0 (0.0%) |
| 5 to 17 Years | 0 (0.0%) | 0 (0.0%) |
| 18 to 34 Years | 14 (21.2%) | 0 (0.0%) |
| 35 to 64 Years | 112 (52.3%) | 22 (15.2%) |
| 65 to 74 Years | 4 (8.3%) | 0 (0.0%) |
| 75 Years and over | 4 (44.4%) | 13 (48.1%) |
Disability Class by Sex by Age in Scio
Disability Class: Hearing Difficulty
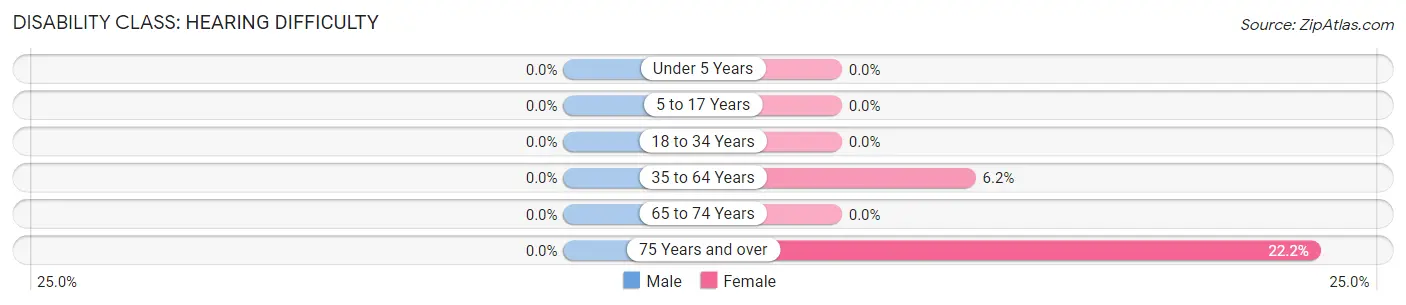
| Age Bracket | Male | Female |
| Under 5 Years | 0 (0.0%) | 0 (0.0%) |
| 5 to 17 Years | 0 (0.0%) | 0 (0.0%) |
| 18 to 34 Years | 0 (0.0%) | 0 (0.0%) |
| 35 to 64 Years | 0 (0.0%) | 9 (6.2%) |
| 65 to 74 Years | 0 (0.0%) | 0 (0.0%) |
| 75 Years and over | 0 (0.0%) | 6 (22.2%) |
Disability Class: Vision Difficulty
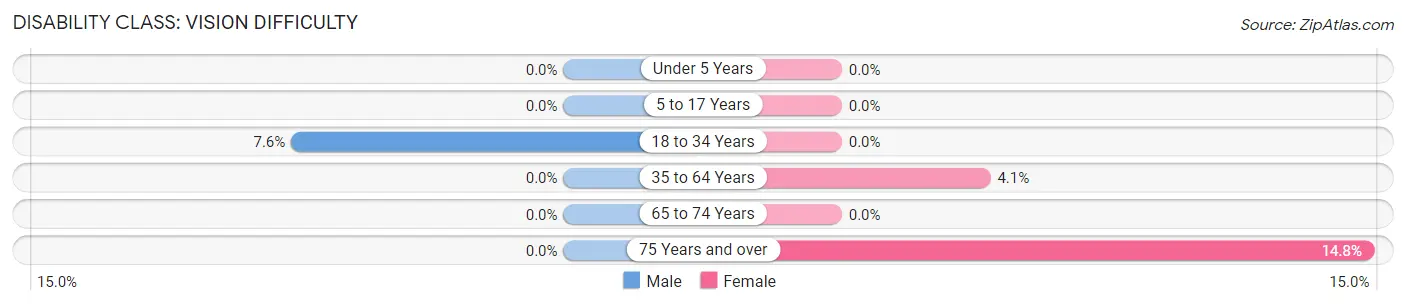
| Age Bracket | Male | Female |
| Under 5 Years | 0 (0.0%) | 0 (0.0%) |
| 5 to 17 Years | 0 (0.0%) | 0 (0.0%) |
| 18 to 34 Years | 5 (7.6%) | 0 (0.0%) |
| 35 to 64 Years | 0 (0.0%) | 6 (4.1%) |
| 65 to 74 Years | 0 (0.0%) | 0 (0.0%) |
| 75 Years and over | 0 (0.0%) | 4 (14.8%) |
Disability Class: Cognitive Difficulty
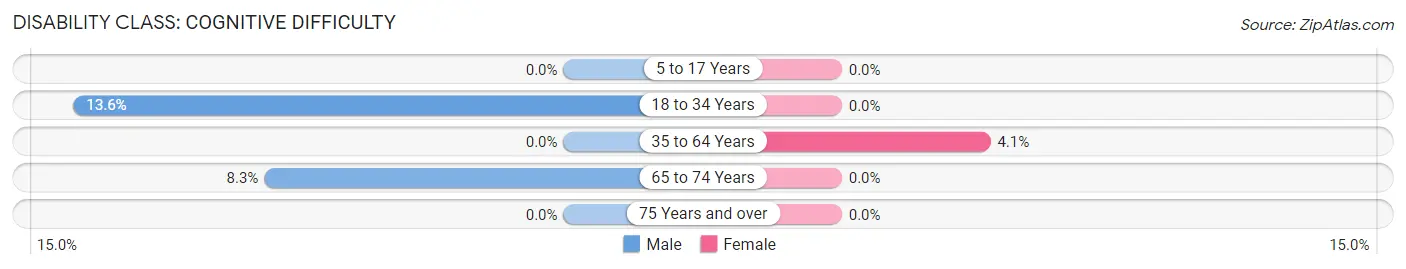
| Age Bracket | Male | Female |
| 5 to 17 Years | 0 (0.0%) | 0 (0.0%) |
| 18 to 34 Years | 9 (13.6%) | 0 (0.0%) |
| 35 to 64 Years | 0 (0.0%) | 6 (4.1%) |
| 65 to 74 Years | 4 (8.3%) | 0 (0.0%) |
| 75 Years and over | 0 (0.0%) | 0 (0.0%) |
Disability Class: Ambulatory Difficulty
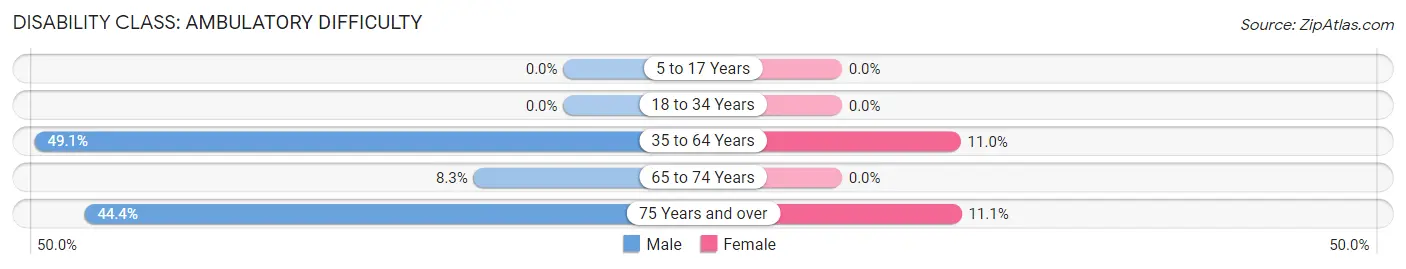
| Age Bracket | Male | Female |
| 5 to 17 Years | 0 (0.0%) | 0 (0.0%) |
| 18 to 34 Years | 0 (0.0%) | 0 (0.0%) |
| 35 to 64 Years | 105 (49.1%) | 16 (11.0%) |
| 65 to 74 Years | 4 (8.3%) | 0 (0.0%) |
| 75 Years and over | 4 (44.4%) | 3 (11.1%) |
Disability Class: Self-Care Difficulty
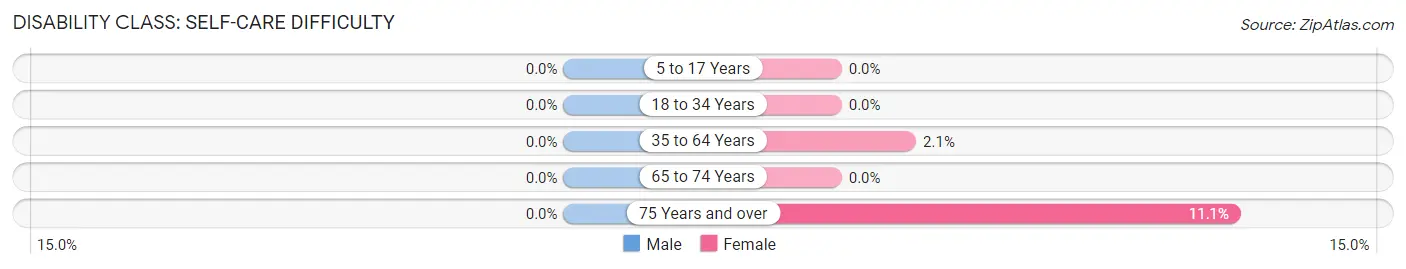
| Age Bracket | Male | Female |
| 5 to 17 Years | 0 (0.0%) | 0 (0.0%) |
| 18 to 34 Years | 0 (0.0%) | 0 (0.0%) |
| 35 to 64 Years | 0 (0.0%) | 3 (2.1%) |
| 65 to 74 Years | 0 (0.0%) | 0 (0.0%) |
| 75 Years and over | 0 (0.0%) | 3 (11.1%) |
Technology Access in Scio
Computing Device Access in Scio
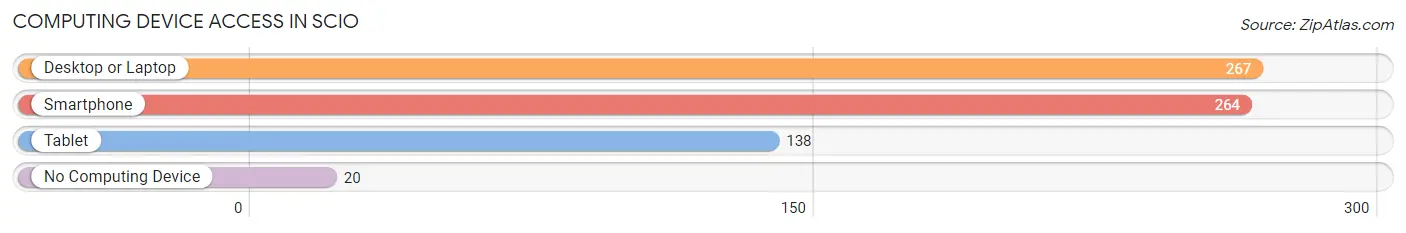
| Device Type | # Households | % Households |
| Desktop or Laptop | 267 | 88.1% |
| Smartphone | 264 | 87.1% |
| Tablet | 138 | 45.5% |
| No Computing Device | 20 | 6.6% |
| Total | 303 | 100.0% |
Internet Access in Scio
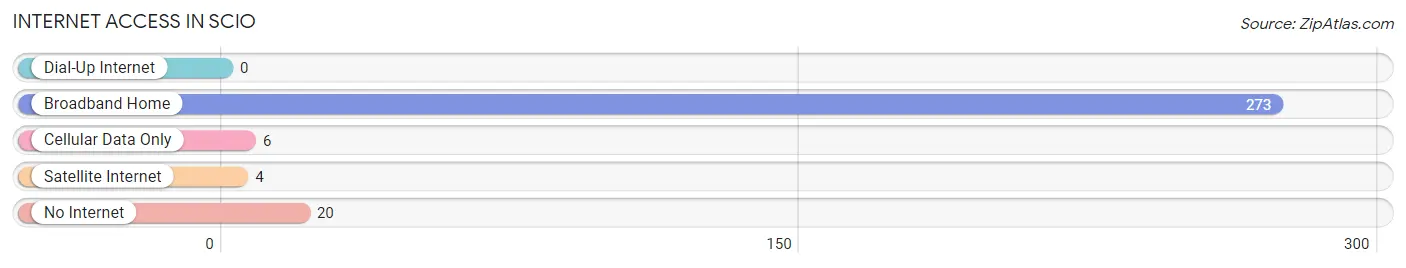
| Internet Type | # Households | % Households |
| Dial-Up Internet | 0 | 0.0% |
| Broadband Home | 273 | 90.1% |
| Cellular Data Only | 6 | 2.0% |
| Satellite Internet | 4 | 1.3% |
| No Internet | 20 | 6.6% |
| Total | 303 | 100.0% |
Scio Summary
Scio is a small town located in Allegany County, New York, United States. The population was 1,845 at the 2010 census. It is part of the Olean, New York Metropolitan Statistical Area.
History
The town of Scio was first settled in 1808 by a group of settlers from Connecticut. The town was named after the ancient Greek city of Scio, which was located on the island of Lesbos. The town was officially established in 1820.
The town was an important center for the lumber industry in the 19th century. The town was also home to several gristmills, sawmills, and tanneries.
Geography
Scio is located in the western part of Allegany County, New York. It is bordered by the towns of Amity, Clarksville, and Willing. The town is located in the Finger Lakes region of New York.
The town is located in the Allegheny Plateau, which is a region of rolling hills and valleys. The highest point in the town is 1,845 feet (562 m) above sea level.
The town is located in the Genesee River watershed. The Genesee River flows through the town, and is a major tributary of Lake Ontario.
Economy
The economy of Scio is largely based on agriculture and tourism. The town is home to several farms, which produce a variety of crops, including corn, soybeans, hay, and apples.
The town is also home to several wineries, which produce a variety of wines. The town is also home to several bed and breakfasts, which attract tourists from all over the world.
Demographics
As of the 2010 census, there were 1,845 people, 745 households, and 498 families residing in the town. The population density was 39.3 people per square mile (15.2/km2). There were 845 housing units at an average density of 17.9 per square mile (6.9/km2).
The racial makeup of the town was 97.2% White, 0.7% African American, 0.2% Native American, 0.2% Asian, 0.1% Pacific Islander, 0.2% from other races, and 1.0% from two or more races. Hispanic or Latino of any race were 1.2% of the population.
There were 745 households, out of which 28.3% had children under the age of 18 living with them, 51.2% were married couples living together, 10.2% had a female householder with no husband present, and 33.7% were non-families. 28.7% of all households were made up of individuals, and 14.2% had someone living alone who was 65 years of age or older. The average household size was 2.45 and the average family size was 2.97.
In the town, the population was spread out, with 24.2% under the age of 18, 6.7% from 18 to 24, 25.2% from 25 to 44, 25.2% from 45 to 64, and 18.7% who were 65 years of age or older. The median age was 41 years. For every 100 females, there were 94.2 males. For every 100 females age 18 and over, there were 91.2 males.
The median income for a household in the town was $35,000, and the median income for a family was $41,250. Males had a median income of $31,250 versus $22,500 for females. The per capita income for the town was $17,845. About 8.2% of families and 11.2% of the population were below the poverty line, including 15.2% of those under age 18 and 8.2% of those age 65 or over.
Common Questions
What is Per Capita Income in Scio?
Per Capita income in Scio is $27,640.
What is the Median Family Income in Scio?
Median Family Income in Scio is $87,969.
What is Income or Wage Gap in Scio?
Income or Wage Gap in Scio is 35.9%.
Women in Scio earn 64.1 cents for every dollar earned by a man.
What is Inequality or Gini Index in Scio?
Inequality or Gini Index in Scio is 0.53.
What is the Total Population of Scio?
Total Population of Scio is 589.
What is the Total Male Population of Scio?
Total Male Population of Scio is 352.
What is the Total Female Population of Scio?
Total Female Population of Scio is 237.
What is the Ratio of Males per 100 Females in Scio?
There are 148.52 Males per 100 Females in Scio.
What is the Ratio of Females per 100 Males in Scio?
There are 67.33 Females per 100 Males in Scio.
What is the Median Population Age in Scio?
Median Population Age in Scio is 56.4 Years.
What is the Average Family Size in Scio
Average Family Size in Scio is 2.8 People.
What is the Average Household Size in Scio
Average Household Size in Scio is 1.9 People.
How Large is the Labor Force in Scio?
There are 276 People in the Labor Forcein in Scio.
What is the Percentage of People in the Labor Force in Scio?
51.1% of People are in the Labor Force in Scio.
What is the Unemployment Rate in Scio?
Unemployment Rate in Scio is 13.0%.