Schoharie, NY Map & Demographics
Schoharie Map
Schoharie Overview
$32,365
PER CAPITA INCOME
$77,222
AVG FAMILY INCOME
$50,898
AVG HOUSEHOLD INCOME
41.9%
WAGE / INCOME GAP [ % ]
58.1¢/ $1
WAGE / INCOME GAP [ $ ]
0.44
INEQUALITY / GINI INDEX
956
TOTAL POPULATION
517
MALE POPULATION
439
FEMALE POPULATION
117.77
MALES / 100 FEMALES
84.91
FEMALES / 100 MALES
35.0
MEDIAN AGE
3.1
AVG FAMILY SIZE
2.2
AVG HOUSEHOLD SIZE
354
LABOR FORCE [ PEOPLE ]
47.0%
PERCENT IN LABOR FORCE
3.4%
UNEMPLOYMENT RATE
Schoharie Zip Codes
Schoharie Area Codes
Income in Schoharie
Income Overview in Schoharie
Per Capita Income in Schoharie is $32,365, while median incomes of families and households are $77,222 and $50,898 respectively.
| Characteristic | Number | Measure |
| Per Capita Income | 956 | $32,365 |
| Median Family Income | 206 | $77,222 |
| Mean Family Income | 206 | $91,266 |
| Median Household Income | 393 | $50,898 |
| Mean Household Income | 393 | $71,812 |
| Income Deficit | 206 | $0 |
| Wage / Income Gap (%) | 956 | 41.94% |
| Wage / Income Gap ($) | 956 | 58.06¢ per $1 |
| Gini / Inequality Index | 956 | 0.44 |
Earnings by Sex in Schoharie
Average Earnings in Schoharie are $40,469, $50,000 for men and $29,028 for women, a difference of 41.9%.

| Sex | Number | Average Earnings |
| Male | 236 (55.9%) | $50,000 |
| Female | 186 (44.1%) | $29,028 |
| Total | 422 (100.0%) | $40,469 |
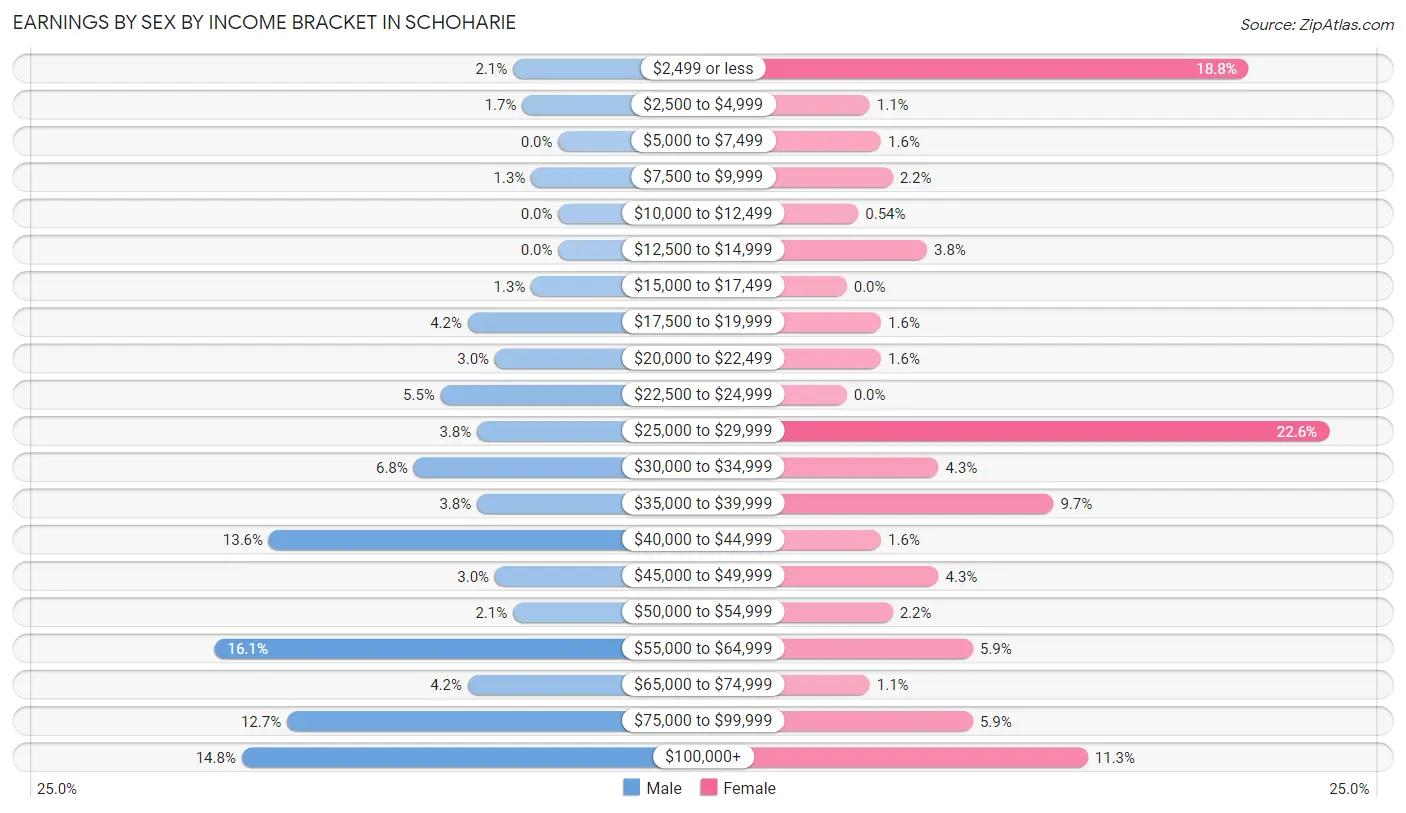
Earnings by Sex by Income Bracket in Schoharie
The most common earnings brackets in Schoharie are $55,000 to $64,999 for men (38 | 16.1%) and $25,000 to $29,999 for women (42 | 22.6%).
| Income | Male | Female |
| $2,499 or less | 5 (2.1%) | 35 (18.8%) |
| $2,500 to $4,999 | 4 (1.7%) | 2 (1.1%) |
| $5,000 to $7,499 | 0 (0.0%) | 3 (1.6%) |
| $7,500 to $9,999 | 3 (1.3%) | 4 (2.1%) |
| $10,000 to $12,499 | 0 (0.0%) | 1 (0.5%) |
| $12,500 to $14,999 | 0 (0.0%) | 7 (3.8%) |
| $15,000 to $17,499 | 3 (1.3%) | 0 (0.0%) |
| $17,500 to $19,999 | 10 (4.2%) | 3 (1.6%) |
| $20,000 to $22,499 | 7 (3.0%) | 3 (1.6%) |
| $22,500 to $24,999 | 13 (5.5%) | 0 (0.0%) |
| $25,000 to $29,999 | 9 (3.8%) | 42 (22.6%) |
| $30,000 to $34,999 | 16 (6.8%) | 8 (4.3%) |
| $35,000 to $39,999 | 9 (3.8%) | 18 (9.7%) |
| $40,000 to $44,999 | 32 (13.6%) | 3 (1.6%) |
| $45,000 to $49,999 | 7 (3.0%) | 8 (4.3%) |
| $50,000 to $54,999 | 5 (2.1%) | 4 (2.1%) |
| $55,000 to $64,999 | 38 (16.1%) | 11 (5.9%) |
| $65,000 to $74,999 | 10 (4.2%) | 2 (1.1%) |
| $75,000 to $99,999 | 30 (12.7%) | 11 (5.9%) |
| $100,000+ | 35 (14.8%) | 21 (11.3%) |
| Total | 236 (100.0%) | 186 (100.0%) |
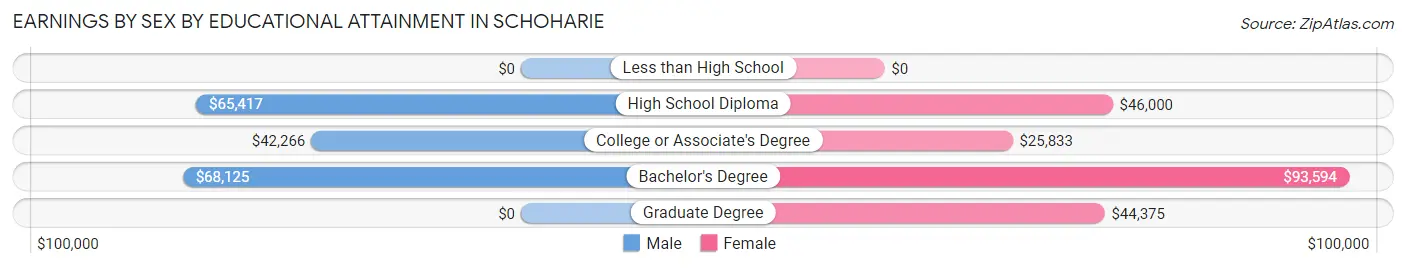
Earnings by Sex by Educational Attainment in Schoharie
Average earnings in Schoharie are $57,880 for men and $33,571 for women, a difference of 42.0%. Men with an educational attainment of bachelor's degree enjoy the highest average annual earnings of $68,125, while those with college or associate's degree education earn the least with $42,266. Women with an educational attainment of bachelor's degree earn the most with the average annual earnings of $93,594, while those with college or associate's degree education have the smallest earnings of $25,833.
| Educational Attainment | Male Income | Female Income |
| Less than High School | - | - |
| High School Diploma | $65,417 | $46,000 |
| College or Associate's Degree | $42,266 | $25,833 |
| Bachelor's Degree | $68,125 | $93,594 |
| Graduate Degree | - | - |
| Total | $57,880 | $33,571 |
Family Income in Schoharie
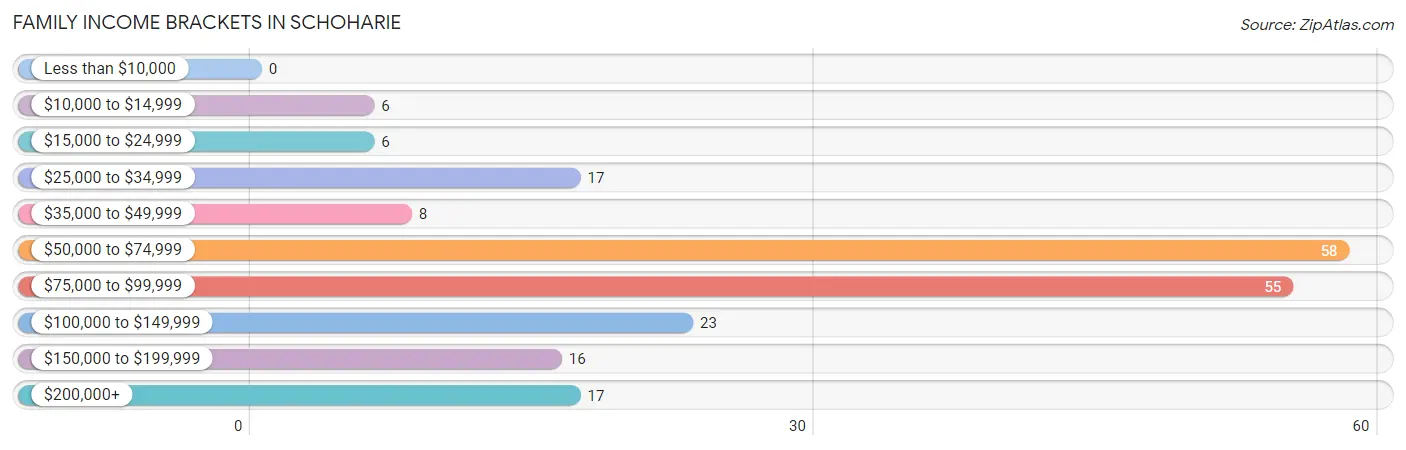
Family Income Brackets in Schoharie
According to the Schoharie family income data, there are 58 families falling into the $50,000 to $74,999 income range, which is the most common income bracket and makes up 28.2% of all families.
| Income Bracket | # Families | % Families |
| Less than $10,000 | 0 | 0.0% |
| $10,000 to $14,999 | 6 | 2.9% |
| $15,000 to $24,999 | 6 | 2.9% |
| $25,000 to $34,999 | 17 | 8.3% |
| $35,000 to $49,999 | 8 | 3.9% |
| $50,000 to $74,999 | 58 | 28.2% |
| $75,000 to $99,999 | 55 | 26.7% |
| $100,000 to $149,999 | 23 | 11.2% |
| $150,000 to $199,999 | 16 | 7.8% |
| $200,000+ | 17 | 8.3% |
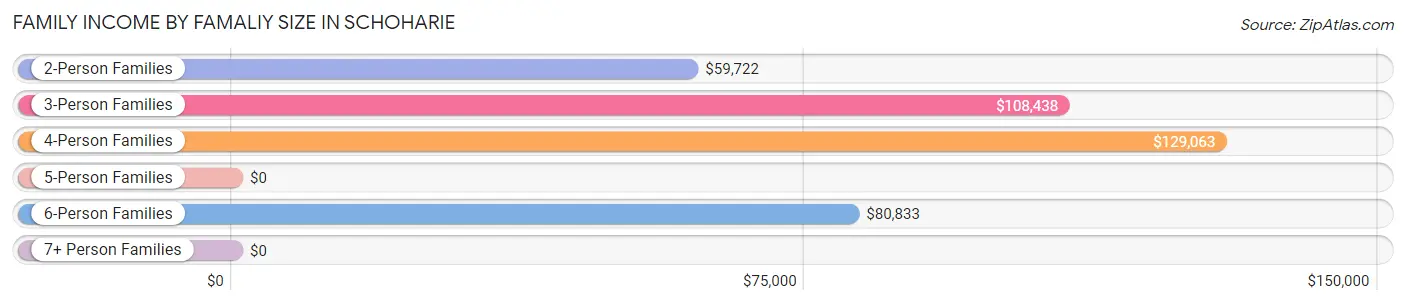
Family Income by Famaliy Size in Schoharie
4-person families (17 | 8.3%) account for the highest median family income in Schoharie with $129,063 per family, while 3-person families (37 | 18.0%) have the highest median income of $36,146 per family member.
| Income Bracket | # Families | Median Income |
| 2-Person Families | 88 (42.7%) | $59,722 |
| 3-Person Families | 37 (18.0%) | $108,438 |
| 4-Person Families | 17 (8.3%) | $129,063 |
| 5-Person Families | 50 (24.3%) | $0 |
| 6-Person Families | 14 (6.8%) | $80,833 |
| 7+ Person Families | 0 (0.0%) | $0 |
| Total | 206 (100.0%) | $77,222 |
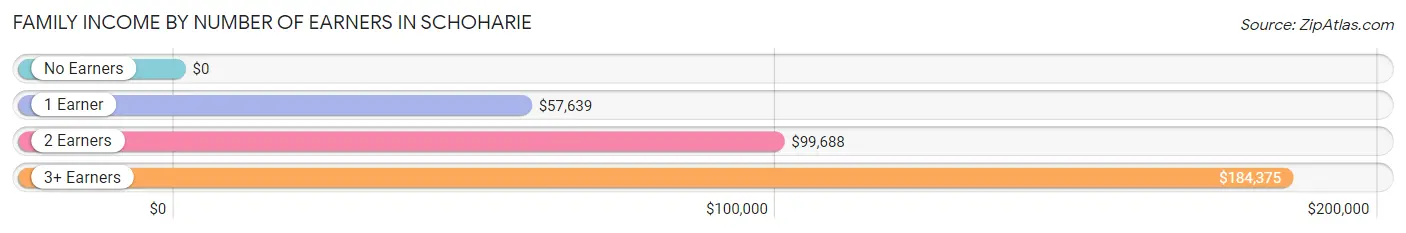
Family Income by Number of Earners in Schoharie
| Number of Earners | # Families | Median Income |
| No Earners | 23 (11.2%) | $0 |
| 1 Earner | 114 (55.3%) | $57,639 |
| 2 Earners | 57 (27.7%) | $99,688 |
| 3+ Earners | 12 (5.8%) | $184,375 |
| Total | 206 (100.0%) | $77,222 |
Household Income in Schoharie
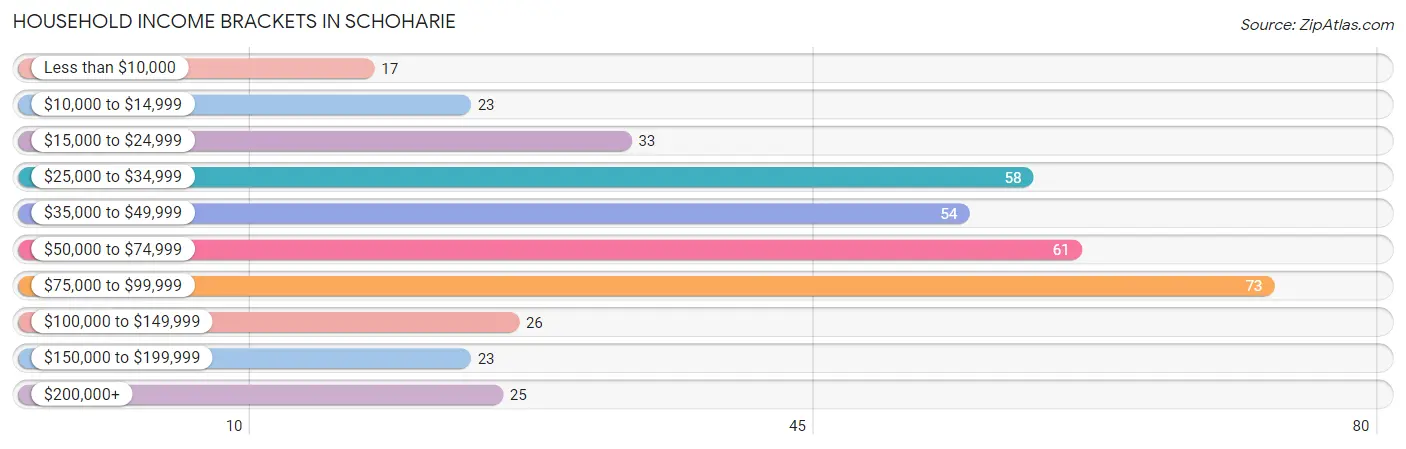
Household Income Brackets in Schoharie
With 73 households falling in the category, the $75,000 to $99,999 income range is the most frequent in Schoharie, accounting for 18.6% of all households. In contrast, only 17 households (4.3%) fall into the less than $10,000 income bracket, making it the least populous group.
| Income Bracket | # Households | % Households |
| Less than $10,000 | 17 | 4.3% |
| $10,000 to $14,999 | 23 | 5.9% |
| $15,000 to $24,999 | 33 | 8.4% |
| $25,000 to $34,999 | 58 | 14.8% |
| $35,000 to $49,999 | 54 | 13.7% |
| $50,000 to $74,999 | 61 | 15.5% |
| $75,000 to $99,999 | 73 | 18.6% |
| $100,000 to $149,999 | 26 | 6.6% |
| $150,000 to $199,999 | 23 | 5.9% |
| $200,000+ | 25 | 6.4% |
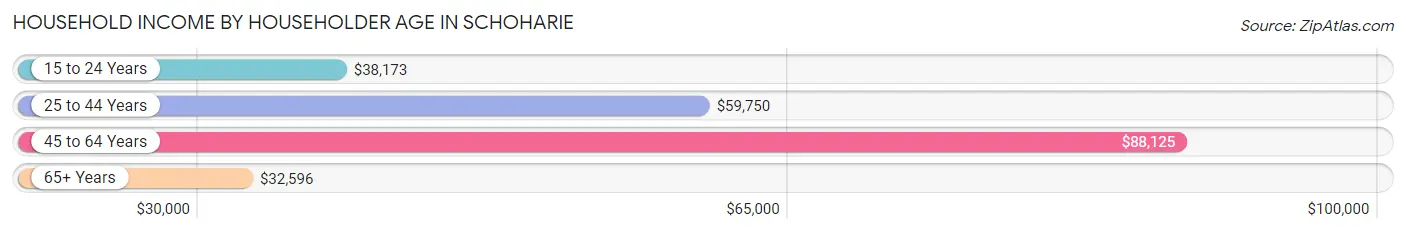
Household Income by Householder Age in Schoharie
The median household income in Schoharie is $50,898, with the highest median household income of $88,125 found in the 45 to 64 years age bracket for the primary householder. A total of 99 households (25.2%) fall into this category. Meanwhile, the 65+ years age bracket for the primary householder has the lowest median household income of $32,596, with 143 households (36.4%) in this group.
| Income Bracket | # Households | Median Income |
| 15 to 24 Years | 39 (9.9%) | $38,173 |
| 25 to 44 Years | 112 (28.5%) | $59,750 |
| 45 to 64 Years | 99 (25.2%) | $88,125 |
| 65+ Years | 143 (36.4%) | $32,596 |
| Total | 393 (100.0%) | $50,898 |
Poverty in Schoharie
Income Below Poverty by Sex and Age in Schoharie
With 7.3% poverty level for males and 13.7% for females among the residents of Schoharie, 5 year old males and 75 year old and over females are the most vulnerable to poverty, with 4 males (26.7%) and 14 females (21.5%) in their respective age groups living below the poverty level.
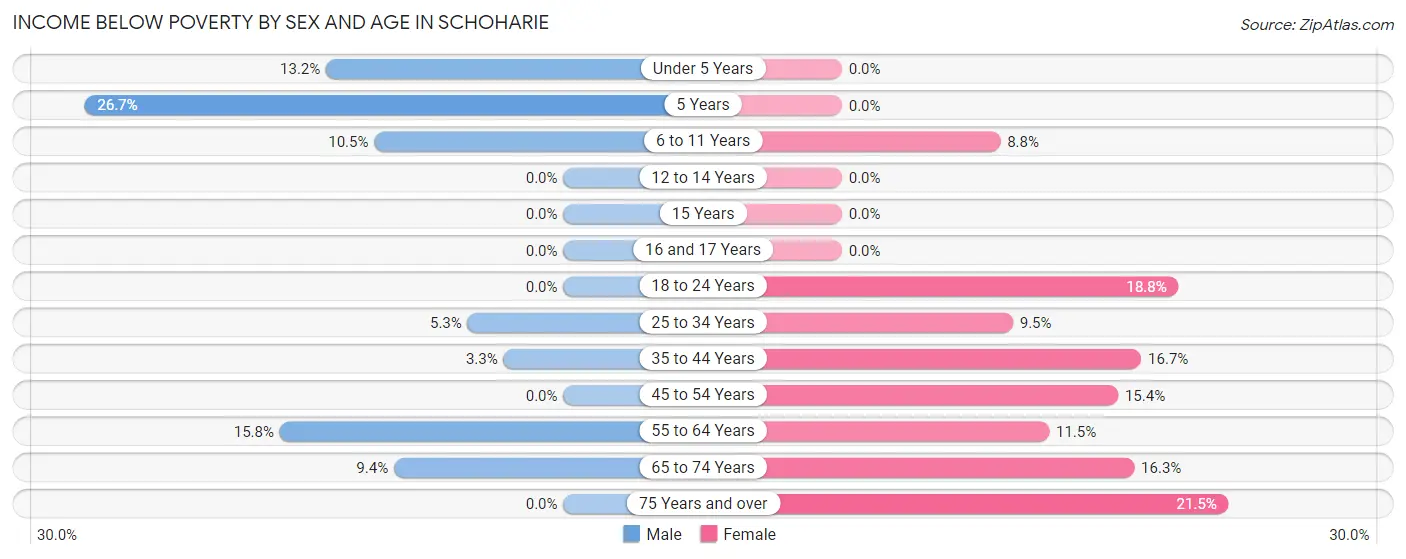
| Age Bracket | Male | Female |
| Under 5 Years | 7 (13.2%) | 0 (0.0%) |
| 5 Years | 4 (26.7%) | 0 (0.0%) |
| 6 to 11 Years | 4 (10.5%) | 3 (8.8%) |
| 12 to 14 Years | 0 (0.0%) | 0 (0.0%) |
| 15 Years | 0 (0.0%) | 0 (0.0%) |
| 16 and 17 Years | 0 (0.0%) | 0 (0.0%) |
| 18 to 24 Years | 0 (0.0%) | 9 (18.8%) |
| 25 to 34 Years | 4 (5.3%) | 8 (9.5%) |
| 35 to 44 Years | 2 (3.3%) | 6 (16.7%) |
| 45 to 54 Years | 0 (0.0%) | 4 (15.4%) |
| 55 to 64 Years | 9 (15.8%) | 6 (11.5%) |
| 65 to 74 Years | 5 (9.4%) | 7 (16.3%) |
| 75 Years and over | 0 (0.0%) | 14 (21.5%) |
| Total | 35 (7.3%) | 57 (13.7%) |
Income Above Poverty by Sex and Age in Schoharie
According to the poverty statistics in Schoharie, males aged 12 to 14 years and females aged under 5 years are the age groups that are most secure financially, with 100.0% of males and 100.0% of females in these age groups living above the poverty line.
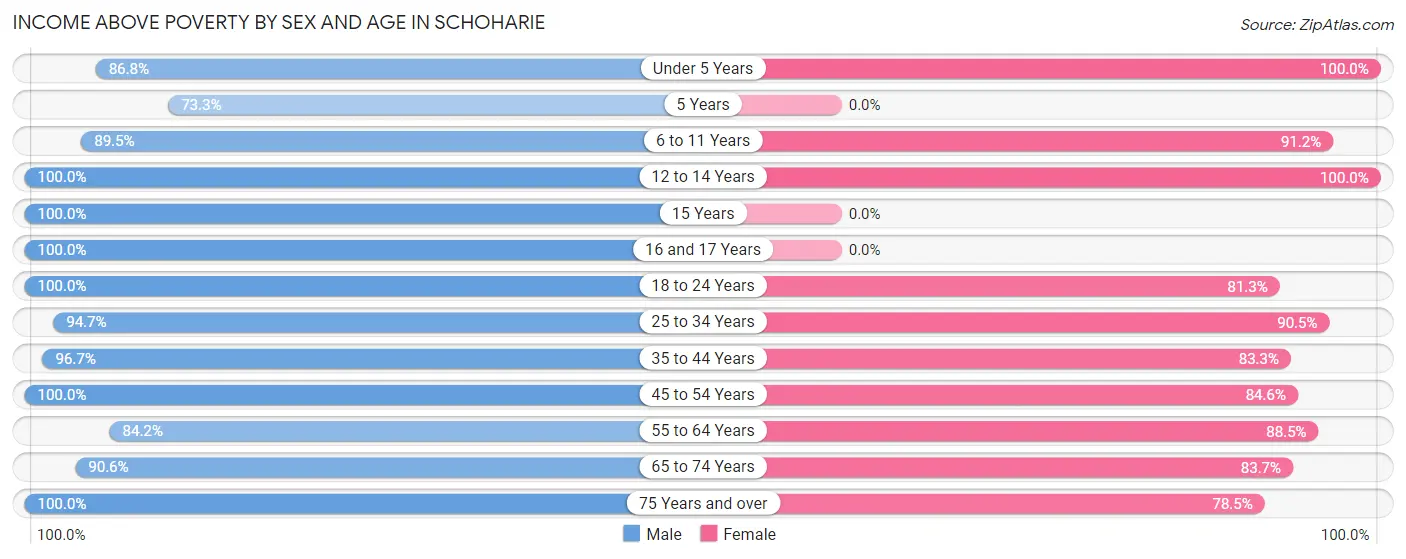
| Age Bracket | Male | Female |
| Under 5 Years | 46 (86.8%) | 6 (100.0%) |
| 5 Years | 11 (73.3%) | 0 (0.0%) |
| 6 to 11 Years | 34 (89.5%) | 31 (91.2%) |
| 12 to 14 Years | 20 (100.0%) | 21 (100.0%) |
| 15 Years | 16 (100.0%) | 0 (0.0%) |
| 16 and 17 Years | 5 (100.0%) | 0 (0.0%) |
| 18 to 24 Years | 39 (100.0%) | 39 (81.2%) |
| 25 to 34 Years | 71 (94.7%) | 76 (90.5%) |
| 35 to 44 Years | 58 (96.7%) | 30 (83.3%) |
| 45 to 54 Years | 29 (100.0%) | 22 (84.6%) |
| 55 to 64 Years | 48 (84.2%) | 46 (88.5%) |
| 65 to 74 Years | 48 (90.6%) | 36 (83.7%) |
| 75 Years and over | 22 (100.0%) | 51 (78.5%) |
| Total | 447 (92.7%) | 358 (86.3%) |
Income Below Poverty Among Married-Couple Families in Schoharie
The poverty statistics for married-couple families in Schoharie show that 4.2% or 6 of the total 142 families live below the poverty line. Families with 3 or 4 children have the highest poverty rate of 7.3%, comprising of 4 families. On the other hand, families with 1 or 2 children have the lowest poverty rate of 0.0%, which includes 0 families.
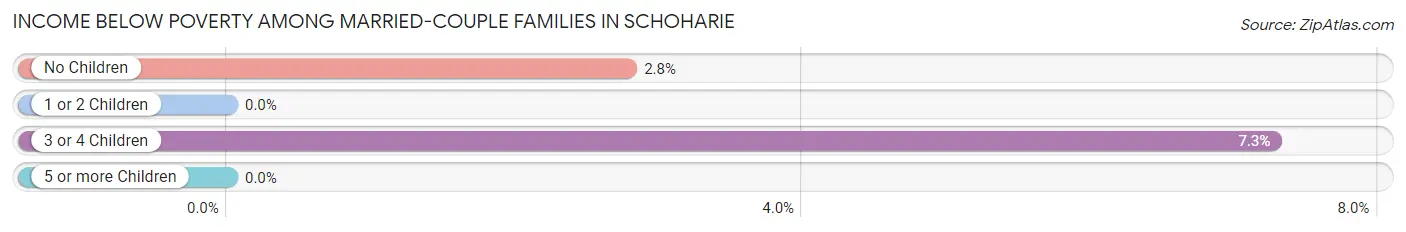
| Children | Above Poverty | Below Poverty |
| No Children | 70 (97.2%) | 2 (2.8%) |
| 1 or 2 Children | 15 (100.0%) | 0 (0.0%) |
| 3 or 4 Children | 51 (92.7%) | 4 (7.3%) |
| 5 or more Children | 0 (0.0%) | 0 (0.0%) |
| Total | 136 (95.8%) | 6 (4.2%) |
Income Below Poverty Among Single-Parent Households in Schoharie
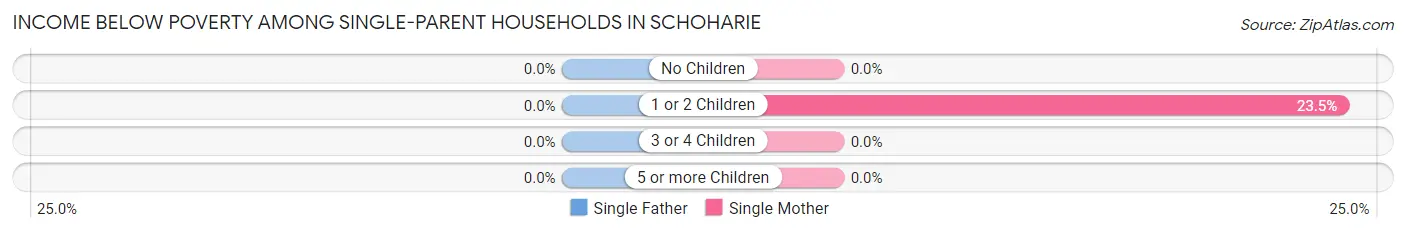
| Children | Single Father | Single Mother |
| No Children | 0 (0.0%) | 0 (0.0%) |
| 1 or 2 Children | 0 (0.0%) | 4 (23.5%) |
| 3 or 4 Children | 0 (0.0%) | 0 (0.0%) |
| 5 or more Children | 0 (0.0%) | 0 (0.0%) |
| Total | 0 (0.0%) | 4 (14.8%) |
Income Below Poverty Among Married-Couple vs Single-Parent Households in Schoharie
The poverty data for Schoharie shows that 6 of the married-couple family households (4.2%) and 4 of the single-parent households (6.2%) are living below the poverty level. Within the married-couple family households, those with 3 or 4 children have the highest poverty rate, with 4 households (7.3%) falling below the poverty line. Among the single-parent households, those with 1 or 2 children have the highest poverty rate, with 4 household (9.1%) living below poverty.
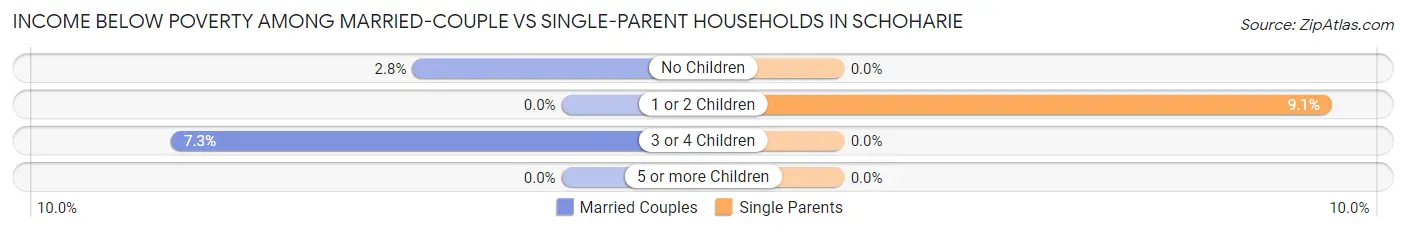
| Children | Married-Couple Families | Single-Parent Households |
| No Children | 2 (2.8%) | 0 (0.0%) |
| 1 or 2 Children | 0 (0.0%) | 4 (9.1%) |
| 3 or 4 Children | 4 (7.3%) | 0 (0.0%) |
| 5 or more Children | 0 (0.0%) | 0 (0.0%) |
| Total | 6 (4.2%) | 4 (6.2%) |
Race in Schoharie
The most populous races in Schoharie are White / Caucasian (725 | 75.8%), Two or more Races (146 | 15.3%), and Asian (52 | 5.4%).
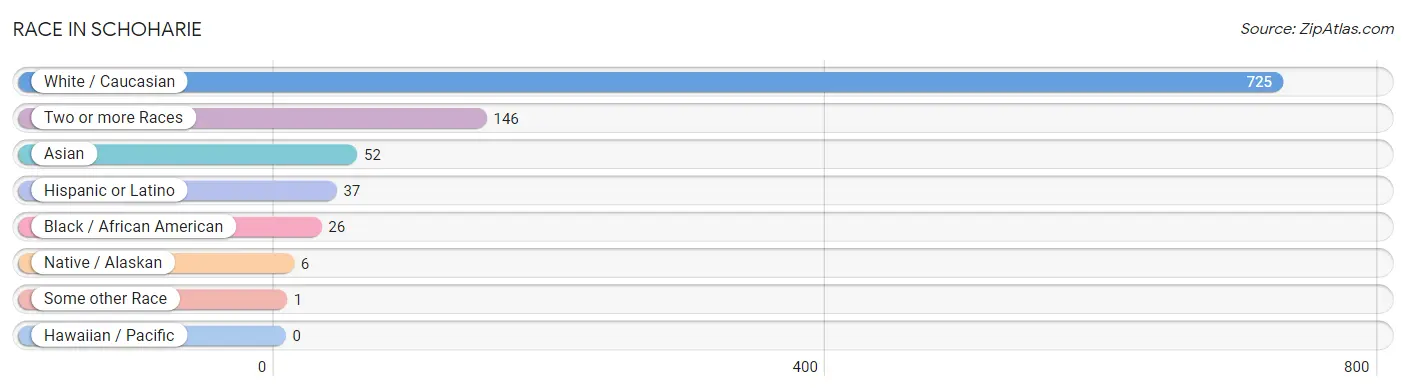
| Race | # Population | % Population |
| Asian | 52 | 5.4% |
| Black / African American | 26 | 2.7% |
| Hawaiian / Pacific | 0 | 0.0% |
| Hispanic or Latino | 37 | 3.9% |
| Native / Alaskan | 6 | 0.6% |
| White / Caucasian | 725 | 75.8% |
| Two or more Races | 146 | 15.3% |
| Some other Race | 1 | 0.1% |
| Total | 956 | 100.0% |
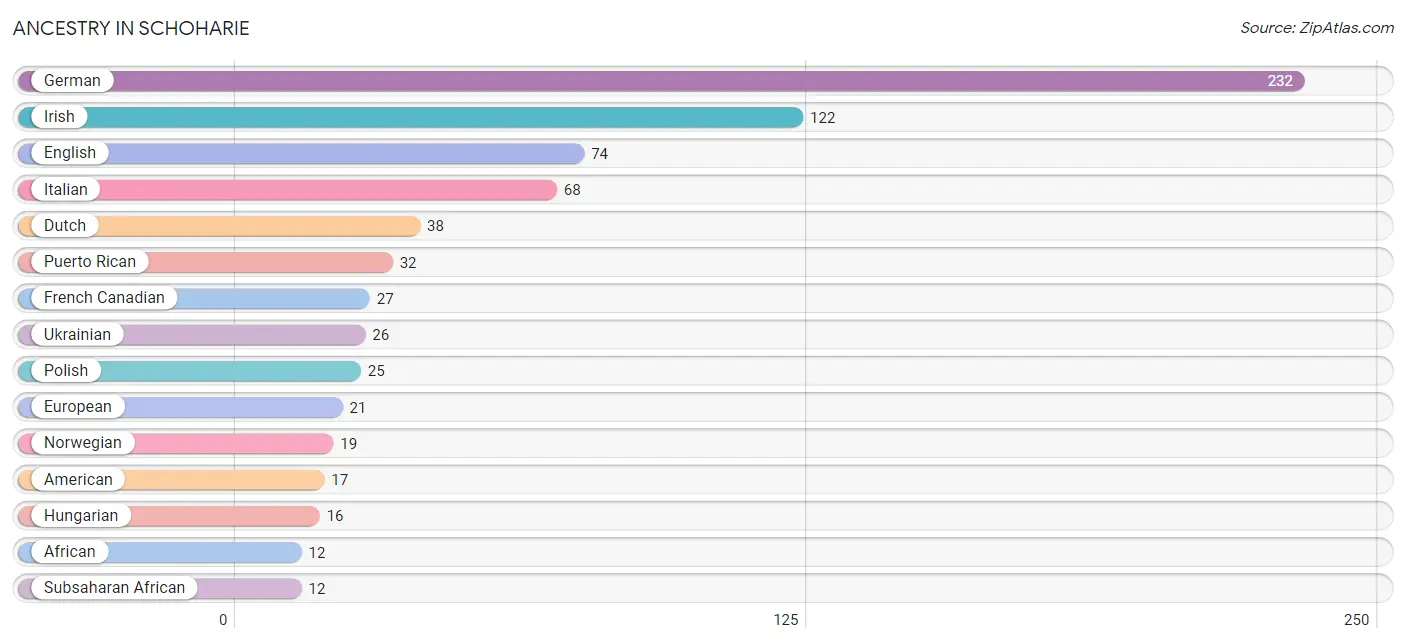
Ancestry in Schoharie
The most populous ancestries reported in Schoharie are German (232 | 24.3%), Irish (122 | 12.8%), English (74 | 7.7%), Italian (68 | 7.1%), and Dutch (38 | 4.0%), together accounting for 55.8% of all Schoharie residents.
| Ancestry | # Population | % Population |
| African | 12 | 1.3% |
| American | 17 | 1.8% |
| Arab | 7 | 0.7% |
| Austrian | 2 | 0.2% |
| British | 8 | 0.8% |
| Central American Indian | 8 | 0.8% |
| Danish | 3 | 0.3% |
| Dutch | 38 | 4.0% |
| Eastern European | 6 | 0.6% |
| English | 74 | 7.7% |
| European | 21 | 2.2% |
| French | 3 | 0.3% |
| French Canadian | 27 | 2.8% |
| German | 232 | 24.3% |
| Hungarian | 16 | 1.7% |
| Irish | 122 | 12.8% |
| Italian | 68 | 7.1% |
| Jamaican | 4 | 0.4% |
| Korean | 3 | 0.3% |
| Latvian | 9 | 0.9% |
| Mexican | 4 | 0.4% |
| Northern European | 1 | 0.1% |
| Norwegian | 19 | 2.0% |
| Palestinian | 7 | 0.7% |
| Polish | 25 | 2.6% |
| Puerto Rican | 32 | 3.4% |
| Russian | 3 | 0.3% |
| Scandinavian | 9 | 0.9% |
| Scottish | 5 | 0.5% |
| Slavic | 2 | 0.2% |
| Subsaharan African | 12 | 1.3% |
| Ukrainian | 26 | 2.7% |
| Vietnamese | 4 | 0.4% |
| Welsh | 5 | 0.5% |
| West Indian | 8 | 0.8% | View All 35 Rows |
Immigrants in Schoharie
The most numerous immigrant groups reported in Schoharie came from Asia (53 | 5.5%), South Central Asia (39 | 4.1%), Pakistan (36 | 3.8%), Western Asia (11 | 1.1%), and Saudi Arabia (9 | 0.9%), together accounting for 15.5% of all Schoharie residents.
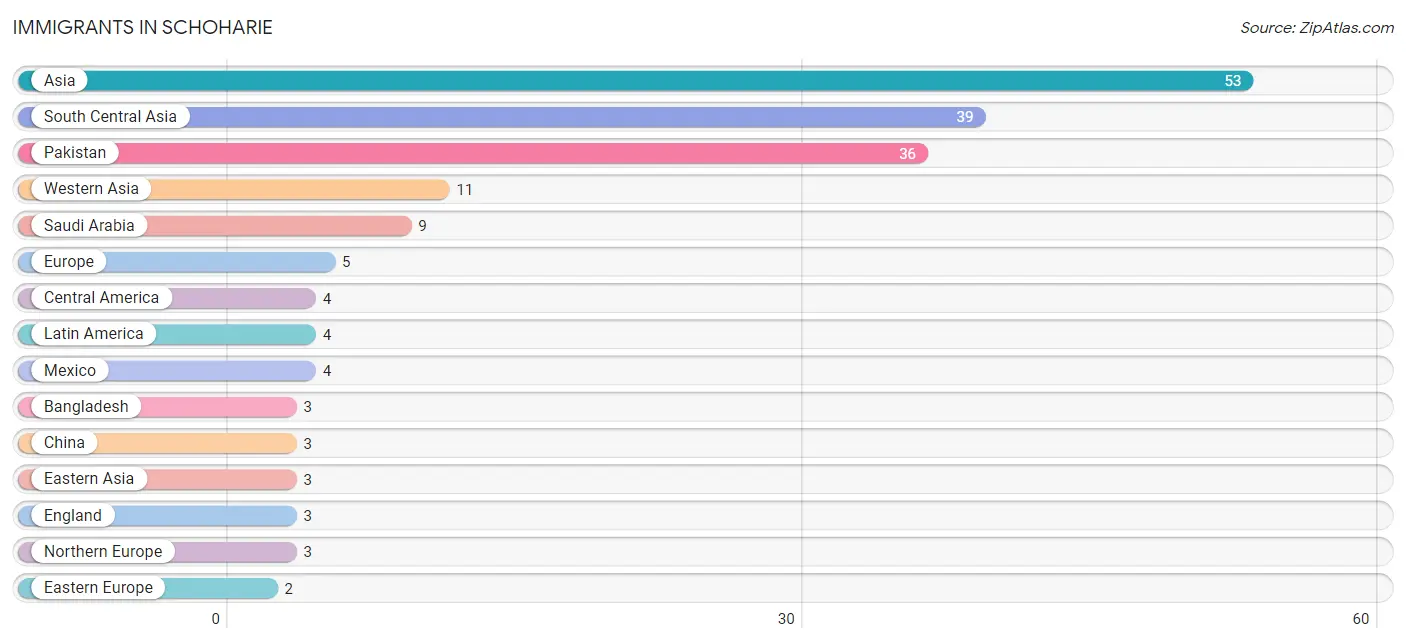
| Immigration Origin | # Population | % Population |
| Asia | 53 | 5.5% |
| Bangladesh | 3 | 0.3% |
| Central America | 4 | 0.4% |
| China | 3 | 0.3% |
| Eastern Asia | 3 | 0.3% |
| Eastern Europe | 2 | 0.2% |
| England | 3 | 0.3% |
| Europe | 5 | 0.5% |
| Israel | 2 | 0.2% |
| Latin America | 4 | 0.4% |
| Mexico | 4 | 0.4% |
| Northern Europe | 3 | 0.3% |
| Pakistan | 36 | 3.8% |
| Saudi Arabia | 9 | 0.9% |
| South Central Asia | 39 | 4.1% |
| Western Asia | 11 | 1.1% | View All 16 Rows |
Sex and Age in Schoharie
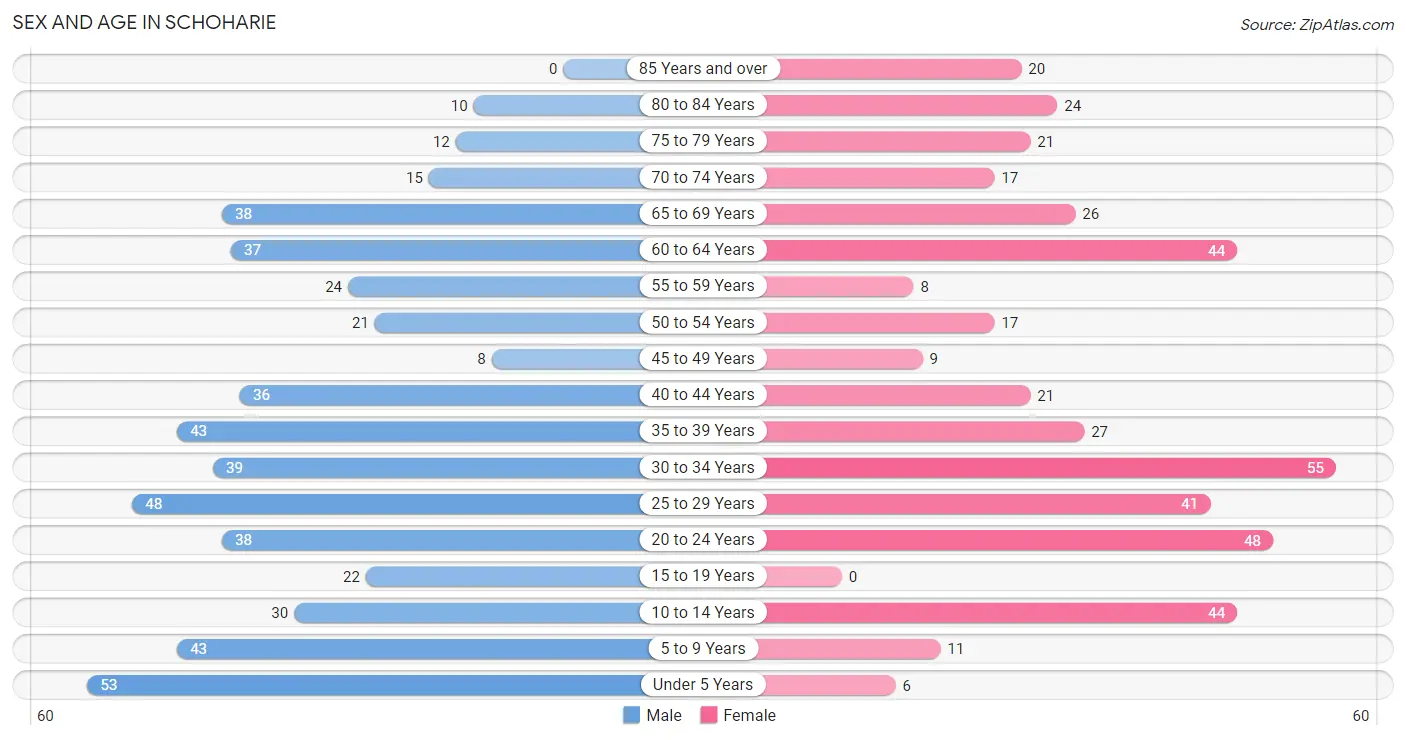
Sex and Age in Schoharie
The most populous age groups in Schoharie are Under 5 Years (53 | 10.2%) for men and 30 to 34 Years (55 | 12.5%) for women.
| Age Bracket | Male | Female |
| Under 5 Years | 53 (10.2%) | 6 (1.4%) |
| 5 to 9 Years | 43 (8.3%) | 11 (2.5%) |
| 10 to 14 Years | 30 (5.8%) | 44 (10.0%) |
| 15 to 19 Years | 22 (4.3%) | 0 (0.0%) |
| 20 to 24 Years | 38 (7.3%) | 48 (10.9%) |
| 25 to 29 Years | 48 (9.3%) | 41 (9.3%) |
| 30 to 34 Years | 39 (7.5%) | 55 (12.5%) |
| 35 to 39 Years | 43 (8.3%) | 27 (6.1%) |
| 40 to 44 Years | 36 (7.0%) | 21 (4.8%) |
| 45 to 49 Years | 8 (1.5%) | 9 (2.1%) |
| 50 to 54 Years | 21 (4.1%) | 17 (3.9%) |
| 55 to 59 Years | 24 (4.6%) | 8 (1.8%) |
| 60 to 64 Years | 37 (7.2%) | 44 (10.0%) |
| 65 to 69 Years | 38 (7.3%) | 26 (5.9%) |
| 70 to 74 Years | 15 (2.9%) | 17 (3.9%) |
| 75 to 79 Years | 12 (2.3%) | 21 (4.8%) |
| 80 to 84 Years | 10 (1.9%) | 24 (5.5%) |
| 85 Years and over | 0 (0.0%) | 20 (4.6%) |
| Total | 517 (100.0%) | 439 (100.0%) |
Families and Households in Schoharie
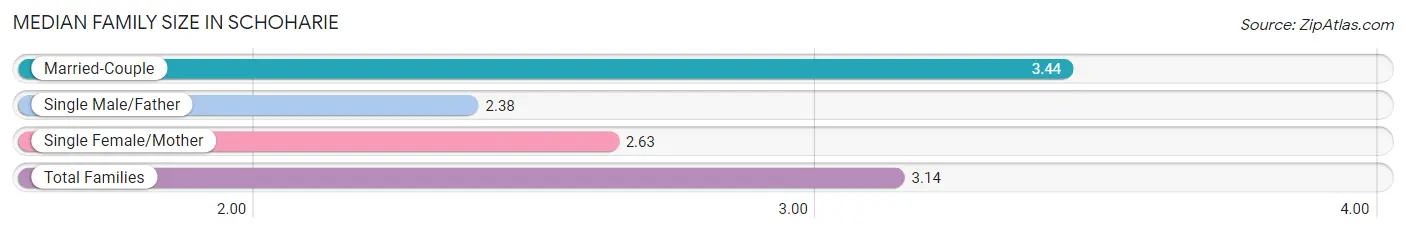
Median Family Size in Schoharie
The median family size in Schoharie is 3.14 persons per family, with married-couple families (142 | 68.9%) accounting for the largest median family size of 3.44 persons per family. On the other hand, single male/father families (37 | 18.0%) represent the smallest median family size with 2.38 persons per family.
| Family Type | # Families | Family Size |
| Married-Couple | 142 (68.9%) | 3.44 |
| Single Male/Father | 37 (18.0%) | 2.38 |
| Single Female/Mother | 27 (13.1%) | 2.63 |
| Total Families | 206 (100.0%) | 3.14 |
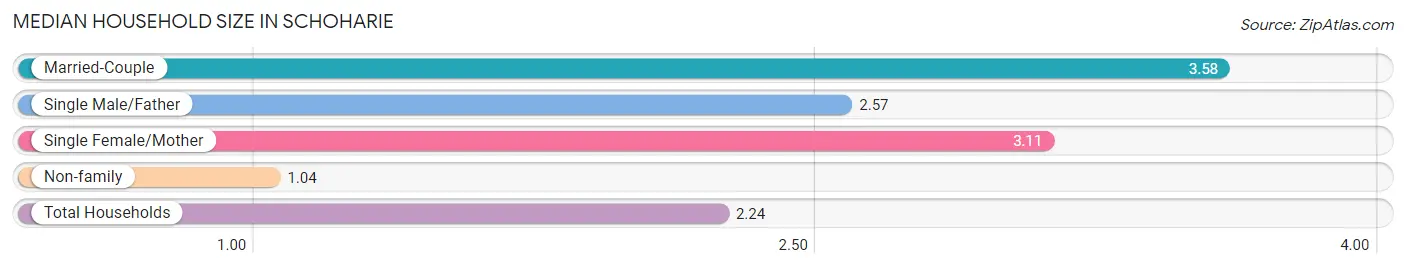
Median Household Size in Schoharie
The median household size in Schoharie is 2.24 persons per household, with married-couple households (142 | 36.1%) accounting for the largest median household size of 3.58 persons per household. non-family households (187 | 47.6%) represent the smallest median household size with 1.04 persons per household.
| Household Type | # Households | Household Size |
| Married-Couple | 142 (36.1%) | 3.58 |
| Single Male/Father | 37 (9.4%) | 2.57 |
| Single Female/Mother | 27 (6.9%) | 3.11 |
| Non-family | 187 (47.6%) | 1.04 |
| Total Households | 393 (100.0%) | 2.24 |
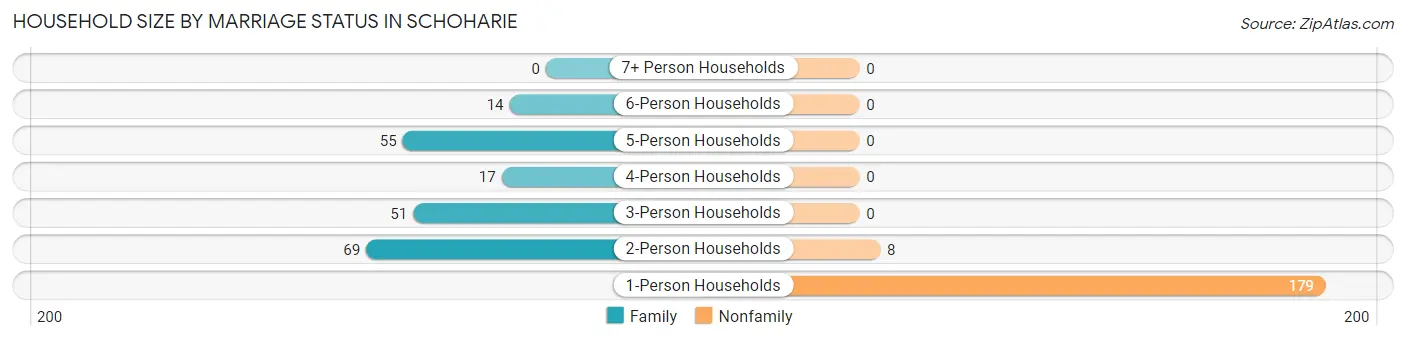
Household Size by Marriage Status in Schoharie
Out of a total of 393 households in Schoharie, 206 (52.4%) are family households, while 187 (47.6%) are nonfamily households. The most numerous type of family households are 2-person households, comprising 69, and the most common type of nonfamily households are 1-person households, comprising 179.
| Household Size | Family Households | Nonfamily Households |
| 1-Person Households | - | 179 (45.6%) |
| 2-Person Households | 69 (17.6%) | 8 (2.0%) |
| 3-Person Households | 51 (13.0%) | 0 (0.0%) |
| 4-Person Households | 17 (4.3%) | 0 (0.0%) |
| 5-Person Households | 55 (14.0%) | 0 (0.0%) |
| 6-Person Households | 14 (3.6%) | 0 (0.0%) |
| 7+ Person Households | 0 (0.0%) | 0 (0.0%) |
| Total | 206 (52.4%) | 187 (47.6%) |
Female Fertility in Schoharie
Fertility by Age in Schoharie
Average fertility rate in Schoharie is 160.0 births per 1,000 women. Women in the age bracket of 20 to 34 years have the highest fertility rate with 229.0 births per 1,000 women. Women in the age bracket of 20 to 34 years acount for 100.0% of all women with births.
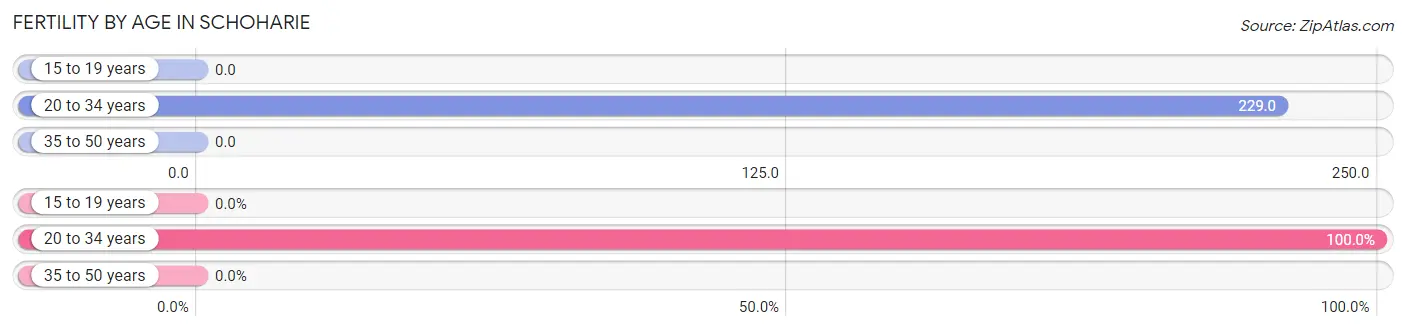
| Age Bracket | Women with Births | Births / 1,000 Women |
| 15 to 19 years | 0 (0.0%) | 0.0 |
| 20 to 34 years | 33 (100.0%) | 229.0 |
| 35 to 50 years | 0 (0.0%) | 0.0 |
| Total | 33 (100.0%) | 160.0 |
Fertility by Age by Marriage Status in Schoharie
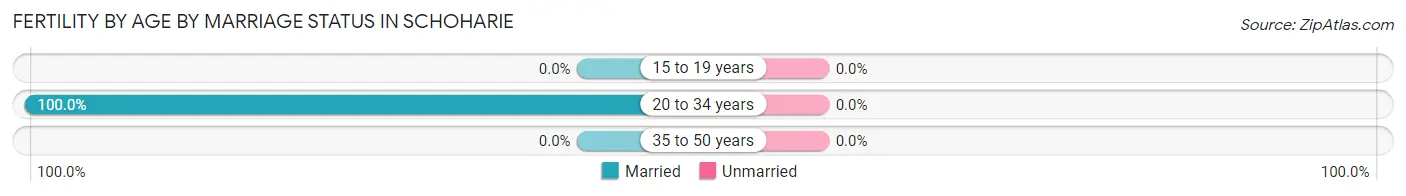
| Age Bracket | Married | Unmarried |
| 15 to 19 years | 0 (0.0%) | 0 (0.0%) |
| 20 to 34 years | 33 (100.0%) | 0 (0.0%) |
| 35 to 50 years | 0 (0.0%) | 0 (0.0%) |
| Total | 33 (100.0%) | 0 (0.0%) |
Fertility by Education in Schoharie
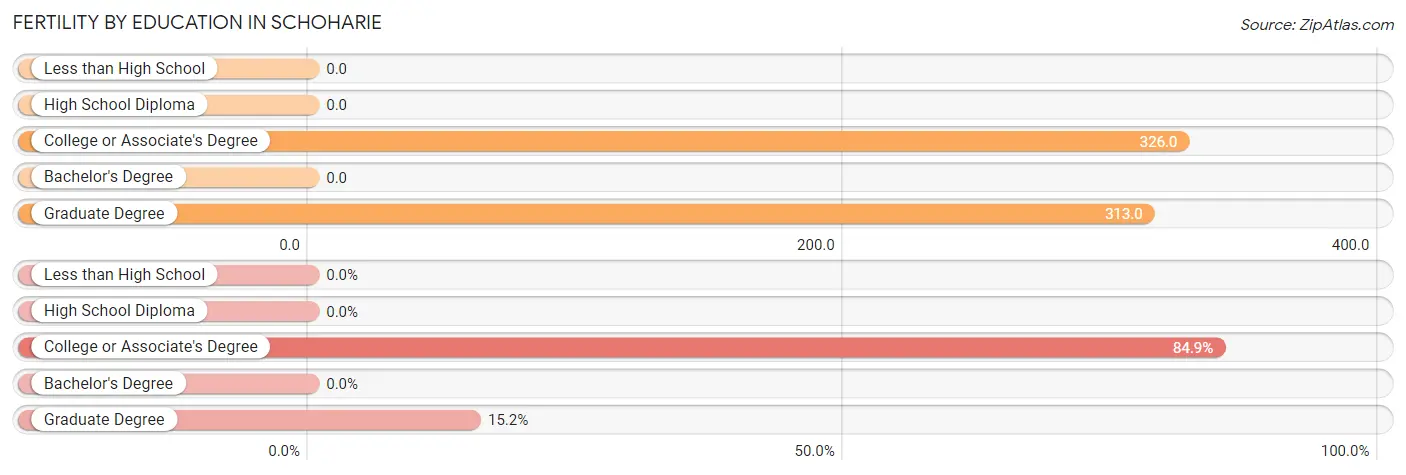
| Educational Attainment | Women with Births | Births / 1,000 Women |
| Less than High School | 0 (0.0%) | 0.0 |
| High School Diploma | 0 (0.0%) | 0.0 |
| College or Associate's Degree | 28 (84.9%) | 326.0 |
| Bachelor's Degree | 0 (0.0%) | 0.0 |
| Graduate Degree | 5 (15.1%) | 313.0 |
| Total | 33 (100.0%) | 160.0 |
Fertility by Education by Marriage Status in Schoharie
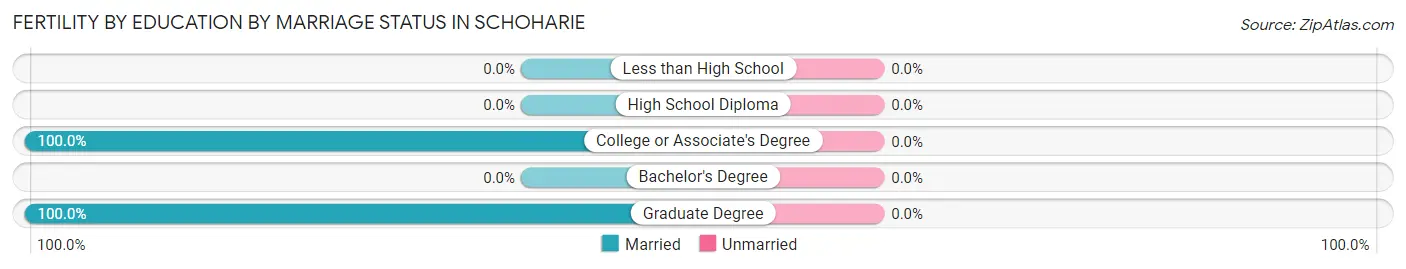
| Educational Attainment | Married | Unmarried |
| Less than High School | 0 (0.0%) | 0 (0.0%) |
| High School Diploma | 0 (0.0%) | 0 (0.0%) |
| College or Associate's Degree | 28 (100.0%) | 0 (0.0%) |
| Bachelor's Degree | 0 (0.0%) | 0 (0.0%) |
| Graduate Degree | 5 (100.0%) | 0 (0.0%) |
| Total | 33 (100.0%) | 0 (0.0%) |
Employment Characteristics in Schoharie
Employment by Class of Employer in Schoharie
Among the 339 employed individuals in Schoharie, private company employees (205 | 60.5%), local government employees (58 | 17.1%), and state government employees (30 | 8.8%) make up the most common classes of employment.
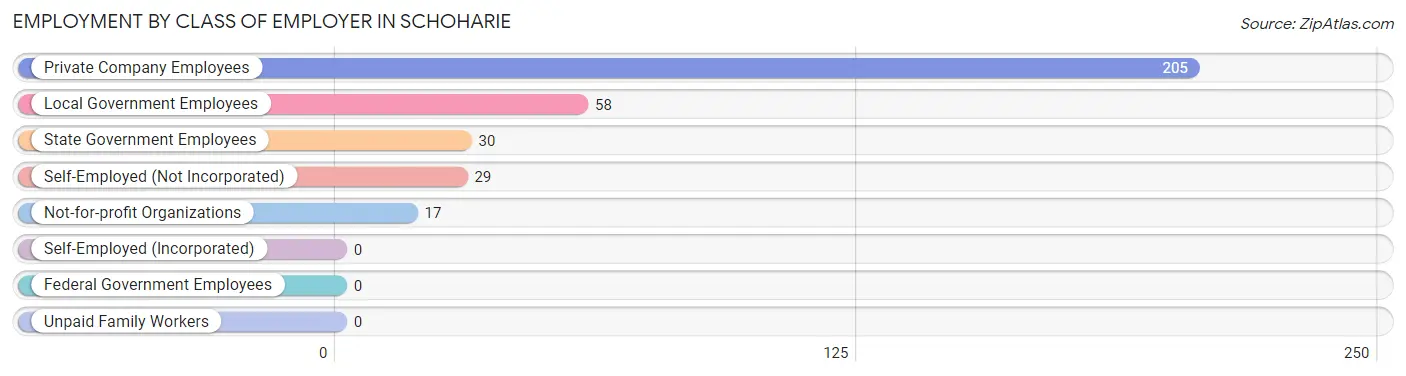
| Employer Class | # Employees | % Employees |
| Private Company Employees | 205 | 60.5% |
| Self-Employed (Incorporated) | 0 | 0.0% |
| Self-Employed (Not Incorporated) | 29 | 8.6% |
| Not-for-profit Organizations | 17 | 5.0% |
| Local Government Employees | 58 | 17.1% |
| State Government Employees | 30 | 8.8% |
| Federal Government Employees | 0 | 0.0% |
| Unpaid Family Workers | 0 | 0.0% |
| Total | 339 | 100.0% |
Employment Status by Age in Schoharie
According to the labor force statistics for Schoharie, out of the total population over 16 years of age (753), 47.0% or 354 individuals are in the labor force, with 3.4% or 12 of them unemployed. The age group with the highest labor force participation rate is 20 to 24 years, with 89.5% or 77 individuals in the labor force. Within the labor force, the 35 to 44 years age range has the highest percentage of unemployed individuals, with 12.7% or 9 of them being unemployed.
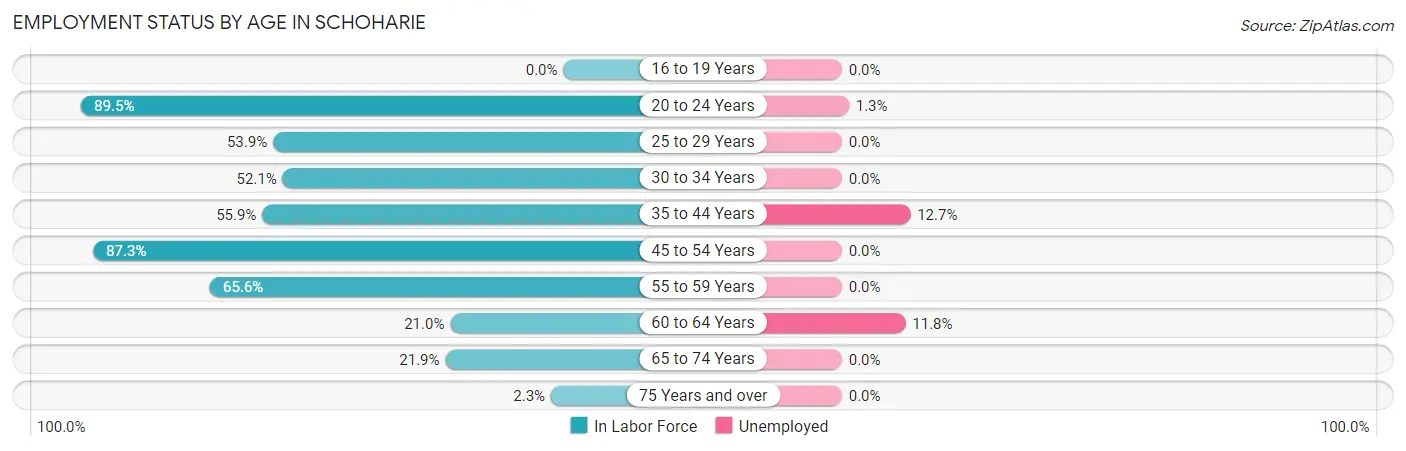
| Age Bracket | In Labor Force | Unemployed |
| 16 to 19 Years | 0 (0.0%) | 0 (0.0%) |
| 20 to 24 Years | 77 (89.5%) | 1 (1.3%) |
| 25 to 29 Years | 48 (53.9%) | 0 (0.0%) |
| 30 to 34 Years | 49 (52.1%) | 0 (0.0%) |
| 35 to 44 Years | 71 (55.9%) | 9 (12.7%) |
| 45 to 54 Years | 48 (87.3%) | 0 (0.0%) |
| 55 to 59 Years | 21 (65.6%) | 0 (0.0%) |
| 60 to 64 Years | 17 (21.0%) | 2 (11.8%) |
| 65 to 74 Years | 21 (21.9%) | 0 (0.0%) |
| 75 Years and over | 2 (2.3%) | 0 (0.0%) |
| Total | 354 (47.0%) | 12 (3.4%) |
Employment Status by Educational Attainment in Schoharie
According to labor force statistics for Schoharie, 53.1% of individuals (254) out of the total population between 25 and 64 years of age (478) are in the labor force, with 4.3% or 11 of them being unemployed. The group with the highest labor force participation rate are those with the educational attainment of bachelor's degree or higher, with 75.9% or 101 individuals in the labor force. Within the labor force, individuals with college / associate degree education have the highest percentage of unemployment, with 8.0% or 9 of them being unemployed.
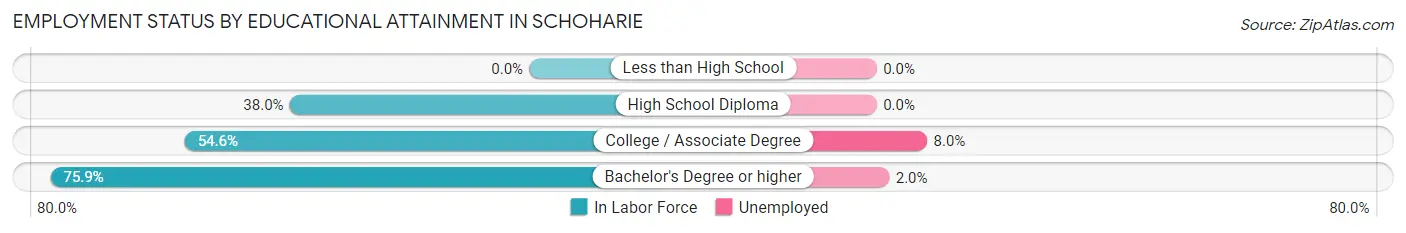
| Educational Attainment | In Labor Force | Unemployed |
| Less than High School | 0 (0.0%) | 0 (0.0%) |
| High School Diploma | 41 (38.0%) | 0 (0.0%) |
| College / Associate Degree | 112 (54.6%) | 16 (8.0%) |
| Bachelor's Degree or higher | 101 (75.9%) | 3 (2.0%) |
| Total | 254 (53.1%) | 21 (4.3%) |
Employment Occupations by Sex in Schoharie
Management, Business, Science and Arts Occupations
The most common Management, Business, Science and Arts occupations in Schoharie are Community & Social Service (61 | 17.8%), Management (46 | 13.5%), Computers, Engineering & Science (21 | 6.1%), Education Instruction & Library (21 | 6.1%), and Legal Services & Support (19 | 5.6%).
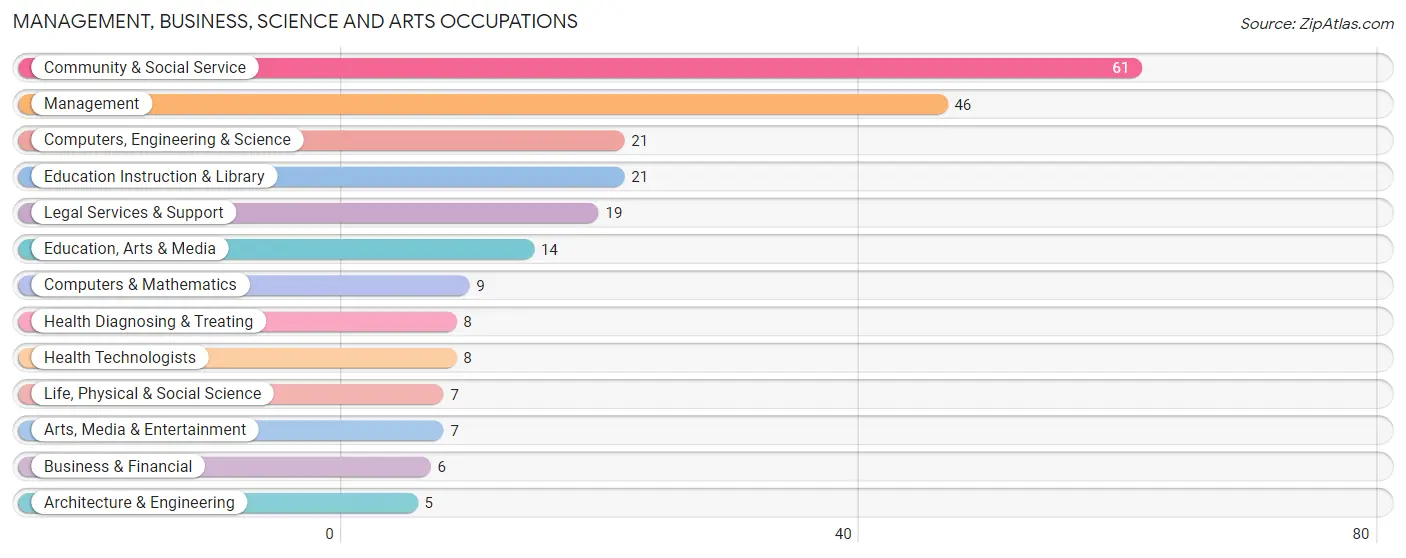
Management, Business, Science and Arts Occupations by Sex
Within the Management, Business, Science and Arts occupations in Schoharie, the most male-oriented occupations are Business & Financial (100.0%), Life, Physical & Social Science (100.0%), and Legal Services & Support (100.0%), while the most female-oriented occupations are Education, Arts & Media (100.0%), Education Instruction & Library (100.0%), and Health Diagnosing & Treating (100.0%).
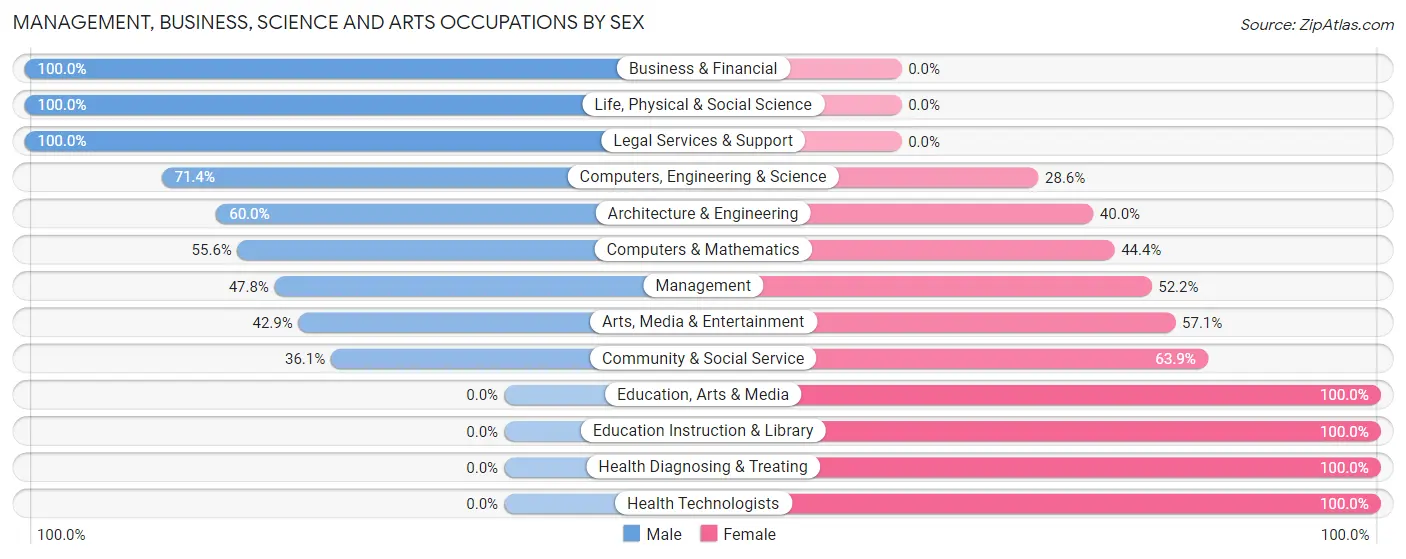
| Occupation | Male | Female |
| Management | 22 (47.8%) | 24 (52.2%) |
| Business & Financial | 6 (100.0%) | 0 (0.0%) |
| Computers, Engineering & Science | 15 (71.4%) | 6 (28.6%) |
| Computers & Mathematics | 5 (55.6%) | 4 (44.4%) |
| Architecture & Engineering | 3 (60.0%) | 2 (40.0%) |
| Life, Physical & Social Science | 7 (100.0%) | 0 (0.0%) |
| Community & Social Service | 22 (36.1%) | 39 (63.9%) |
| Education, Arts & Media | 0 (0.0%) | 14 (100.0%) |
| Legal Services & Support | 19 (100.0%) | 0 (0.0%) |
| Education Instruction & Library | 0 (0.0%) | 21 (100.0%) |
| Arts, Media & Entertainment | 3 (42.9%) | 4 (57.1%) |
| Health Diagnosing & Treating | 0 (0.0%) | 8 (100.0%) |
| Health Technologists | 0 (0.0%) | 8 (100.0%) |
| Total (Category) | 65 (45.8%) | 77 (54.2%) |
| Total (Overall) | 209 (61.1%) | 133 (38.9%) |
Services Occupations
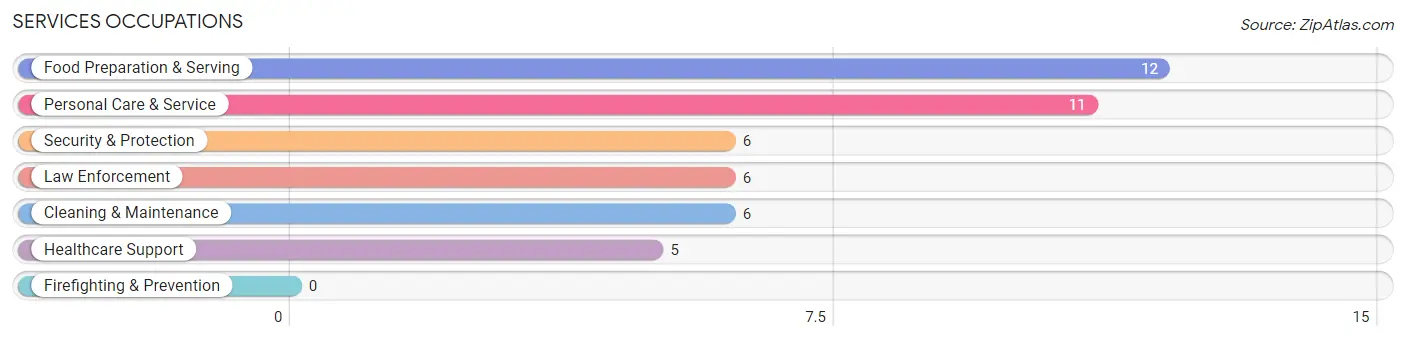
The most common Services occupations in Schoharie are Food Preparation & Serving (12 | 3.5%), Personal Care & Service (11 | 3.2%), Security & Protection (6 | 1.8%), Law Enforcement (6 | 1.8%), and Cleaning & Maintenance (6 | 1.8%).
Services Occupations by Sex
Within the Services occupations in Schoharie, the most male-oriented occupations are Security & Protection (100.0%), Law Enforcement (100.0%), and Food Preparation & Serving (100.0%), while the most female-oriented occupations are Healthcare Support (100.0%), and Personal Care & Service (63.6%).
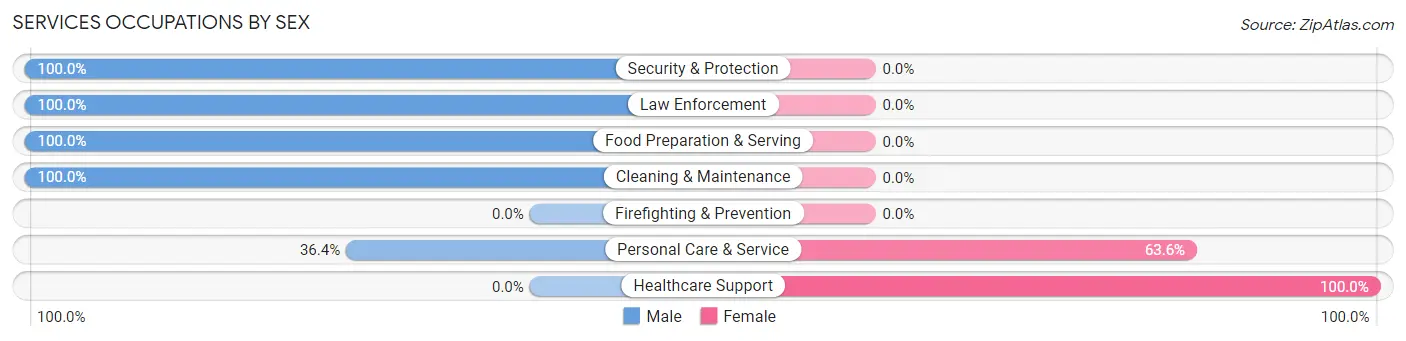
| Occupation | Male | Female |
| Healthcare Support | 0 (0.0%) | 5 (100.0%) |
| Security & Protection | 6 (100.0%) | 0 (0.0%) |
| Firefighting & Prevention | 0 (0.0%) | 0 (0.0%) |
| Law Enforcement | 6 (100.0%) | 0 (0.0%) |
| Food Preparation & Serving | 12 (100.0%) | 0 (0.0%) |
| Cleaning & Maintenance | 6 (100.0%) | 0 (0.0%) |
| Personal Care & Service | 4 (36.4%) | 7 (63.6%) |
| Total (Category) | 28 (70.0%) | 12 (30.0%) |
| Total (Overall) | 209 (61.1%) | 133 (38.9%) |
Sales and Office Occupations
The most common Sales and Office occupations in Schoharie are Office & Administration (44 | 12.9%), and Sales & Related (10 | 2.9%).

Sales and Office Occupations by Sex
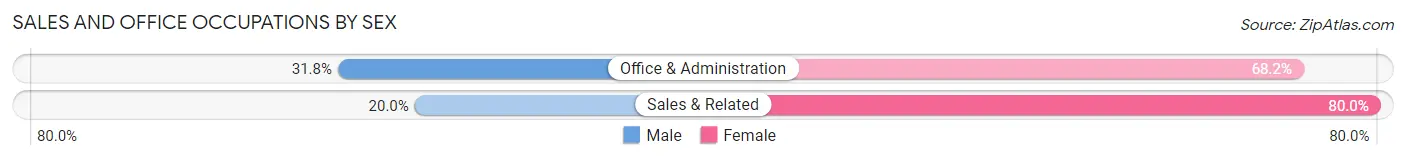
| Occupation | Male | Female |
| Sales & Related | 2 (20.0%) | 8 (80.0%) |
| Office & Administration | 14 (31.8%) | 30 (68.2%) |
| Total (Category) | 16 (29.6%) | 38 (70.4%) |
| Total (Overall) | 209 (61.1%) | 133 (38.9%) |
Natural Resources, Construction and Maintenance Occupations
The most common Natural Resources, Construction and Maintenance occupations in Schoharie are Construction & Extraction (29 | 8.5%), and Installation, Maintenance & Repair (18 | 5.3%).
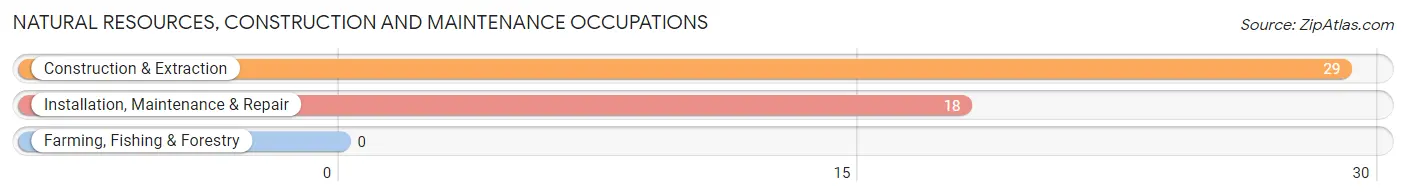
Natural Resources, Construction and Maintenance Occupations by Sex

| Occupation | Male | Female |
| Farming, Fishing & Forestry | 0 (0.0%) | 0 (0.0%) |
| Construction & Extraction | 29 (100.0%) | 0 (0.0%) |
| Installation, Maintenance & Repair | 18 (100.0%) | 0 (0.0%) |
| Total (Category) | 47 (100.0%) | 0 (0.0%) |
| Total (Overall) | 209 (61.1%) | 133 (38.9%) |
Production, Transportation and Moving Occupations
The most common Production, Transportation and Moving occupations in Schoharie are Production (45 | 13.2%), Material Moving (10 | 2.9%), and Transportation (4 | 1.2%).
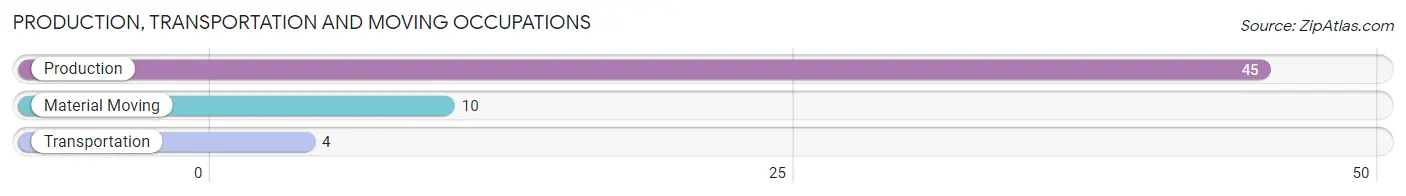
Production, Transportation and Moving Occupations by Sex
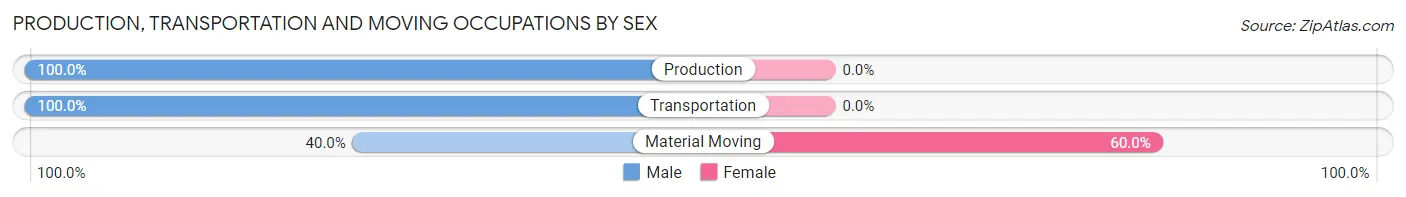
| Occupation | Male | Female |
| Production | 45 (100.0%) | 0 (0.0%) |
| Transportation | 4 (100.0%) | 0 (0.0%) |
| Material Moving | 4 (40.0%) | 6 (60.0%) |
| Total (Category) | 53 (89.8%) | 6 (10.2%) |
| Total (Overall) | 209 (61.1%) | 133 (38.9%) |
Employment Industries by Sex in Schoharie
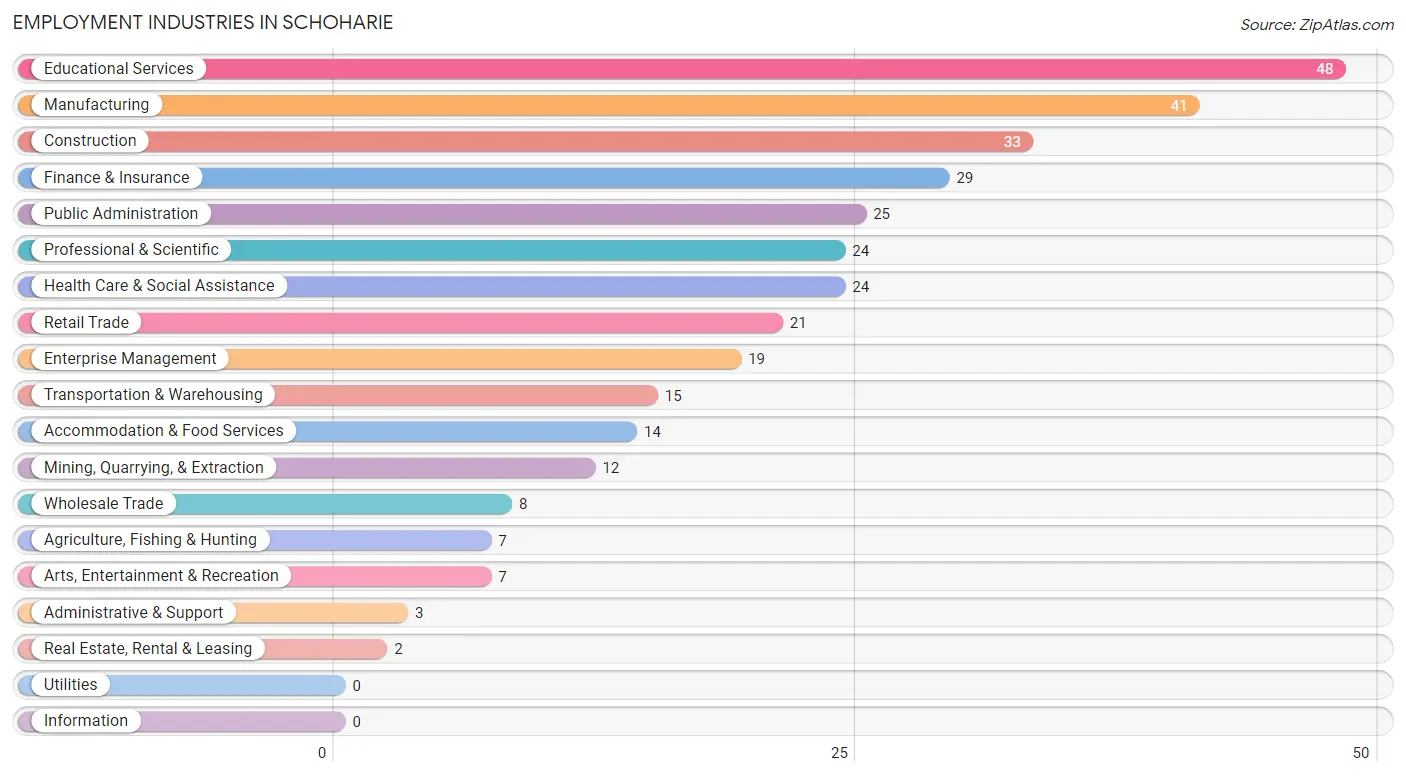
Employment Industries in Schoharie
The major employment industries in Schoharie include Educational Services (48 | 14.0%), Manufacturing (41 | 12.0%), Construction (33 | 9.7%), Finance & Insurance (29 | 8.5%), and Public Administration (25 | 7.3%).
Employment Industries by Sex in Schoharie
The Schoharie industries that see more men than women are Agriculture, Fishing & Hunting (100.0%), Mining, Quarrying, & Extraction (100.0%), and Construction (100.0%), whereas the industries that tend to have a higher number of women are Real Estate, Rental & Leasing (100.0%), Enterprise Management (100.0%), and Health Care & Social Assistance (100.0%).
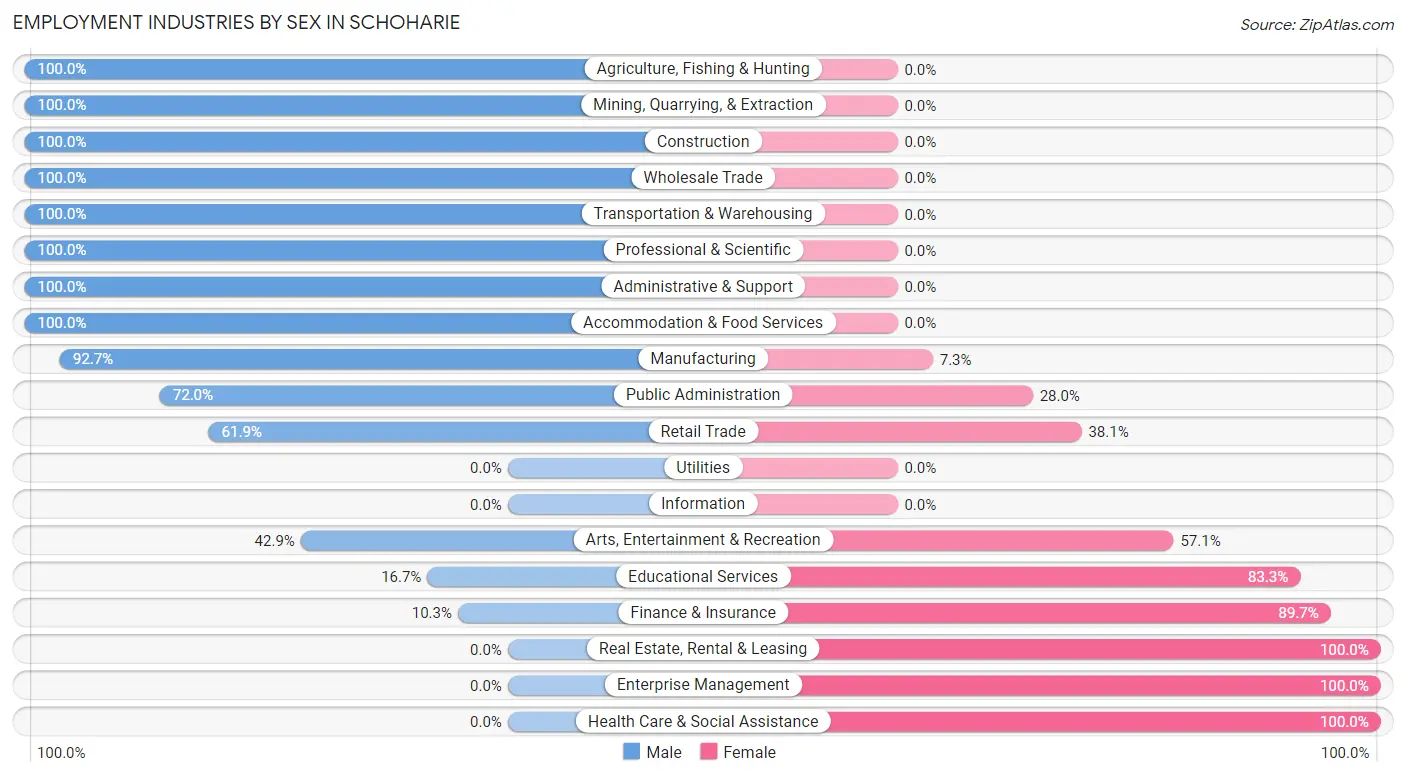
| Industry | Male | Female |
| Agriculture, Fishing & Hunting | 7 (100.0%) | 0 (0.0%) |
| Mining, Quarrying, & Extraction | 12 (100.0%) | 0 (0.0%) |
| Construction | 33 (100.0%) | 0 (0.0%) |
| Manufacturing | 38 (92.7%) | 3 (7.3%) |
| Wholesale Trade | 8 (100.0%) | 0 (0.0%) |
| Retail Trade | 13 (61.9%) | 8 (38.1%) |
| Transportation & Warehousing | 15 (100.0%) | 0 (0.0%) |
| Utilities | 0 (0.0%) | 0 (0.0%) |
| Information | 0 (0.0%) | 0 (0.0%) |
| Finance & Insurance | 3 (10.3%) | 26 (89.7%) |
| Real Estate, Rental & Leasing | 0 (0.0%) | 2 (100.0%) |
| Professional & Scientific | 24 (100.0%) | 0 (0.0%) |
| Enterprise Management | 0 (0.0%) | 19 (100.0%) |
| Administrative & Support | 3 (100.0%) | 0 (0.0%) |
| Educational Services | 8 (16.7%) | 40 (83.3%) |
| Health Care & Social Assistance | 0 (0.0%) | 24 (100.0%) |
| Arts, Entertainment & Recreation | 3 (42.9%) | 4 (57.1%) |
| Accommodation & Food Services | 14 (100.0%) | 0 (0.0%) |
| Public Administration | 18 (72.0%) | 7 (28.0%) |
| Total | 209 (61.1%) | 133 (38.9%) |
Education in Schoharie
School Enrollment in Schoharie
The most common levels of schooling among the 174 students in Schoharie are middle school (79 | 45.4%), elementary school (26 | 14.9%), and kindergarten (24 | 13.8%).
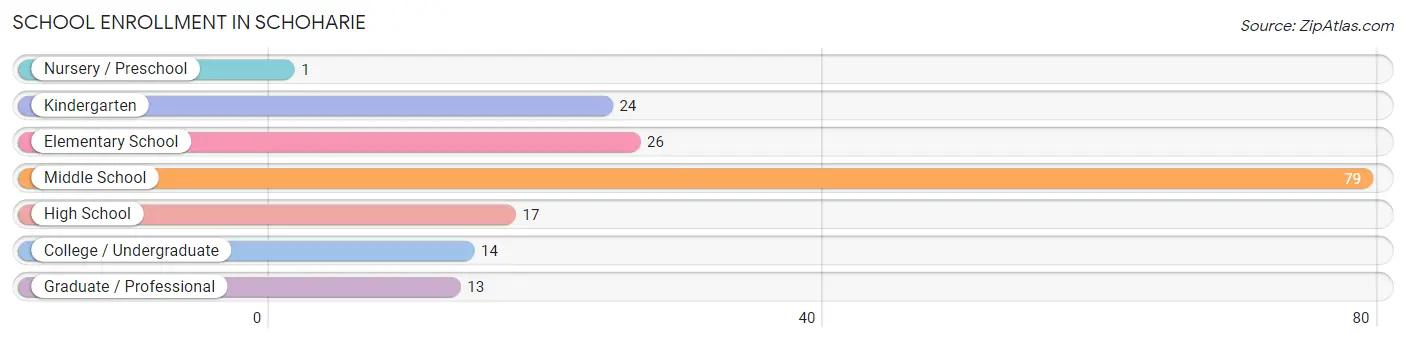
| School Level | # Students | % Students |
| Nursery / Preschool | 1 | 0.6% |
| Kindergarten | 24 | 13.8% |
| Elementary School | 26 | 14.9% |
| Middle School | 79 | 45.4% |
| High School | 17 | 9.8% |
| College / Undergraduate | 14 | 8.1% |
| Graduate / Professional | 13 | 7.5% |
| Total | 174 | 100.0% |
School Enrollment by Age by Funding Source in Schoharie
Out of a total of 174 students who are enrolled in schools in Schoharie, 26 (14.9%) attend a private institution, while the remaining 148 (85.1%) are enrolled in public schools. The age group of 20 to 24 year olds has the highest likelihood of being enrolled in private schools, with 14 (51.8% in the age bracket) enrolled. Conversely, the age group of 10 to 14 year olds has the lowest likelihood of being enrolled in a private school, with 74 (100.0% in the age bracket) attending a public institution.
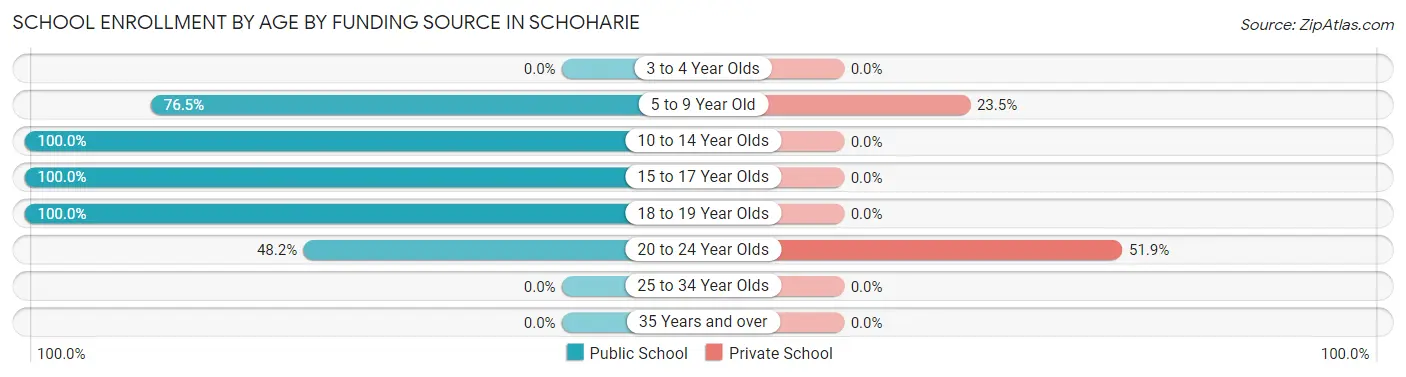
| Age Bracket | Public School | Private School |
| 3 to 4 Year Olds | 0 (0.0%) | 0 (0.0%) |
| 5 to 9 Year Old | 39 (76.5%) | 12 (23.5%) |
| 10 to 14 Year Olds | 74 (100.0%) | 0 (0.0%) |
| 15 to 17 Year Olds | 21 (100.0%) | 0 (0.0%) |
| 18 to 19 Year Olds | 1 (100.0%) | 0 (0.0%) |
| 20 to 24 Year Olds | 13 (48.1%) | 14 (51.8%) |
| 25 to 34 Year Olds | 0 (0.0%) | 0 (0.0%) |
| 35 Years and over | 0 (0.0%) | 0 (0.0%) |
| Total | 148 (85.1%) | 26 (14.9%) |
Educational Attainment by Field of Study in Schoharie
Business (48 | 22.1%), education (39 | 18.0%), computers & mathematics (23 | 10.6%), bio, nature & agricultural (22 | 10.1%), and social sciences (17 | 7.8%) are the most common fields of study among 217 individuals in Schoharie who have obtained a bachelor's degree or higher.
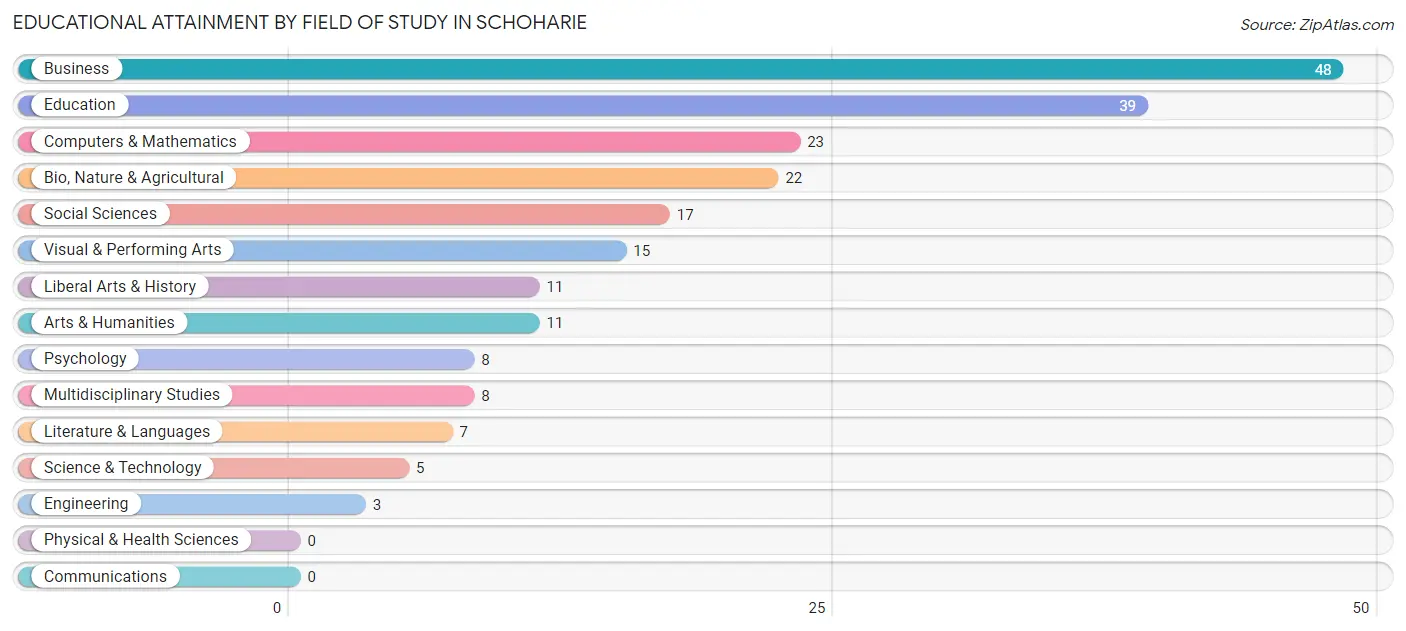
| Field of Study | # Graduates | % Graduates |
| Computers & Mathematics | 23 | 10.6% |
| Bio, Nature & Agricultural | 22 | 10.1% |
| Physical & Health Sciences | 0 | 0.0% |
| Psychology | 8 | 3.7% |
| Social Sciences | 17 | 7.8% |
| Engineering | 3 | 1.4% |
| Multidisciplinary Studies | 8 | 3.7% |
| Science & Technology | 5 | 2.3% |
| Business | 48 | 22.1% |
| Education | 39 | 18.0% |
| Literature & Languages | 7 | 3.2% |
| Liberal Arts & History | 11 | 5.1% |
| Visual & Performing Arts | 15 | 6.9% |
| Communications | 0 | 0.0% |
| Arts & Humanities | 11 | 5.1% |
| Total | 217 | 100.0% |
Transportation & Commute in Schoharie
Vehicle Availability by Sex in Schoharie
The most prevalent vehicle ownership categories in Schoharie are males with 2 vehicles (94, accounting for 45.0%) and females with 2 vehicles (26, making up 72.9%).
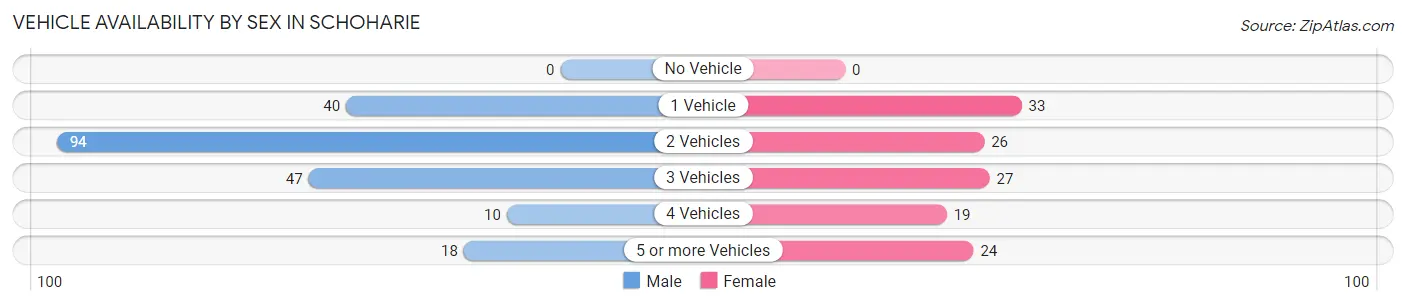
| Vehicles Available | Male | Female |
| No Vehicle | 0 (0.0%) | 0 (0.0%) |
| 1 Vehicle | 40 (19.1%) | 33 (25.6%) |
| 2 Vehicles | 94 (45.0%) | 26 (20.2%) |
| 3 Vehicles | 47 (22.5%) | 27 (20.9%) |
| 4 Vehicles | 10 (4.8%) | 19 (14.7%) |
| 5 or more Vehicles | 18 (8.6%) | 24 (18.6%) |
| Total | 209 (100.0%) | 129 (100.0%) |
Commute Time in Schoharie
The most frequently occuring commute durations in Schoharie are 30 to 34 minutes (69 commuters, 21.8%), 15 to 19 minutes (45 commuters, 14.2%), and 45 to 59 minutes (40 commuters, 12.6%).
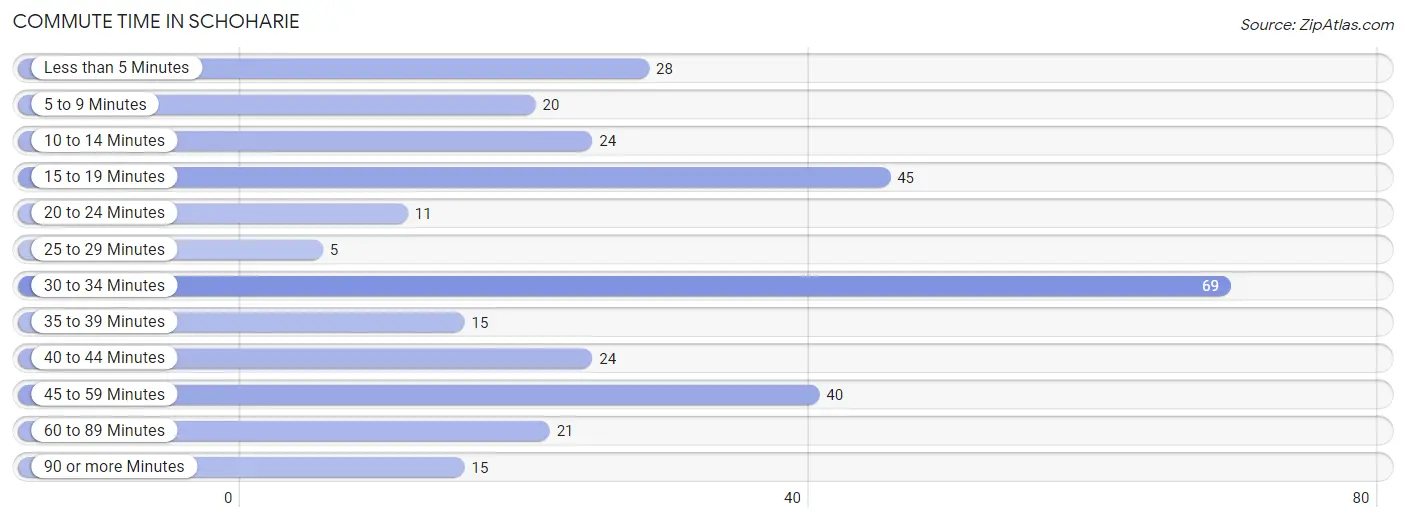
| Commute Time | # Commuters | % Commuters |
| Less than 5 Minutes | 28 | 8.8% |
| 5 to 9 Minutes | 20 | 6.3% |
| 10 to 14 Minutes | 24 | 7.6% |
| 15 to 19 Minutes | 45 | 14.2% |
| 20 to 24 Minutes | 11 | 3.5% |
| 25 to 29 Minutes | 5 | 1.6% |
| 30 to 34 Minutes | 69 | 21.8% |
| 35 to 39 Minutes | 15 | 4.7% |
| 40 to 44 Minutes | 24 | 7.6% |
| 45 to 59 Minutes | 40 | 12.6% |
| 60 to 89 Minutes | 21 | 6.6% |
| 90 or more Minutes | 15 | 4.7% |
Commute Time by Sex in Schoharie
The most common commute times in Schoharie are 30 to 34 minutes (56 commuters, 28.3%) for males and 15 to 19 minutes (24 commuters, 20.2%) for females.
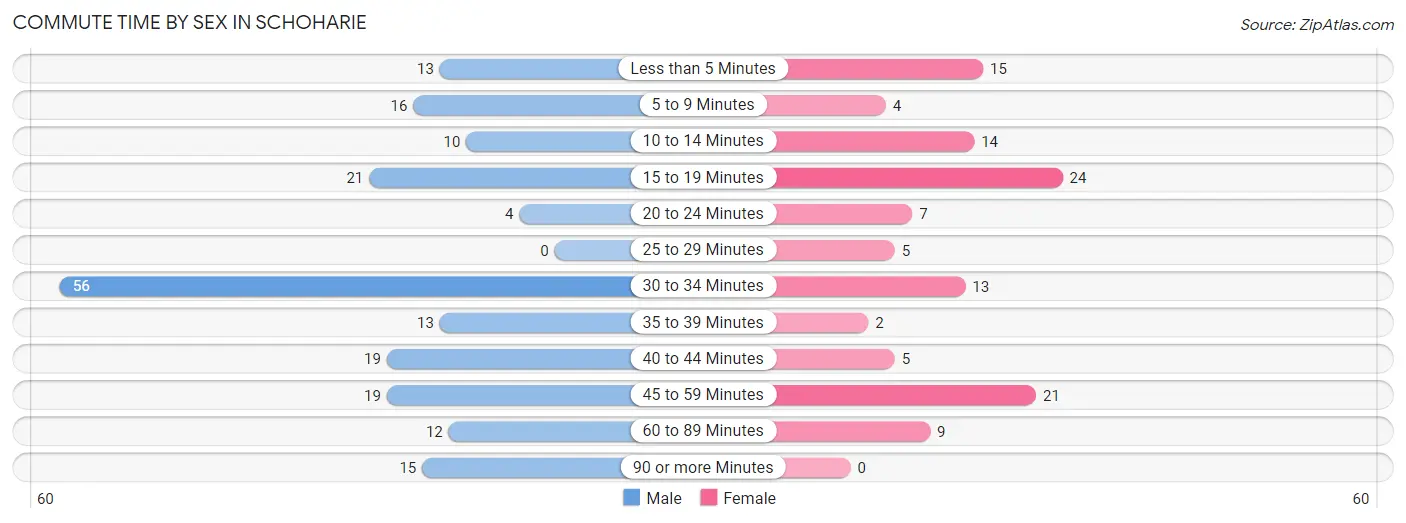
| Commute Time | Male | Female |
| Less than 5 Minutes | 13 (6.6%) | 15 (12.6%) |
| 5 to 9 Minutes | 16 (8.1%) | 4 (3.4%) |
| 10 to 14 Minutes | 10 (5.1%) | 14 (11.8%) |
| 15 to 19 Minutes | 21 (10.6%) | 24 (20.2%) |
| 20 to 24 Minutes | 4 (2.0%) | 7 (5.9%) |
| 25 to 29 Minutes | 0 (0.0%) | 5 (4.2%) |
| 30 to 34 Minutes | 56 (28.3%) | 13 (10.9%) |
| 35 to 39 Minutes | 13 (6.6%) | 2 (1.7%) |
| 40 to 44 Minutes | 19 (9.6%) | 5 (4.2%) |
| 45 to 59 Minutes | 19 (9.6%) | 21 (17.6%) |
| 60 to 89 Minutes | 12 (6.1%) | 9 (7.6%) |
| 90 or more Minutes | 15 (7.6%) | 0 (0.0%) |
Time of Departure to Work by Sex in Schoharie
The most frequent times of departure to work in Schoharie are 6:30 AM to 6:59 AM (43, 21.7%) for males and 7:00 AM to 7:29 AM (37, 31.1%) for females.
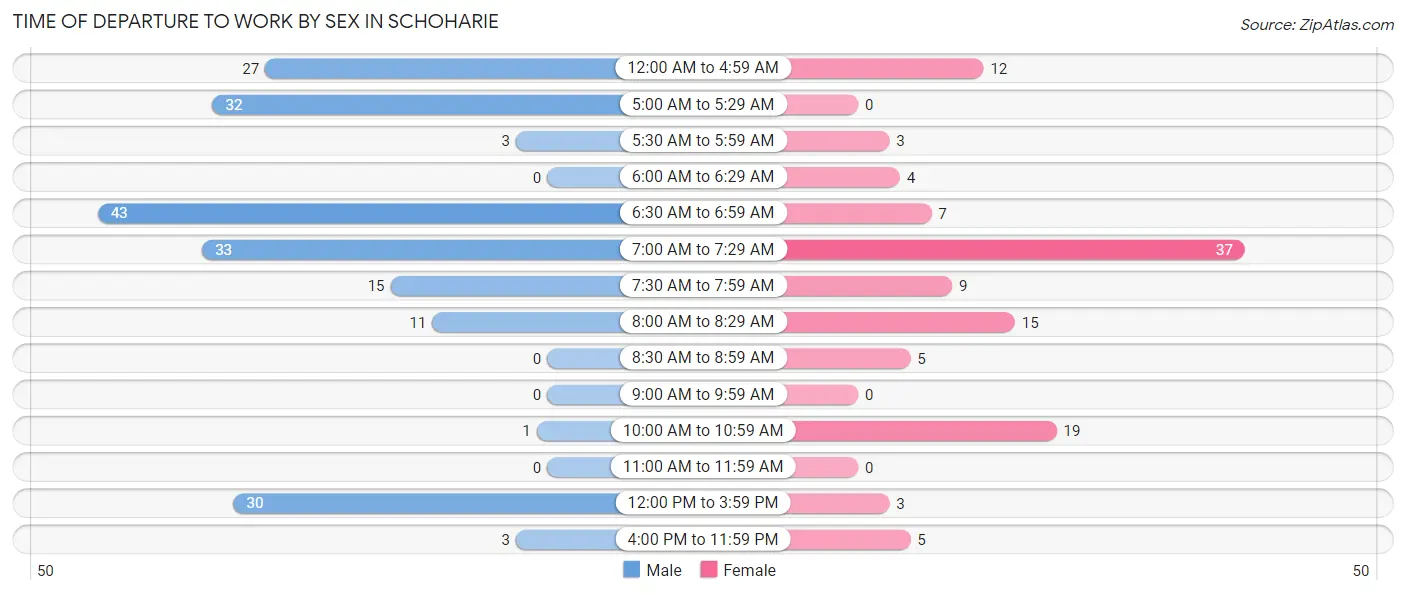
| Time of Departure | Male | Female |
| 12:00 AM to 4:59 AM | 27 (13.6%) | 12 (10.1%) |
| 5:00 AM to 5:29 AM | 32 (16.2%) | 0 (0.0%) |
| 5:30 AM to 5:59 AM | 3 (1.5%) | 3 (2.5%) |
| 6:00 AM to 6:29 AM | 0 (0.0%) | 4 (3.4%) |
| 6:30 AM to 6:59 AM | 43 (21.7%) | 7 (5.9%) |
| 7:00 AM to 7:29 AM | 33 (16.7%) | 37 (31.1%) |
| 7:30 AM to 7:59 AM | 15 (7.6%) | 9 (7.6%) |
| 8:00 AM to 8:29 AM | 11 (5.6%) | 15 (12.6%) |
| 8:30 AM to 8:59 AM | 0 (0.0%) | 5 (4.2%) |
| 9:00 AM to 9:59 AM | 0 (0.0%) | 0 (0.0%) |
| 10:00 AM to 10:59 AM | 1 (0.5%) | 19 (16.0%) |
| 11:00 AM to 11:59 AM | 0 (0.0%) | 0 (0.0%) |
| 12:00 PM to 3:59 PM | 30 (15.1%) | 3 (2.5%) |
| 4:00 PM to 11:59 PM | 3 (1.5%) | 5 (4.2%) |
| Total | 198 (100.0%) | 119 (100.0%) |
Housing Occupancy in Schoharie
Occupancy by Ownership in Schoharie
Of the total 393 dwellings in Schoharie, owner-occupied units account for 208 (52.9%), while renter-occupied units make up 185 (47.1%).
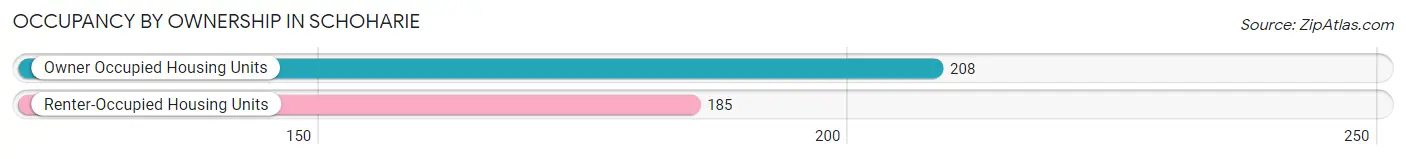
| Occupancy | # Housing Units | % Housing Units |
| Owner Occupied Housing Units | 208 | 52.9% |
| Renter-Occupied Housing Units | 185 | 47.1% |
| Total Occupied Housing Units | 393 | 100.0% |
Occupancy by Household Size in Schoharie
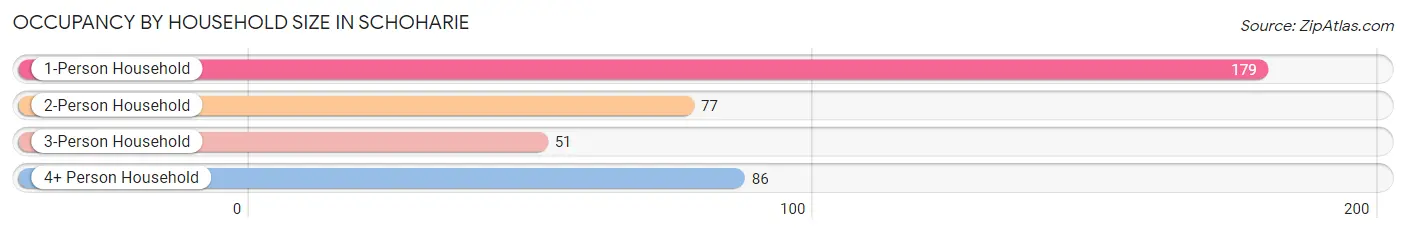
| Household Size | # Housing Units | % Housing Units |
| 1-Person Household | 179 | 45.6% |
| 2-Person Household | 77 | 19.6% |
| 3-Person Household | 51 | 13.0% |
| 4+ Person Household | 86 | 21.9% |
| Total Housing Units | 393 | 100.0% |
Occupancy by Ownership by Household Size in Schoharie
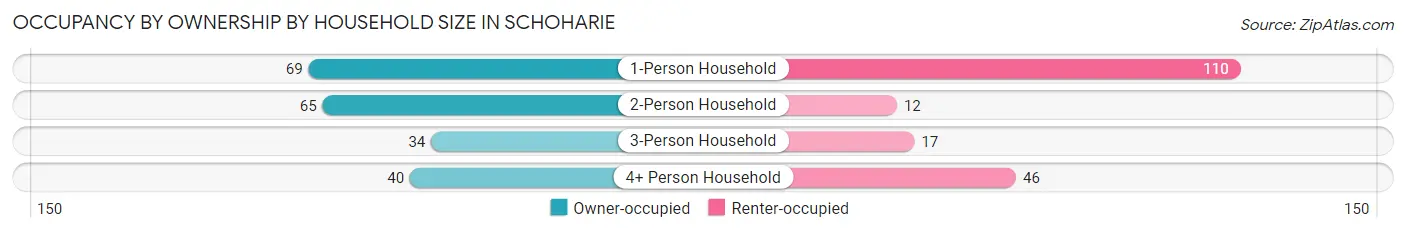
| Household Size | Owner-occupied | Renter-occupied |
| 1-Person Household | 69 (38.6%) | 110 (61.5%) |
| 2-Person Household | 65 (84.4%) | 12 (15.6%) |
| 3-Person Household | 34 (66.7%) | 17 (33.3%) |
| 4+ Person Household | 40 (46.5%) | 46 (53.5%) |
| Total Housing Units | 208 (52.9%) | 185 (47.1%) |
Occupancy by Educational Attainment in Schoharie
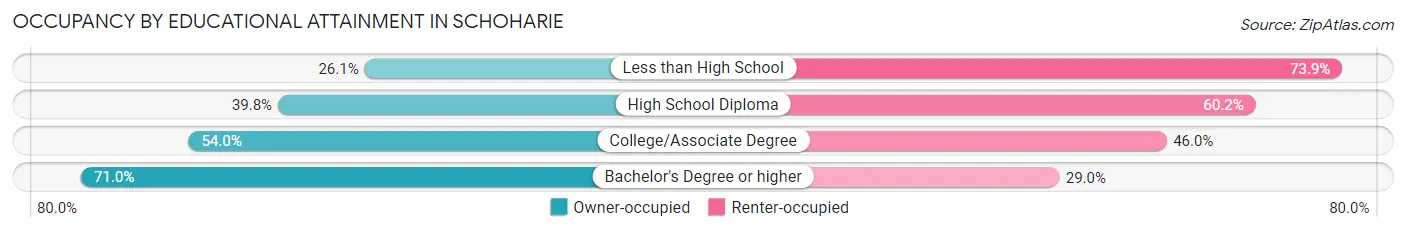
| Household Size | Owner-occupied | Renter-occupied |
| Less than High School | 6 (26.1%) | 17 (73.9%) |
| High School Diploma | 45 (39.8%) | 68 (60.2%) |
| College/Associate Degree | 81 (54.0%) | 69 (46.0%) |
| Bachelor's Degree or higher | 76 (71.0%) | 31 (29.0%) |
Occupancy by Age of Householder in Schoharie
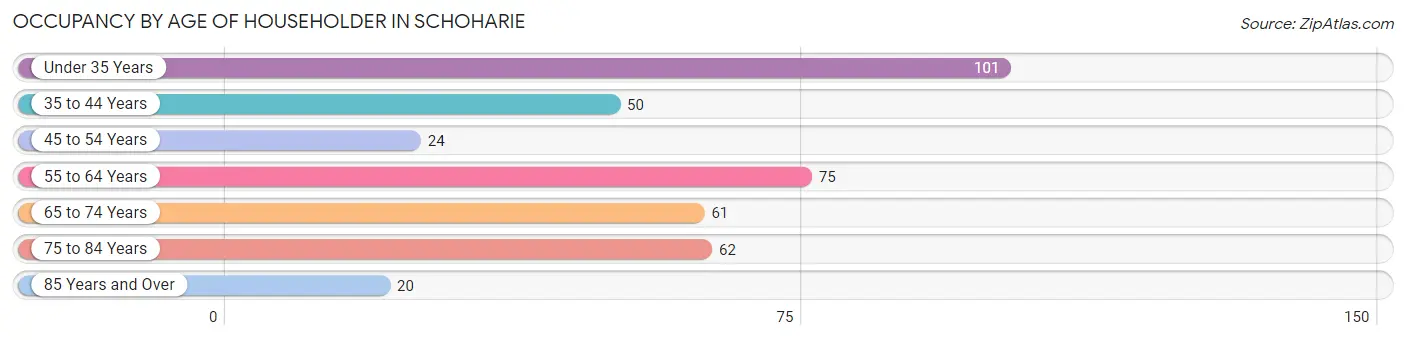
| Age Bracket | # Households | % Households |
| Under 35 Years | 101 | 25.7% |
| 35 to 44 Years | 50 | 12.7% |
| 45 to 54 Years | 24 | 6.1% |
| 55 to 64 Years | 75 | 19.1% |
| 65 to 74 Years | 61 | 15.5% |
| 75 to 84 Years | 62 | 15.8% |
| 85 Years and Over | 20 | 5.1% |
| Total | 393 | 100.0% |
Housing Finances in Schoharie
Median Income by Occupancy in Schoharie
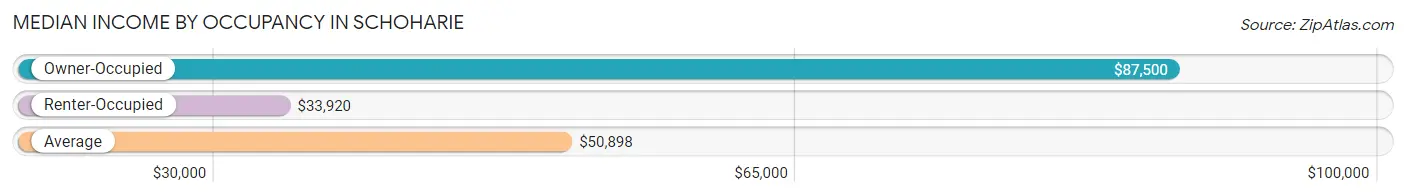
| Occupancy Type | # Households | Median Income |
| Owner-Occupied | 208 (52.9%) | $87,500 |
| Renter-Occupied | 185 (47.1%) | $33,920 |
| Average | 393 (100.0%) | $50,898 |
Occupancy by Householder Income Bracket in Schoharie
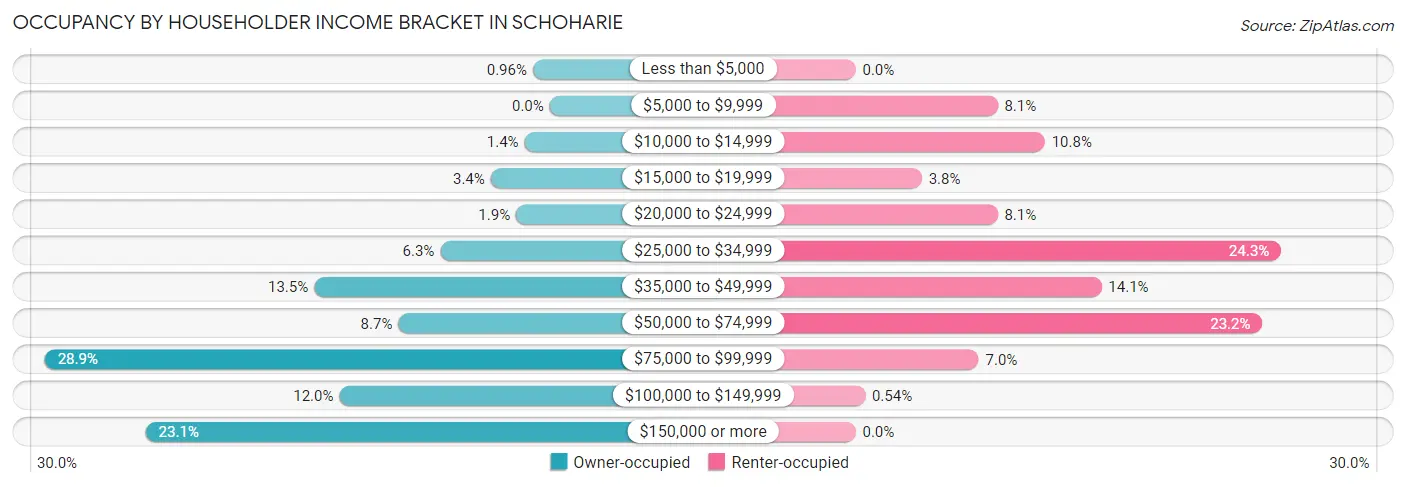
| Income Bracket | Owner-occupied | Renter-occupied |
| Less than $5,000 | 2 (1.0%) | 0 (0.0%) |
| $5,000 to $9,999 | 0 (0.0%) | 15 (8.1%) |
| $10,000 to $14,999 | 3 (1.4%) | 20 (10.8%) |
| $15,000 to $19,999 | 7 (3.4%) | 7 (3.8%) |
| $20,000 to $24,999 | 4 (1.9%) | 15 (8.1%) |
| $25,000 to $34,999 | 13 (6.2%) | 45 (24.3%) |
| $35,000 to $49,999 | 28 (13.5%) | 26 (14.1%) |
| $50,000 to $74,999 | 18 (8.6%) | 43 (23.2%) |
| $75,000 to $99,999 | 60 (28.8%) | 13 (7.0%) |
| $100,000 to $149,999 | 25 (12.0%) | 1 (0.5%) |
| $150,000 or more | 48 (23.1%) | 0 (0.0%) |
| Total | 208 (100.0%) | 185 (100.0%) |
Monthly Housing Cost Tiers in Schoharie
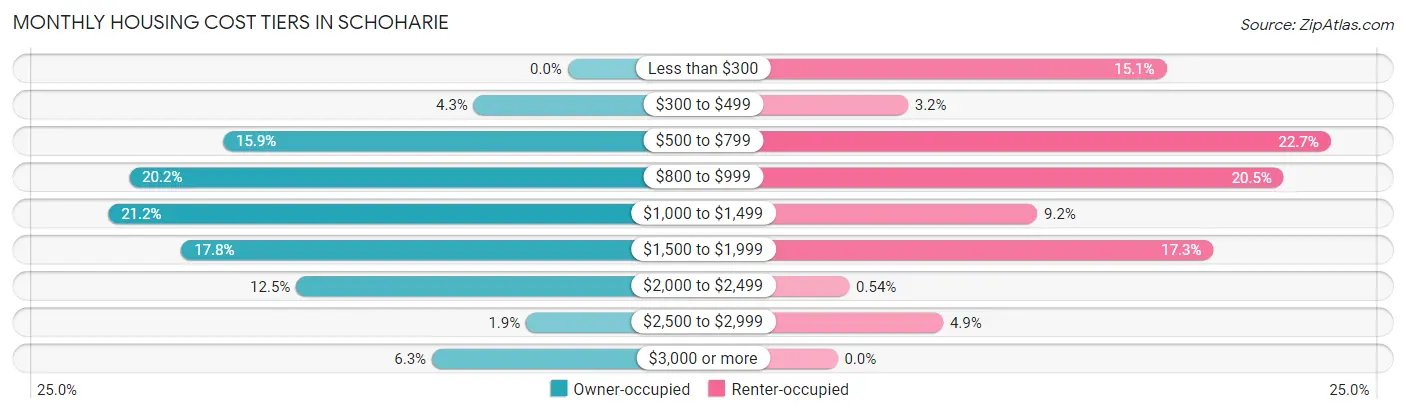
| Monthly Cost | Owner-occupied | Renter-occupied |
| Less than $300 | 0 (0.0%) | 28 (15.1%) |
| $300 to $499 | 9 (4.3%) | 6 (3.2%) |
| $500 to $799 | 33 (15.9%) | 42 (22.7%) |
| $800 to $999 | 42 (20.2%) | 38 (20.5%) |
| $1,000 to $1,499 | 44 (21.1%) | 17 (9.2%) |
| $1,500 to $1,999 | 37 (17.8%) | 32 (17.3%) |
| $2,000 to $2,499 | 26 (12.5%) | 1 (0.5%) |
| $2,500 to $2,999 | 4 (1.9%) | 9 (4.9%) |
| $3,000 or more | 13 (6.2%) | 0 (0.0%) |
| Total | 208 (100.0%) | 185 (100.0%) |
Physical Housing Characteristics in Schoharie
Housing Structures in Schoharie
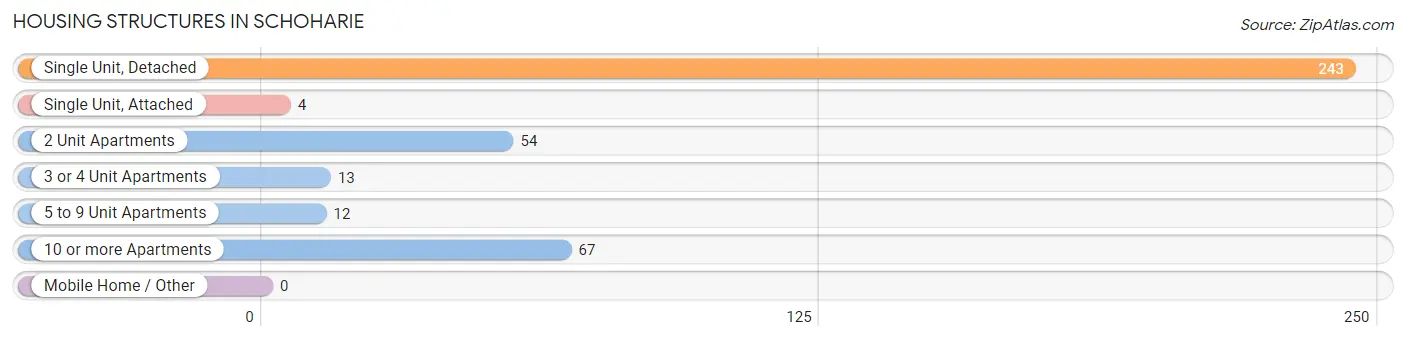
| Structure Type | # Housing Units | % Housing Units |
| Single Unit, Detached | 243 | 61.8% |
| Single Unit, Attached | 4 | 1.0% |
| 2 Unit Apartments | 54 | 13.7% |
| 3 or 4 Unit Apartments | 13 | 3.3% |
| 5 to 9 Unit Apartments | 12 | 3.0% |
| 10 or more Apartments | 67 | 17.1% |
| Mobile Home / Other | 0 | 0.0% |
| Total | 393 | 100.0% |
Housing Structures by Occupancy in Schoharie
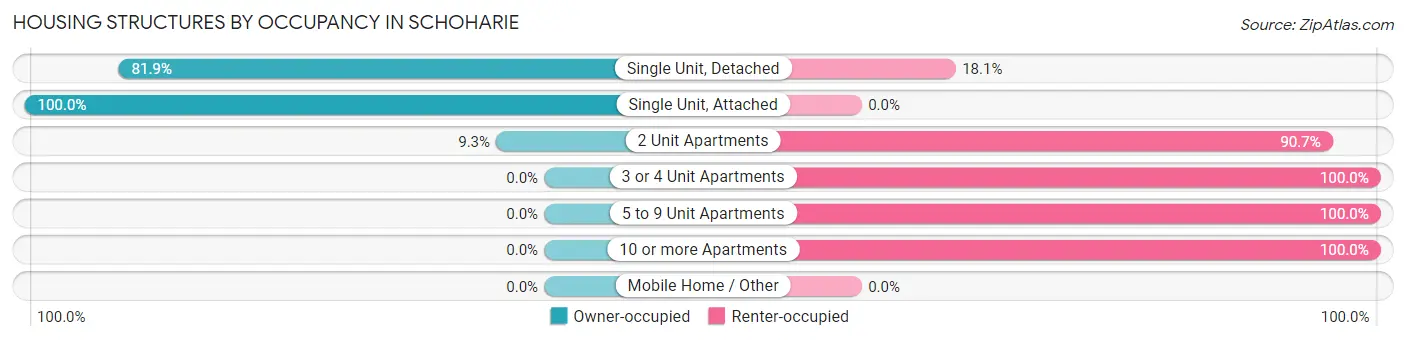
| Structure Type | Owner-occupied | Renter-occupied |
| Single Unit, Detached | 199 (81.9%) | 44 (18.1%) |
| Single Unit, Attached | 4 (100.0%) | 0 (0.0%) |
| 2 Unit Apartments | 5 (9.3%) | 49 (90.7%) |
| 3 or 4 Unit Apartments | 0 (0.0%) | 13 (100.0%) |
| 5 to 9 Unit Apartments | 0 (0.0%) | 12 (100.0%) |
| 10 or more Apartments | 0 (0.0%) | 67 (100.0%) |
| Mobile Home / Other | 0 (0.0%) | 0 (0.0%) |
| Total | 208 (52.9%) | 185 (47.1%) |
Housing Structures by Number of Rooms in Schoharie
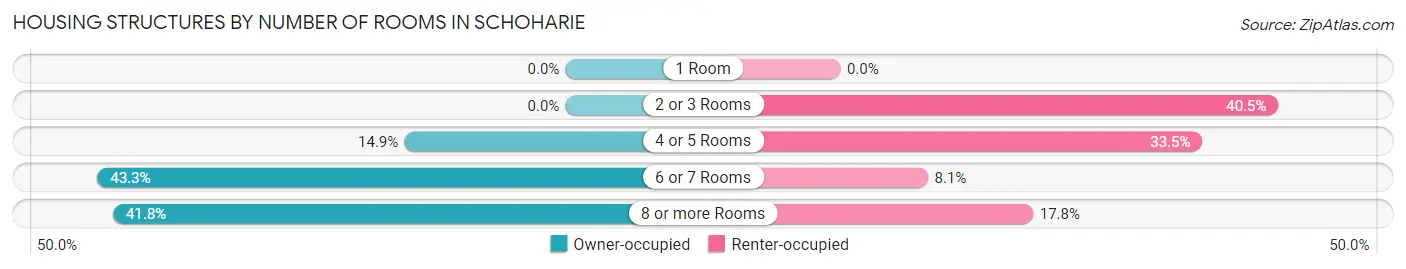
| Number of Rooms | Owner-occupied | Renter-occupied |
| 1 Room | 0 (0.0%) | 0 (0.0%) |
| 2 or 3 Rooms | 0 (0.0%) | 75 (40.5%) |
| 4 or 5 Rooms | 31 (14.9%) | 62 (33.5%) |
| 6 or 7 Rooms | 90 (43.3%) | 15 (8.1%) |
| 8 or more Rooms | 87 (41.8%) | 33 (17.8%) |
| Total | 208 (100.0%) | 185 (100.0%) |
Housing Structure by Heating Type in Schoharie
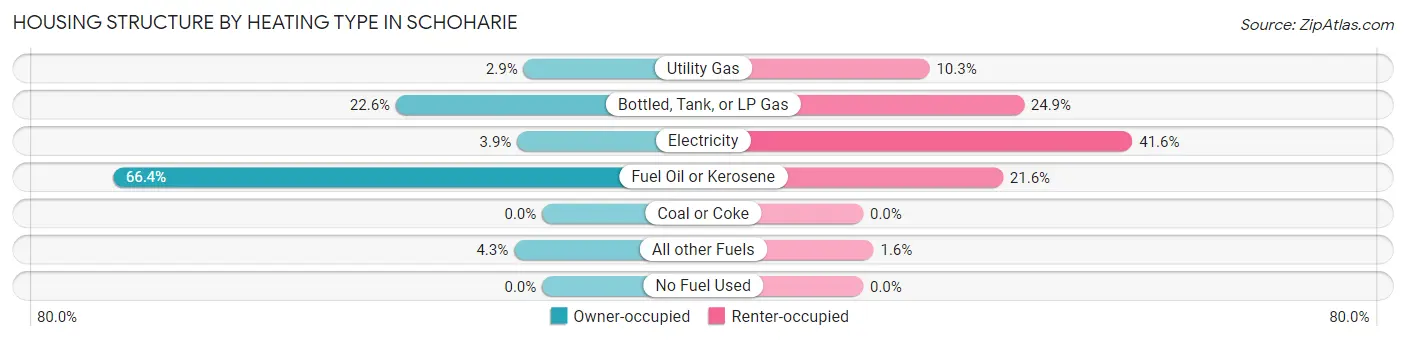
| Heating Type | Owner-occupied | Renter-occupied |
| Utility Gas | 6 (2.9%) | 19 (10.3%) |
| Bottled, Tank, or LP Gas | 47 (22.6%) | 46 (24.9%) |
| Electricity | 8 (3.8%) | 77 (41.6%) |
| Fuel Oil or Kerosene | 138 (66.3%) | 40 (21.6%) |
| Coal or Coke | 0 (0.0%) | 0 (0.0%) |
| All other Fuels | 9 (4.3%) | 3 (1.6%) |
| No Fuel Used | 0 (0.0%) | 0 (0.0%) |
| Total | 208 (100.0%) | 185 (100.0%) |
Household Vehicle Usage in Schoharie
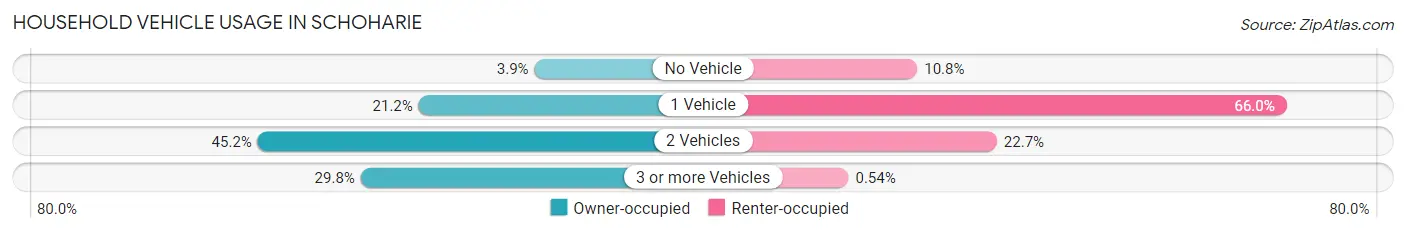
| Vehicles per Household | Owner-occupied | Renter-occupied |
| No Vehicle | 8 (3.8%) | 20 (10.8%) |
| 1 Vehicle | 44 (21.1%) | 122 (65.9%) |
| 2 Vehicles | 94 (45.2%) | 42 (22.7%) |
| 3 or more Vehicles | 62 (29.8%) | 1 (0.5%) |
| Total | 208 (100.0%) | 185 (100.0%) |
Real Estate & Mortgages in Schoharie
Real Estate and Mortgage Overview in Schoharie
| Characteristic | Without Mortgage | With Mortgage |
| Housing Units | 84 | 124 |
| Median Property Value | $160,000 | $180,000 |
| Median Household Income | $78,750 | $37 |
| Monthly Housing Costs | $800 | $13 |
| Real Estate Taxes | $5,172 | $0 |
Property Value by Mortgage Status in Schoharie
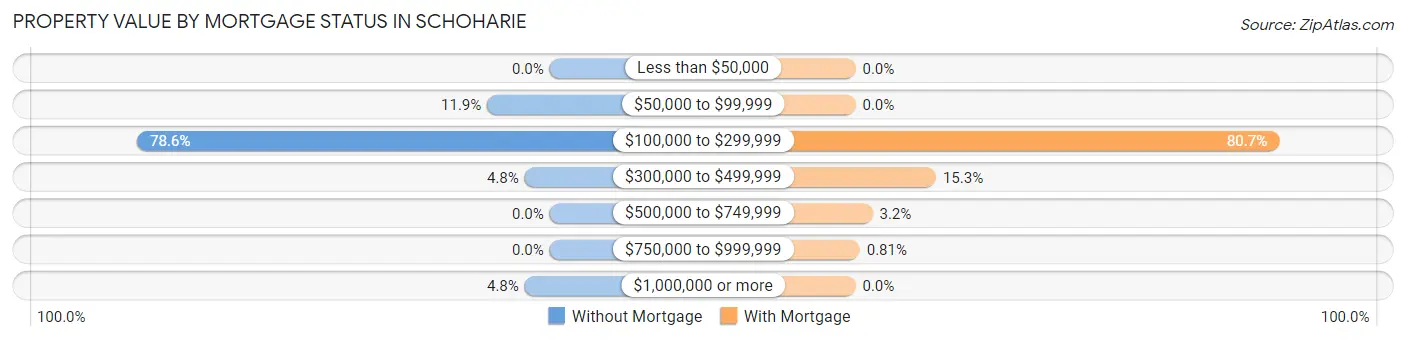
| Property Value | Without Mortgage | With Mortgage |
| Less than $50,000 | 0 (0.0%) | 0 (0.0%) |
| $50,000 to $99,999 | 10 (11.9%) | 0 (0.0%) |
| $100,000 to $299,999 | 66 (78.6%) | 100 (80.6%) |
| $300,000 to $499,999 | 4 (4.8%) | 19 (15.3%) |
| $500,000 to $749,999 | 0 (0.0%) | 4 (3.2%) |
| $750,000 to $999,999 | 0 (0.0%) | 1 (0.8%) |
| $1,000,000 or more | 4 (4.8%) | 0 (0.0%) |
| Total | 84 (100.0%) | 124 (100.0%) |
Household Income by Mortgage Status in Schoharie
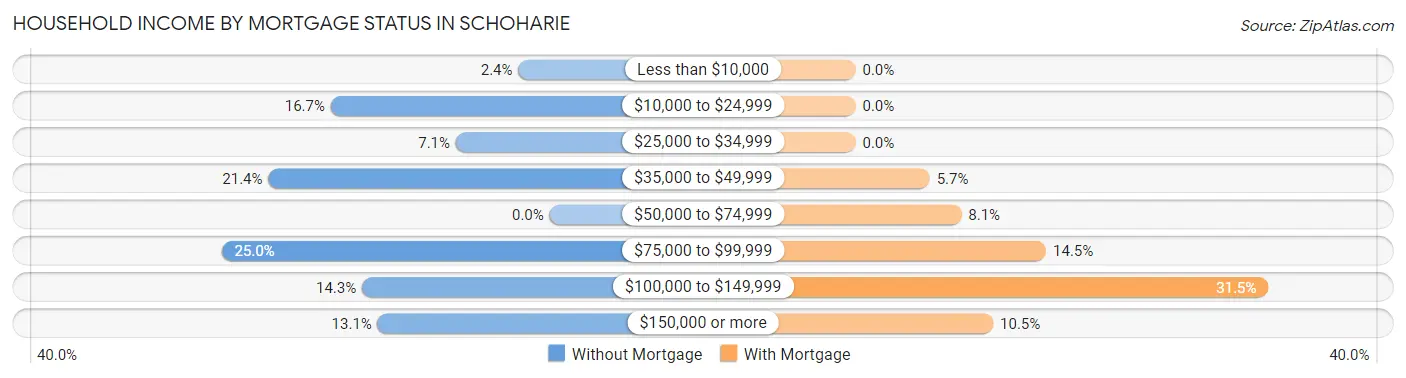
| Household Income | Without Mortgage | With Mortgage |
| Less than $10,000 | 2 (2.4%) | 0 (0.0%) |
| $10,000 to $24,999 | 14 (16.7%) | 0 (0.0%) |
| $25,000 to $34,999 | 6 (7.1%) | 0 (0.0%) |
| $35,000 to $49,999 | 18 (21.4%) | 7 (5.7%) |
| $50,000 to $74,999 | 0 (0.0%) | 10 (8.1%) |
| $75,000 to $99,999 | 21 (25.0%) | 18 (14.5%) |
| $100,000 to $149,999 | 12 (14.3%) | 39 (31.5%) |
| $150,000 or more | 11 (13.1%) | 13 (10.5%) |
| Total | 84 (100.0%) | 124 (100.0%) |
Property Value to Household Income Ratio in Schoharie
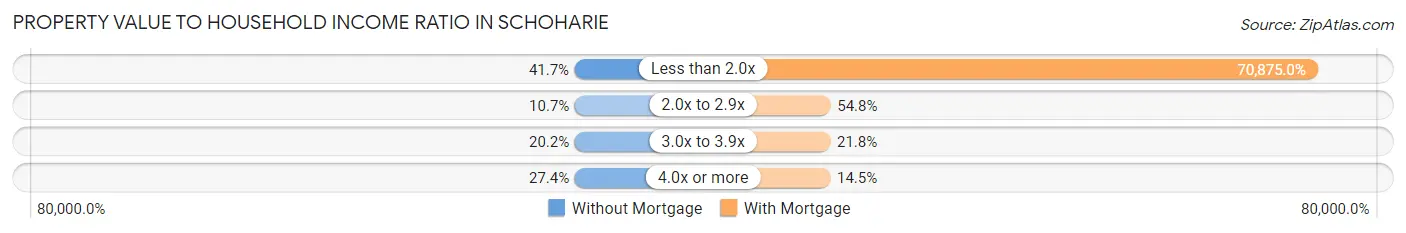
| Value-to-Income Ratio | Without Mortgage | With Mortgage |
| Less than 2.0x | 35 (41.7%) | 87,885 (70,875.0%) |
| 2.0x to 2.9x | 9 (10.7%) | 68 (54.8%) |
| 3.0x to 3.9x | 17 (20.2%) | 27 (21.8%) |
| 4.0x or more | 23 (27.4%) | 18 (14.5%) |
| Total | 84 (100.0%) | 124 (100.0%) |
Real Estate Taxes by Mortgage Status in Schoharie

| Property Taxes | Without Mortgage | With Mortgage |
| Less than $800 | 0 (0.0%) | 0 (0.0%) |
| $800 to $1,499 | 10 (11.9%) | 4 (3.2%) |
| $800 to $1,499 | 74 (88.1%) | 15 (12.1%) |
| Total | 84 (100.0%) | 124 (100.0%) |
Health & Disability in Schoharie
Health Insurance Coverage by Age in Schoharie
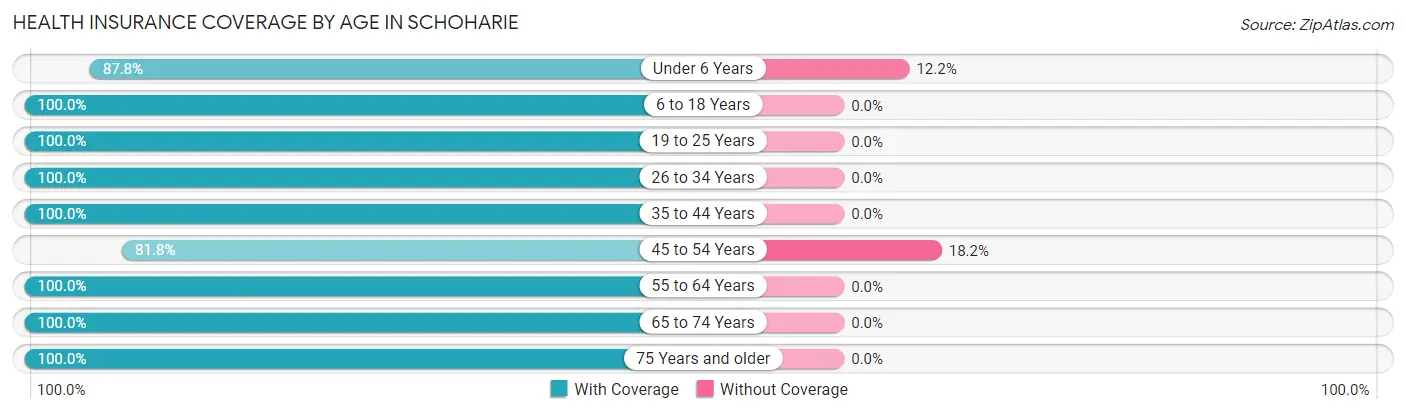
| Age Bracket | With Coverage | Without Coverage |
| Under 6 Years | 65 (87.8%) | 9 (12.2%) |
| 6 to 18 Years | 135 (100.0%) | 0 (0.0%) |
| 19 to 25 Years | 87 (100.0%) | 0 (0.0%) |
| 26 to 34 Years | 158 (100.0%) | 0 (0.0%) |
| 35 to 44 Years | 96 (100.0%) | 0 (0.0%) |
| 45 to 54 Years | 45 (81.8%) | 10 (18.2%) |
| 55 to 64 Years | 109 (100.0%) | 0 (0.0%) |
| 65 to 74 Years | 96 (100.0%) | 0 (0.0%) |
| 75 Years and older | 87 (100.0%) | 0 (0.0%) |
| Total | 878 (97.9%) | 19 (2.1%) |
Health Insurance Coverage by Citizenship Status in Schoharie

| Citizenship Status | With Coverage | Without Coverage |
| Native Born | 65 (87.8%) | 9 (12.2%) |
| Foreign Born, Citizen | 135 (100.0%) | 0 (0.0%) |
| Foreign Born, not a Citizen | 87 (100.0%) | 0 (0.0%) |
Health Insurance Coverage by Household Income in Schoharie
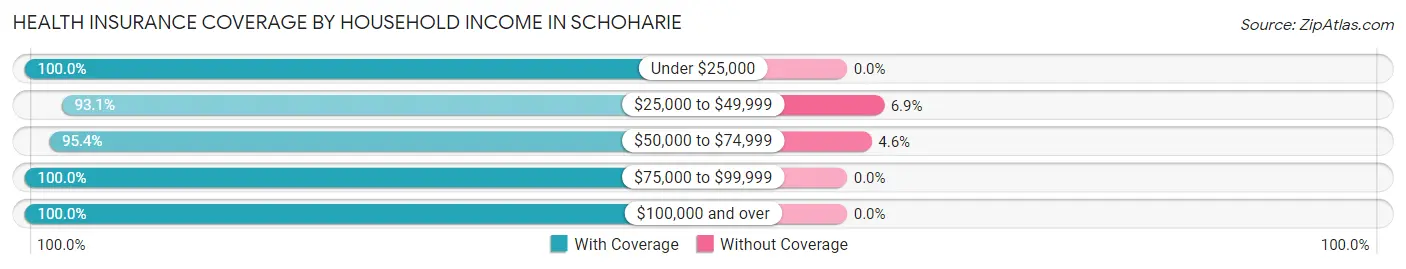
| Household Income | With Coverage | Without Coverage |
| Under $25,000 | 96 (100.0%) | 0 (0.0%) |
| $25,000 to $49,999 | 148 (93.1%) | 11 (6.9%) |
| $50,000 to $74,999 | 166 (95.4%) | 8 (4.6%) |
| $75,000 to $99,999 | 209 (100.0%) | 0 (0.0%) |
| $100,000 and over | 244 (100.0%) | 0 (0.0%) |
Public vs Private Health Insurance Coverage by Age in Schoharie
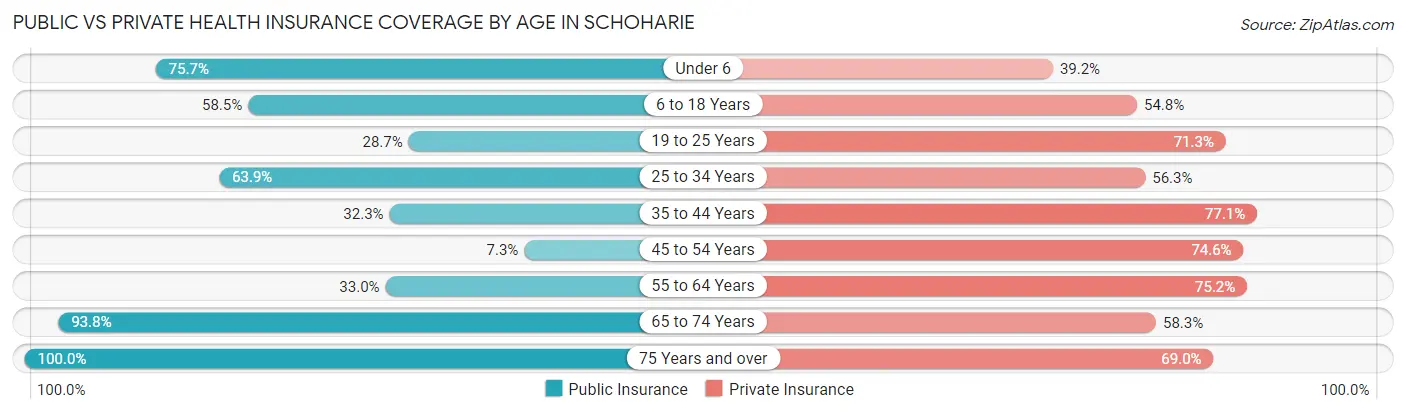
| Age Bracket | Public Insurance | Private Insurance |
| Under 6 | 56 (75.7%) | 29 (39.2%) |
| 6 to 18 Years | 79 (58.5%) | 74 (54.8%) |
| 19 to 25 Years | 25 (28.7%) | 62 (71.3%) |
| 25 to 34 Years | 101 (63.9%) | 89 (56.3%) |
| 35 to 44 Years | 31 (32.3%) | 74 (77.1%) |
| 45 to 54 Years | 4 (7.3%) | 41 (74.6%) |
| 55 to 64 Years | 36 (33.0%) | 82 (75.2%) |
| 65 to 74 Years | 90 (93.8%) | 56 (58.3%) |
| 75 Years and over | 87 (100.0%) | 60 (69.0%) |
| Total | 509 (56.7%) | 567 (63.2%) |
Disability Status by Sex by Age in Schoharie
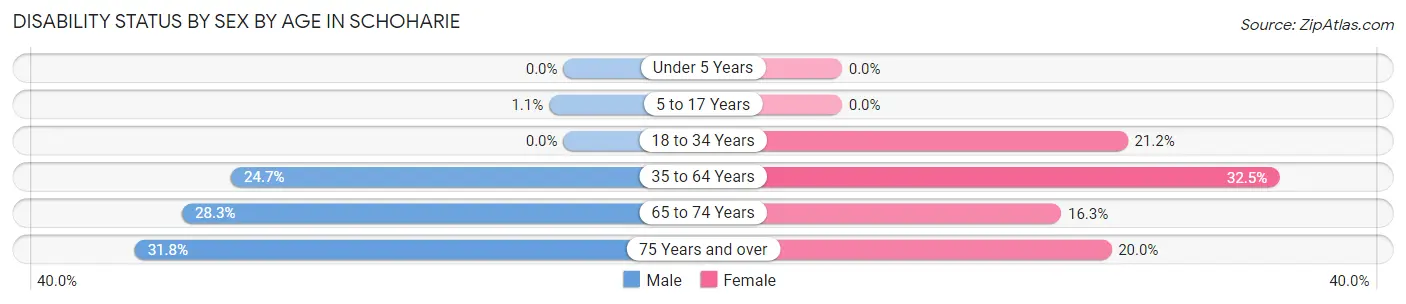
| Age Bracket | Male | Female |
| Under 5 Years | 0 (0.0%) | 0 (0.0%) |
| 5 to 17 Years | 1 (1.1%) | 0 (0.0%) |
| 18 to 34 Years | 0 (0.0%) | 28 (21.2%) |
| 35 to 64 Years | 36 (24.7%) | 37 (32.5%) |
| 65 to 74 Years | 15 (28.3%) | 7 (16.3%) |
| 75 Years and over | 7 (31.8%) | 13 (20.0%) |
Disability Class by Sex by Age in Schoharie
Disability Class: Hearing Difficulty
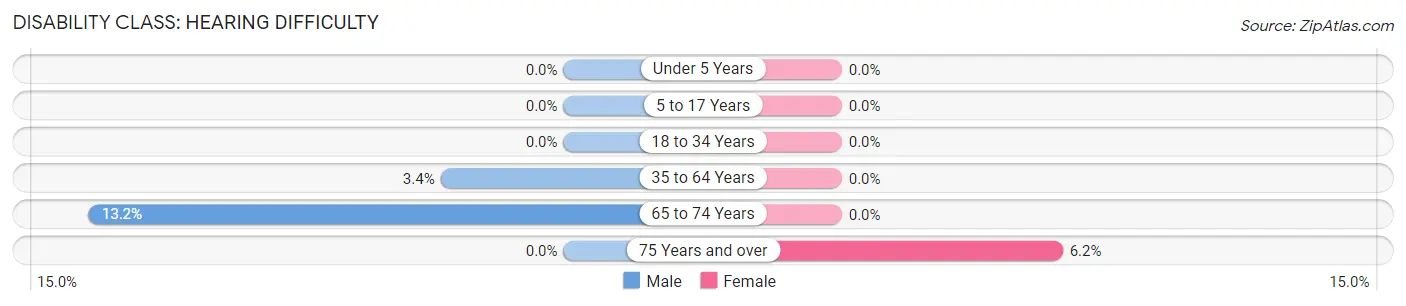
| Age Bracket | Male | Female |
| Under 5 Years | 0 (0.0%) | 0 (0.0%) |
| 5 to 17 Years | 0 (0.0%) | 0 (0.0%) |
| 18 to 34 Years | 0 (0.0%) | 0 (0.0%) |
| 35 to 64 Years | 5 (3.4%) | 0 (0.0%) |
| 65 to 74 Years | 7 (13.2%) | 0 (0.0%) |
| 75 Years and over | 0 (0.0%) | 4 (6.1%) |
Disability Class: Vision Difficulty
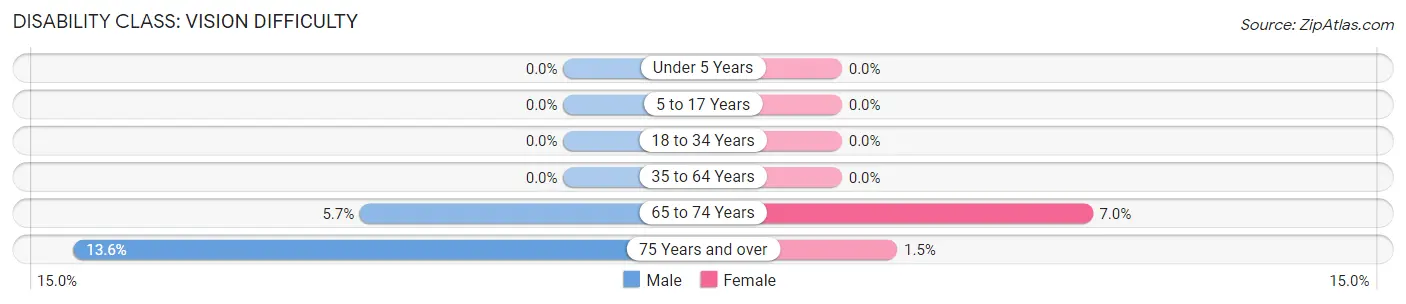
| Age Bracket | Male | Female |
| Under 5 Years | 0 (0.0%) | 0 (0.0%) |
| 5 to 17 Years | 0 (0.0%) | 0 (0.0%) |
| 18 to 34 Years | 0 (0.0%) | 0 (0.0%) |
| 35 to 64 Years | 0 (0.0%) | 0 (0.0%) |
| 65 to 74 Years | 3 (5.7%) | 3 (7.0%) |
| 75 Years and over | 3 (13.6%) | 1 (1.5%) |
Disability Class: Cognitive Difficulty
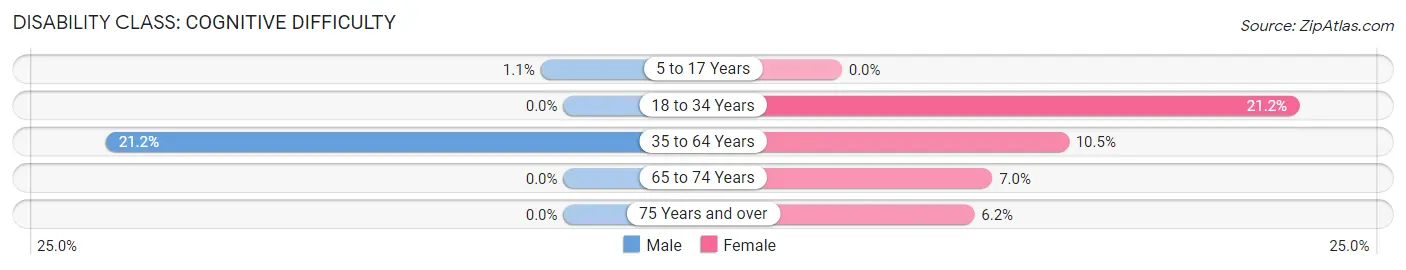
| Age Bracket | Male | Female |
| 5 to 17 Years | 1 (1.1%) | 0 (0.0%) |
| 18 to 34 Years | 0 (0.0%) | 28 (21.2%) |
| 35 to 64 Years | 31 (21.2%) | 12 (10.5%) |
| 65 to 74 Years | 0 (0.0%) | 3 (7.0%) |
| 75 Years and over | 0 (0.0%) | 4 (6.1%) |
Disability Class: Ambulatory Difficulty
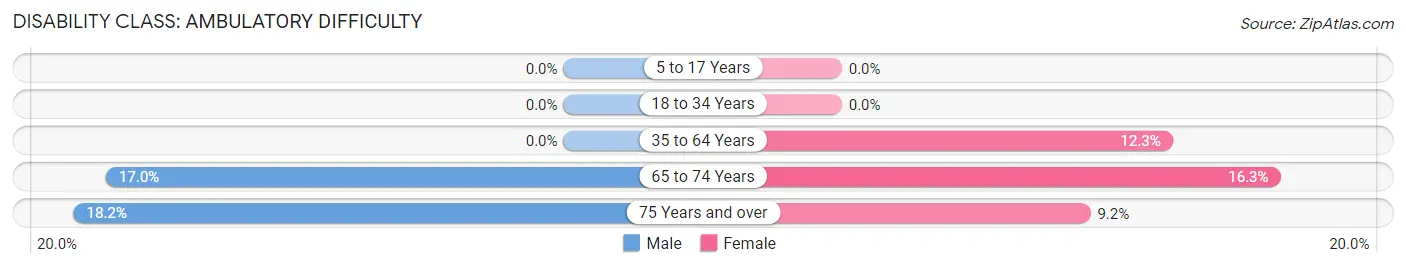
| Age Bracket | Male | Female |
| 5 to 17 Years | 0 (0.0%) | 0 (0.0%) |
| 18 to 34 Years | 0 (0.0%) | 0 (0.0%) |
| 35 to 64 Years | 0 (0.0%) | 14 (12.3%) |
| 65 to 74 Years | 9 (17.0%) | 7 (16.3%) |
| 75 Years and over | 4 (18.2%) | 6 (9.2%) |
Disability Class: Self-Care Difficulty
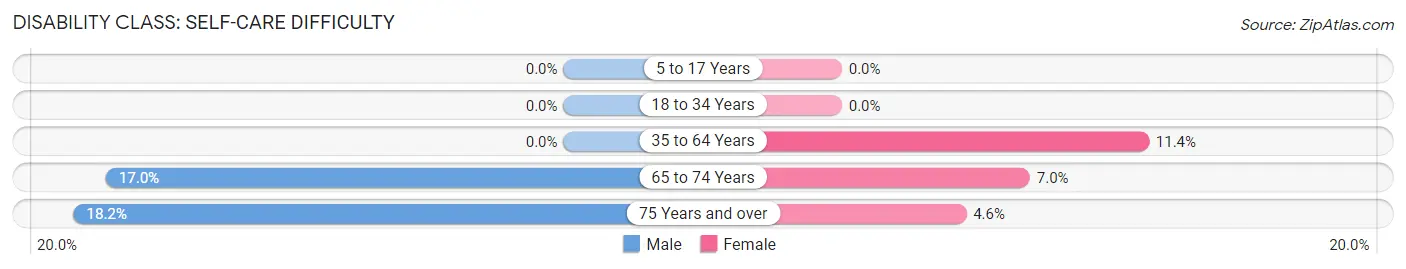
| Age Bracket | Male | Female |
| 5 to 17 Years | 0 (0.0%) | 0 (0.0%) |
| 18 to 34 Years | 0 (0.0%) | 0 (0.0%) |
| 35 to 64 Years | 0 (0.0%) | 13 (11.4%) |
| 65 to 74 Years | 9 (17.0%) | 3 (7.0%) |
| 75 Years and over | 4 (18.2%) | 3 (4.6%) |
Technology Access in Schoharie
Computing Device Access in Schoharie
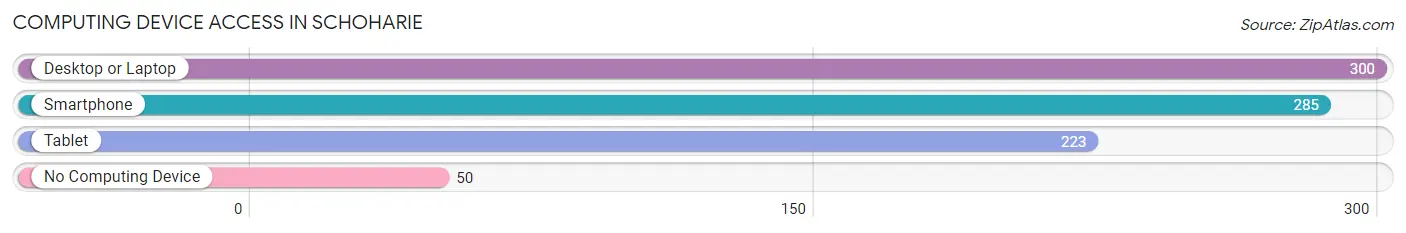
| Device Type | # Households | % Households |
| Desktop or Laptop | 300 | 76.3% |
| Smartphone | 285 | 72.5% |
| Tablet | 223 | 56.7% |
| No Computing Device | 50 | 12.7% |
| Total | 393 | 100.0% |
Internet Access in Schoharie
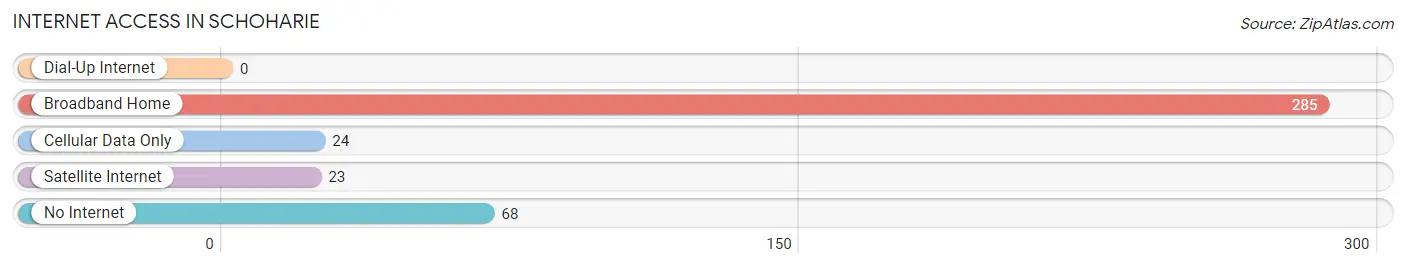
| Internet Type | # Households | % Households |
| Dial-Up Internet | 0 | 0.0% |
| Broadband Home | 285 | 72.5% |
| Cellular Data Only | 24 | 6.1% |
| Satellite Internet | 23 | 5.9% |
| No Internet | 68 | 17.3% |
| Total | 393 | 100.0% |
Schoharie Summary
Schoharie, NY is a small town located in the foothills of the Catskill Mountains in upstate New York. It is the county seat of Schoharie County and is situated along the Schoharie Creek. The town has a population of approximately 3,000 people and is known for its rural charm and historic buildings.
History
Schoharie was first settled in 1712 by Dutch settlers from the nearby town of Schenectady. The town was originally known as Schoharie Court House, as it was the site of the county court house. The town was officially incorporated in 1795.
During the Revolutionary War, Schoharie was the site of several battles between the British and American forces. The town was also the site of the Battle of Oriskany, which was a major victory for the American forces.
In the 19th century, Schoharie was an important center for the production of wool and leather goods. The town was also home to several mills, including a paper mill, a grist mill, and a saw mill.
Geography
Schoharie is located in the foothills of the Catskill Mountains in upstate New York. The town is situated along the Schoharie Creek, which is a tributary of the Mohawk River. The town is bordered by the towns of Cobleskill to the north, Middleburgh to the east, and Esperance to the south.
The terrain of Schoharie is mostly rolling hills and valleys, with some flat areas near the creek. The town is located at an elevation of approximately 1,000 feet above sea level.
Economy
The economy of Schoharie is largely based on agriculture and tourism. The town is home to several farms, which produce a variety of crops, including corn, hay, and apples. The town is also home to several wineries, which produce a variety of wines.
Tourism is an important part of the economy of Schoharie. The town is home to several historic sites, including the Schoharie Valley Railroad Museum and the Schoharie County Historical Society. The town is also home to several festivals, including the Schoharie County Fair and the Schoharie Valley Harvest Festival.
Demographics
As of the 2010 census, the population of Schoharie was 3,299. The racial makeup of the town was 97.2% White, 0.7% African American, 0.3% Native American, 0.3% Asian, 0.1% Pacific Islander, 0.3% from other races, and 1.2% from two or more races. Hispanic or Latino of any race were 1.7% of the population.
The median household income in Schoharie was $41,944, and the median family income was $50,938. The per capita income for the town was $20,945. About 11.2% of families and 14.2% of the population were below the poverty line, including 19.2% of those under age 18 and 8.2% of those age 65 or over.
Common Questions
What is Per Capita Income in Schoharie?
Per Capita income in Schoharie is $32,365.
What is the Median Family Income in Schoharie?
Median Family Income in Schoharie is $77,222.
What is the Median Household income in Schoharie?
Median Household Income in Schoharie is $50,898.
What is Income or Wage Gap in Schoharie?
Income or Wage Gap in Schoharie is 41.9%.
Women in Schoharie earn 58.1 cents for every dollar earned by a man.
What is Inequality or Gini Index in Schoharie?
Inequality or Gini Index in Schoharie is 0.44.
What is the Total Population of Schoharie?
Total Population of Schoharie is 956.
What is the Total Male Population of Schoharie?
Total Male Population of Schoharie is 517.
What is the Total Female Population of Schoharie?
Total Female Population of Schoharie is 439.
What is the Ratio of Males per 100 Females in Schoharie?
There are 117.77 Males per 100 Females in Schoharie.
What is the Ratio of Females per 100 Males in Schoharie?
There are 84.91 Females per 100 Males in Schoharie.
What is the Median Population Age in Schoharie?
Median Population Age in Schoharie is 35.0 Years.
What is the Average Family Size in Schoharie
Average Family Size in Schoharie is 3.1 People.
What is the Average Household Size in Schoharie
Average Household Size in Schoharie is 2.2 People.
How Large is the Labor Force in Schoharie?
There are 354 People in the Labor Forcein in Schoharie.
What is the Percentage of People in the Labor Force in Schoharie?
47.0% of People are in the Labor Force in Schoharie.
What is the Unemployment Rate in Schoharie?
Unemployment Rate in Schoharie is 3.4%.