Sayville, NY Map & Demographics
Sayville Map
Sayville Overview
$65,532
PER CAPITA INCOME
$168,824
AVG FAMILY INCOME
$143,333
AVG HOUSEHOLD INCOME
35.9%
WAGE / INCOME GAP [ % ]
64.1¢/ $1
WAGE / INCOME GAP [ $ ]
$14,537
FAMILY INCOME DEFICIT
0.45
INEQUALITY / GINI INDEX
16,145
TOTAL POPULATION
7,983
MALE POPULATION
8,162
FEMALE POPULATION
97.81
MALES / 100 FEMALES
102.24
FEMALES / 100 MALES
45.1
MEDIAN AGE
3.2
AVG FAMILY SIZE
2.7
AVG HOUSEHOLD SIZE
8,290
LABOR FORCE [ PEOPLE ]
63.4%
PERCENT IN LABOR FORCE
1.9%
UNEMPLOYMENT RATE
Sayville Zip Codes
Income in Sayville
Income Overview in Sayville
Per Capita Income in Sayville is $65,532, while median incomes of families and households are $168,824 and $143,333 respectively.
| Characteristic | Number | Measure |
| Per Capita Income | 16,145 | $65,532 |
| Median Family Income | 4,216 | $168,824 |
| Mean Family Income | 4,216 | $210,151 |
| Median Household Income | 5,832 | $143,333 |
| Mean Household Income | 5,832 | $175,967 |
| Income Deficit | 4,216 | $14,537 |
| Wage / Income Gap (%) | 16,145 | 35.91% |
| Wage / Income Gap ($) | 16,145 | 64.09¢ per $1 |
| Gini / Inequality Index | 16,145 | 0.45 |
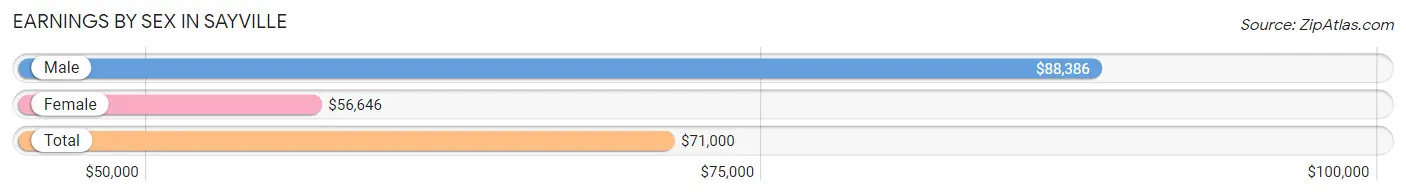
Earnings by Sex in Sayville
Average Earnings in Sayville are $71,000, $88,386 for men and $56,646 for women, a difference of 35.9%.
| Sex | Number | Average Earnings |
| Male | 4,426 (51.4%) | $88,386 |
| Female | 4,190 (48.6%) | $56,646 |
| Total | 8,616 (100.0%) | $71,000 |
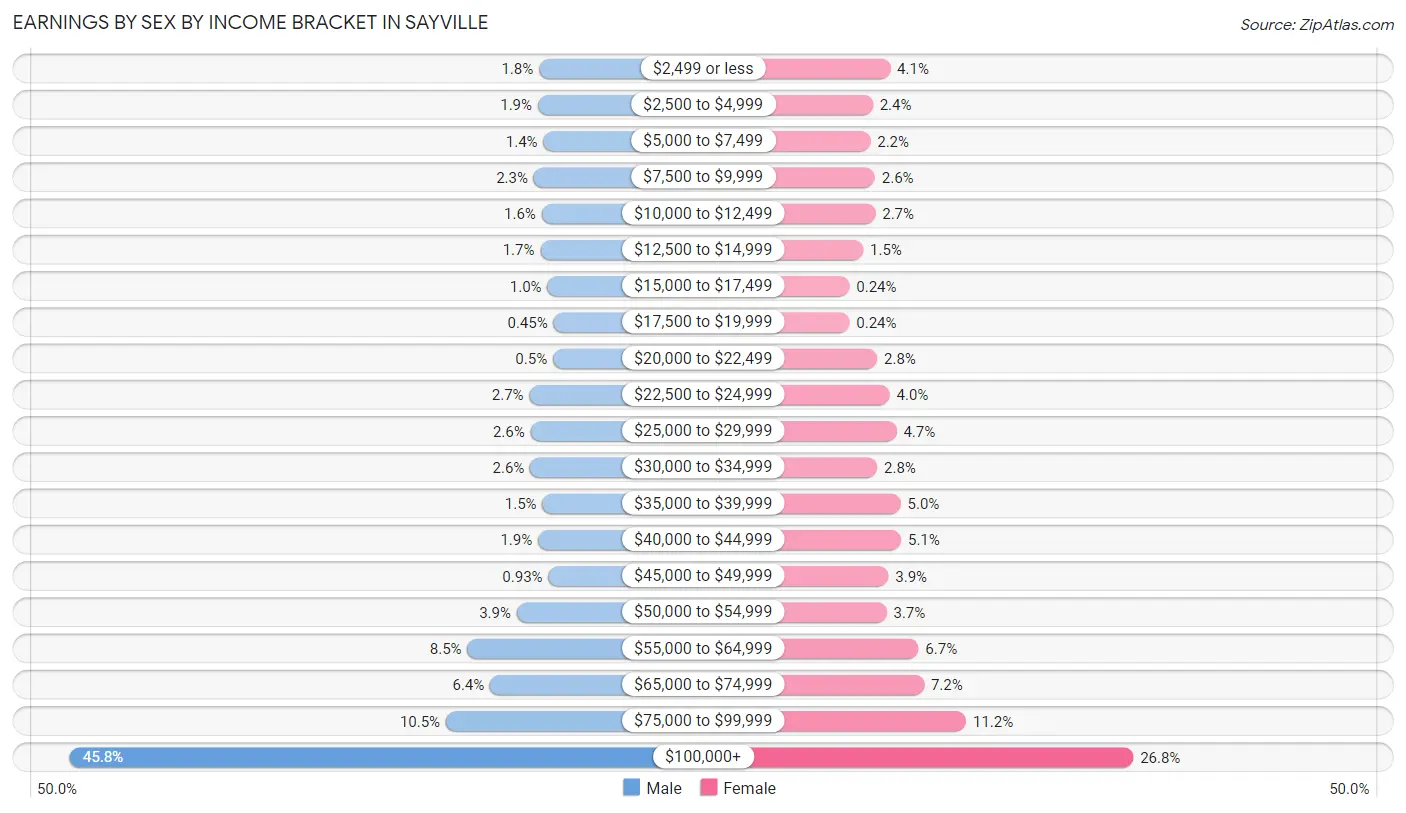
Earnings by Sex by Income Bracket in Sayville
The most common earnings brackets in Sayville are $100,000+ for men (2,025 | 45.8%) and $100,000+ for women (1,124 | 26.8%).
| Income | Male | Female |
| $2,499 or less | 80 (1.8%) | 170 (4.1%) |
| $2,500 to $4,999 | 85 (1.9%) | 102 (2.4%) |
| $5,000 to $7,499 | 62 (1.4%) | 92 (2.2%) |
| $7,500 to $9,999 | 102 (2.3%) | 110 (2.6%) |
| $10,000 to $12,499 | 69 (1.6%) | 112 (2.7%) |
| $12,500 to $14,999 | 75 (1.7%) | 64 (1.5%) |
| $15,000 to $17,499 | 45 (1.0%) | 10 (0.2%) |
| $17,500 to $19,999 | 20 (0.4%) | 10 (0.2%) |
| $20,000 to $22,499 | 22 (0.5%) | 119 (2.8%) |
| $22,500 to $24,999 | 120 (2.7%) | 168 (4.0%) |
| $25,000 to $29,999 | 115 (2.6%) | 195 (4.6%) |
| $30,000 to $34,999 | 117 (2.6%) | 119 (2.8%) |
| $35,000 to $39,999 | 66 (1.5%) | 211 (5.0%) |
| $40,000 to $44,999 | 84 (1.9%) | 213 (5.1%) |
| $45,000 to $49,999 | 41 (0.9%) | 163 (3.9%) |
| $50,000 to $54,999 | 172 (3.9%) | 156 (3.7%) |
| $55,000 to $64,999 | 377 (8.5%) | 281 (6.7%) |
| $65,000 to $74,999 | 283 (6.4%) | 303 (7.2%) |
| $75,000 to $99,999 | 466 (10.5%) | 468 (11.2%) |
| $100,000+ | 2,025 (45.8%) | 1,124 (26.8%) |
| Total | 4,426 (100.0%) | 4,190 (100.0%) |
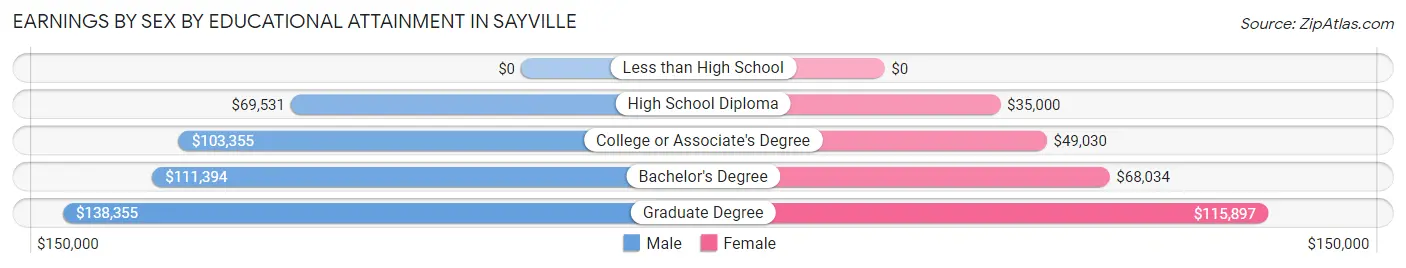
Earnings by Sex by Educational Attainment in Sayville
Average earnings in Sayville are $103,750 for men and $67,689 for women, a difference of 34.8%. Men with an educational attainment of graduate degree enjoy the highest average annual earnings of $138,355, while those with high school diploma education earn the least with $69,531. Women with an educational attainment of graduate degree earn the most with the average annual earnings of $115,897, while those with high school diploma education have the smallest earnings of $35,000.
| Educational Attainment | Male Income | Female Income |
| Less than High School | - | - |
| High School Diploma | $69,531 | $35,000 |
| College or Associate's Degree | $103,355 | $49,030 |
| Bachelor's Degree | $111,394 | $68,034 |
| Graduate Degree | $138,355 | $115,897 |
| Total | $103,750 | $67,689 |
Family Income in Sayville
Family Income Brackets in Sayville
According to the Sayville family income data, there are 1,682 families falling into the $200,000+ income range, which is the most common income bracket and makes up 39.9% of all families. Conversely, the less than $10,000 income bracket is the least frequent group with only 34 families (0.8%) belonging to this category.
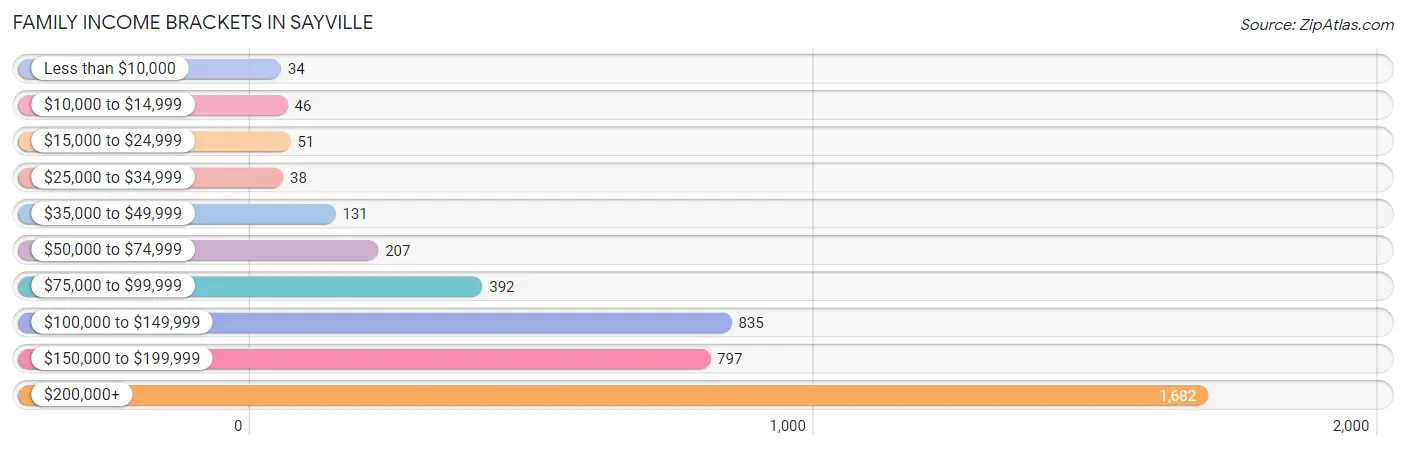
| Income Bracket | # Families | % Families |
| Less than $10,000 | 34 | 0.8% |
| $10,000 to $14,999 | 46 | 1.1% |
| $15,000 to $24,999 | 51 | 1.2% |
| $25,000 to $34,999 | 38 | 0.9% |
| $35,000 to $49,999 | 131 | 3.1% |
| $50,000 to $74,999 | 207 | 4.9% |
| $75,000 to $99,999 | 392 | 9.3% |
| $100,000 to $149,999 | 835 | 19.8% |
| $150,000 to $199,999 | 797 | 18.9% |
| $200,000+ | 1,682 | 39.9% |
Family Income by Famaliy Size in Sayville
6-person families (70 | 1.7%) account for the highest median family income in Sayville with $250,001 per family, while 3-person families (901 | 21.4%) have the highest median income of $56,458 per family member.
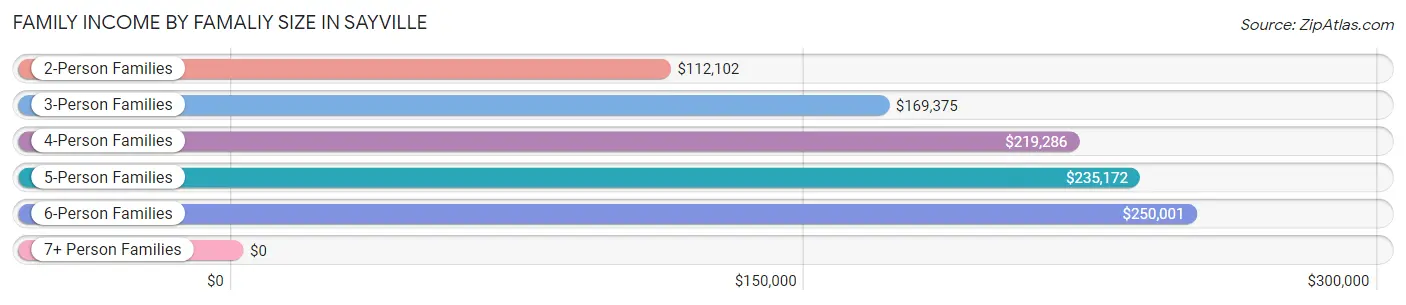
| Income Bracket | # Families | Median Income |
| 2-Person Families | 1,717 (40.7%) | $112,102 |
| 3-Person Families | 901 (21.4%) | $169,375 |
| 4-Person Families | 1,070 (25.4%) | $219,286 |
| 5-Person Families | 450 (10.7%) | $235,172 |
| 6-Person Families | 70 (1.7%) | $250,001 |
| 7+ Person Families | 8 (0.2%) | $0 |
| Total | 4,216 (100.0%) | $168,824 |
Family Income by Number of Earners in Sayville
The median family income in Sayville is $168,824, with families comprising 3+ earners (700) having the highest median family income of $217,417, while families with no earners (666) have the lowest median family income of $92,500, accounting for 16.6% and 15.8% of families, respectively.
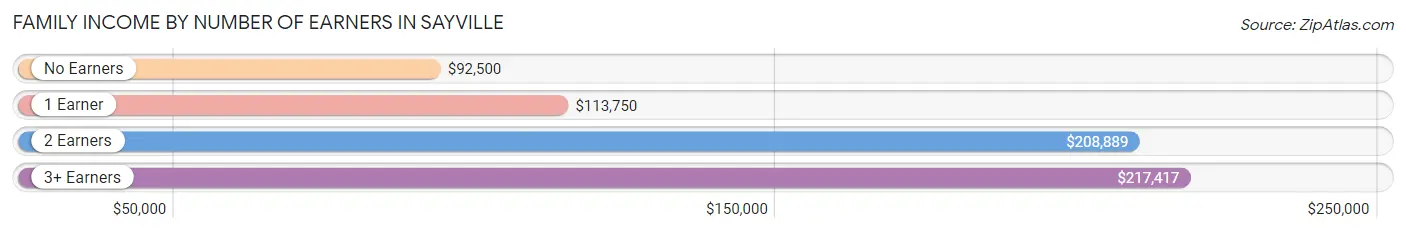
| Number of Earners | # Families | Median Income |
| No Earners | 666 (15.8%) | $92,500 |
| 1 Earner | 946 (22.4%) | $113,750 |
| 2 Earners | 1,904 (45.2%) | $208,889 |
| 3+ Earners | 700 (16.6%) | $217,417 |
| Total | 4,216 (100.0%) | $168,824 |
Household Income in Sayville
Household Income Brackets in Sayville
With 1,755 households falling in the category, the $200,000+ income range is the most frequent in Sayville, accounting for 30.1% of all households. In contrast, only 128 households (2.2%) fall into the $10,000 to $14,999 income bracket, making it the least populous group.
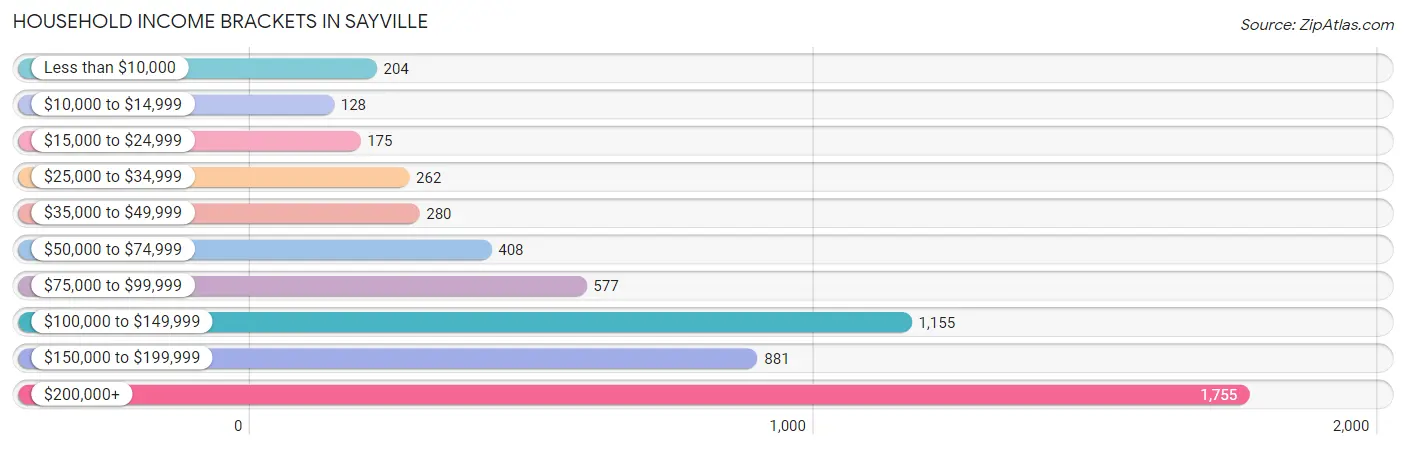
| Income Bracket | # Households | % Households |
| Less than $10,000 | 204 | 3.5% |
| $10,000 to $14,999 | 128 | 2.2% |
| $15,000 to $24,999 | 175 | 3.0% |
| $25,000 to $34,999 | 262 | 4.5% |
| $35,000 to $49,999 | 280 | 4.8% |
| $50,000 to $74,999 | 408 | 7.0% |
| $75,000 to $99,999 | 577 | 9.9% |
| $100,000 to $149,999 | 1,155 | 19.8% |
| $150,000 to $199,999 | 881 | 15.1% |
| $200,000+ | 1,755 | 30.1% |
Household Income by Householder Age in Sayville
The median household income in Sayville is $143,333, with the highest median household income of $167,333 found in the 45 to 64 years age bracket for the primary householder. A total of 2,702 households (46.3%) fall into this category.
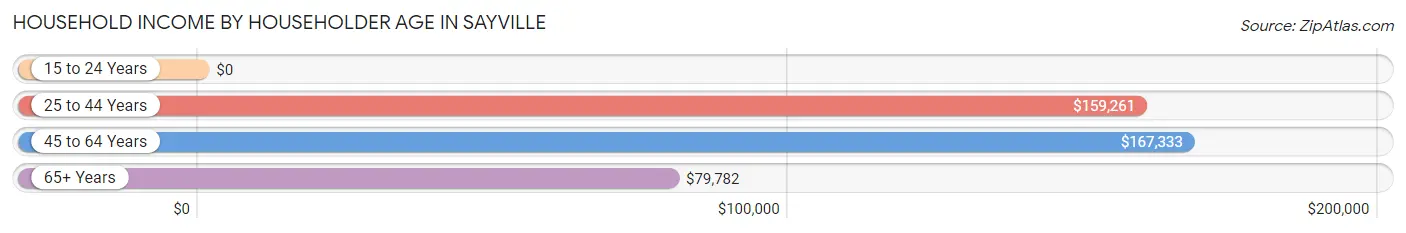
| Income Bracket | # Households | Median Income |
| 15 to 24 Years | 0 (0.0%) | $0 |
| 25 to 44 Years | 1,353 (23.2%) | $159,261 |
| 45 to 64 Years | 2,702 (46.3%) | $167,333 |
| 65+ Years | 1,777 (30.5%) | $79,782 |
| Total | 5,832 (100.0%) | $143,333 |
Poverty in Sayville
Income Below Poverty by Sex and Age in Sayville
With 3.5% poverty level for males and 5.1% for females among the residents of Sayville, 15 year old males and 6 to 11 year old females are the most vulnerable to poverty, with 25 males (47.2%) and 64 females (9.6%) in their respective age groups living below the poverty level.
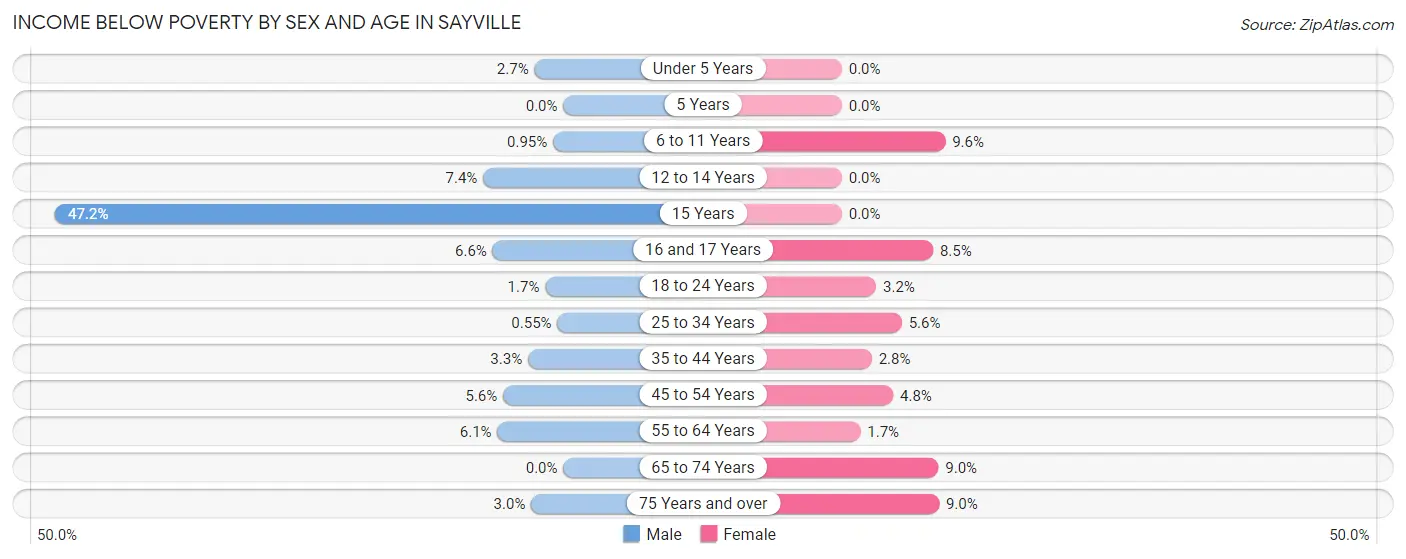
| Age Bracket | Male | Female |
| Under 5 Years | 11 (2.7%) | 0 (0.0%) |
| 5 Years | 0 (0.0%) | 0 (0.0%) |
| 6 to 11 Years | 7 (0.9%) | 64 (9.6%) |
| 12 to 14 Years | 32 (7.4%) | 0 (0.0%) |
| 15 Years | 25 (47.2%) | 0 (0.0%) |
| 16 and 17 Years | 8 (6.6%) | 28 (8.5%) |
| 18 to 24 Years | 10 (1.7%) | 16 (3.2%) |
| 25 to 34 Years | 5 (0.5%) | 44 (5.6%) |
| 35 to 44 Years | 31 (3.3%) | 22 (2.8%) |
| 45 to 54 Years | 64 (5.6%) | 68 (4.8%) |
| 55 to 64 Years | 68 (6.1%) | 20 (1.7%) |
| 65 to 74 Years | 0 (0.0%) | 62 (9.0%) |
| 75 Years and over | 15 (3.0%) | 78 (9.0%) |
| Total | 276 (3.5%) | 402 (5.1%) |
Income Above Poverty by Sex and Age in Sayville
According to the poverty statistics in Sayville, males aged 5 years and females aged under 5 years are the age groups that are most secure financially, with 100.0% of males and 100.0% of females in these age groups living above the poverty line.
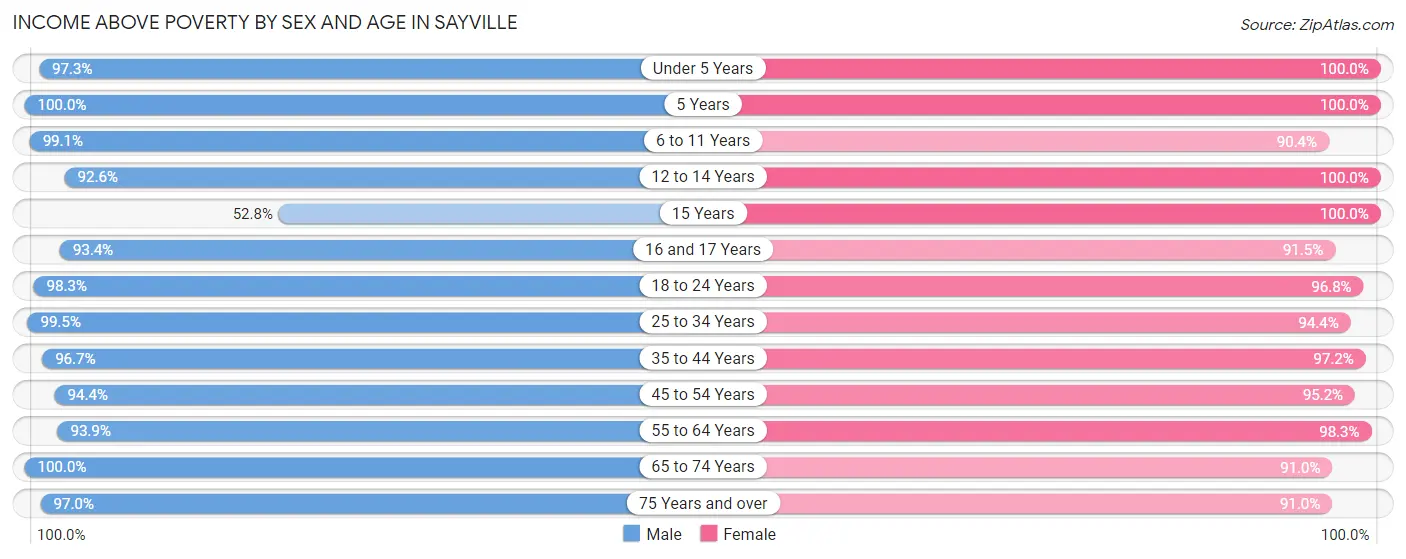
| Age Bracket | Male | Female |
| Under 5 Years | 400 (97.3%) | 379 (100.0%) |
| 5 Years | 36 (100.0%) | 46 (100.0%) |
| 6 to 11 Years | 728 (99.1%) | 603 (90.4%) |
| 12 to 14 Years | 398 (92.6%) | 185 (100.0%) |
| 15 Years | 28 (52.8%) | 71 (100.0%) |
| 16 and 17 Years | 114 (93.4%) | 303 (91.5%) |
| 18 to 24 Years | 584 (98.3%) | 487 (96.8%) |
| 25 to 34 Years | 896 (99.5%) | 748 (94.4%) |
| 35 to 44 Years | 914 (96.7%) | 768 (97.2%) |
| 45 to 54 Years | 1,080 (94.4%) | 1,360 (95.2%) |
| 55 to 64 Years | 1,043 (93.9%) | 1,142 (98.3%) |
| 65 to 74 Years | 805 (100.0%) | 630 (91.0%) |
| 75 Years and over | 488 (97.0%) | 787 (91.0%) |
| Total | 7,514 (96.5%) | 7,509 (94.9%) |
Income Below Poverty Among Married-Couple Families in Sayville
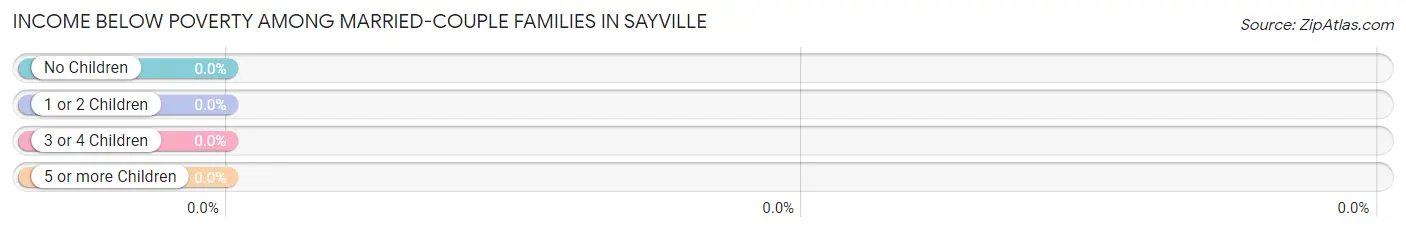
| Children | Above Poverty | Below Poverty |
| No Children | 1,898 (100.0%) | 0 (0.0%) |
| 1 or 2 Children | 1,168 (100.0%) | 0 (0.0%) |
| 3 or 4 Children | 356 (100.0%) | 0 (0.0%) |
| 5 or more Children | 0 (0.0%) | 0 (0.0%) |
| Total | 3,422 (100.0%) | 0 (0.0%) |
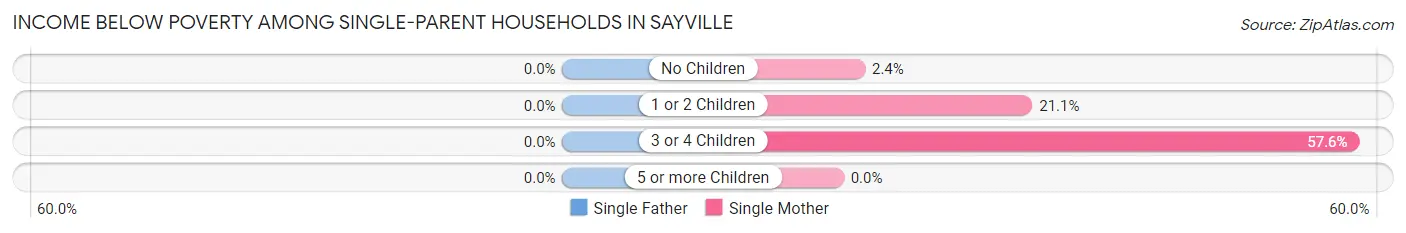
Income Below Poverty Among Single-Parent Households in Sayville
| Children | Single Father | Single Mother |
| No Children | 0 (0.0%) | 8 (2.4%) |
| 1 or 2 Children | 0 (0.0%) | 39 (21.1%) |
| 3 or 4 Children | 0 (0.0%) | 34 (57.6%) |
| 5 or more Children | 0 (0.0%) | 0 (0.0%) |
| Total | 0 (0.0%) | 81 (14.0%) |
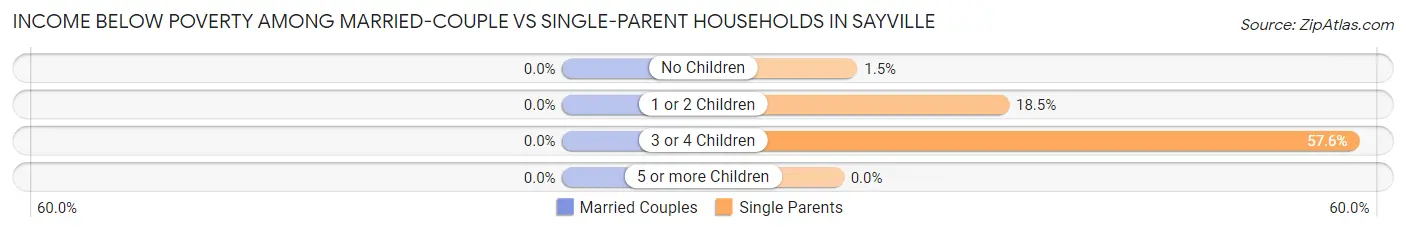
Income Below Poverty Among Married-Couple vs Single-Parent Households in Sayville
| Children | Married-Couple Families | Single-Parent Households |
| No Children | 0 (0.0%) | 8 (1.5%) |
| 1 or 2 Children | 0 (0.0%) | 39 (18.5%) |
| 3 or 4 Children | 0 (0.0%) | 34 (57.6%) |
| 5 or more Children | 0 (0.0%) | 0 (0.0%) |
| Total | 0 (0.0%) | 81 (10.2%) |
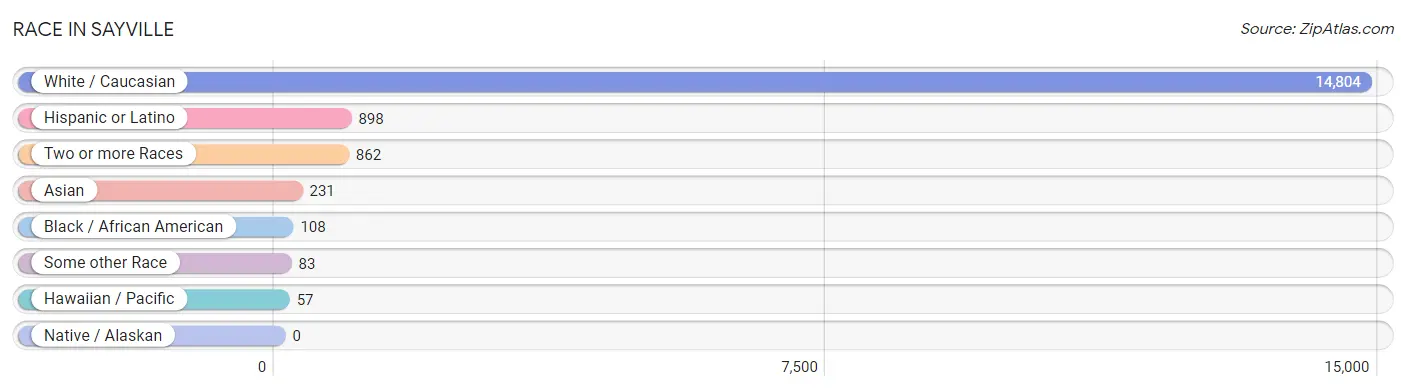
Race in Sayville
The most populous races in Sayville are White / Caucasian (14,804 | 91.7%), Hispanic or Latino (898 | 5.6%), and Two or more Races (862 | 5.3%).
| Race | # Population | % Population |
| Asian | 231 | 1.4% |
| Black / African American | 108 | 0.7% |
| Hawaiian / Pacific | 57 | 0.4% |
| Hispanic or Latino | 898 | 5.6% |
| Native / Alaskan | 0 | 0.0% |
| White / Caucasian | 14,804 | 91.7% |
| Two or more Races | 862 | 5.3% |
| Some other Race | 83 | 0.5% |
| Total | 16,145 | 100.0% |
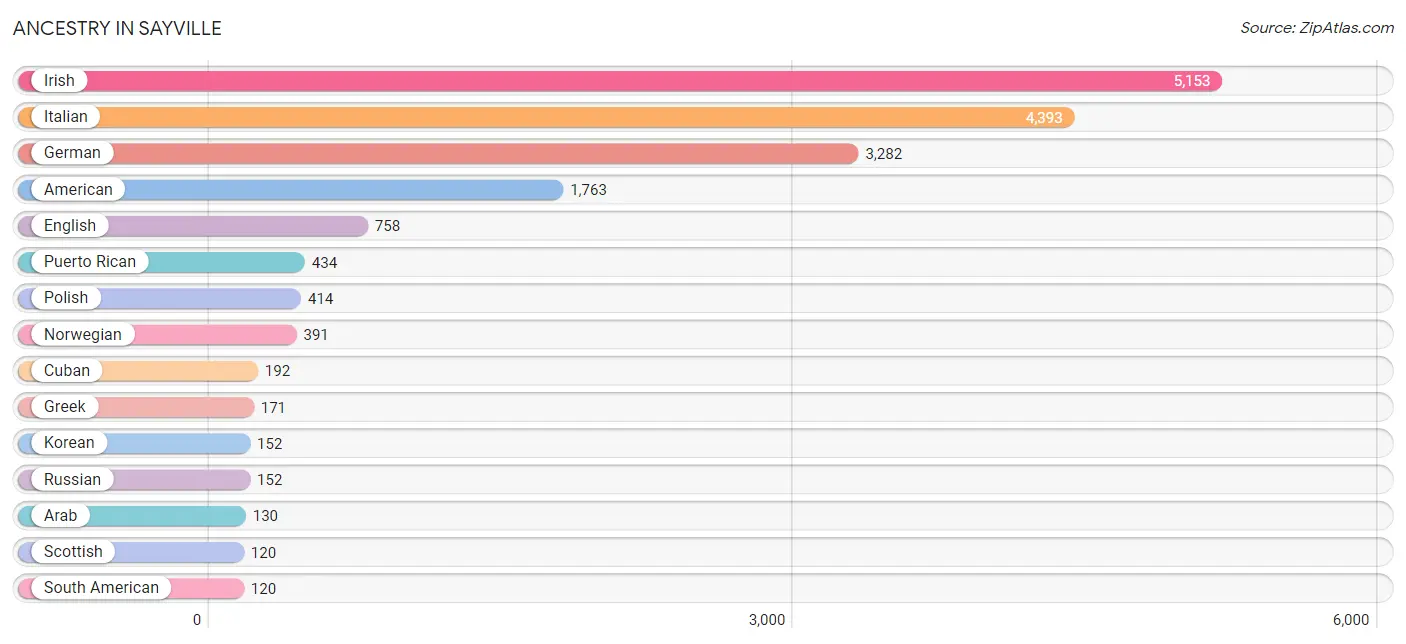
Ancestry in Sayville
The most populous ancestries reported in Sayville are Irish (5,153 | 31.9%), Italian (4,393 | 27.2%), German (3,282 | 20.3%), American (1,763 | 10.9%), and English (758 | 4.7%), together accounting for 95.1% of all Sayville residents.
| Ancestry | # Population | % Population |
| Albanian | 20 | 0.1% |
| American | 1,763 | 10.9% |
| Arab | 130 | 0.8% |
| Armenian | 30 | 0.2% |
| Austrian | 34 | 0.2% |
| Belgian | 12 | 0.1% |
| Brazilian | 25 | 0.2% |
| British | 35 | 0.2% |
| Burmese | 45 | 0.3% |
| Canadian | 83 | 0.5% |
| Celtic | 17 | 0.1% |
| Central American | 35 | 0.2% |
| Chilean | 43 | 0.3% |
| Colombian | 55 | 0.3% |
| Cuban | 192 | 1.2% |
| Czech | 69 | 0.4% |
| Czechoslovakian | 35 | 0.2% |
| Danish | 111 | 0.7% |
| Dutch | 111 | 0.7% |
| Eastern European | 37 | 0.2% |
| Ecuadorian | 17 | 0.1% |
| Egyptian | 106 | 0.7% |
| English | 758 | 4.7% |
| European | 63 | 0.4% |
| Finnish | 35 | 0.2% |
| French | 114 | 0.7% |
| French Canadian | 117 | 0.7% |
| German | 3,282 | 20.3% |
| Ghanaian | 1 | 0.0% |
| Greek | 171 | 1.1% |
| Guatemalan | 35 | 0.2% |
| Hungarian | 33 | 0.2% |
| Icelander | 18 | 0.1% |
| Indian (Asian) | 14 | 0.1% |
| Irish | 5,153 | 31.9% |
| Iroquois | 97 | 0.6% |
| Italian | 4,393 | 27.2% |
| Jamaican | 33 | 0.2% |
| Korean | 152 | 0.9% |
| Latvian | 43 | 0.3% |
| Lebanese | 17 | 0.1% |
| Lithuanian | 81 | 0.5% |
| Maltese | 51 | 0.3% |
| Mexican | 27 | 0.2% |
| Native Hawaiian | 57 | 0.4% |
| Northern European | 25 | 0.2% |
| Norwegian | 391 | 2.4% |
| Pennsylvania German | 7 | 0.0% |
| Peruvian | 5 | 0.0% |
| Polish | 414 | 2.6% |
| Portuguese | 68 | 0.4% |
| Puerto Rican | 434 | 2.7% |
| Romanian | 9 | 0.1% |
| Russian | 152 | 0.9% |
| Scotch-Irish | 18 | 0.1% |
| Scottish | 120 | 0.7% |
| Slavic | 20 | 0.1% |
| Slovak | 18 | 0.1% |
| South American | 120 | 0.7% |
| Spaniard | 30 | 0.2% |
| Spanish | 53 | 0.3% |
| Subsaharan African | 1 | 0.0% |
| Swedish | 69 | 0.4% |
| Swiss | 15 | 0.1% |
| Syrian | 7 | 0.0% |
| Thai | 99 | 0.6% |
| Ukrainian | 75 | 0.5% | View All 67 Rows |
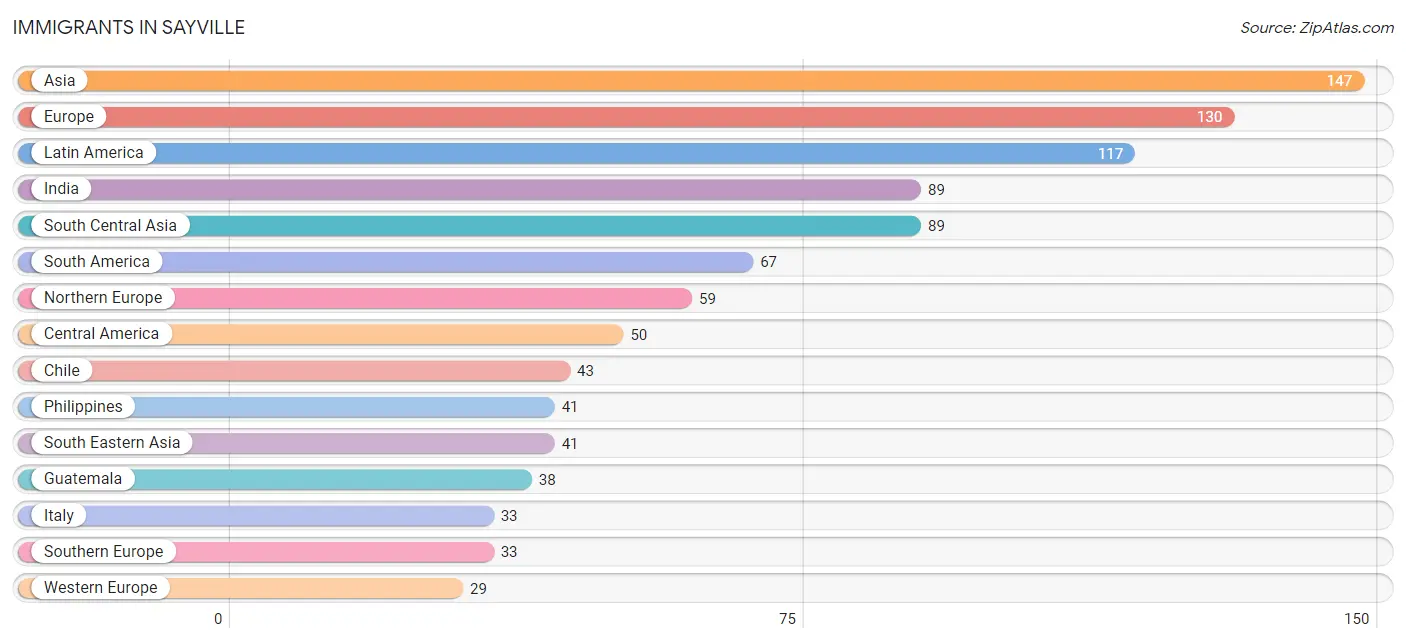
Immigrants in Sayville
The most numerous immigrant groups reported in Sayville came from Asia (147 | 0.9%), Europe (130 | 0.8%), Latin America (117 | 0.7%), India (89 | 0.5%), and South Central Asia (89 | 0.5%), together accounting for 3.5% of all Sayville residents.
| Immigration Origin | # Population | % Population |
| Africa | 1 | 0.0% |
| Asia | 147 | 0.9% |
| Austria | 20 | 0.1% |
| Brazil | 12 | 0.1% |
| Canada | 14 | 0.1% |
| Central America | 50 | 0.3% |
| Chile | 43 | 0.3% |
| China | 5 | 0.0% |
| Denmark | 21 | 0.1% |
| Eastern Asia | 17 | 0.1% |
| Eastern Europe | 9 | 0.1% |
| Ecuador | 7 | 0.0% |
| El Salvador | 11 | 0.1% |
| England | 12 | 0.1% |
| Europe | 130 | 0.8% |
| France | 6 | 0.0% |
| Germany | 3 | 0.0% |
| Ghana | 1 | 0.0% |
| Guatemala | 38 | 0.2% |
| India | 89 | 0.5% |
| Ireland | 8 | 0.1% |
| Italy | 33 | 0.2% |
| Korea | 12 | 0.1% |
| Latin America | 117 | 0.7% |
| Mexico | 1 | 0.0% |
| Northern Europe | 59 | 0.4% |
| Peru | 5 | 0.0% |
| Philippines | 41 | 0.3% |
| Romania | 9 | 0.1% |
| South America | 67 | 0.4% |
| South Central Asia | 89 | 0.5% |
| South Eastern Asia | 41 | 0.3% |
| Southern Europe | 33 | 0.2% |
| Taiwan | 5 | 0.0% |
| Western Africa | 1 | 0.0% |
| Western Europe | 29 | 0.2% | View All 36 Rows |
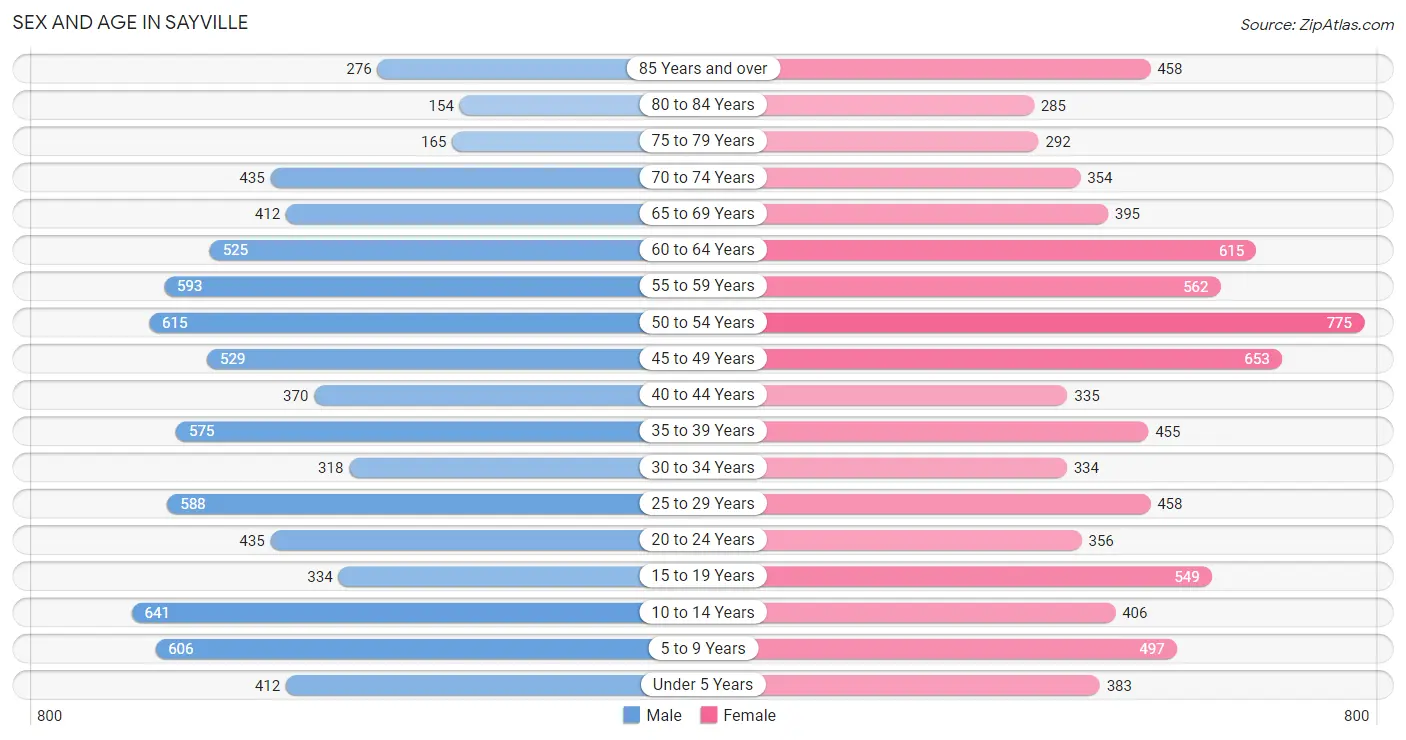
Sex and Age in Sayville
Sex and Age in Sayville
The most populous age groups in Sayville are 10 to 14 Years (641 | 8.0%) for men and 50 to 54 Years (775 | 9.5%) for women.
| Age Bracket | Male | Female |
| Under 5 Years | 412 (5.2%) | 383 (4.7%) |
| 5 to 9 Years | 606 (7.6%) | 497 (6.1%) |
| 10 to 14 Years | 641 (8.0%) | 406 (5.0%) |
| 15 to 19 Years | 334 (4.2%) | 549 (6.7%) |
| 20 to 24 Years | 435 (5.4%) | 356 (4.4%) |
| 25 to 29 Years | 588 (7.4%) | 458 (5.6%) |
| 30 to 34 Years | 318 (4.0%) | 334 (4.1%) |
| 35 to 39 Years | 575 (7.2%) | 455 (5.6%) |
| 40 to 44 Years | 370 (4.6%) | 335 (4.1%) |
| 45 to 49 Years | 529 (6.6%) | 653 (8.0%) |
| 50 to 54 Years | 615 (7.7%) | 775 (9.5%) |
| 55 to 59 Years | 593 (7.4%) | 562 (6.9%) |
| 60 to 64 Years | 525 (6.6%) | 615 (7.5%) |
| 65 to 69 Years | 412 (5.2%) | 395 (4.8%) |
| 70 to 74 Years | 435 (5.4%) | 354 (4.3%) |
| 75 to 79 Years | 165 (2.1%) | 292 (3.6%) |
| 80 to 84 Years | 154 (1.9%) | 285 (3.5%) |
| 85 Years and over | 276 (3.5%) | 458 (5.6%) |
| Total | 7,983 (100.0%) | 8,162 (100.0%) |
Families and Households in Sayville
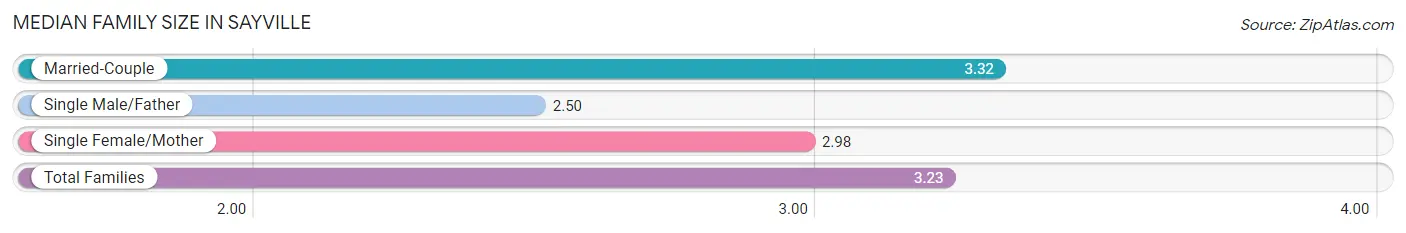
Median Family Size in Sayville
The median family size in Sayville is 3.23 persons per family, with married-couple families (3,422 | 81.2%) accounting for the largest median family size of 3.32 persons per family. On the other hand, single male/father families (215 | 5.1%) represent the smallest median family size with 2.50 persons per family.
| Family Type | # Families | Family Size |
| Married-Couple | 3,422 (81.2%) | 3.32 |
| Single Male/Father | 215 (5.1%) | 2.50 |
| Single Female/Mother | 579 (13.7%) | 2.98 |
| Total Families | 4,216 (100.0%) | 3.23 |
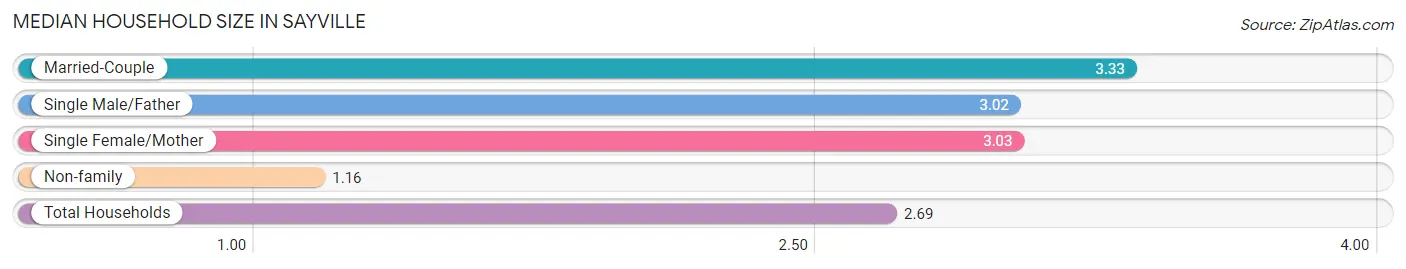
Median Household Size in Sayville
The median household size in Sayville is 2.69 persons per household, with married-couple households (3,422 | 58.7%) accounting for the largest median household size of 3.33 persons per household. non-family households (1,616 | 27.7%) represent the smallest median household size with 1.16 persons per household.
| Household Type | # Households | Household Size |
| Married-Couple | 3,422 (58.7%) | 3.33 |
| Single Male/Father | 215 (3.7%) | 3.02 |
| Single Female/Mother | 579 (9.9%) | 3.03 |
| Non-family | 1,616 (27.7%) | 1.16 |
| Total Households | 5,832 (100.0%) | 2.69 |
Household Size by Marriage Status in Sayville
Out of a total of 5,832 households in Sayville, 4,216 (72.3%) are family households, while 1,616 (27.7%) are nonfamily households. The most numerous type of family households are 2-person households, comprising 1,650, and the most common type of nonfamily households are 1-person households, comprising 1,395.
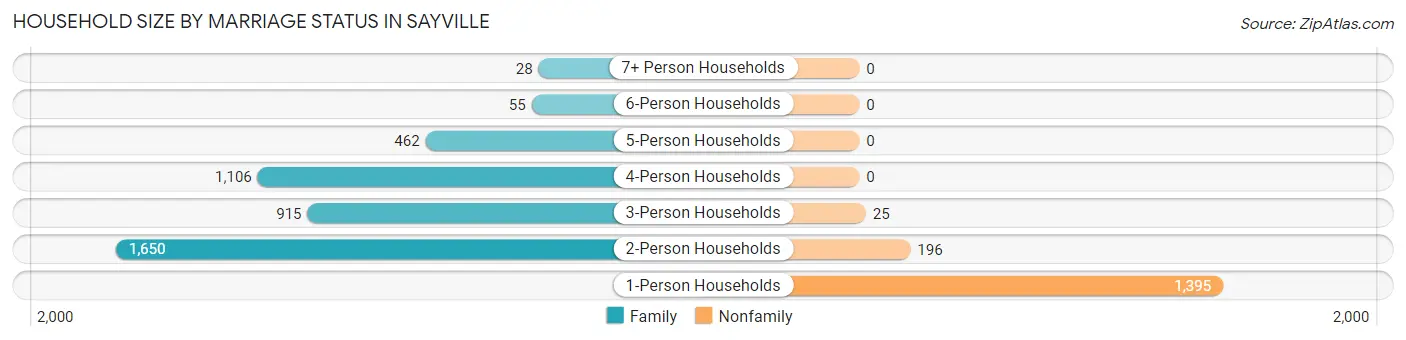
| Household Size | Family Households | Nonfamily Households |
| 1-Person Households | - | 1,395 (23.9%) |
| 2-Person Households | 1,650 (28.3%) | 196 (3.4%) |
| 3-Person Households | 915 (15.7%) | 25 (0.4%) |
| 4-Person Households | 1,106 (19.0%) | 0 (0.0%) |
| 5-Person Households | 462 (7.9%) | 0 (0.0%) |
| 6-Person Households | 55 (0.9%) | 0 (0.0%) |
| 7+ Person Households | 28 (0.5%) | 0 (0.0%) |
| Total | 4,216 (72.3%) | 1,616 (27.7%) |
Female Fertility in Sayville
Fertility by Age in Sayville
Average fertility rate in Sayville is 69.0 births per 1,000 women. Women in the age bracket of 20 to 34 years have the highest fertility rate with 104.0 births per 1,000 women. Women in the age bracket of 20 to 34 years acount for 52.9% of all women with births.
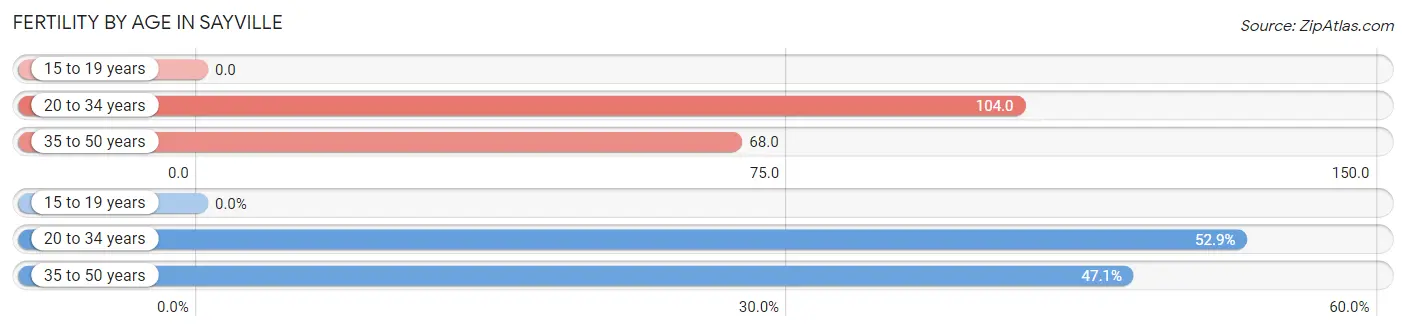
| Age Bracket | Women with Births | Births / 1,000 Women |
| 15 to 19 years | 0 (0.0%) | 0.0 |
| 20 to 34 years | 119 (52.9%) | 104.0 |
| 35 to 50 years | 106 (47.1%) | 68.0 |
| Total | 225 (100.0%) | 69.0 |
Fertility by Age by Marriage Status in Sayville
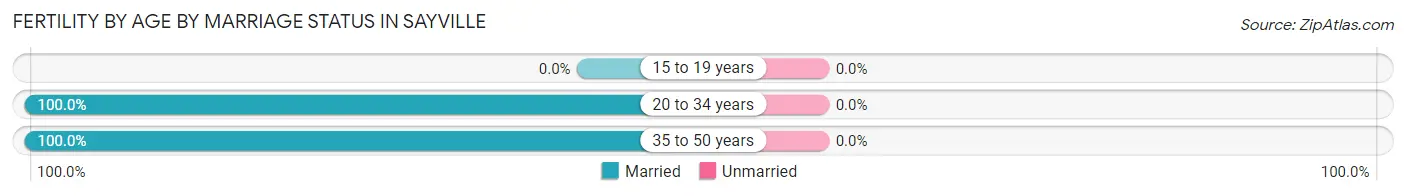
| Age Bracket | Married | Unmarried |
| 15 to 19 years | 0 (0.0%) | 0 (0.0%) |
| 20 to 34 years | 119 (100.0%) | 0 (0.0%) |
| 35 to 50 years | 106 (100.0%) | 0 (0.0%) |
| Total | 225 (100.0%) | 0 (0.0%) |
Fertility by Education in Sayville
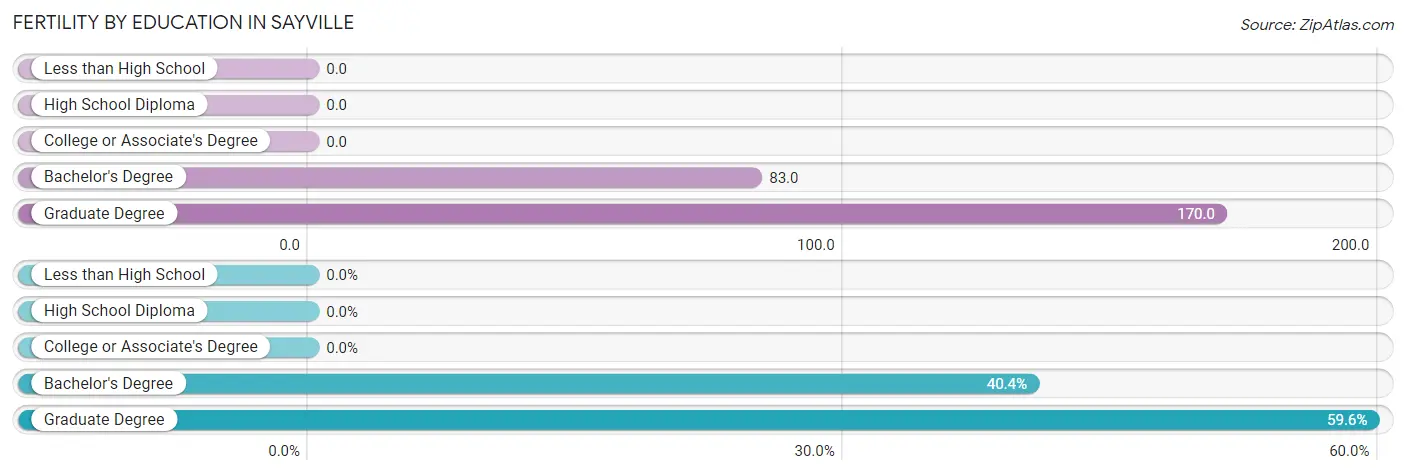
| Educational Attainment | Women with Births | Births / 1,000 Women |
| Less than High School | 0 (0.0%) | 0.0 |
| High School Diploma | 0 (0.0%) | 0.0 |
| College or Associate's Degree | 0 (0.0%) | 0.0 |
| Bachelor's Degree | 91 (40.4%) | 83.0 |
| Graduate Degree | 134 (59.6%) | 170.0 |
| Total | 225 (100.0%) | 69.0 |
Fertility by Education by Marriage Status in Sayville
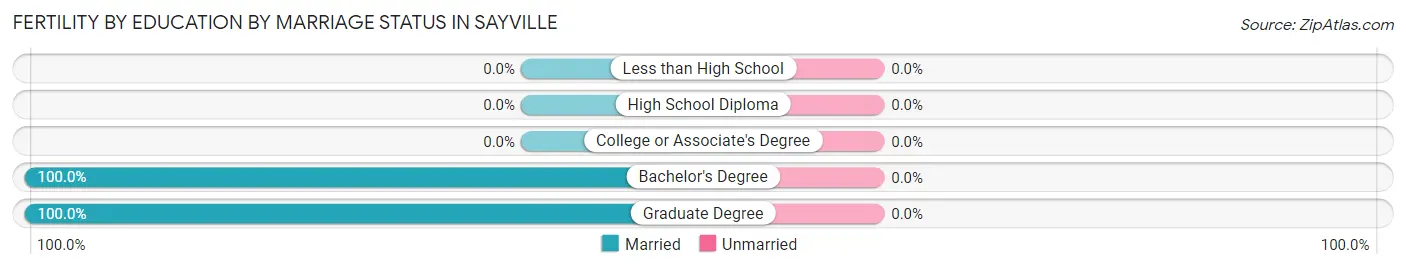
| Educational Attainment | Married | Unmarried |
| Less than High School | 0 (0.0%) | 0 (0.0%) |
| High School Diploma | 0 (0.0%) | 0 (0.0%) |
| College or Associate's Degree | 0 (0.0%) | 0 (0.0%) |
| Bachelor's Degree | 91 (100.0%) | 0 (0.0%) |
| Graduate Degree | 134 (100.0%) | 0 (0.0%) |
| Total | 225 (100.0%) | 0 (0.0%) |
Employment Characteristics in Sayville
Employment by Class of Employer in Sayville
Among the 8,079 employed individuals in Sayville, private company employees (4,557 | 56.4%), local government employees (1,533 | 19.0%), and not-for-profit organizations (780 | 9.7%) make up the most common classes of employment.
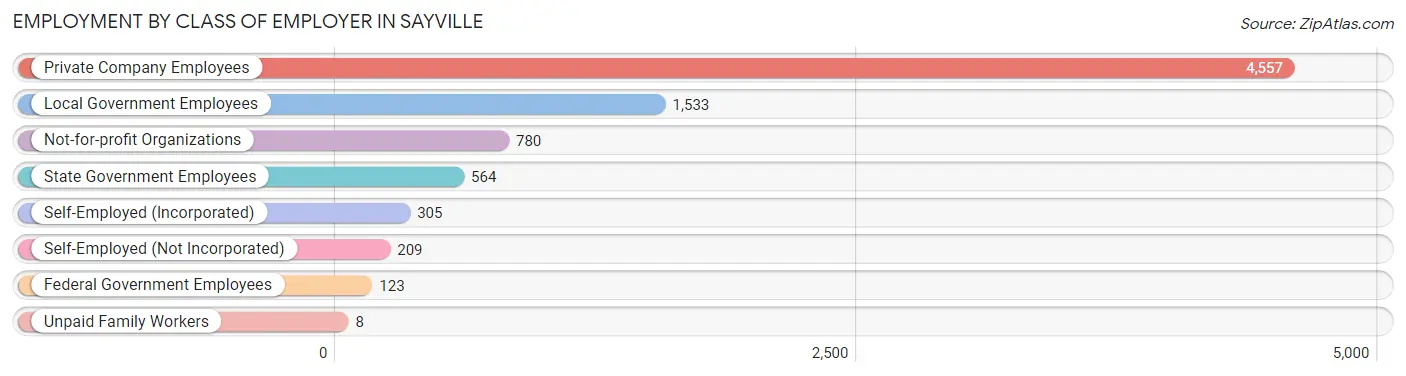
| Employer Class | # Employees | % Employees |
| Private Company Employees | 4,557 | 56.4% |
| Self-Employed (Incorporated) | 305 | 3.8% |
| Self-Employed (Not Incorporated) | 209 | 2.6% |
| Not-for-profit Organizations | 780 | 9.7% |
| Local Government Employees | 1,533 | 19.0% |
| State Government Employees | 564 | 7.0% |
| Federal Government Employees | 123 | 1.5% |
| Unpaid Family Workers | 8 | 0.1% |
| Total | 8,079 | 100.0% |
Employment Status by Age in Sayville
According to the labor force statistics for Sayville, out of the total population over 16 years of age (13,076), 63.4% or 8,290 individuals are in the labor force, with 1.9% or 158 of them unemployed. The age group with the highest labor force participation rate is 30 to 34 years, with 91.0% or 593 individuals in the labor force. Within the labor force, the 16 to 19 years age range has the highest percentage of unemployed individuals, with 10.0% or 25 of them being unemployed.
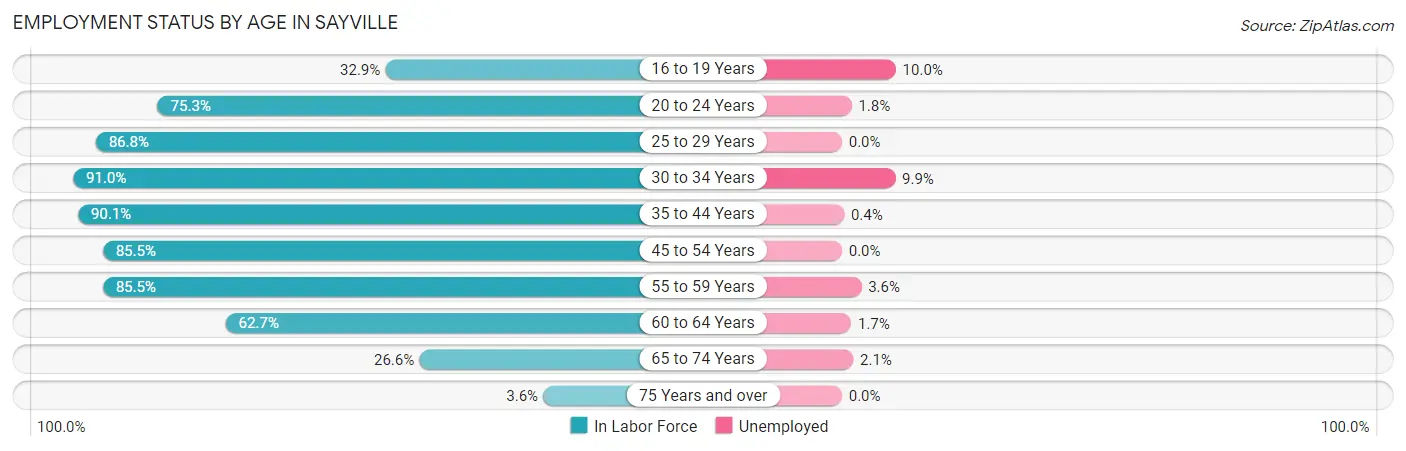
| Age Bracket | In Labor Force | Unemployed |
| 16 to 19 Years | 250 (32.9%) | 25 (10.0%) |
| 20 to 24 Years | 596 (75.3%) | 11 (1.8%) |
| 25 to 29 Years | 908 (86.8%) | 0 (0.0%) |
| 30 to 34 Years | 593 (91.0%) | 59 (9.9%) |
| 35 to 44 Years | 1,563 (90.1%) | 6 (0.4%) |
| 45 to 54 Years | 2,199 (85.5%) | 0 (0.0%) |
| 55 to 59 Years | 988 (85.5%) | 36 (3.6%) |
| 60 to 64 Years | 715 (62.7%) | 12 (1.7%) |
| 65 to 74 Years | 425 (26.6%) | 9 (2.1%) |
| 75 Years and over | 59 (3.6%) | 0 (0.0%) |
| Total | 8,290 (63.4%) | 158 (1.9%) |
Employment Status by Educational Attainment in Sayville
According to labor force statistics for Sayville, 83.9% of individuals (6,964) out of the total population between 25 and 64 years of age (8,300) are in the labor force, with 1.6% or 111 of them being unemployed. The group with the highest labor force participation rate are those with the educational attainment of bachelor's degree or higher, with 89.4% or 4,343 individuals in the labor force. Within the labor force, individuals with high school diploma education have the highest percentage of unemployment, with 5.4% or 43 of them being unemployed.
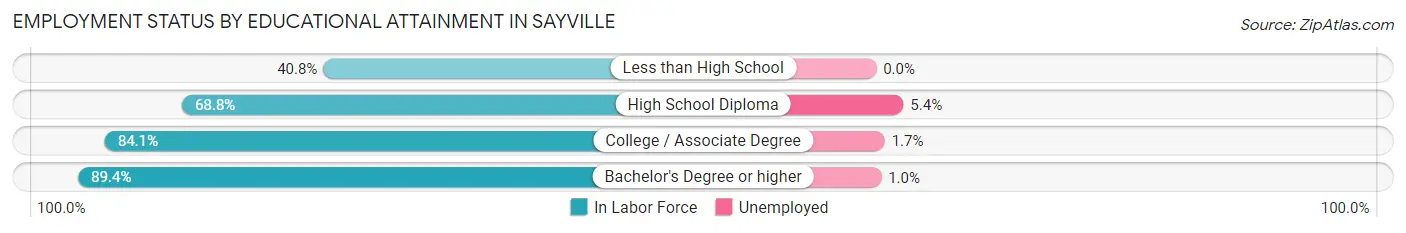
| Educational Attainment | In Labor Force | Unemployed |
| Less than High School | 89 (40.8%) | 0 (0.0%) |
| High School Diploma | 803 (68.8%) | 63 (5.4%) |
| College / Associate Degree | 1,730 (84.1%) | 35 (1.7%) |
| Bachelor's Degree or higher | 4,343 (89.4%) | 49 (1.0%) |
| Total | 6,964 (83.9%) | 133 (1.6%) |
Employment Occupations by Sex in Sayville
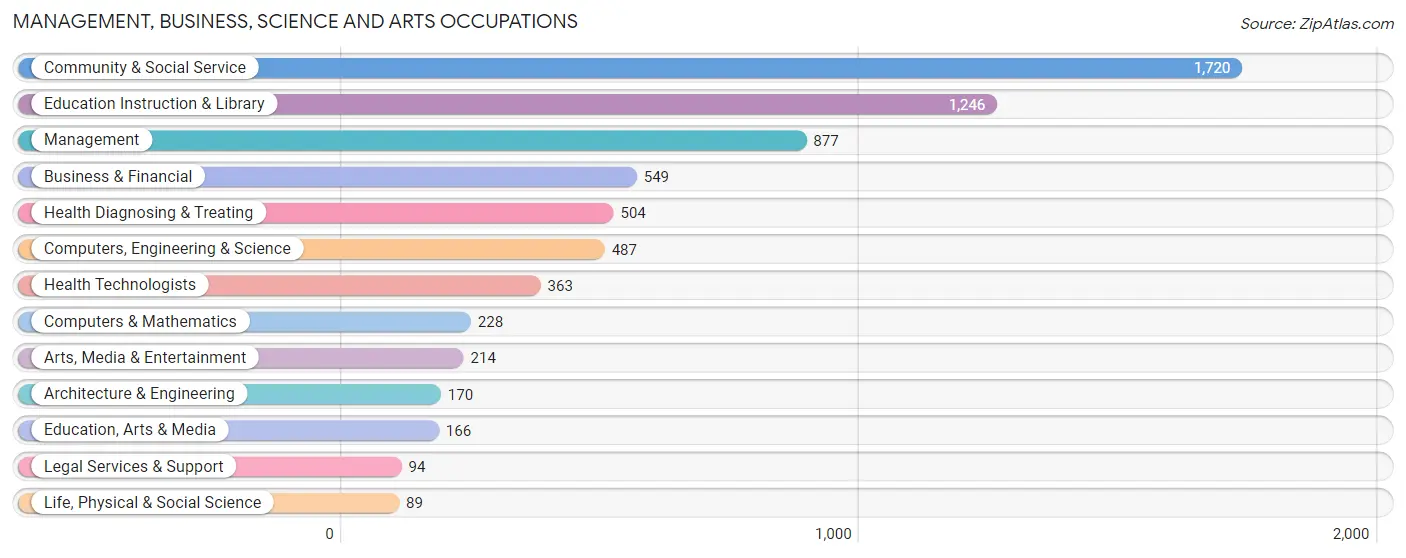
Management, Business, Science and Arts Occupations
The most common Management, Business, Science and Arts occupations in Sayville are Community & Social Service (1,720 | 21.2%), Education Instruction & Library (1,246 | 15.3%), Management (877 | 10.8%), Business & Financial (549 | 6.8%), and Health Diagnosing & Treating (504 | 6.2%).
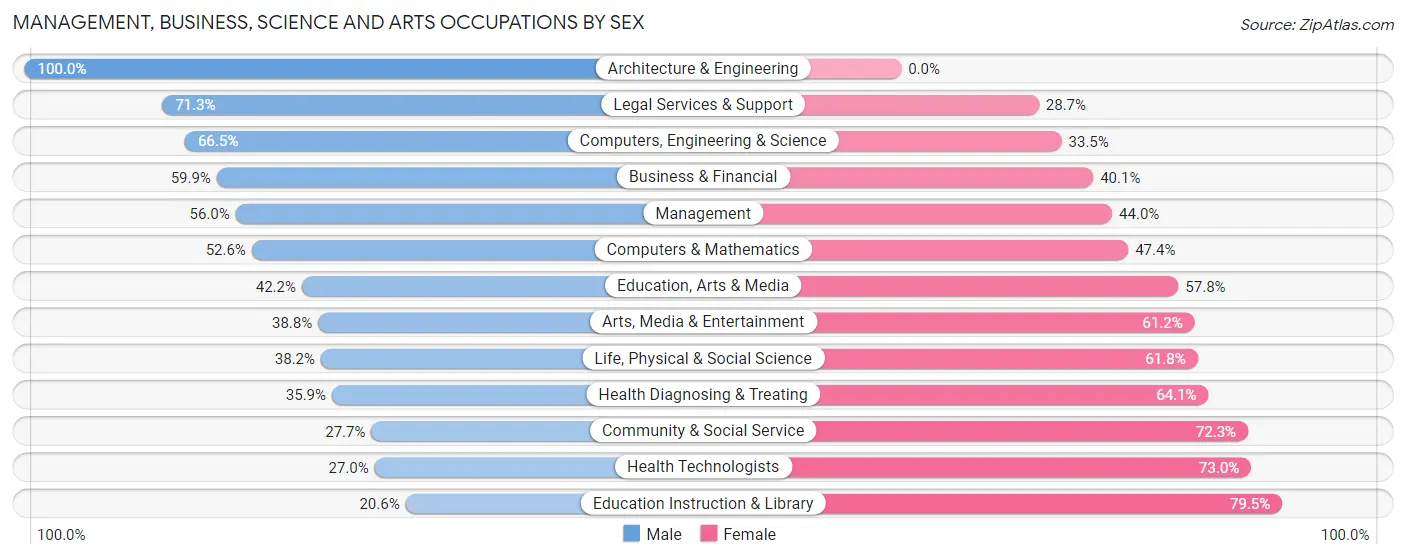
Management, Business, Science and Arts Occupations by Sex
Within the Management, Business, Science and Arts occupations in Sayville, the most male-oriented occupations are Architecture & Engineering (100.0%), Legal Services & Support (71.3%), and Computers, Engineering & Science (66.5%), while the most female-oriented occupations are Education Instruction & Library (79.4%), Health Technologists (73.0%), and Community & Social Service (72.3%).
| Occupation | Male | Female |
| Management | 491 (56.0%) | 386 (44.0%) |
| Business & Financial | 329 (59.9%) | 220 (40.1%) |
| Computers, Engineering & Science | 324 (66.5%) | 163 (33.5%) |
| Computers & Mathematics | 120 (52.6%) | 108 (47.4%) |
| Architecture & Engineering | 170 (100.0%) | 0 (0.0%) |
| Life, Physical & Social Science | 34 (38.2%) | 55 (61.8%) |
| Community & Social Service | 476 (27.7%) | 1,244 (72.3%) |
| Education, Arts & Media | 70 (42.2%) | 96 (57.8%) |
| Legal Services & Support | 67 (71.3%) | 27 (28.7%) |
| Education Instruction & Library | 256 (20.5%) | 990 (79.4%) |
| Arts, Media & Entertainment | 83 (38.8%) | 131 (61.2%) |
| Health Diagnosing & Treating | 181 (35.9%) | 323 (64.1%) |
| Health Technologists | 98 (27.0%) | 265 (73.0%) |
| Total (Category) | 1,801 (43.5%) | 2,336 (56.5%) |
| Total (Overall) | 4,204 (51.7%) | 3,920 (48.2%) |
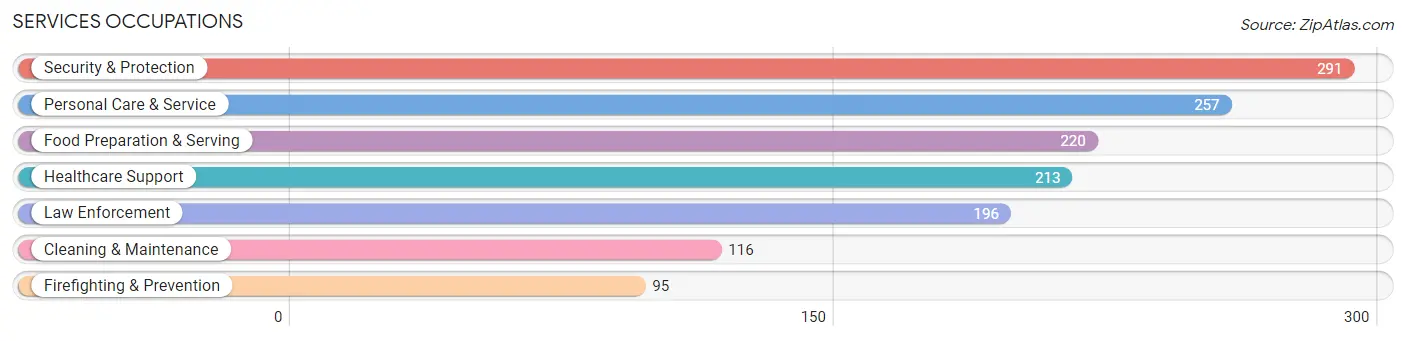
Services Occupations
The most common Services occupations in Sayville are Security & Protection (291 | 3.6%), Personal Care & Service (257 | 3.2%), Food Preparation & Serving (220 | 2.7%), Healthcare Support (213 | 2.6%), and Law Enforcement (196 | 2.4%).
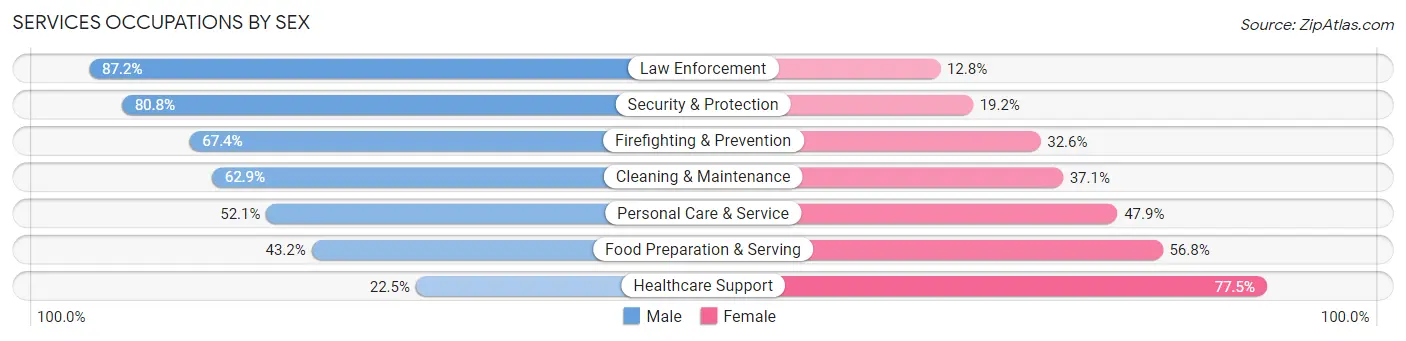
Services Occupations by Sex
Within the Services occupations in Sayville, the most male-oriented occupations are Law Enforcement (87.2%), Security & Protection (80.8%), and Firefighting & Prevention (67.4%), while the most female-oriented occupations are Healthcare Support (77.5%), Food Preparation & Serving (56.8%), and Personal Care & Service (47.9%).
| Occupation | Male | Female |
| Healthcare Support | 48 (22.5%) | 165 (77.5%) |
| Security & Protection | 235 (80.8%) | 56 (19.2%) |
| Firefighting & Prevention | 64 (67.4%) | 31 (32.6%) |
| Law Enforcement | 171 (87.2%) | 25 (12.8%) |
| Food Preparation & Serving | 95 (43.2%) | 125 (56.8%) |
| Cleaning & Maintenance | 73 (62.9%) | 43 (37.1%) |
| Personal Care & Service | 134 (52.1%) | 123 (47.9%) |
| Total (Category) | 585 (53.3%) | 512 (46.7%) |
| Total (Overall) | 4,204 (51.7%) | 3,920 (48.2%) |
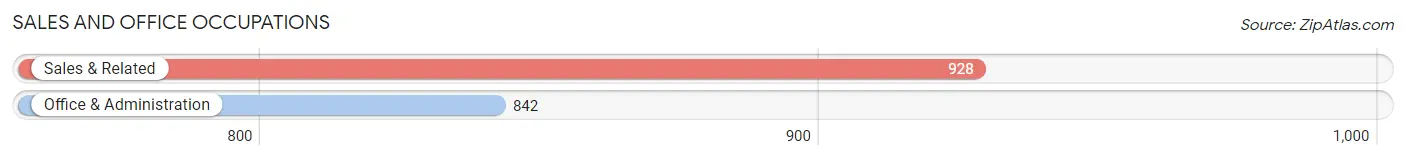
Sales and Office Occupations
The most common Sales and Office occupations in Sayville are Sales & Related (928 | 11.4%), and Office & Administration (842 | 10.4%).
Sales and Office Occupations by Sex
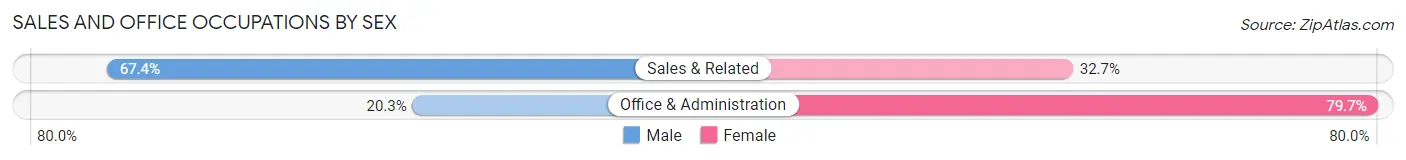
| Occupation | Male | Female |
| Sales & Related | 625 (67.3%) | 303 (32.7%) |
| Office & Administration | 171 (20.3%) | 671 (79.7%) |
| Total (Category) | 796 (45.0%) | 974 (55.0%) |
| Total (Overall) | 4,204 (51.7%) | 3,920 (48.2%) |
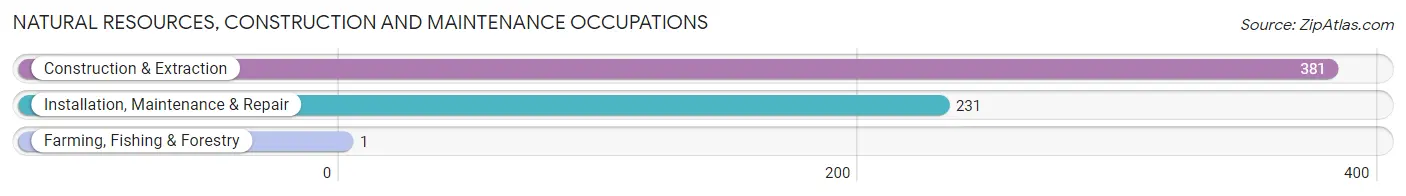
Natural Resources, Construction and Maintenance Occupations
The most common Natural Resources, Construction and Maintenance occupations in Sayville are Construction & Extraction (381 | 4.7%), Installation, Maintenance & Repair (231 | 2.8%), and Farming, Fishing & Forestry (1 | 0.0%).
Natural Resources, Construction and Maintenance Occupations by Sex
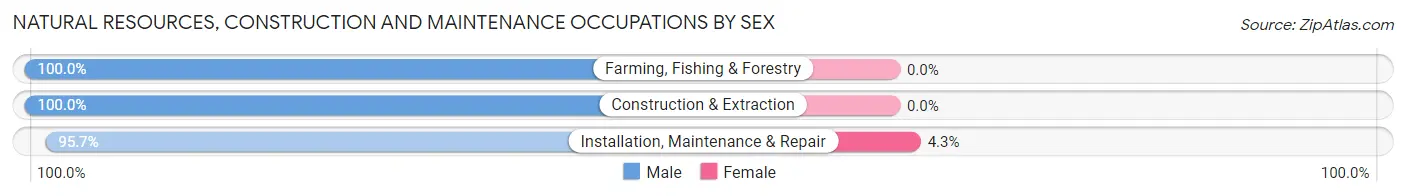
| Occupation | Male | Female |
| Farming, Fishing & Forestry | 1 (100.0%) | 0 (0.0%) |
| Construction & Extraction | 381 (100.0%) | 0 (0.0%) |
| Installation, Maintenance & Repair | 221 (95.7%) | 10 (4.3%) |
| Total (Category) | 603 (98.4%) | 10 (1.6%) |
| Total (Overall) | 4,204 (51.7%) | 3,920 (48.2%) |
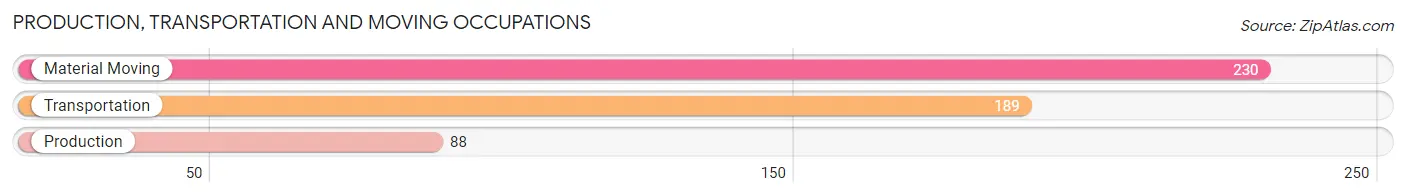
Production, Transportation and Moving Occupations
The most common Production, Transportation and Moving occupations in Sayville are Material Moving (230 | 2.8%), Transportation (189 | 2.3%), and Production (88 | 1.1%).
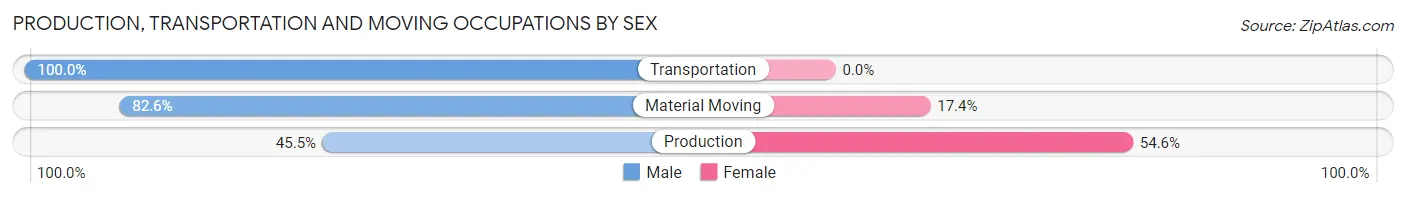
Production, Transportation and Moving Occupations by Sex
| Occupation | Male | Female |
| Production | 40 (45.5%) | 48 (54.5%) |
| Transportation | 189 (100.0%) | 0 (0.0%) |
| Material Moving | 190 (82.6%) | 40 (17.4%) |
| Total (Category) | 419 (82.6%) | 88 (17.4%) |
| Total (Overall) | 4,204 (51.7%) | 3,920 (48.2%) |
Employment Industries by Sex in Sayville
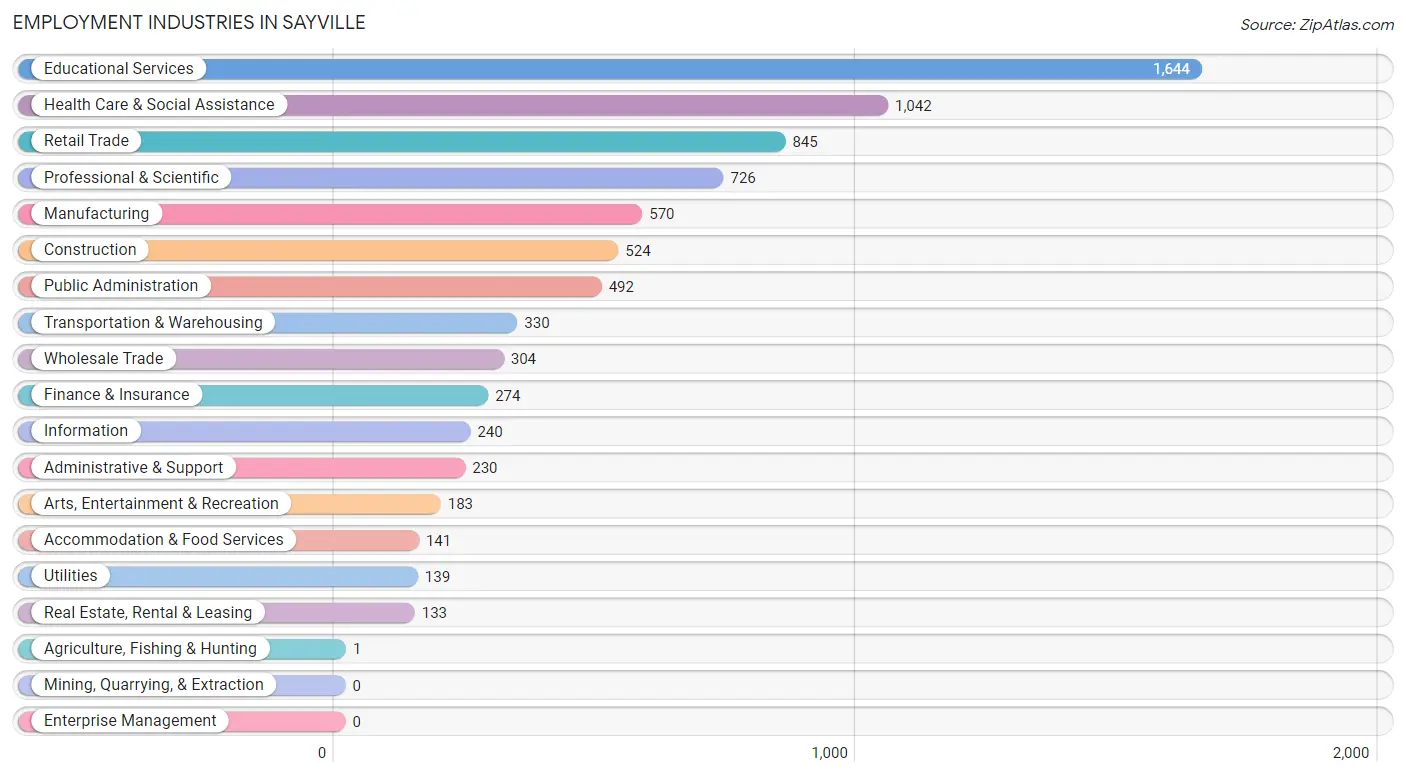
Employment Industries in Sayville
The major employment industries in Sayville include Educational Services (1,644 | 20.2%), Health Care & Social Assistance (1,042 | 12.8%), Retail Trade (845 | 10.4%), Professional & Scientific (726 | 8.9%), and Manufacturing (570 | 7.0%).
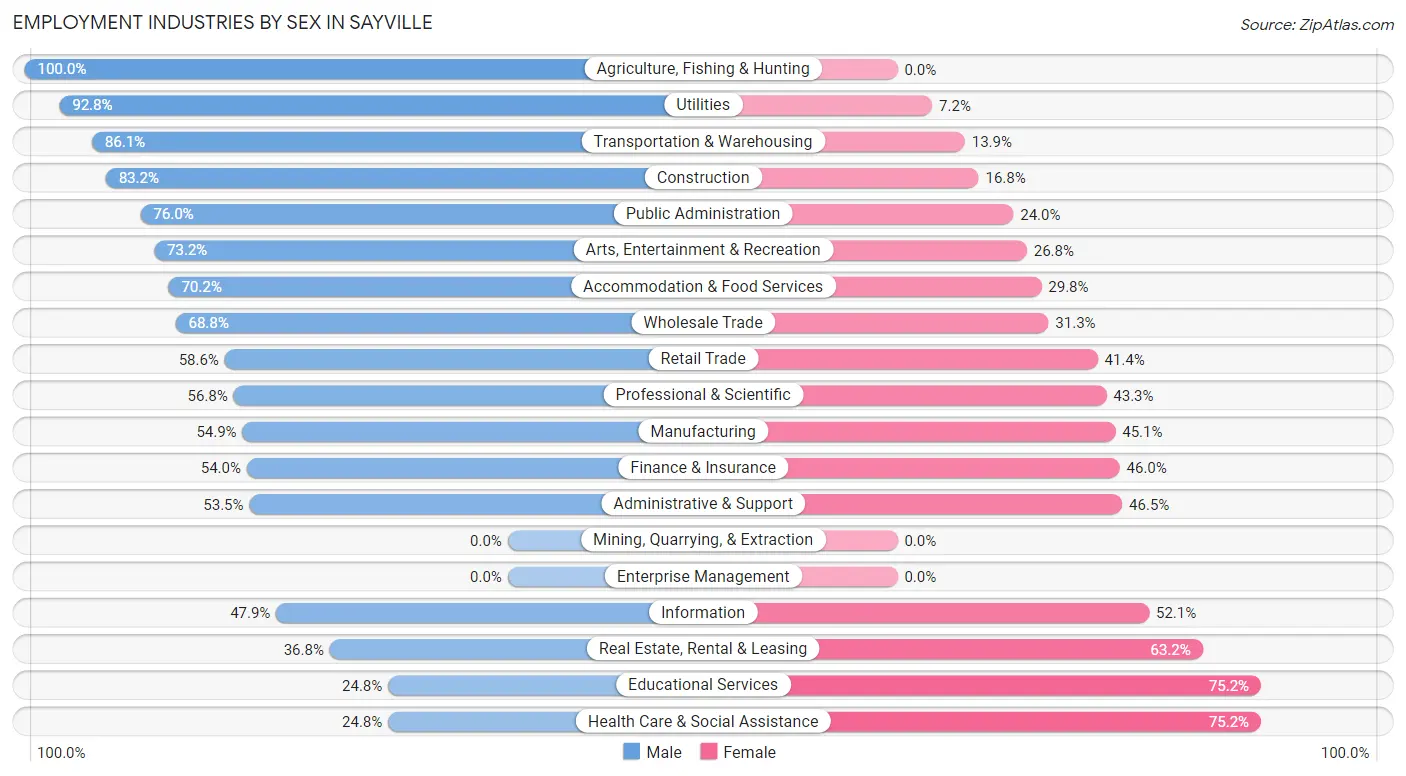
Employment Industries by Sex in Sayville
The Sayville industries that see more men than women are Agriculture, Fishing & Hunting (100.0%), Utilities (92.8%), and Transportation & Warehousing (86.1%), whereas the industries that tend to have a higher number of women are Educational Services (75.2%), Health Care & Social Assistance (75.2%), and Real Estate, Rental & Leasing (63.2%).
| Industry | Male | Female |
| Agriculture, Fishing & Hunting | 1 (100.0%) | 0 (0.0%) |
| Mining, Quarrying, & Extraction | 0 (0.0%) | 0 (0.0%) |
| Construction | 436 (83.2%) | 88 (16.8%) |
| Manufacturing | 313 (54.9%) | 257 (45.1%) |
| Wholesale Trade | 209 (68.8%) | 95 (31.2%) |
| Retail Trade | 495 (58.6%) | 350 (41.4%) |
| Transportation & Warehousing | 284 (86.1%) | 46 (13.9%) |
| Utilities | 129 (92.8%) | 10 (7.2%) |
| Information | 115 (47.9%) | 125 (52.1%) |
| Finance & Insurance | 148 (54.0%) | 126 (46.0%) |
| Real Estate, Rental & Leasing | 49 (36.8%) | 84 (63.2%) |
| Professional & Scientific | 412 (56.8%) | 314 (43.2%) |
| Enterprise Management | 0 (0.0%) | 0 (0.0%) |
| Administrative & Support | 123 (53.5%) | 107 (46.5%) |
| Educational Services | 407 (24.8%) | 1,237 (75.2%) |
| Health Care & Social Assistance | 258 (24.8%) | 784 (75.2%) |
| Arts, Entertainment & Recreation | 134 (73.2%) | 49 (26.8%) |
| Accommodation & Food Services | 99 (70.2%) | 42 (29.8%) |
| Public Administration | 374 (76.0%) | 118 (24.0%) |
| Total | 4,204 (51.7%) | 3,920 (48.2%) |
Education in Sayville
School Enrollment in Sayville
The most common levels of schooling among the 3,836 students in Sayville are elementary school (1,005 | 26.2%), middle school (871 | 22.7%), and high school (689 | 18.0%).
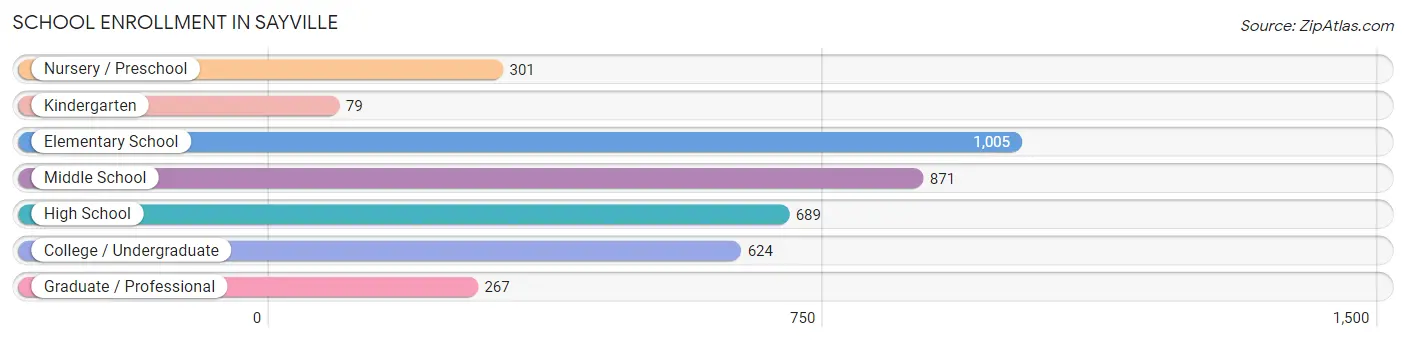
| School Level | # Students | % Students |
| Nursery / Preschool | 301 | 7.9% |
| Kindergarten | 79 | 2.1% |
| Elementary School | 1,005 | 26.2% |
| Middle School | 871 | 22.7% |
| High School | 689 | 18.0% |
| College / Undergraduate | 624 | 16.3% |
| Graduate / Professional | 267 | 7.0% |
| Total | 3,836 | 100.0% |
School Enrollment by Age by Funding Source in Sayville
Out of a total of 3,836 students who are enrolled in schools in Sayville, 644 (16.8%) attend a private institution, while the remaining 3,192 (83.2%) are enrolled in public schools. The age group of 18 to 19 year olds has the highest likelihood of being enrolled in private schools, with 129 (48.1% in the age bracket) enrolled. Conversely, the age group of 15 to 17 year olds has the lowest likelihood of being enrolled in a private school, with 496 (94.1% in the age bracket) attending a public institution.
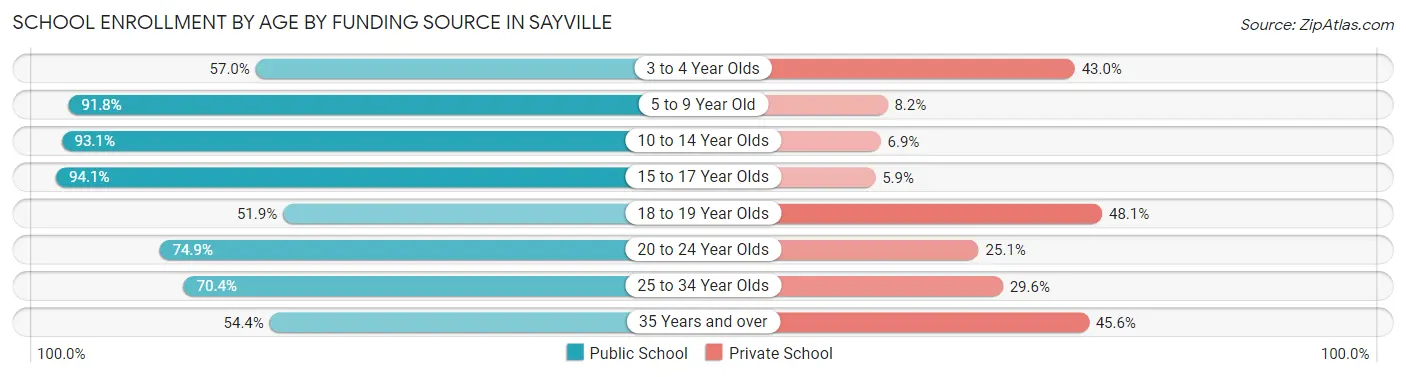
| Age Bracket | Public School | Private School |
| 3 to 4 Year Olds | 143 (57.0%) | 108 (43.0%) |
| 5 to 9 Year Old | 1,013 (91.8%) | 90 (8.2%) |
| 10 to 14 Year Olds | 934 (93.1%) | 69 (6.9%) |
| 15 to 17 Year Olds | 496 (94.1%) | 31 (5.9%) |
| 18 to 19 Year Olds | 139 (51.9%) | 129 (48.1%) |
| 20 to 24 Year Olds | 265 (74.9%) | 89 (25.1%) |
| 25 to 34 Year Olds | 95 (70.4%) | 40 (29.6%) |
| 35 Years and over | 106 (54.4%) | 89 (45.6%) |
| Total | 3,192 (83.2%) | 644 (16.8%) |
Educational Attainment by Field of Study in Sayville
Education (1,532 | 24.3%), business (1,247 | 19.8%), science & technology (483 | 7.6%), physical & health sciences (424 | 6.7%), and social sciences (412 | 6.5%) are the most common fields of study among 6,313 individuals in Sayville who have obtained a bachelor's degree or higher.
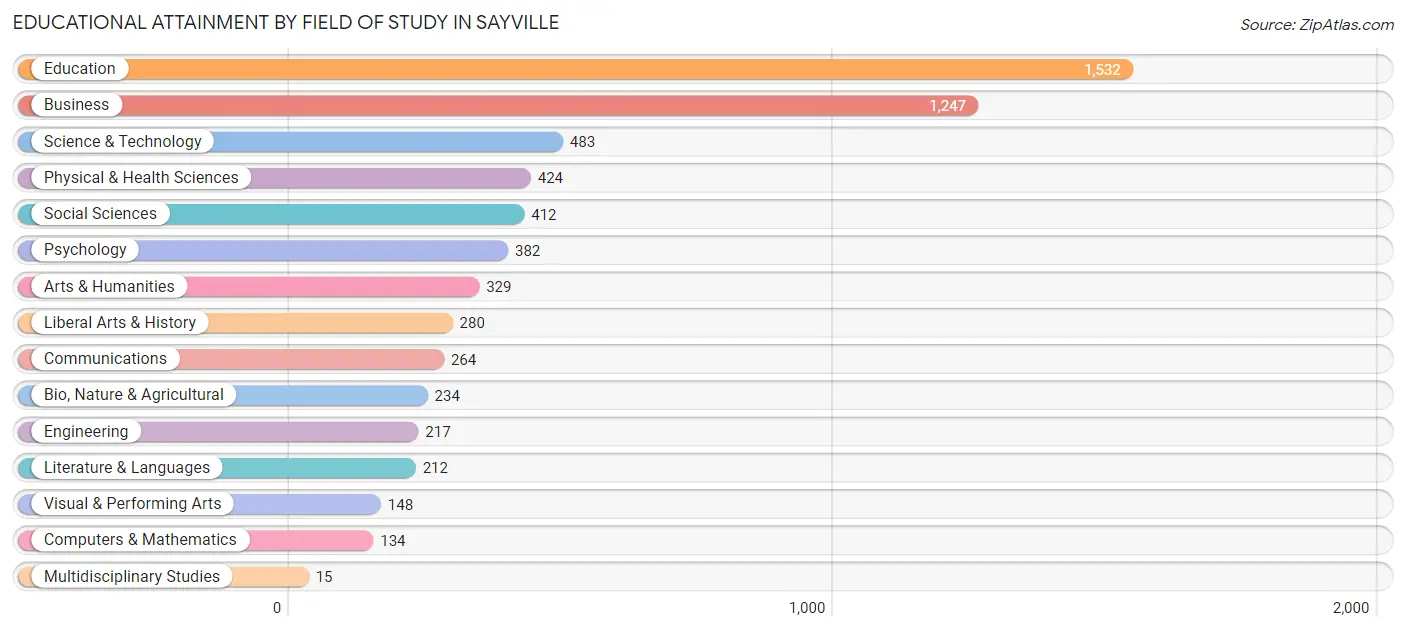
| Field of Study | # Graduates | % Graduates |
| Computers & Mathematics | 134 | 2.1% |
| Bio, Nature & Agricultural | 234 | 3.7% |
| Physical & Health Sciences | 424 | 6.7% |
| Psychology | 382 | 6.0% |
| Social Sciences | 412 | 6.5% |
| Engineering | 217 | 3.4% |
| Multidisciplinary Studies | 15 | 0.2% |
| Science & Technology | 483 | 7.6% |
| Business | 1,247 | 19.8% |
| Education | 1,532 | 24.3% |
| Literature & Languages | 212 | 3.4% |
| Liberal Arts & History | 280 | 4.4% |
| Visual & Performing Arts | 148 | 2.3% |
| Communications | 264 | 4.2% |
| Arts & Humanities | 329 | 5.2% |
| Total | 6,313 | 100.0% |
Transportation & Commute in Sayville
Vehicle Availability by Sex in Sayville
The most prevalent vehicle ownership categories in Sayville are males with 2 vehicles (1,841, accounting for 43.8%) and females with 2 vehicles (1,454, making up 47.6%).
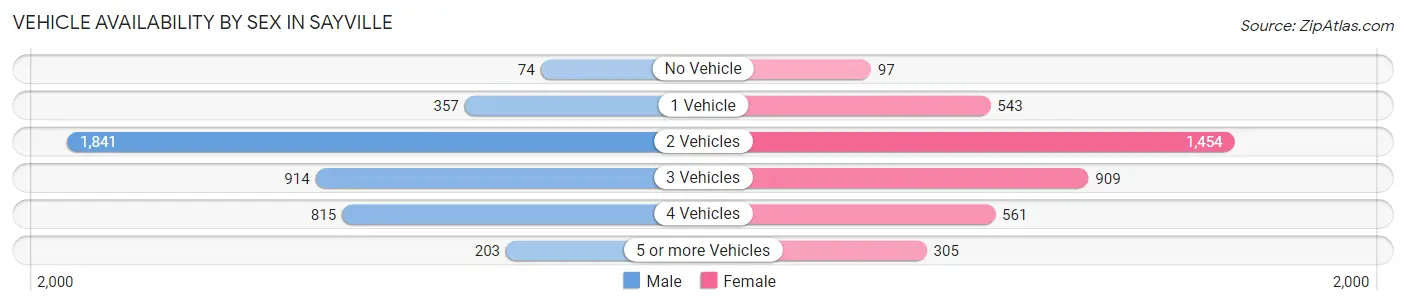
| Vehicles Available | Male | Female |
| No Vehicle | 74 (1.8%) | 97 (2.5%) |
| 1 Vehicle | 357 (8.5%) | 543 (14.0%) |
| 2 Vehicles | 1,841 (43.8%) | 1,454 (37.6%) |
| 3 Vehicles | 914 (21.7%) | 909 (23.5%) |
| 4 Vehicles | 815 (19.4%) | 561 (14.5%) |
| 5 or more Vehicles | 203 (4.8%) | 305 (7.9%) |
| Total | 4,204 (100.0%) | 3,869 (100.0%) |
Commute Time in Sayville
The most frequently occuring commute durations in Sayville are 30 to 34 minutes (1,286 commuters, 17.9%), 15 to 19 minutes (1,035 commuters, 14.4%), and 45 to 59 minutes (983 commuters, 13.7%).
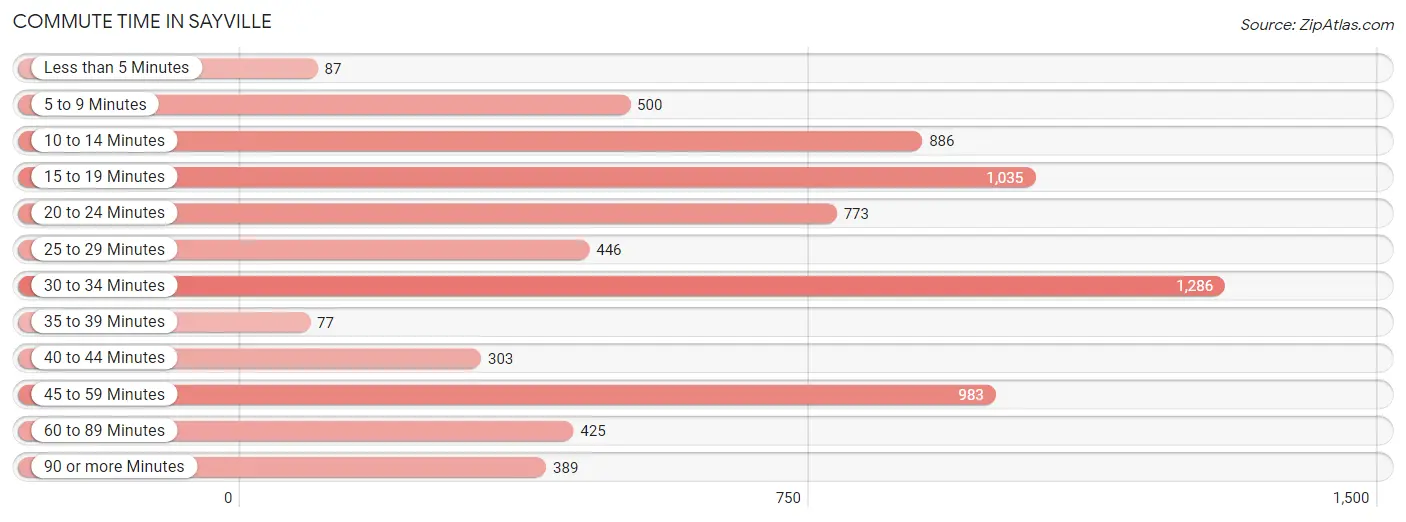
| Commute Time | # Commuters | % Commuters |
| Less than 5 Minutes | 87 | 1.2% |
| 5 to 9 Minutes | 500 | 7.0% |
| 10 to 14 Minutes | 886 | 12.3% |
| 15 to 19 Minutes | 1,035 | 14.4% |
| 20 to 24 Minutes | 773 | 10.7% |
| 25 to 29 Minutes | 446 | 6.2% |
| 30 to 34 Minutes | 1,286 | 17.9% |
| 35 to 39 Minutes | 77 | 1.1% |
| 40 to 44 Minutes | 303 | 4.2% |
| 45 to 59 Minutes | 983 | 13.7% |
| 60 to 89 Minutes | 425 | 5.9% |
| 90 or more Minutes | 389 | 5.4% |
Commute Time by Sex in Sayville
The most common commute times in Sayville are 30 to 34 minutes (688 commuters, 18.1%) for males and 30 to 34 minutes (598 commuters, 17.6%) for females.
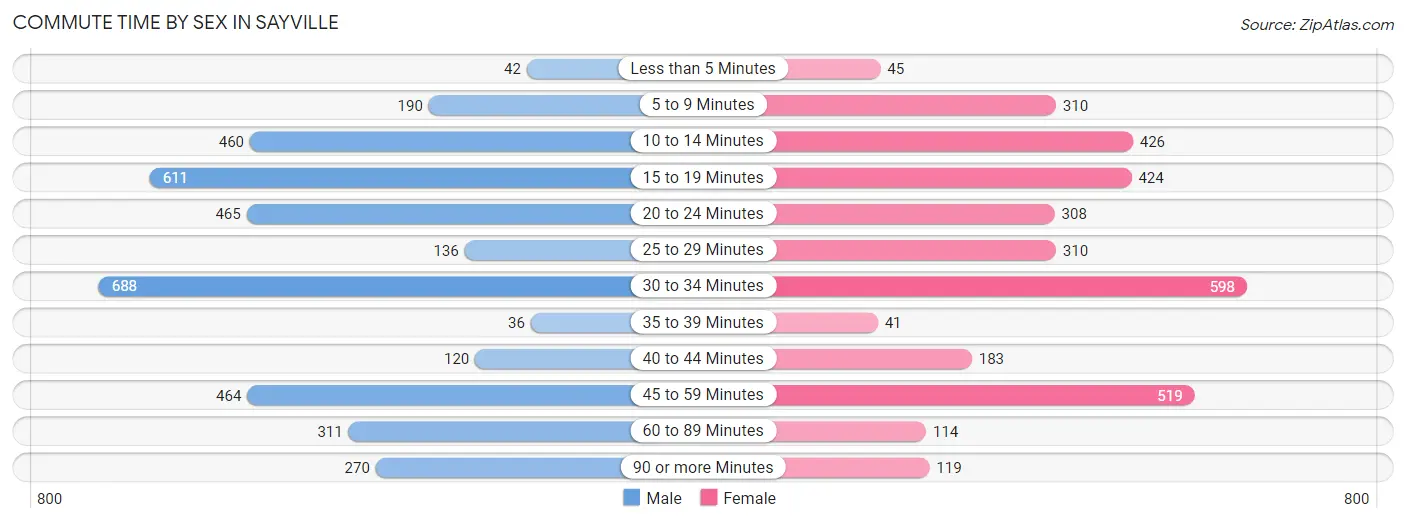
| Commute Time | Male | Female |
| Less than 5 Minutes | 42 (1.1%) | 45 (1.3%) |
| 5 to 9 Minutes | 190 (5.0%) | 310 (9.1%) |
| 10 to 14 Minutes | 460 (12.1%) | 426 (12.5%) |
| 15 to 19 Minutes | 611 (16.1%) | 424 (12.5%) |
| 20 to 24 Minutes | 465 (12.3%) | 308 (9.1%) |
| 25 to 29 Minutes | 136 (3.6%) | 310 (9.1%) |
| 30 to 34 Minutes | 688 (18.1%) | 598 (17.6%) |
| 35 to 39 Minutes | 36 (0.9%) | 41 (1.2%) |
| 40 to 44 Minutes | 120 (3.2%) | 183 (5.4%) |
| 45 to 59 Minutes | 464 (12.2%) | 519 (15.3%) |
| 60 to 89 Minutes | 311 (8.2%) | 114 (3.4%) |
| 90 or more Minutes | 270 (7.1%) | 119 (3.5%) |
Time of Departure to Work by Sex in Sayville
The most frequent times of departure to work in Sayville are 8:00 AM to 8:29 AM (674, 17.8%) for males and 7:00 AM to 7:29 AM (599, 17.6%) for females.
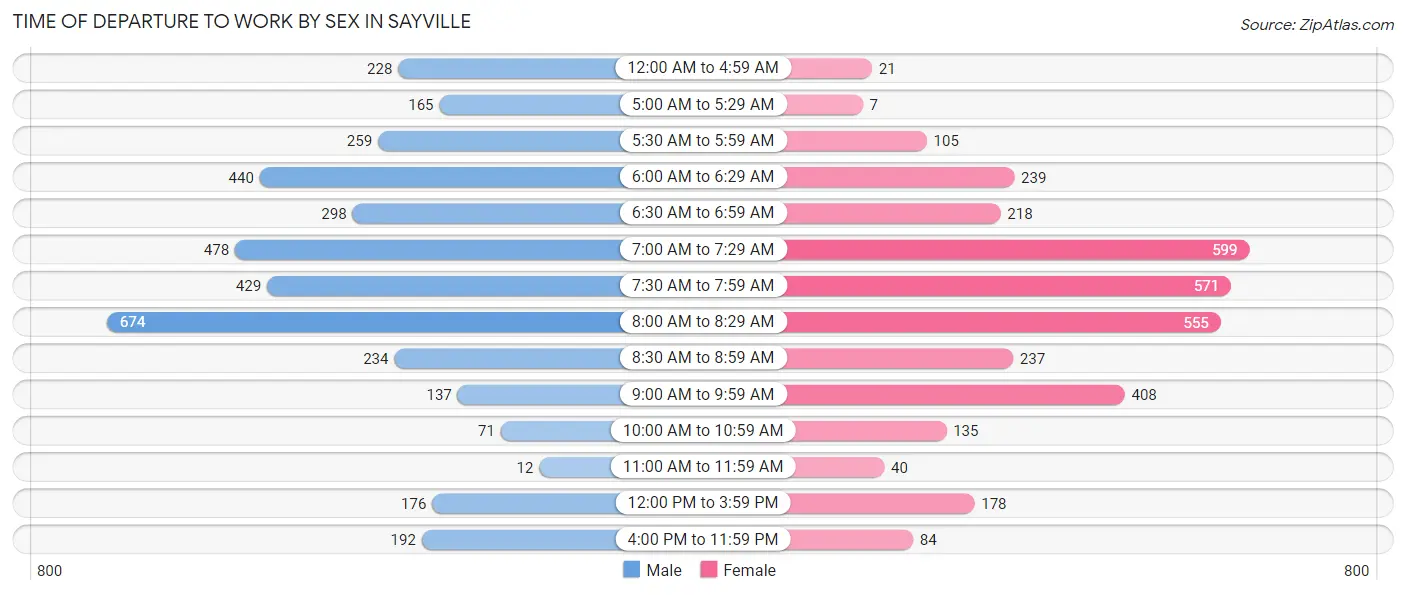
| Time of Departure | Male | Female |
| 12:00 AM to 4:59 AM | 228 (6.0%) | 21 (0.6%) |
| 5:00 AM to 5:29 AM | 165 (4.3%) | 7 (0.2%) |
| 5:30 AM to 5:59 AM | 259 (6.8%) | 105 (3.1%) |
| 6:00 AM to 6:29 AM | 440 (11.6%) | 239 (7.0%) |
| 6:30 AM to 6:59 AM | 298 (7.9%) | 218 (6.4%) |
| 7:00 AM to 7:29 AM | 478 (12.6%) | 599 (17.6%) |
| 7:30 AM to 7:59 AM | 429 (11.3%) | 571 (16.8%) |
| 8:00 AM to 8:29 AM | 674 (17.8%) | 555 (16.3%) |
| 8:30 AM to 8:59 AM | 234 (6.2%) | 237 (7.0%) |
| 9:00 AM to 9:59 AM | 137 (3.6%) | 408 (12.0%) |
| 10:00 AM to 10:59 AM | 71 (1.9%) | 135 (4.0%) |
| 11:00 AM to 11:59 AM | 12 (0.3%) | 40 (1.2%) |
| 12:00 PM to 3:59 PM | 176 (4.6%) | 178 (5.2%) |
| 4:00 PM to 11:59 PM | 192 (5.1%) | 84 (2.5%) |
| Total | 3,793 (100.0%) | 3,397 (100.0%) |
Housing Occupancy in Sayville
Occupancy by Ownership in Sayville
Of the total 5,832 dwellings in Sayville, owner-occupied units account for 4,361 (74.8%), while renter-occupied units make up 1,471 (25.2%).
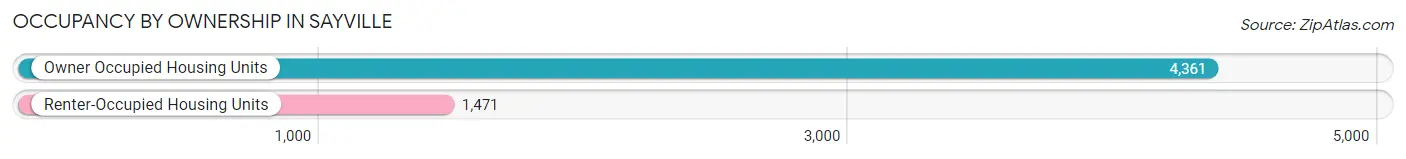
| Occupancy | # Housing Units | % Housing Units |
| Owner Occupied Housing Units | 4,361 | 74.8% |
| Renter-Occupied Housing Units | 1,471 | 25.2% |
| Total Occupied Housing Units | 5,832 | 100.0% |
Occupancy by Household Size in Sayville
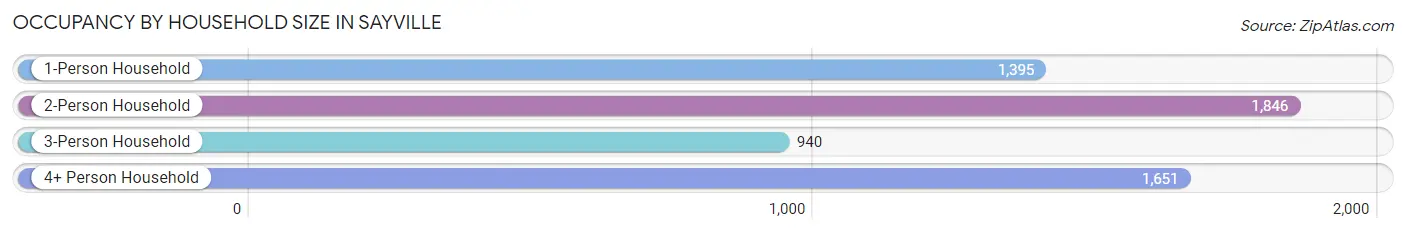
| Household Size | # Housing Units | % Housing Units |
| 1-Person Household | 1,395 | 23.9% |
| 2-Person Household | 1,846 | 31.7% |
| 3-Person Household | 940 | 16.1% |
| 4+ Person Household | 1,651 | 28.3% |
| Total Housing Units | 5,832 | 100.0% |
Occupancy by Ownership by Household Size in Sayville
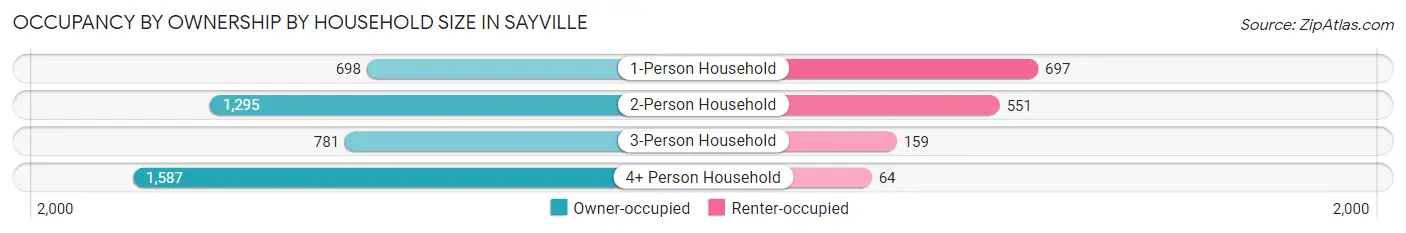
| Household Size | Owner-occupied | Renter-occupied |
| 1-Person Household | 698 (50.0%) | 697 (50.0%) |
| 2-Person Household | 1,295 (70.2%) | 551 (29.8%) |
| 3-Person Household | 781 (83.1%) | 159 (16.9%) |
| 4+ Person Household | 1,587 (96.1%) | 64 (3.9%) |
| Total Housing Units | 4,361 (74.8%) | 1,471 (25.2%) |
Occupancy by Educational Attainment in Sayville
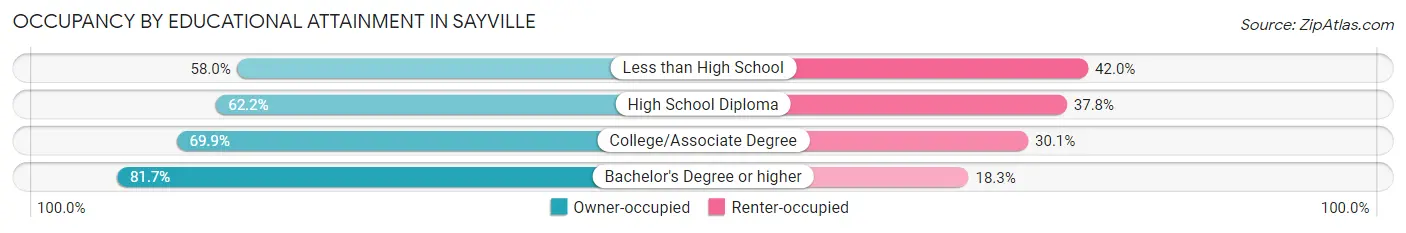
| Household Size | Owner-occupied | Renter-occupied |
| Less than High School | 80 (58.0%) | 58 (42.0%) |
| High School Diploma | 584 (62.2%) | 355 (37.8%) |
| College/Associate Degree | 1,106 (69.9%) | 477 (30.1%) |
| Bachelor's Degree or higher | 2,591 (81.7%) | 581 (18.3%) |
Occupancy by Age of Householder in Sayville
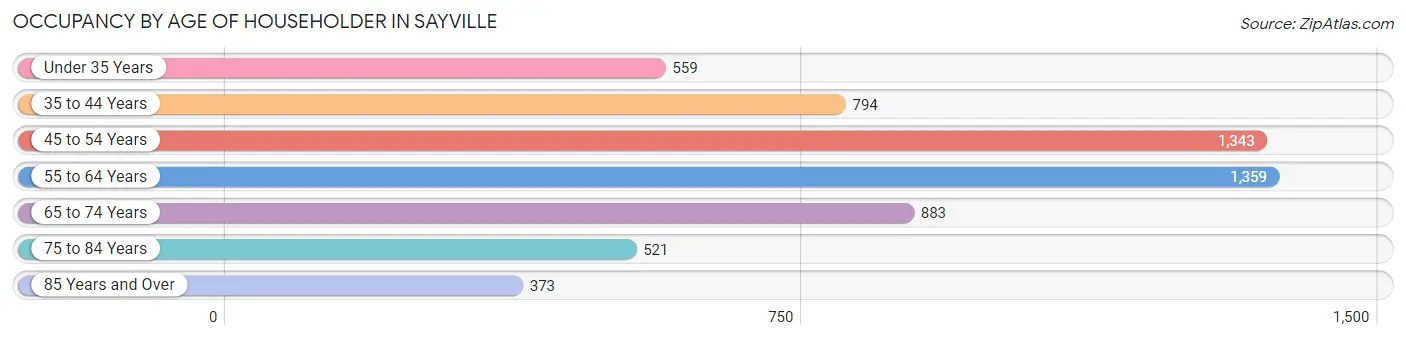
| Age Bracket | # Households | % Households |
| Under 35 Years | 559 | 9.6% |
| 35 to 44 Years | 794 | 13.6% |
| 45 to 54 Years | 1,343 | 23.0% |
| 55 to 64 Years | 1,359 | 23.3% |
| 65 to 74 Years | 883 | 15.1% |
| 75 to 84 Years | 521 | 8.9% |
| 85 Years and Over | 373 | 6.4% |
| Total | 5,832 | 100.0% |
Housing Finances in Sayville
Median Income by Occupancy in Sayville
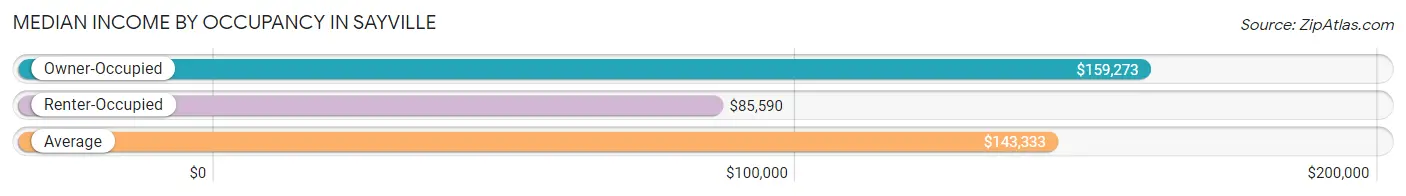
| Occupancy Type | # Households | Median Income |
| Owner-Occupied | 4,361 (74.8%) | $159,273 |
| Renter-Occupied | 1,471 (25.2%) | $85,590 |
| Average | 5,832 (100.0%) | $143,333 |
Occupancy by Householder Income Bracket in Sayville
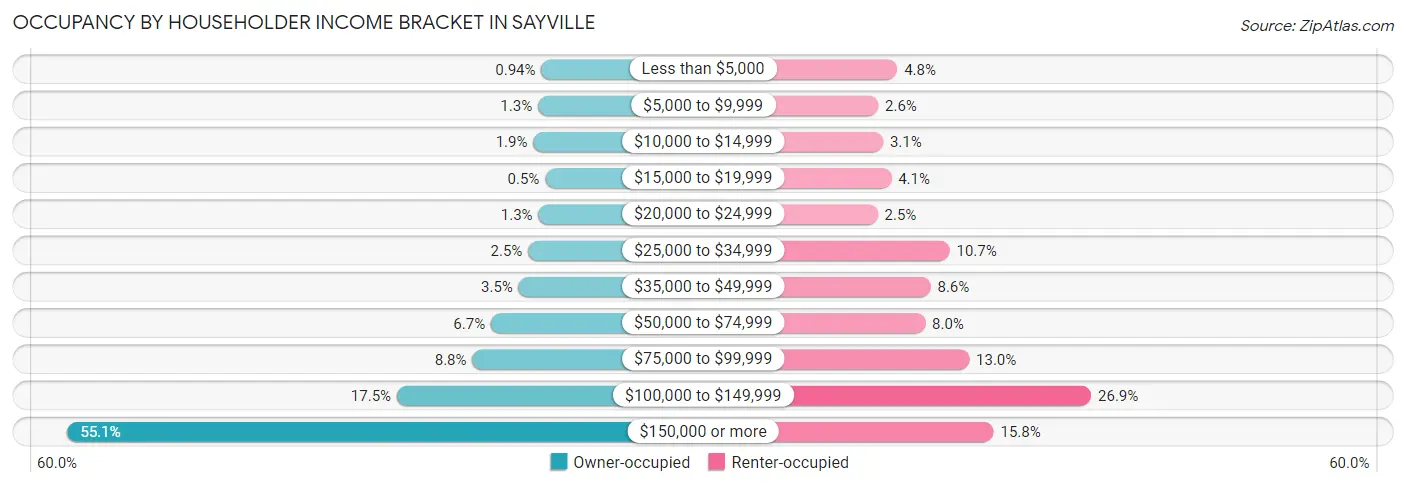
| Income Bracket | Owner-occupied | Renter-occupied |
| Less than $5,000 | 41 (0.9%) | 70 (4.8%) |
| $5,000 to $9,999 | 58 (1.3%) | 38 (2.6%) |
| $10,000 to $14,999 | 81 (1.9%) | 46 (3.1%) |
| $15,000 to $19,999 | 22 (0.5%) | 60 (4.1%) |
| $20,000 to $24,999 | 56 (1.3%) | 37 (2.5%) |
| $25,000 to $34,999 | 107 (2.5%) | 158 (10.7%) |
| $35,000 to $49,999 | 154 (3.5%) | 126 (8.6%) |
| $50,000 to $74,999 | 292 (6.7%) | 117 (8.0%) |
| $75,000 to $99,999 | 385 (8.8%) | 191 (13.0%) |
| $100,000 to $149,999 | 761 (17.4%) | 396 (26.9%) |
| $150,000 or more | 2,404 (55.1%) | 232 (15.8%) |
| Total | 4,361 (100.0%) | 1,471 (100.0%) |
Monthly Housing Cost Tiers in Sayville
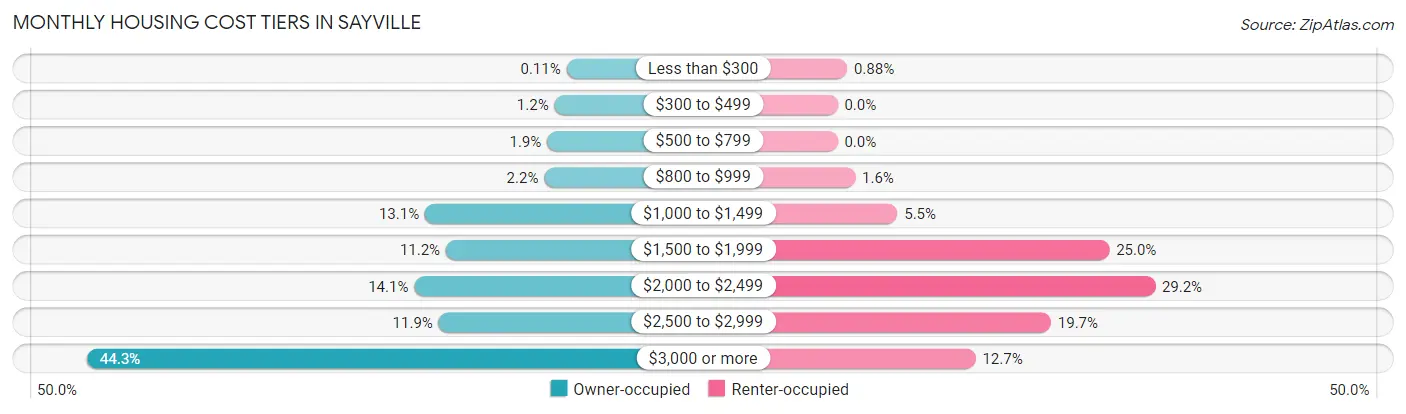
| Monthly Cost | Owner-occupied | Renter-occupied |
| Less than $300 | 5 (0.1%) | 13 (0.9%) |
| $300 to $499 | 53 (1.2%) | 0 (0.0%) |
| $500 to $799 | 83 (1.9%) | 0 (0.0%) |
| $800 to $999 | 94 (2.2%) | 24 (1.6%) |
| $1,000 to $1,499 | 573 (13.1%) | 81 (5.5%) |
| $1,500 to $1,999 | 489 (11.2%) | 368 (25.0%) |
| $2,000 to $2,499 | 616 (14.1%) | 430 (29.2%) |
| $2,500 to $2,999 | 518 (11.9%) | 289 (19.7%) |
| $3,000 or more | 1,930 (44.3%) | 187 (12.7%) |
| Total | 4,361 (100.0%) | 1,471 (100.0%) |
Physical Housing Characteristics in Sayville
Housing Structures in Sayville
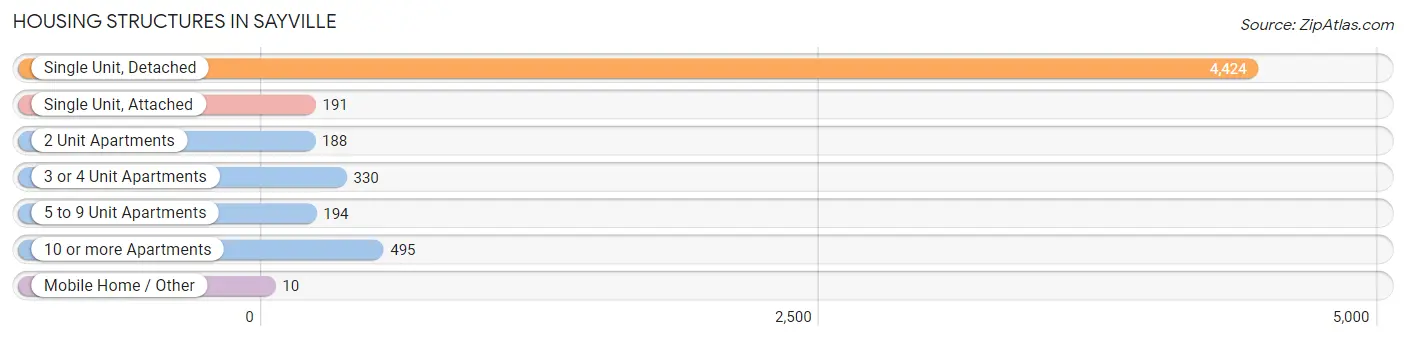
| Structure Type | # Housing Units | % Housing Units |
| Single Unit, Detached | 4,424 | 75.9% |
| Single Unit, Attached | 191 | 3.3% |
| 2 Unit Apartments | 188 | 3.2% |
| 3 or 4 Unit Apartments | 330 | 5.7% |
| 5 to 9 Unit Apartments | 194 | 3.3% |
| 10 or more Apartments | 495 | 8.5% |
| Mobile Home / Other | 10 | 0.2% |
| Total | 5,832 | 100.0% |
Housing Structures by Occupancy in Sayville
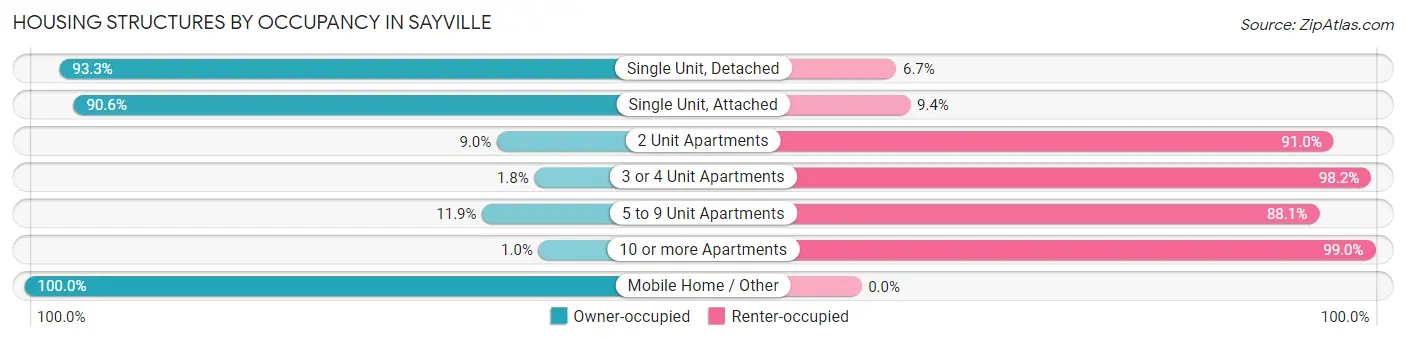
| Structure Type | Owner-occupied | Renter-occupied |
| Single Unit, Detached | 4,127 (93.3%) | 297 (6.7%) |
| Single Unit, Attached | 173 (90.6%) | 18 (9.4%) |
| 2 Unit Apartments | 17 (9.0%) | 171 (91.0%) |
| 3 or 4 Unit Apartments | 6 (1.8%) | 324 (98.2%) |
| 5 to 9 Unit Apartments | 23 (11.9%) | 171 (88.1%) |
| 10 or more Apartments | 5 (1.0%) | 490 (99.0%) |
| Mobile Home / Other | 10 (100.0%) | 0 (0.0%) |
| Total | 4,361 (74.8%) | 1,471 (25.2%) |
Housing Structures by Number of Rooms in Sayville
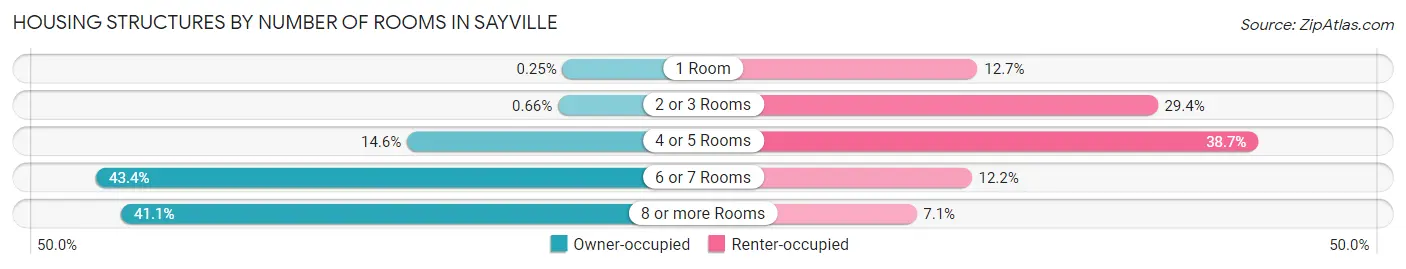
| Number of Rooms | Owner-occupied | Renter-occupied |
| 1 Room | 11 (0.3%) | 187 (12.7%) |
| 2 or 3 Rooms | 29 (0.7%) | 432 (29.4%) |
| 4 or 5 Rooms | 638 (14.6%) | 569 (38.7%) |
| 6 or 7 Rooms | 1,892 (43.4%) | 179 (12.2%) |
| 8 or more Rooms | 1,791 (41.1%) | 104 (7.1%) |
| Total | 4,361 (100.0%) | 1,471 (100.0%) |
Housing Structure by Heating Type in Sayville
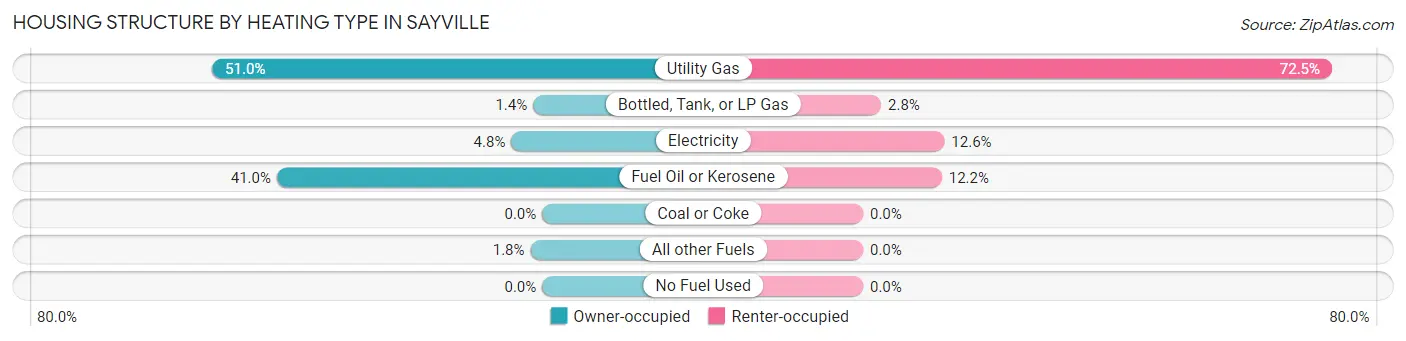
| Heating Type | Owner-occupied | Renter-occupied |
| Utility Gas | 2,224 (51.0%) | 1,066 (72.5%) |
| Bottled, Tank, or LP Gas | 61 (1.4%) | 41 (2.8%) |
| Electricity | 208 (4.8%) | 185 (12.6%) |
| Fuel Oil or Kerosene | 1,789 (41.0%) | 179 (12.2%) |
| Coal or Coke | 0 (0.0%) | 0 (0.0%) |
| All other Fuels | 79 (1.8%) | 0 (0.0%) |
| No Fuel Used | 0 (0.0%) | 0 (0.0%) |
| Total | 4,361 (100.0%) | 1,471 (100.0%) |
Household Vehicle Usage in Sayville
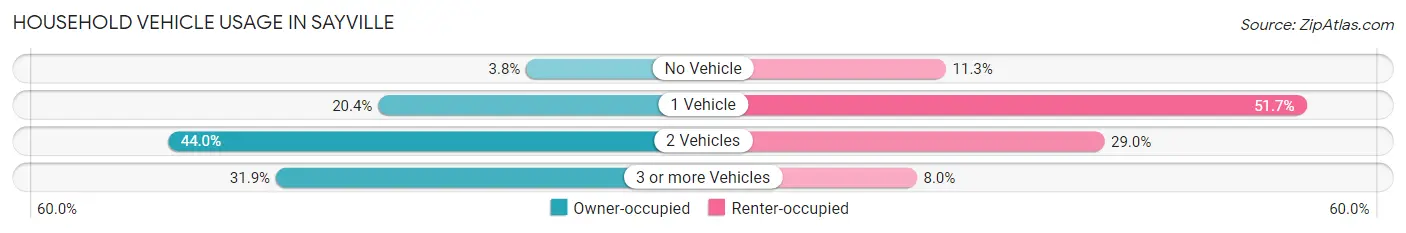
| Vehicles per Household | Owner-occupied | Renter-occupied |
| No Vehicle | 166 (3.8%) | 166 (11.3%) |
| 1 Vehicle | 889 (20.4%) | 760 (51.7%) |
| 2 Vehicles | 1,917 (44.0%) | 427 (29.0%) |
| 3 or more Vehicles | 1,389 (31.9%) | 118 (8.0%) |
| Total | 4,361 (100.0%) | 1,471 (100.0%) |
Real Estate & Mortgages in Sayville
Real Estate and Mortgage Overview in Sayville
| Characteristic | Without Mortgage | With Mortgage |
| Housing Units | 1,451 | 2,910 |
| Median Property Value | $568,800 | $540,700 |
| Median Household Income | $116,181 | $1,827 |
| Monthly Housing Costs | $1,489 | $1,906 |
| Real Estate Taxes | $10,001 | $16 |
Property Value by Mortgage Status in Sayville
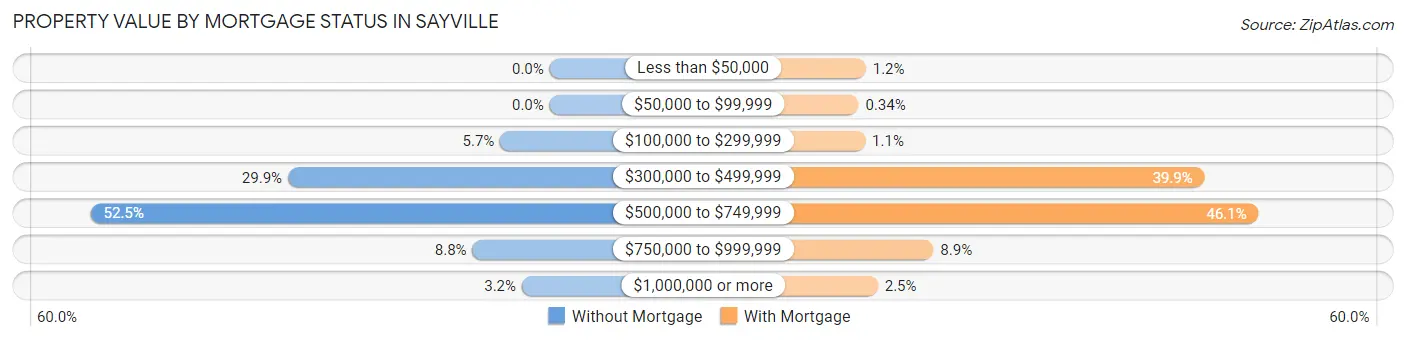
| Property Value | Without Mortgage | With Mortgage |
| Less than $50,000 | 0 (0.0%) | 34 (1.2%) |
| $50,000 to $99,999 | 0 (0.0%) | 10 (0.3%) |
| $100,000 to $299,999 | 82 (5.7%) | 32 (1.1%) |
| $300,000 to $499,999 | 434 (29.9%) | 1,161 (39.9%) |
| $500,000 to $749,999 | 761 (52.4%) | 1,340 (46.1%) |
| $750,000 to $999,999 | 128 (8.8%) | 259 (8.9%) |
| $1,000,000 or more | 46 (3.2%) | 74 (2.5%) |
| Total | 1,451 (100.0%) | 2,910 (100.0%) |
Household Income by Mortgage Status in Sayville
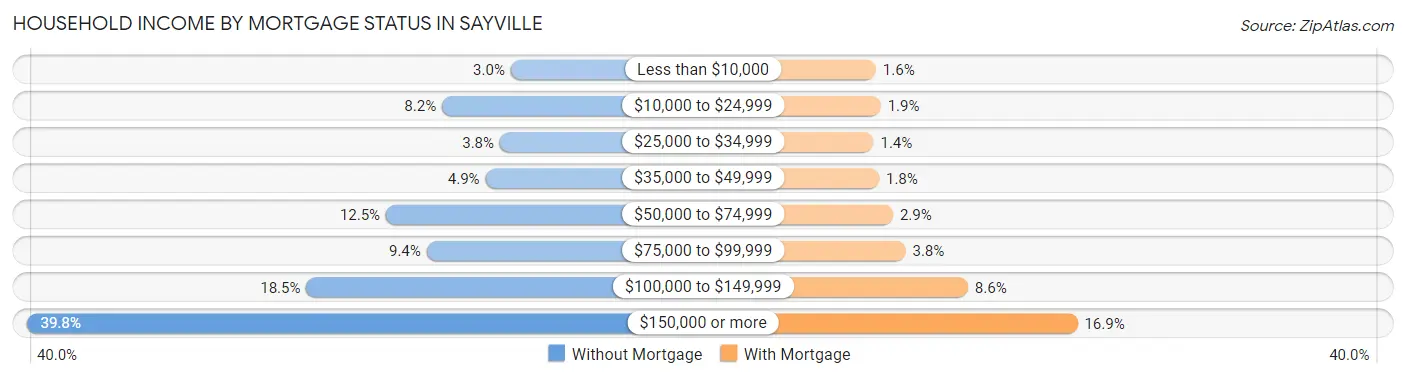
| Household Income | Without Mortgage | With Mortgage |
| Less than $10,000 | 43 (3.0%) | 45 (1.5%) |
| $10,000 to $24,999 | 119 (8.2%) | 56 (1.9%) |
| $25,000 to $34,999 | 55 (3.8%) | 40 (1.4%) |
| $35,000 to $49,999 | 71 (4.9%) | 52 (1.8%) |
| $50,000 to $74,999 | 181 (12.5%) | 83 (2.9%) |
| $75,000 to $99,999 | 136 (9.4%) | 111 (3.8%) |
| $100,000 to $149,999 | 269 (18.5%) | 249 (8.6%) |
| $150,000 or more | 577 (39.8%) | 492 (16.9%) |
| Total | 1,451 (100.0%) | 2,910 (100.0%) |
Property Value to Household Income Ratio in Sayville
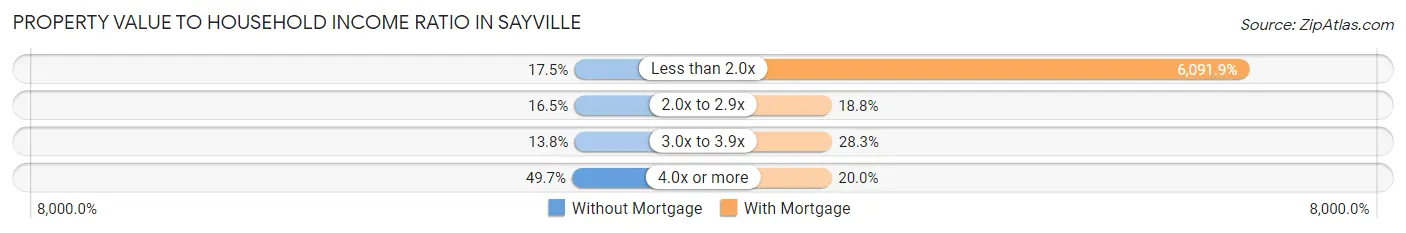
| Value-to-Income Ratio | Without Mortgage | With Mortgage |
| Less than 2.0x | 254 (17.5%) | 177,273 (6,091.9%) |
| 2.0x to 2.9x | 240 (16.5%) | 548 (18.8%) |
| 3.0x to 3.9x | 200 (13.8%) | 823 (28.3%) |
| 4.0x or more | 721 (49.7%) | 581 (20.0%) |
| Total | 1,451 (100.0%) | 2,910 (100.0%) |
Real Estate Taxes by Mortgage Status in Sayville
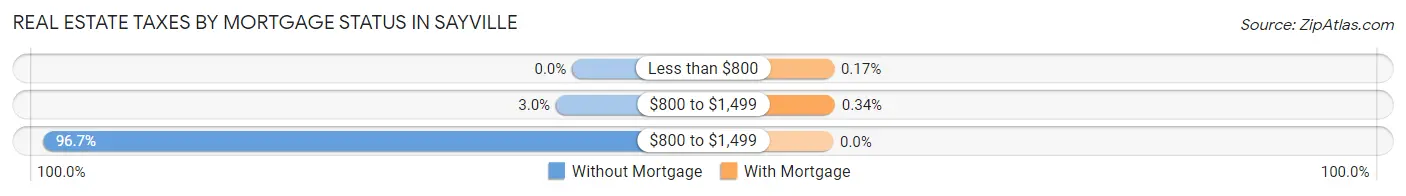
| Property Taxes | Without Mortgage | With Mortgage |
| Less than $800 | 0 (0.0%) | 5 (0.2%) |
| $800 to $1,499 | 43 (3.0%) | 10 (0.3%) |
| $800 to $1,499 | 1,403 (96.7%) | 0 (0.0%) |
| Total | 1,451 (100.0%) | 2,910 (100.0%) |
Health & Disability in Sayville
Health Insurance Coverage by Age in Sayville
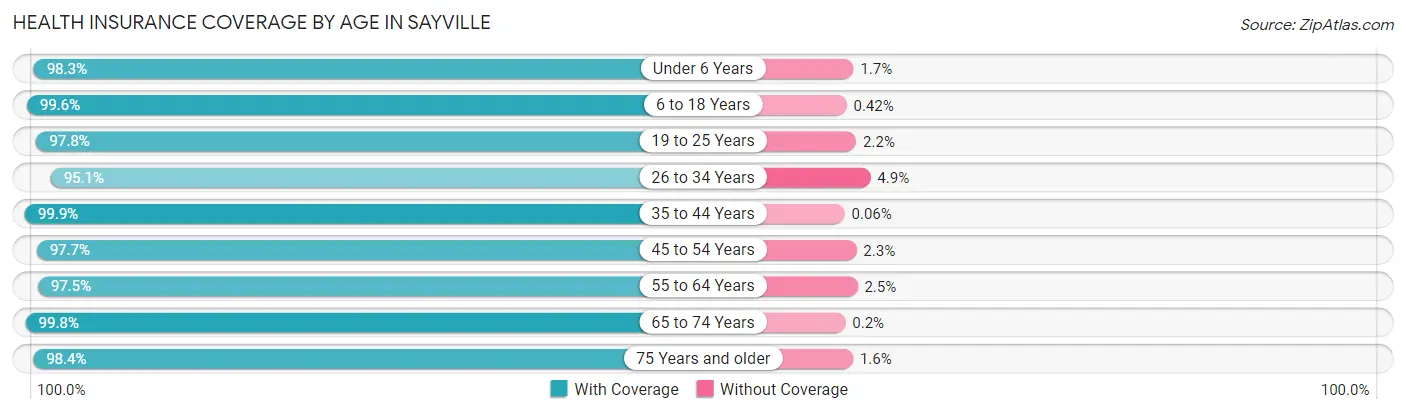
| Age Bracket | With Coverage | Without Coverage |
| Under 6 Years | 862 (98.3%) | 15 (1.7%) |
| 6 to 18 Years | 2,815 (99.6%) | 12 (0.4%) |
| 19 to 25 Years | 1,106 (97.8%) | 25 (2.2%) |
| 26 to 34 Years | 1,405 (95.1%) | 72 (4.9%) |
| 35 to 44 Years | 1,734 (99.9%) | 1 (0.1%) |
| 45 to 54 Years | 2,503 (97.7%) | 58 (2.3%) |
| 55 to 64 Years | 2,217 (97.5%) | 56 (2.5%) |
| 65 to 74 Years | 1,494 (99.8%) | 3 (0.2%) |
| 75 Years and older | 1,346 (98.4%) | 22 (1.6%) |
| Total | 15,482 (98.3%) | 264 (1.7%) |
Health Insurance Coverage by Citizenship Status in Sayville
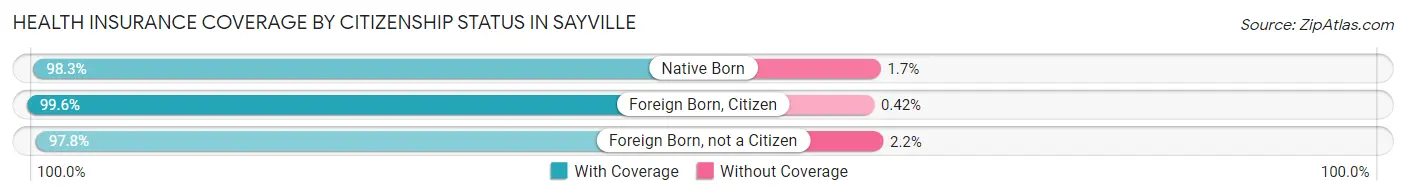
| Citizenship Status | With Coverage | Without Coverage |
| Native Born | 862 (98.3%) | 15 (1.7%) |
| Foreign Born, Citizen | 2,815 (99.6%) | 12 (0.4%) |
| Foreign Born, not a Citizen | 1,106 (97.8%) | 25 (2.2%) |
Health Insurance Coverage by Household Income in Sayville
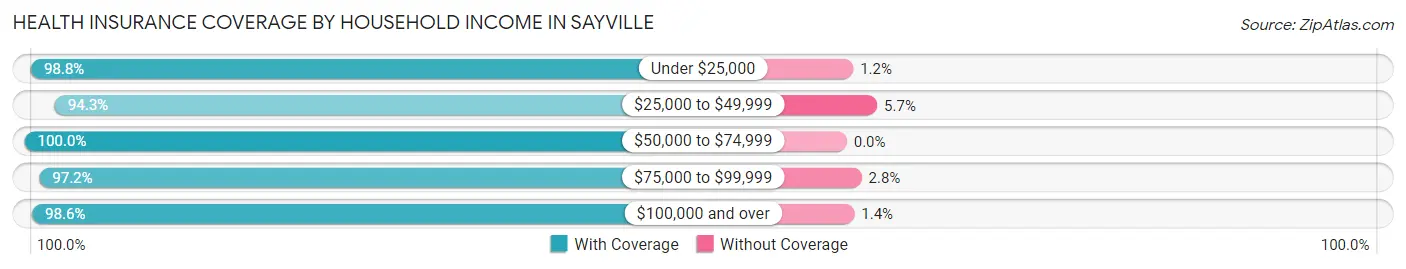
| Household Income | With Coverage | Without Coverage |
| Under $25,000 | 741 (98.8%) | 9 (1.2%) |
| $25,000 to $49,999 | 828 (94.3%) | 50 (5.7%) |
| $50,000 to $74,999 | 751 (100.0%) | 0 (0.0%) |
| $75,000 to $99,999 | 1,125 (97.2%) | 32 (2.8%) |
| $100,000 and over | 11,967 (98.6%) | 172 (1.4%) |
Public vs Private Health Insurance Coverage by Age in Sayville
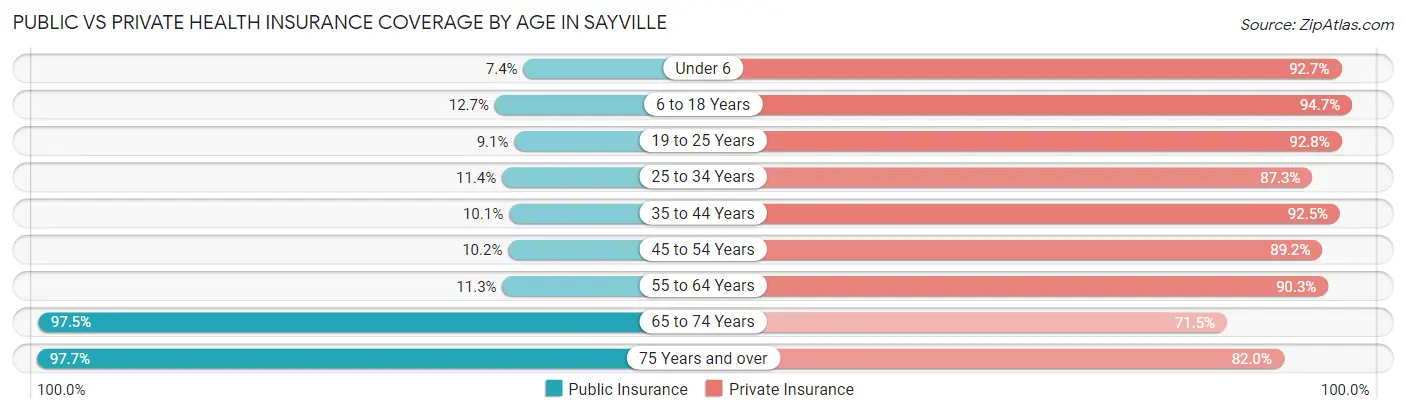
| Age Bracket | Public Insurance | Private Insurance |
| Under 6 | 65 (7.4%) | 813 (92.7%) |
| 6 to 18 Years | 360 (12.7%) | 2,677 (94.7%) |
| 19 to 25 Years | 103 (9.1%) | 1,049 (92.7%) |
| 25 to 34 Years | 168 (11.4%) | 1,290 (87.3%) |
| 35 to 44 Years | 175 (10.1%) | 1,604 (92.4%) |
| 45 to 54 Years | 262 (10.2%) | 2,284 (89.2%) |
| 55 to 64 Years | 257 (11.3%) | 2,052 (90.3%) |
| 65 to 74 Years | 1,460 (97.5%) | 1,070 (71.5%) |
| 75 Years and over | 1,337 (97.7%) | 1,122 (82.0%) |
| Total | 4,187 (26.6%) | 13,961 (88.7%) |
Disability Status by Sex by Age in Sayville
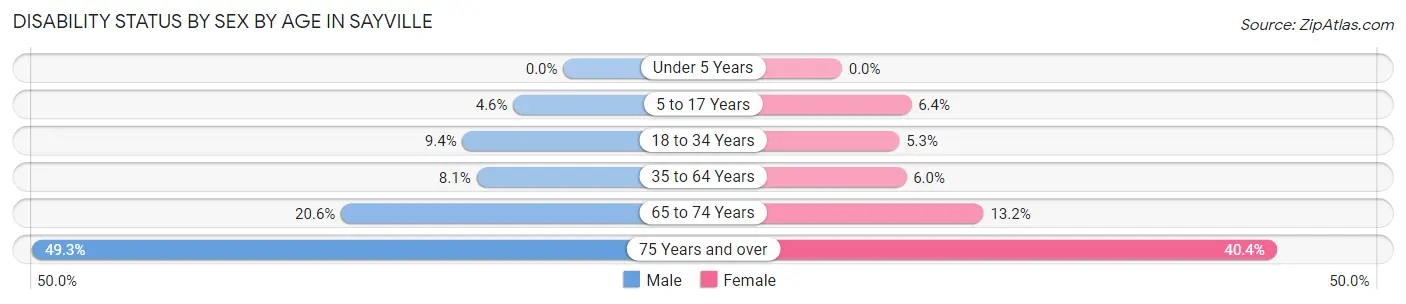
| Age Bracket | Male | Female |
| Under 5 Years | 0 (0.0%) | 0 (0.0%) |
| 5 to 17 Years | 66 (4.6%) | 84 (6.4%) |
| 18 to 34 Years | 140 (9.4%) | 69 (5.3%) |
| 35 to 64 Years | 257 (8.1%) | 202 (6.0%) |
| 65 to 74 Years | 166 (20.6%) | 91 (13.2%) |
| 75 Years and over | 248 (49.3%) | 349 (40.4%) |
Disability Class by Sex by Age in Sayville
Disability Class: Hearing Difficulty
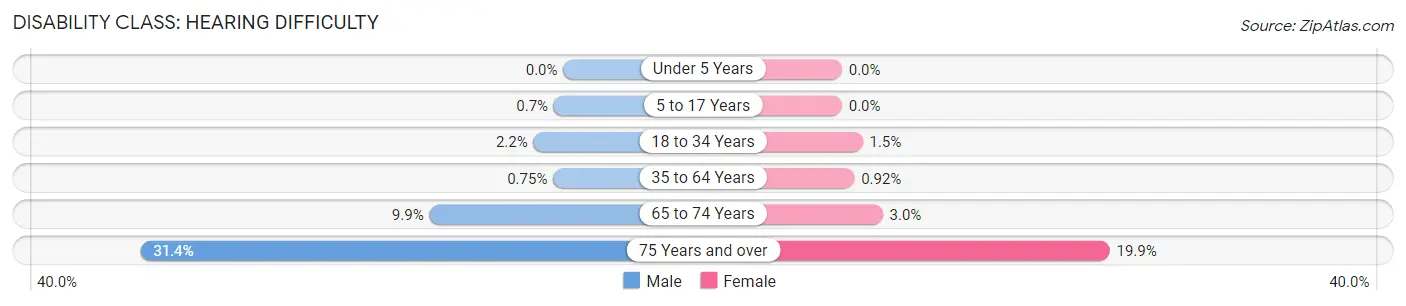
| Age Bracket | Male | Female |
| Under 5 Years | 0 (0.0%) | 0 (0.0%) |
| 5 to 17 Years | 10 (0.7%) | 0 (0.0%) |
| 18 to 34 Years | 33 (2.2%) | 20 (1.5%) |
| 35 to 64 Years | 24 (0.7%) | 31 (0.9%) |
| 65 to 74 Years | 80 (9.9%) | 21 (3.0%) |
| 75 Years and over | 158 (31.4%) | 172 (19.9%) |
Disability Class: Vision Difficulty
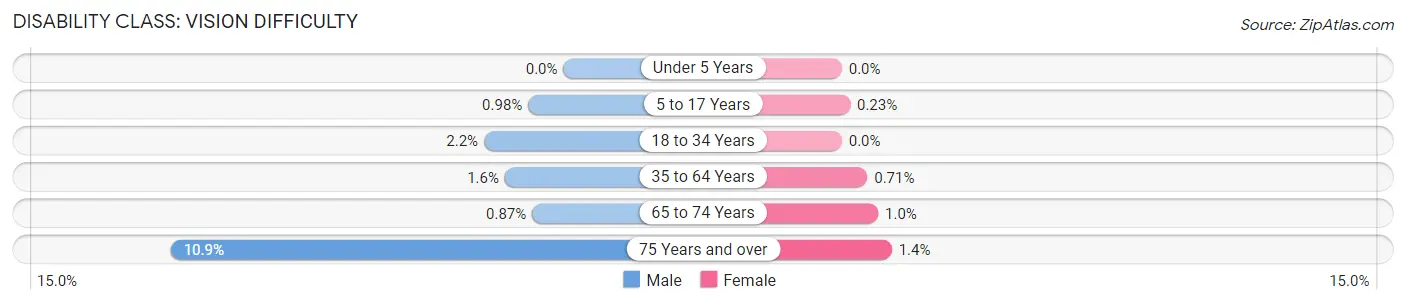
| Age Bracket | Male | Female |
| Under 5 Years | 0 (0.0%) | 0 (0.0%) |
| 5 to 17 Years | 14 (1.0%) | 3 (0.2%) |
| 18 to 34 Years | 33 (2.2%) | 0 (0.0%) |
| 35 to 64 Years | 52 (1.6%) | 24 (0.7%) |
| 65 to 74 Years | 7 (0.9%) | 7 (1.0%) |
| 75 Years and over | 55 (10.9%) | 12 (1.4%) |
Disability Class: Cognitive Difficulty
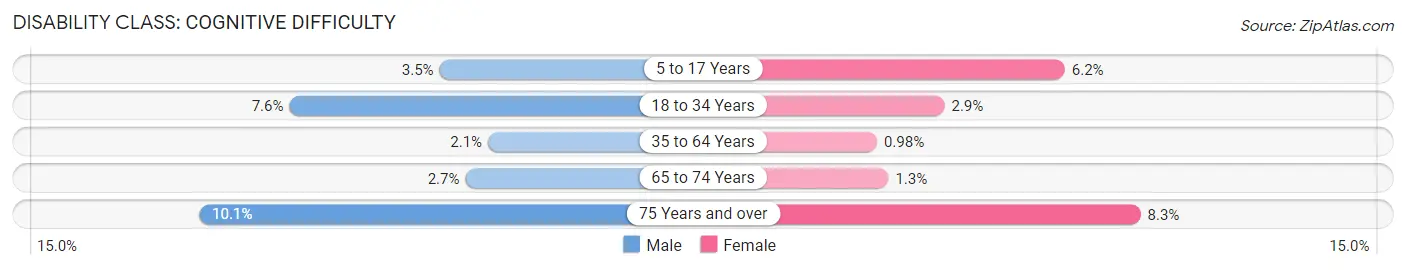
| Age Bracket | Male | Female |
| 5 to 17 Years | 49 (3.5%) | 81 (6.2%) |
| 18 to 34 Years | 114 (7.6%) | 37 (2.9%) |
| 35 to 64 Years | 67 (2.1%) | 33 (1.0%) |
| 65 to 74 Years | 22 (2.7%) | 9 (1.3%) |
| 75 Years and over | 51 (10.1%) | 72 (8.3%) |
Disability Class: Ambulatory Difficulty
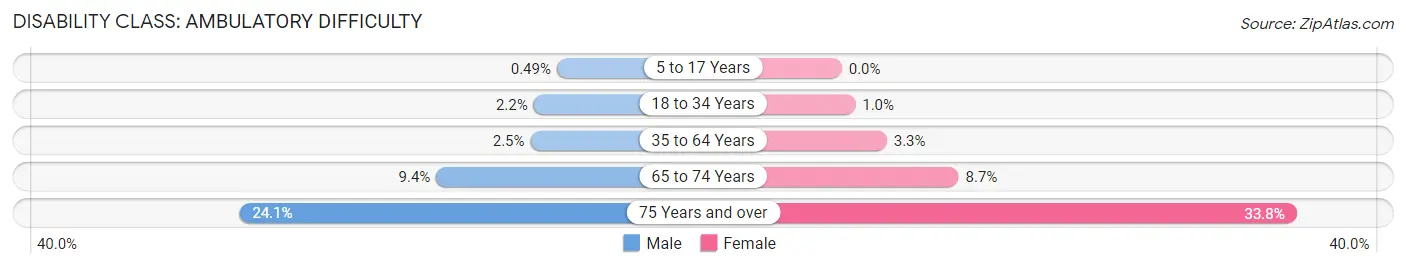
| Age Bracket | Male | Female |
| 5 to 17 Years | 7 (0.5%) | 0 (0.0%) |
| 18 to 34 Years | 33 (2.2%) | 13 (1.0%) |
| 35 to 64 Years | 78 (2.5%) | 113 (3.3%) |
| 65 to 74 Years | 76 (9.4%) | 60 (8.7%) |
| 75 Years and over | 121 (24.1%) | 292 (33.8%) |
Disability Class: Self-Care Difficulty
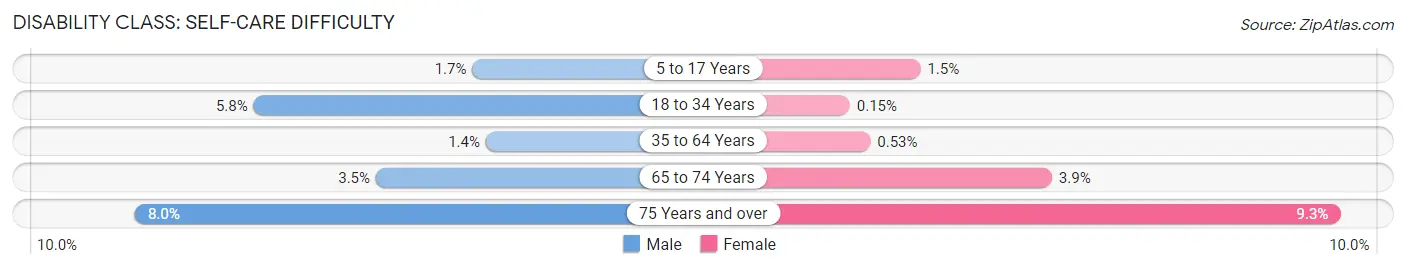
| Age Bracket | Male | Female |
| 5 to 17 Years | 24 (1.7%) | 19 (1.5%) |
| 18 to 34 Years | 86 (5.8%) | 2 (0.2%) |
| 35 to 64 Years | 46 (1.4%) | 18 (0.5%) |
| 65 to 74 Years | 28 (3.5%) | 27 (3.9%) |
| 75 Years and over | 40 (8.0%) | 80 (9.2%) |
Technology Access in Sayville
Computing Device Access in Sayville
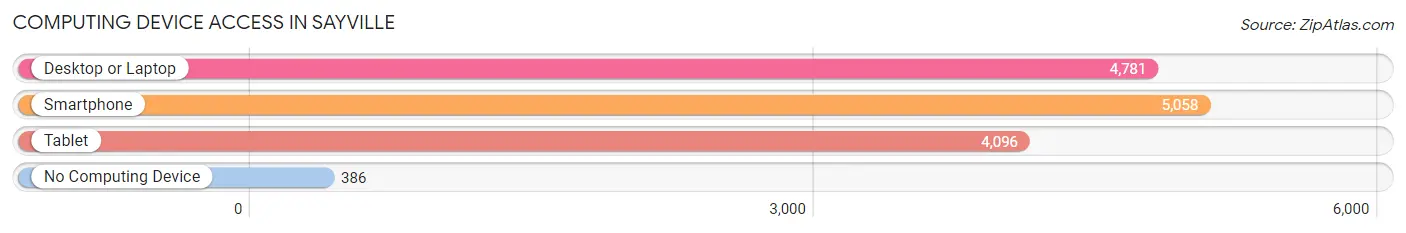
| Device Type | # Households | % Households |
| Desktop or Laptop | 4,781 | 82.0% |
| Smartphone | 5,058 | 86.7% |
| Tablet | 4,096 | 70.2% |
| No Computing Device | 386 | 6.6% |
| Total | 5,832 | 100.0% |
Internet Access in Sayville
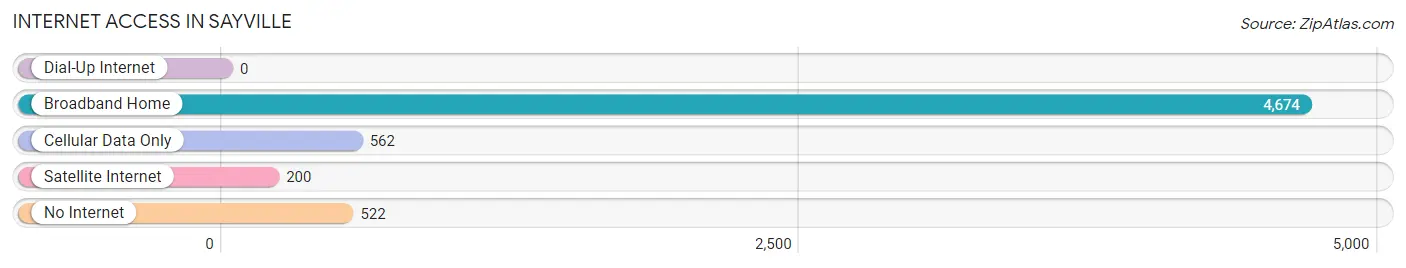
| Internet Type | # Households | % Households |
| Dial-Up Internet | 0 | 0.0% |
| Broadband Home | 4,674 | 80.1% |
| Cellular Data Only | 562 | 9.6% |
| Satellite Internet | 200 | 3.4% |
| No Internet | 522 | 8.9% |
| Total | 5,832 | 100.0% |
Sayville Summary
Situated on the south shore of Long Island, Sayville is a hamlet located in the Town of Islip in Suffolk County, New York. It is a popular summer resort destination, known for its beaches, marinas, and parks. The hamlet is home to a population of approximately 11,000 people, according to the 2010 United States Census.
History
Sayville was first settled in the late 1600s by English settlers. The hamlet was originally known as West Sayville, and was part of the Town of Islip. In 1838, the hamlet was officially incorporated as the Village of Sayville. The village was named after the Say family, who were among the first settlers in the area.
In the late 1800s, Sayville became a popular summer resort destination. The hamlet was known for its beaches, marinas, and parks. In the early 1900s, the Long Island Rail Road opened a station in Sayville, making it easier for visitors to reach the hamlet.
In the 1920s, Sayville was home to a large amusement park, known as the Sayville Amusement Park. The park was a popular destination for visitors, and featured a roller coaster, a carousel, and a dance hall. The park closed in the 1950s, and the site is now home to a shopping center.
In the 1950s, Sayville experienced a population boom, as many people moved to the hamlet from New York City. The population of Sayville has remained relatively stable since then.
Geography
Sayville is located on the south shore of Long Island, in Suffolk County, New York. The hamlet is bordered by the Great South Bay to the north, and the Atlantic Ocean to the south. The hamlet is located approximately 60 miles east of New York City.
The hamlet is home to several parks and beaches, including the Sayville Marina Park, the Sayville Beach Park, and the Sayville Golf Course. The hamlet is also home to several marinas, including the Sayville Yacht Club and the Sayville Marina.
Economy
The economy of Sayville is largely based on tourism and retail. The hamlet is home to several restaurants, bars, and shops, which attract visitors from all over Long Island. The hamlet is also home to several marinas, which provide services to boaters and fishermen.
The hamlet is also home to several manufacturing companies, including the Sayville Manufacturing Company, which produces industrial equipment. The hamlet is also home to several technology companies, including the Sayville Technology Group, which provides IT services.
Demographics
According to the 2010 United States Census, the population of Sayville was 11,000. The racial makeup of the hamlet was 94.3% White, 2.2% African American, 0.7% Asian, 0.3% Native American, and 2.5% from other races. The median household income in Sayville was $87,000, and the median home value was $400,000.
The majority of the population of Sayville is of European descent. The hamlet is also home to a small population of African Americans, Asians, and Native Americans. The hamlet is home to a large number of retirees, as well as a growing population of young professionals.
Common Questions
What is Per Capita Income in Sayville?
Per Capita income in Sayville is $65,532.
What is the Median Family Income in Sayville?
Median Family Income in Sayville is $168,824.
What is the Median Household income in Sayville?
Median Household Income in Sayville is $143,333.
What is Income or Wage Gap in Sayville?
Income or Wage Gap in Sayville is 35.9%.
Women in Sayville earn 64.1 cents for every dollar earned by a man.
What is Family Income Deficit in Sayville?
Family Income Deficit in Sayville is $14,537.
Families that are below poverty line in Sayville earn $14,537 less on average than the poverty threshold level.
What is Inequality or Gini Index in Sayville?
Inequality or Gini Index in Sayville is 0.45.
What is the Total Population of Sayville?
Total Population of Sayville is 16,145.
What is the Total Male Population of Sayville?
Total Male Population of Sayville is 7,983.
What is the Total Female Population of Sayville?
Total Female Population of Sayville is 8,162.
What is the Ratio of Males per 100 Females in Sayville?
There are 97.81 Males per 100 Females in Sayville.
What is the Ratio of Females per 100 Males in Sayville?
There are 102.24 Females per 100 Males in Sayville.
What is the Median Population Age in Sayville?
Median Population Age in Sayville is 45.1 Years.
What is the Average Family Size in Sayville
Average Family Size in Sayville is 3.2 People.
What is the Average Household Size in Sayville
Average Household Size in Sayville is 2.7 People.
How Large is the Labor Force in Sayville?
There are 8,290 People in the Labor Forcein in Sayville.
What is the Percentage of People in the Labor Force in Sayville?
63.4% of People are in the Labor Force in Sayville.
What is the Unemployment Rate in Sayville?
Unemployment Rate in Sayville is 1.9%.