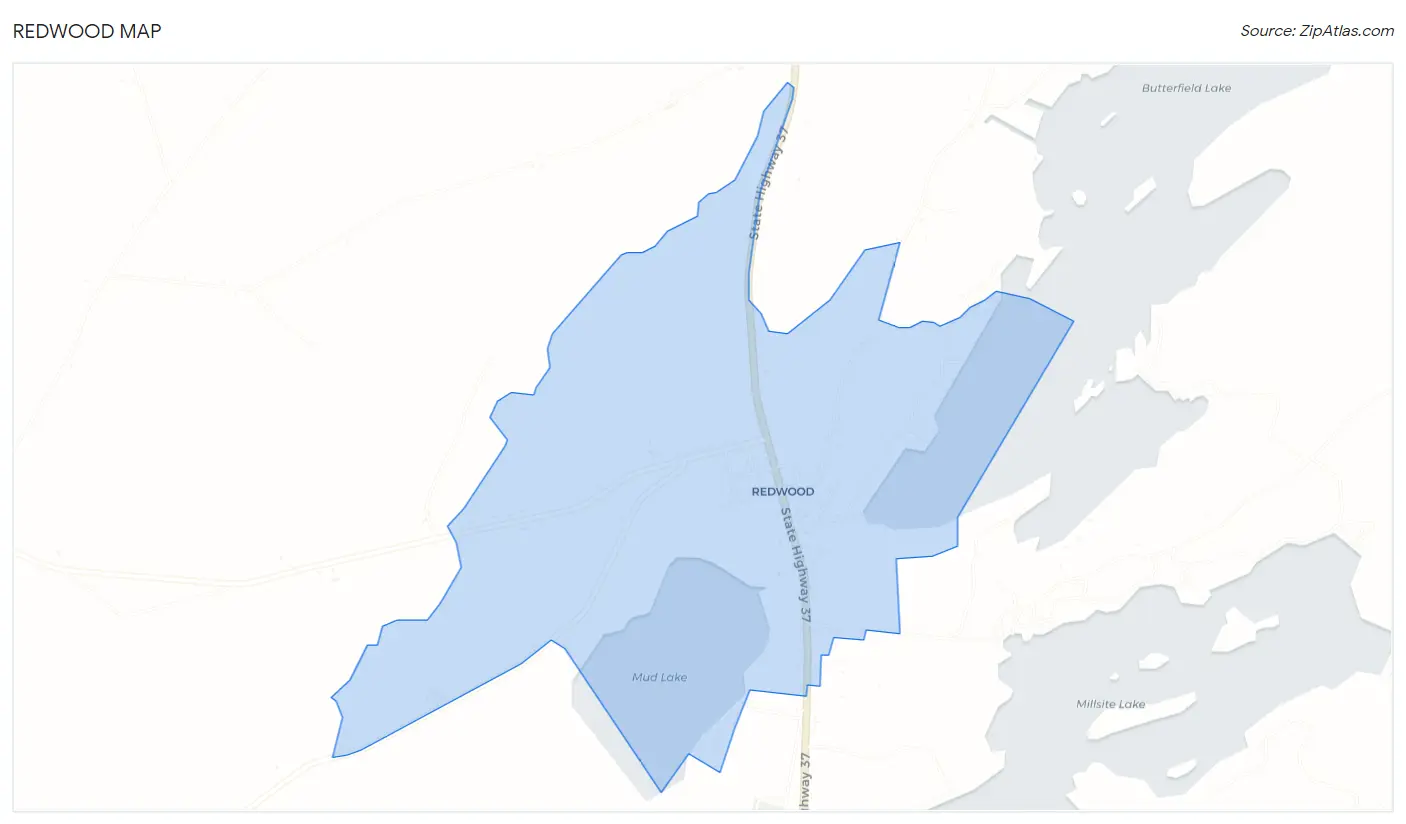
Redwood, NY Map & Demographics
Redwood Map
Redwood Overview
$39,292
PER CAPITA INCOME
$127,583
AVG HOUSEHOLD INCOME
45.6%
WAGE / INCOME GAP [ % ]
54.4¢/ $1
WAGE / INCOME GAP [ $ ]
0.30
INEQUALITY / GINI INDEX
304
TOTAL POPULATION
163
MALE POPULATION
141
FEMALE POPULATION
115.60
MALES / 100 FEMALES
86.50
FEMALES / 100 MALES
27.1
MEDIAN AGE
3.1
AVG FAMILY SIZE
2.9
AVG HOUSEHOLD SIZE
167
LABOR FORCE [ PEOPLE ]
69.6%
PERCENT IN LABOR FORCE
3.6%
UNEMPLOYMENT RATE
Redwood Zip Codes
Redwood Area Codes
Income in Redwood
Income Overview in Redwood
| Characteristic | Number | Measure |
| Per Capita Income | 304 | $39,292 |
| Median Family Income | 74 | $0 |
| Mean Family Income | 74 | $102,772 |
| Median Household Income | 104 | $127,583 |
| Mean Household Income | 104 | $110,364 |
| Income Deficit | 74 | $0 |
| Wage / Income Gap (%) | 304 | 45.59% |
| Wage / Income Gap ($) | 304 | 54.41¢ per $1 |
| Gini / Inequality Index | 304 | 0.30 |
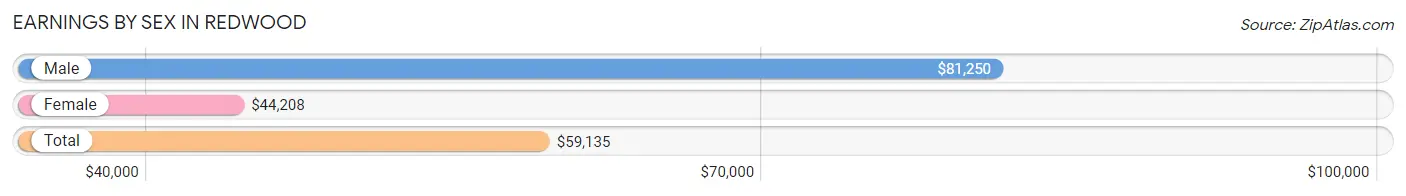
Earnings by Sex in Redwood
Average Earnings in Redwood are $59,135, $81,250 for men and $44,208 for women, a difference of 45.6%.
| Sex | Number | Average Earnings |
| Male | 98 (60.9%) | $81,250 |
| Female | 63 (39.1%) | $44,208 |
| Total | 161 (100.0%) | $59,135 |
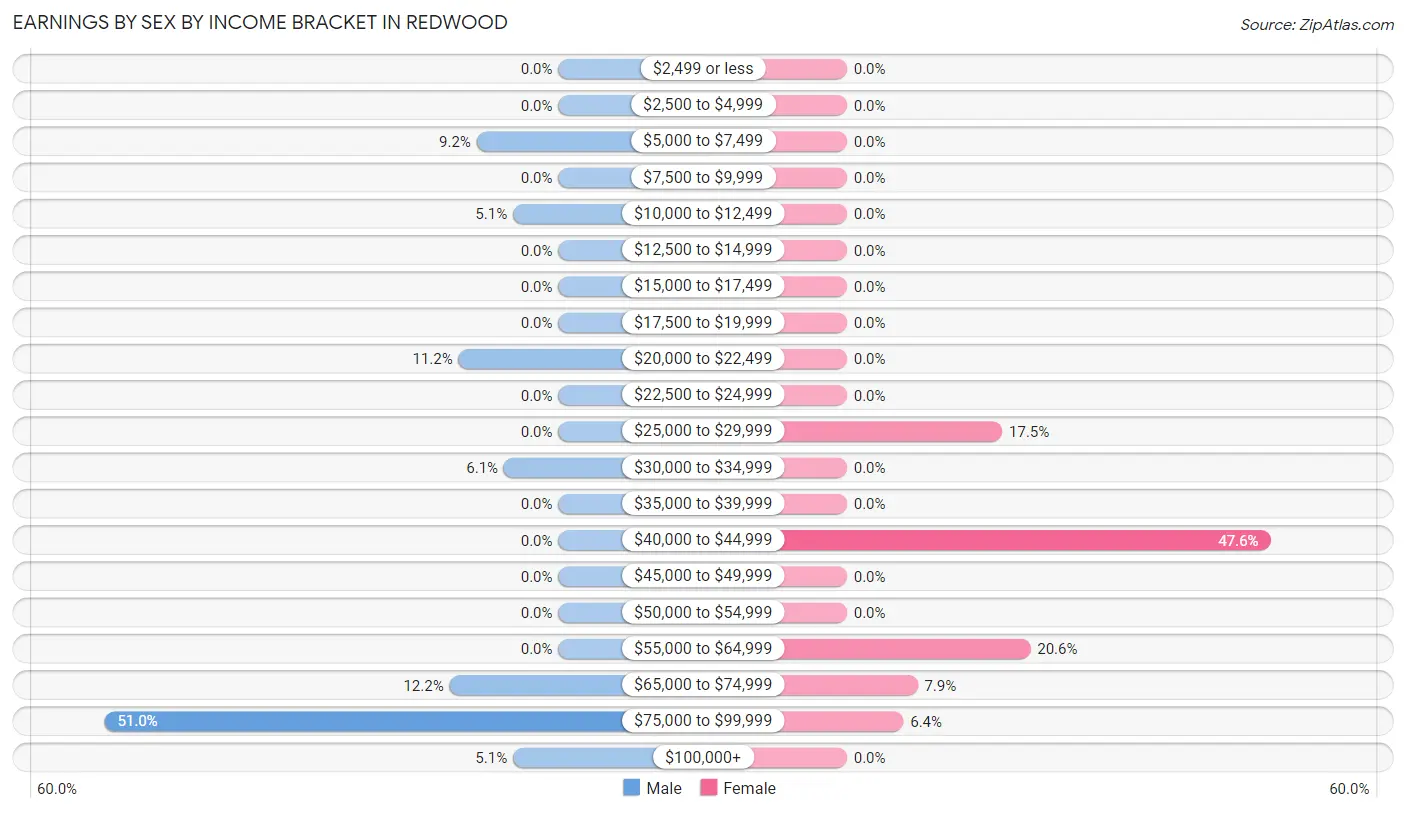
Earnings by Sex by Income Bracket in Redwood
The most common earnings brackets in Redwood are $75,000 to $99,999 for men (50 | 51.0%) and $40,000 to $44,999 for women (30 | 47.6%).
| Income | Male | Female |
| $2,499 or less | 0 (0.0%) | 0 (0.0%) |
| $2,500 to $4,999 | 0 (0.0%) | 0 (0.0%) |
| $5,000 to $7,499 | 9 (9.2%) | 0 (0.0%) |
| $7,500 to $9,999 | 0 (0.0%) | 0 (0.0%) |
| $10,000 to $12,499 | 5 (5.1%) | 0 (0.0%) |
| $12,500 to $14,999 | 0 (0.0%) | 0 (0.0%) |
| $15,000 to $17,499 | 0 (0.0%) | 0 (0.0%) |
| $17,500 to $19,999 | 0 (0.0%) | 0 (0.0%) |
| $20,000 to $22,499 | 11 (11.2%) | 0 (0.0%) |
| $22,500 to $24,999 | 0 (0.0%) | 0 (0.0%) |
| $25,000 to $29,999 | 0 (0.0%) | 11 (17.5%) |
| $30,000 to $34,999 | 6 (6.1%) | 0 (0.0%) |
| $35,000 to $39,999 | 0 (0.0%) | 0 (0.0%) |
| $40,000 to $44,999 | 0 (0.0%) | 30 (47.6%) |
| $45,000 to $49,999 | 0 (0.0%) | 0 (0.0%) |
| $50,000 to $54,999 | 0 (0.0%) | 0 (0.0%) |
| $55,000 to $64,999 | 0 (0.0%) | 13 (20.6%) |
| $65,000 to $74,999 | 12 (12.2%) | 5 (7.9%) |
| $75,000 to $99,999 | 50 (51.0%) | 4 (6.4%) |
| $100,000+ | 5 (5.1%) | 0 (0.0%) |
| Total | 98 (100.0%) | 63 (100.0%) |
Earnings by Sex by Educational Attainment in Redwood
| Educational Attainment | Male Income | Female Income |
| Less than High School | - | - |
| High School Diploma | - | - |
| College or Associate's Degree | - | - |
| Bachelor's Degree | - | - |
| Graduate Degree | - | - |
| Total | - | - |
Family Income in Redwood
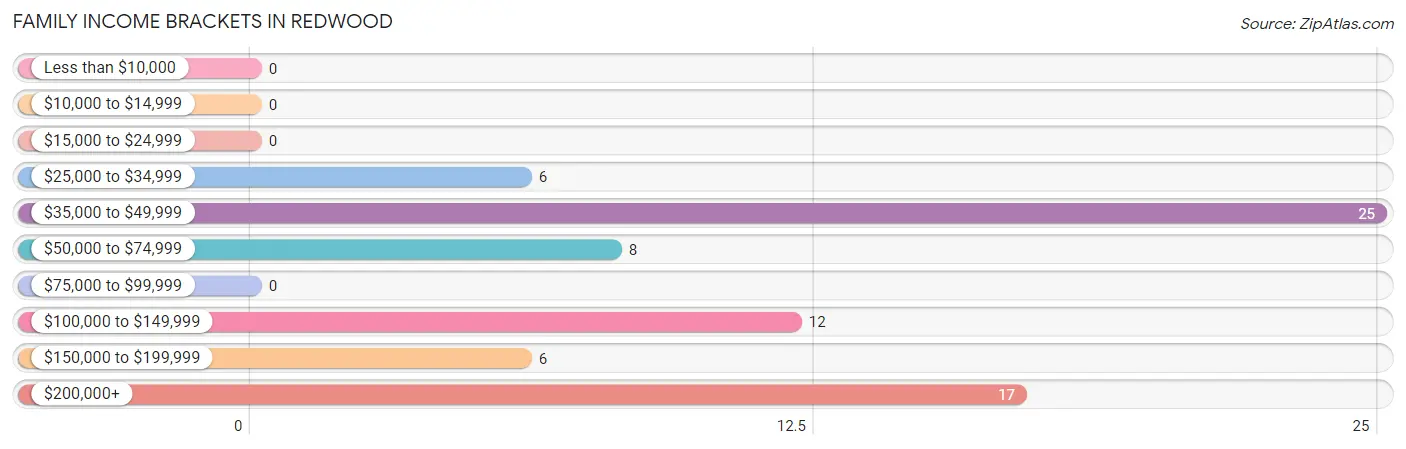
Family Income Brackets in Redwood
According to the Redwood family income data, there are 25 families falling into the $35,000 to $49,999 income range, which is the most common income bracket and makes up 33.8% of all families.
| Income Bracket | # Families | % Families |
| Less than $10,000 | 0 | 0.0% |
| $10,000 to $14,999 | 0 | 0.0% |
| $15,000 to $24,999 | 0 | 0.0% |
| $25,000 to $34,999 | 6 | 8.1% |
| $35,000 to $49,999 | 25 | 33.8% |
| $50,000 to $74,999 | 8 | 10.8% |
| $75,000 to $99,999 | 0 | 0.0% |
| $100,000 to $149,999 | 12 | 16.2% |
| $150,000 to $199,999 | 6 | 8.1% |
| $200,000+ | 17 | 23.0% |
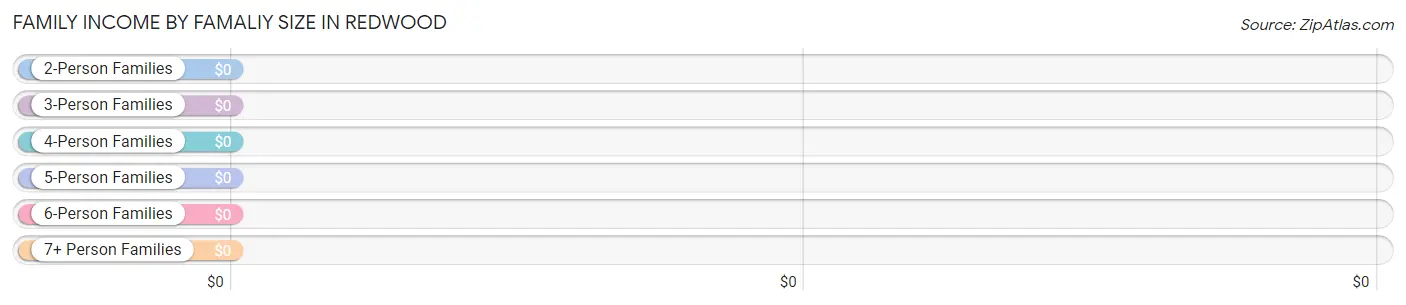
Family Income by Famaliy Size in Redwood
| Income Bracket | # Families | Median Income |
| 2-Person Families | 46 (62.2%) | $0 |
| 3-Person Families | 4 (5.4%) | $0 |
| 4-Person Families | 0 (0.0%) | $0 |
| 5-Person Families | 12 (16.2%) | $0 |
| 6-Person Families | 12 (16.2%) | $0 |
| 7+ Person Families | 0 (0.0%) | $0 |
| Total | 74 (100.0%) | $0 |
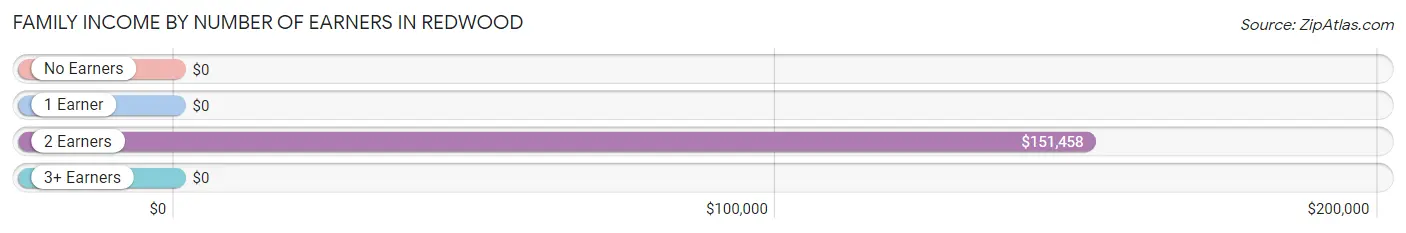
Family Income by Number of Earners in Redwood
| Number of Earners | # Families | Median Income |
| No Earners | 25 (33.8%) | $0 |
| 1 Earner | 14 (18.9%) | $0 |
| 2 Earners | 31 (41.9%) | $151,458 |
| 3+ Earners | 4 (5.4%) | $0 |
| Total | 74 (100.0%) | $0 |
Household Income in Redwood
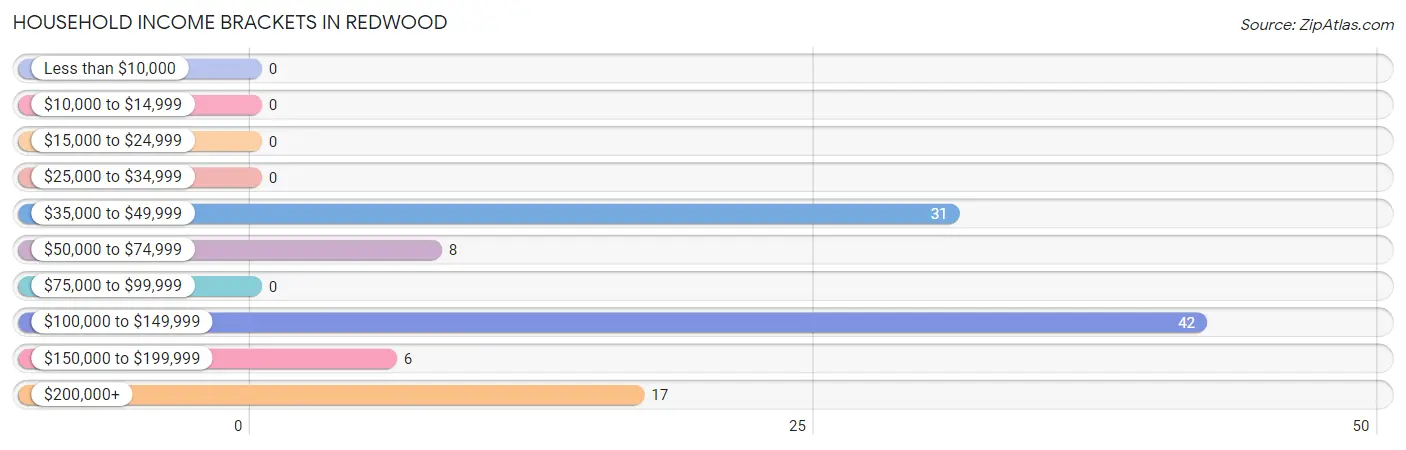
Household Income Brackets in Redwood
With 42 households falling in the category, the $100,000 to $149,999 income range is the most frequent in Redwood, accounting for 40.4% of all households.
| Income Bracket | # Households | % Households |
| Less than $10,000 | 0 | 0.0% |
| $10,000 to $14,999 | 0 | 0.0% |
| $15,000 to $24,999 | 0 | 0.0% |
| $25,000 to $34,999 | 0 | 0.0% |
| $35,000 to $49,999 | 31 | 29.8% |
| $50,000 to $74,999 | 8 | 7.7% |
| $75,000 to $99,999 | 0 | 0.0% |
| $100,000 to $149,999 | 42 | 40.4% |
| $150,000 to $199,999 | 6 | 5.8% |
| $200,000+ | 17 | 16.3% |
Household Income by Householder Age in Redwood
The median household income in Redwood is $127,583, with the highest median household income of $215,809 found in the 45 to 64 years age bracket for the primary householder. A total of 23 households (22.1%) fall into this category. Meanwhile, the 15 to 24 years age bracket for the primary householder has the lowest median household income of $0, with 30 households (28.8%) in this group.
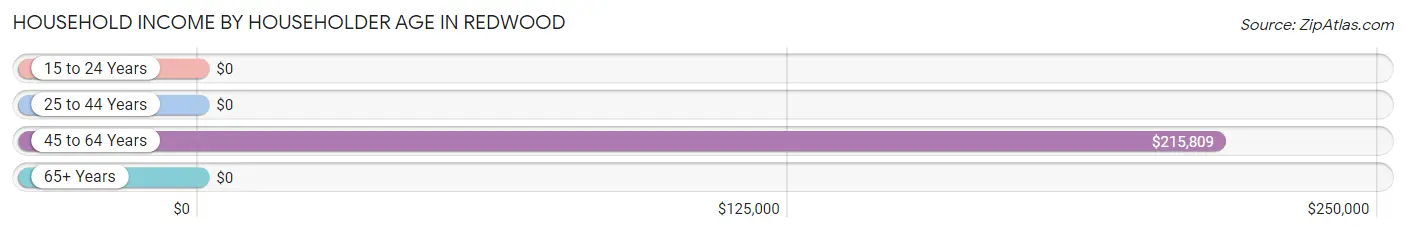
| Income Bracket | # Households | Median Income |
| 15 to 24 Years | 30 (28.8%) | $0 |
| 25 to 44 Years | 18 (17.3%) | $0 |
| 45 to 64 Years | 23 (22.1%) | $215,809 |
| 65+ Years | 33 (31.7%) | $0 |
| Total | 104 (100.0%) | $127,583 |
Poverty in Redwood
Income Below Poverty by Sex and Age in Redwood
With 13.5% poverty level for males and 7.8% for females among the residents of Redwood, under 5 year old males and 15 year old females are the most vulnerable to poverty, with 5 males (100.0%) and 6 females (100.0%) in their respective age groups living below the poverty level.
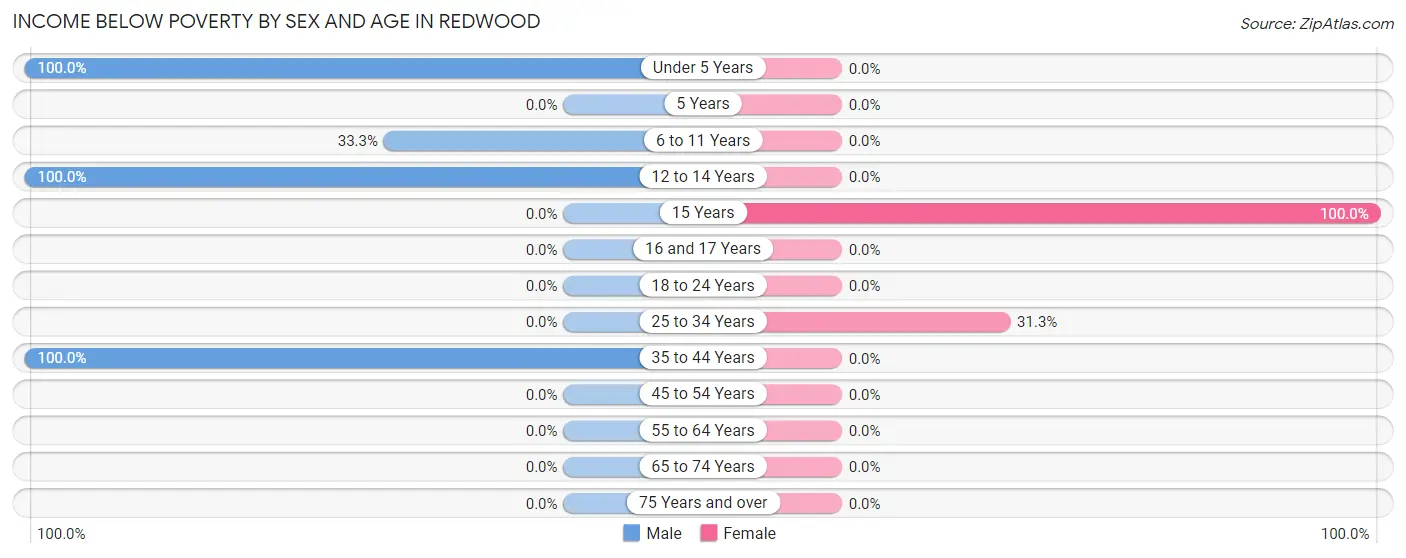
| Age Bracket | Male | Female |
| Under 5 Years | 5 (100.0%) | 0 (0.0%) |
| 5 Years | 0 (0.0%) | 0 (0.0%) |
| 6 to 11 Years | 5 (33.3%) | 0 (0.0%) |
| 12 to 14 Years | 6 (100.0%) | 0 (0.0%) |
| 15 Years | 0 (0.0%) | 6 (100.0%) |
| 16 and 17 Years | 0 (0.0%) | 0 (0.0%) |
| 18 to 24 Years | 0 (0.0%) | 0 (0.0%) |
| 25 to 34 Years | 0 (0.0%) | 5 (31.2%) |
| 35 to 44 Years | 6 (100.0%) | 0 (0.0%) |
| 45 to 54 Years | 0 (0.0%) | 0 (0.0%) |
| 55 to 64 Years | 0 (0.0%) | 0 (0.0%) |
| 65 to 74 Years | 0 (0.0%) | 0 (0.0%) |
| 75 Years and over | 0 (0.0%) | 0 (0.0%) |
| Total | 22 (13.5%) | 11 (7.8%) |
Income Above Poverty by Sex and Age in Redwood
According to the poverty statistics in Redwood, males aged 5 years and females aged 6 to 11 years are the age groups that are most secure financially, with 100.0% of males and 100.0% of females in these age groups living above the poverty line.
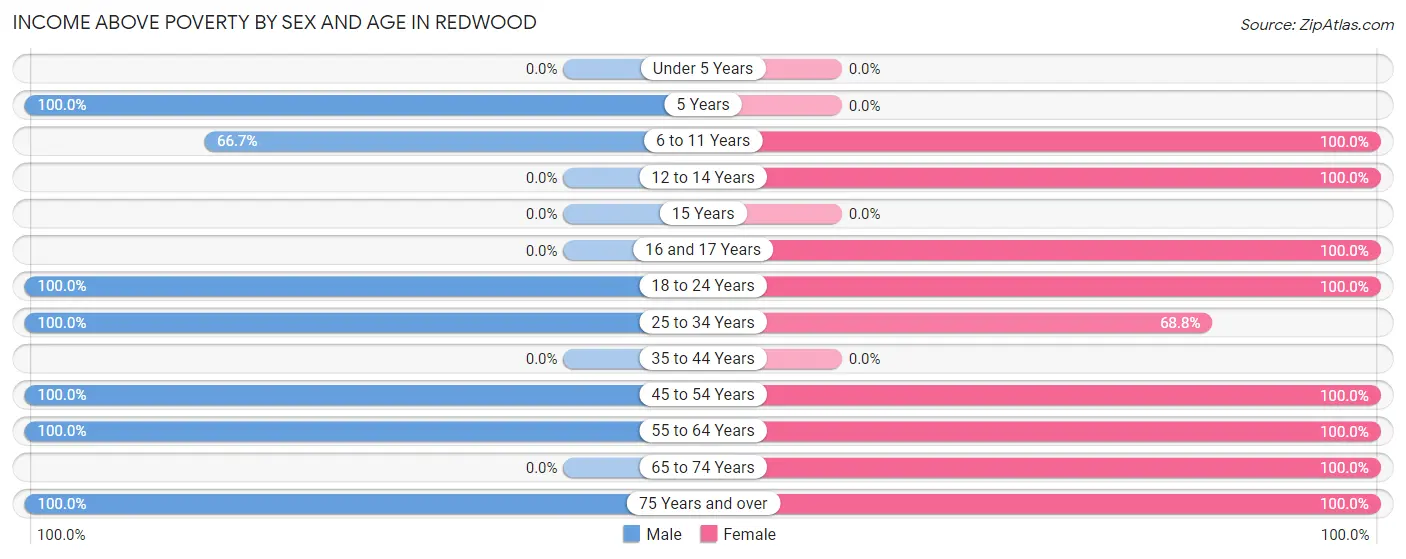
| Age Bracket | Male | Female |
| Under 5 Years | 0 (0.0%) | 0 (0.0%) |
| 5 Years | 10 (100.0%) | 0 (0.0%) |
| 6 to 11 Years | 10 (66.7%) | 11 (100.0%) |
| 12 to 14 Years | 0 (0.0%) | 11 (100.0%) |
| 15 Years | 0 (0.0%) | 0 (0.0%) |
| 16 and 17 Years | 0 (0.0%) | 10 (100.0%) |
| 18 to 24 Years | 47 (100.0%) | 30 (100.0%) |
| 25 to 34 Years | 28 (100.0%) | 11 (68.8%) |
| 35 to 44 Years | 0 (0.0%) | 0 (0.0%) |
| 45 to 54 Years | 18 (100.0%) | 18 (100.0%) |
| 55 to 64 Years | 5 (100.0%) | 4 (100.0%) |
| 65 to 74 Years | 0 (0.0%) | 10 (100.0%) |
| 75 Years and over | 23 (100.0%) | 25 (100.0%) |
| Total | 141 (86.5%) | 130 (92.2%) |
Income Below Poverty Among Married-Couple Families in Redwood
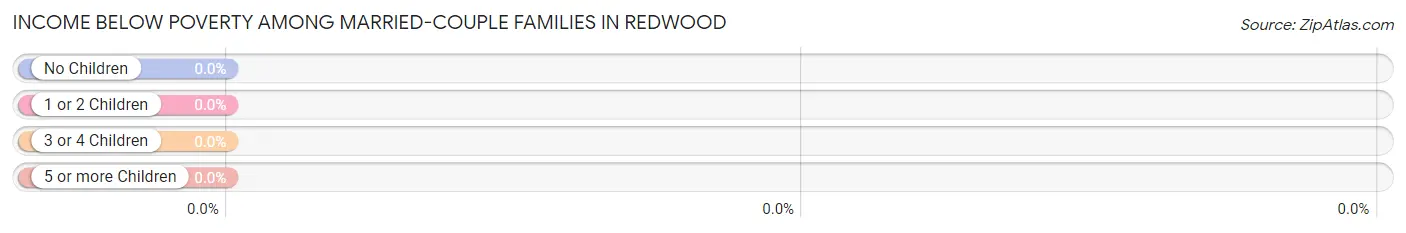
| Children | Above Poverty | Below Poverty |
| No Children | 42 (100.0%) | 0 (0.0%) |
| 1 or 2 Children | 6 (100.0%) | 0 (0.0%) |
| 3 or 4 Children | 12 (100.0%) | 0 (0.0%) |
| 5 or more Children | 0 (0.0%) | 0 (0.0%) |
| Total | 60 (100.0%) | 0 (0.0%) |
Income Below Poverty Among Single-Parent Households in Redwood
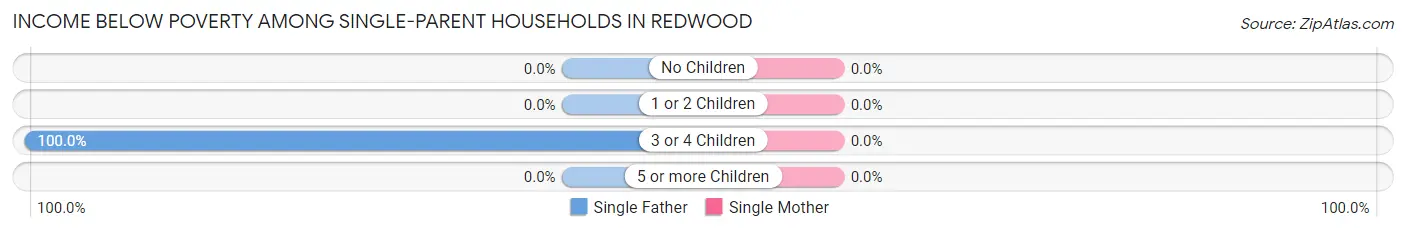
| Children | Single Father | Single Mother |
| No Children | 0 (0.0%) | 0 (0.0%) |
| 1 or 2 Children | 0 (0.0%) | 0 (0.0%) |
| 3 or 4 Children | 6 (100.0%) | 0 (0.0%) |
| 5 or more Children | 0 (0.0%) | 0 (0.0%) |
| Total | 6 (100.0%) | 0 (0.0%) |
Income Below Poverty Among Married-Couple vs Single-Parent Households in Redwood
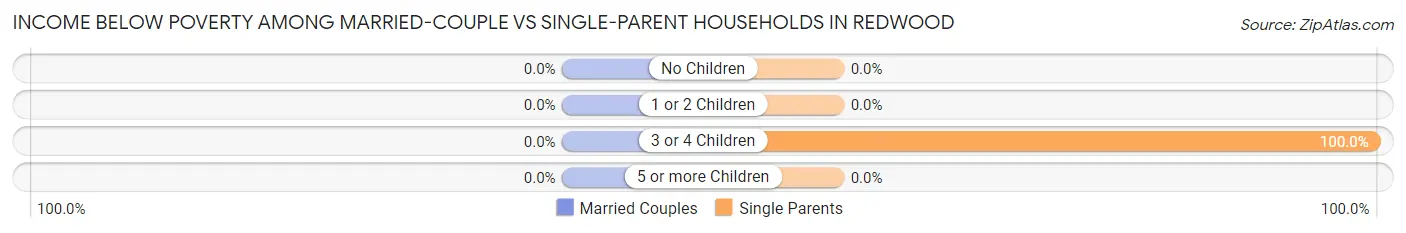
| Children | Married-Couple Families | Single-Parent Households |
| No Children | 0 (0.0%) | 0 (0.0%) |
| 1 or 2 Children | 0 (0.0%) | 0 (0.0%) |
| 3 or 4 Children | 0 (0.0%) | 6 (100.0%) |
| 5 or more Children | 0 (0.0%) | 0 (0.0%) |
| Total | 0 (0.0%) | 6 (42.9%) |
Race in Redwood
The most populous races in Redwood are , and White / Caucasian (304 | 100.0%).
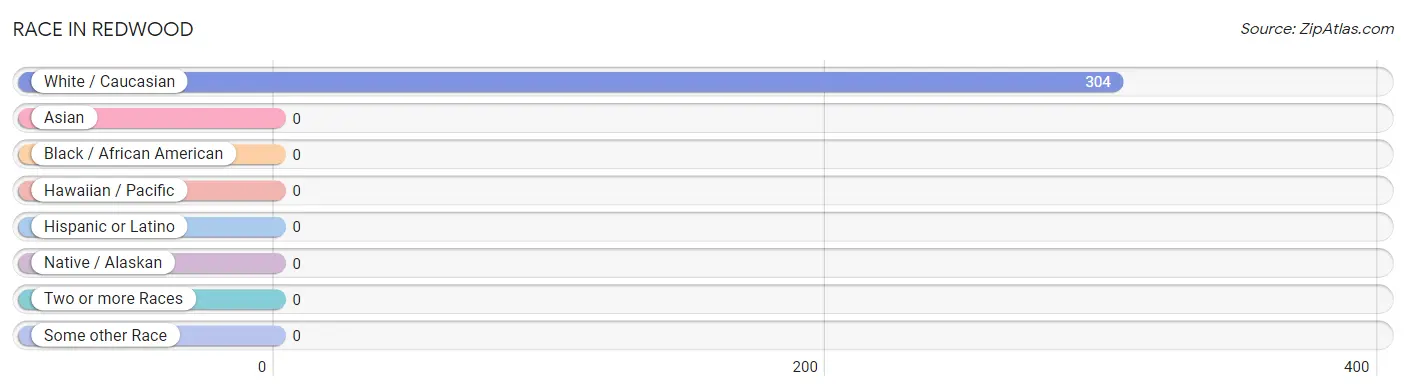
| Race | # Population | % Population |
| Asian | 0 | 0.0% |
| Black / African American | 0 | 0.0% |
| Hawaiian / Pacific | 0 | 0.0% |
| Hispanic or Latino | 0 | 0.0% |
| Native / Alaskan | 0 | 0.0% |
| White / Caucasian | 304 | 100.0% |
| Two or more Races | 0 | 0.0% |
| Some other Race | 0 | 0.0% |
| Total | 304 | 100.0% |
Ancestry in Redwood
The most populous ancestries reported in Redwood are German (51 | 16.8%), Polish (38 | 12.5%), American (32 | 10.5%), European (31 | 10.2%), and Italian (26 | 8.6%), together accounting for 58.6% of all Redwood residents.
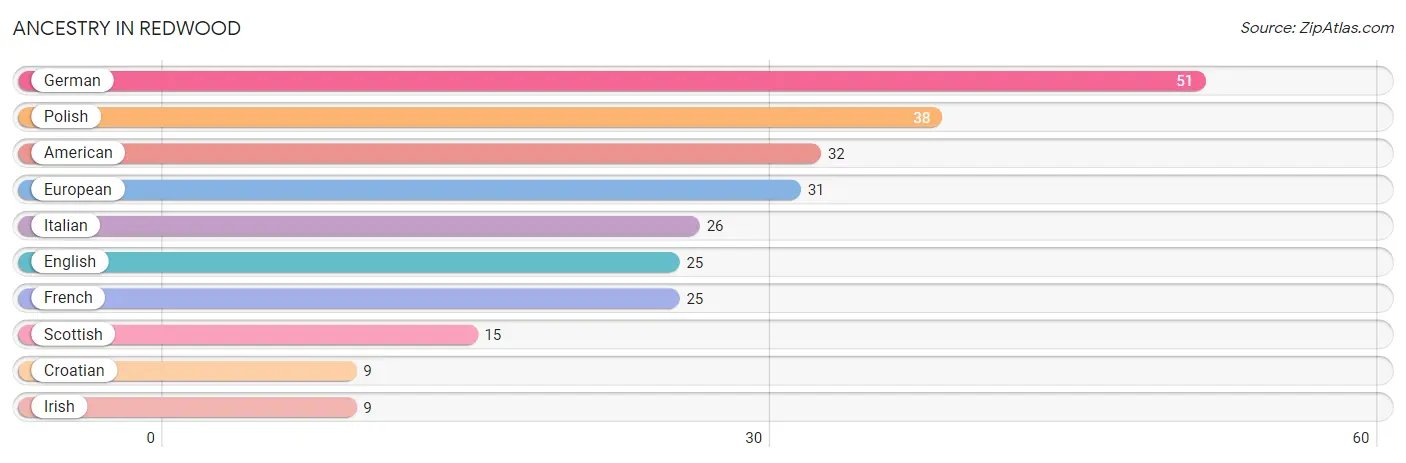
| Ancestry | # Population | % Population |
| American | 32 | 10.5% |
| Croatian | 9 | 3.0% |
| English | 25 | 8.2% |
| European | 31 | 10.2% |
| French | 25 | 8.2% |
| German | 51 | 16.8% |
| Irish | 9 | 3.0% |
| Italian | 26 | 8.6% |
| Polish | 38 | 12.5% |
| Scottish | 15 | 4.9% | View All 10 Rows |
Immigrants in Redwood

| Immigration Origin | # Population | % Population | View All 0 Rows |
Sex and Age in Redwood
Sex and Age in Redwood
The most populous age groups in Redwood are 20 to 24 Years (38 | 23.3%) for men and 20 to 24 Years (30 | 21.3%) for women.
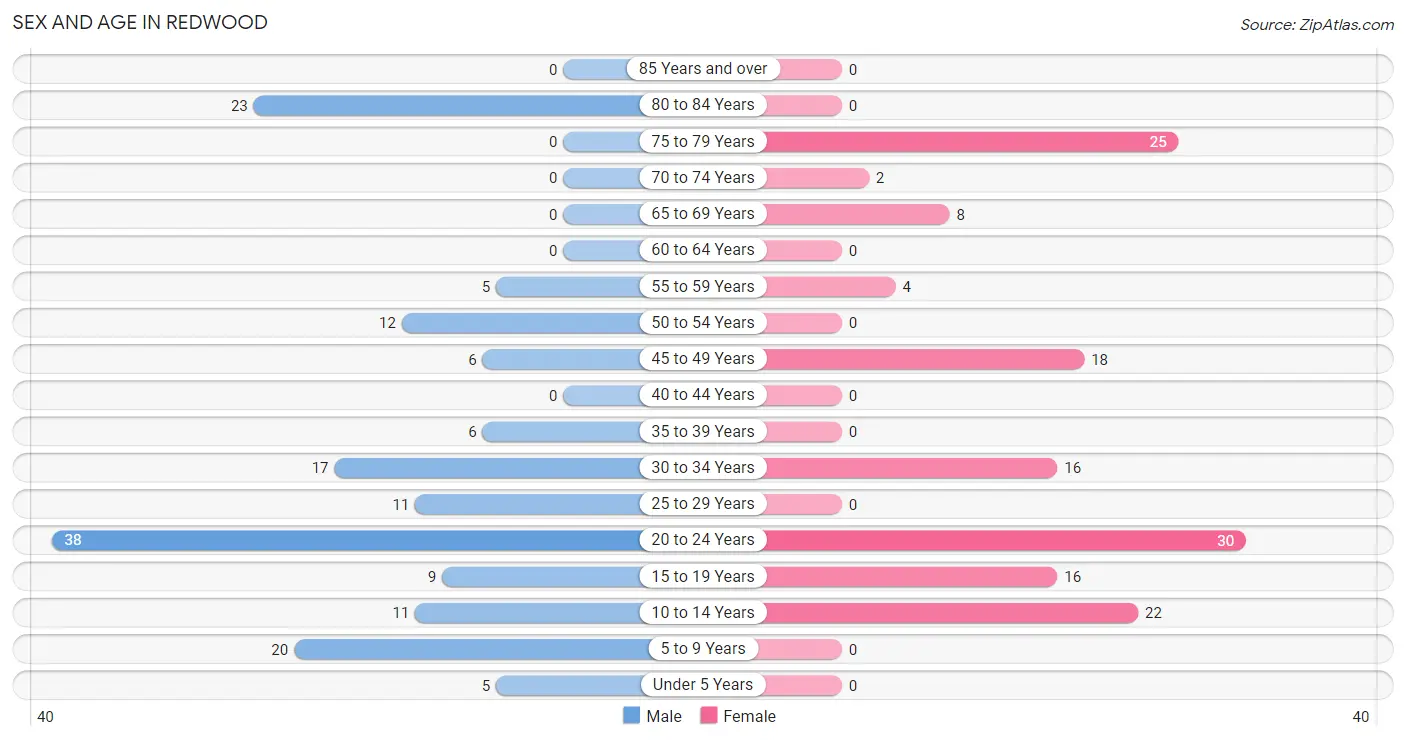
| Age Bracket | Male | Female |
| Under 5 Years | 5 (3.1%) | 0 (0.0%) |
| 5 to 9 Years | 20 (12.3%) | 0 (0.0%) |
| 10 to 14 Years | 11 (6.8%) | 22 (15.6%) |
| 15 to 19 Years | 9 (5.5%) | 16 (11.4%) |
| 20 to 24 Years | 38 (23.3%) | 30 (21.3%) |
| 25 to 29 Years | 11 (6.8%) | 0 (0.0%) |
| 30 to 34 Years | 17 (10.4%) | 16 (11.4%) |
| 35 to 39 Years | 6 (3.7%) | 0 (0.0%) |
| 40 to 44 Years | 0 (0.0%) | 0 (0.0%) |
| 45 to 49 Years | 6 (3.7%) | 18 (12.8%) |
| 50 to 54 Years | 12 (7.4%) | 0 (0.0%) |
| 55 to 59 Years | 5 (3.1%) | 4 (2.8%) |
| 60 to 64 Years | 0 (0.0%) | 0 (0.0%) |
| 65 to 69 Years | 0 (0.0%) | 8 (5.7%) |
| 70 to 74 Years | 0 (0.0%) | 2 (1.4%) |
| 75 to 79 Years | 0 (0.0%) | 25 (17.7%) |
| 80 to 84 Years | 23 (14.1%) | 0 (0.0%) |
| 85 Years and over | 0 (0.0%) | 0 (0.0%) |
| Total | 163 (100.0%) | 141 (100.0%) |
Families and Households in Redwood
Median Family Size in Redwood
The median family size in Redwood is 3.12 persons per family, with single male/father families (6 | 8.1%) accounting for the largest median family size of 4.67 persons per family. On the other hand, single female/mother families (8 | 10.8%) represent the smallest median family size with 2.38 persons per family.
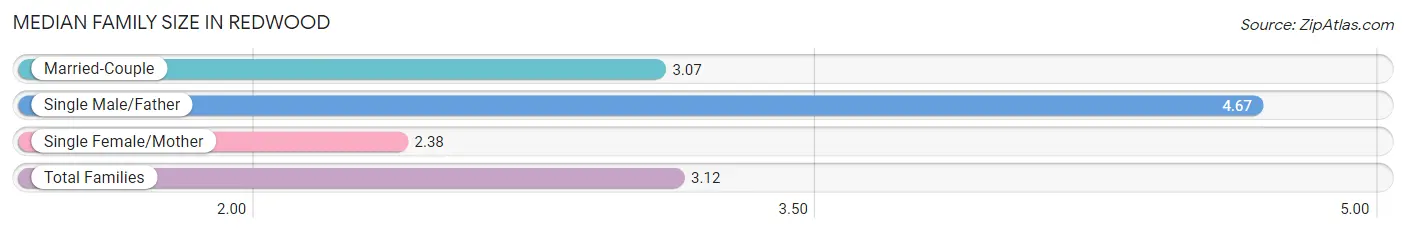
| Family Type | # Families | Family Size |
| Married-Couple | 60 (81.1%) | 3.07 |
| Single Male/Father | 6 (8.1%) | 4.67 |
| Single Female/Mother | 8 (10.8%) | 2.38 |
| Total Families | 74 (100.0%) | 3.12 |
Median Household Size in Redwood
The median household size in Redwood is 2.92 persons per household, with single male/father households (6 | 5.8%) accounting for the largest median household size of 5.5 persons per household. non-family households (30 | 28.8%) represent the smallest median household size with 2.27 persons per household.
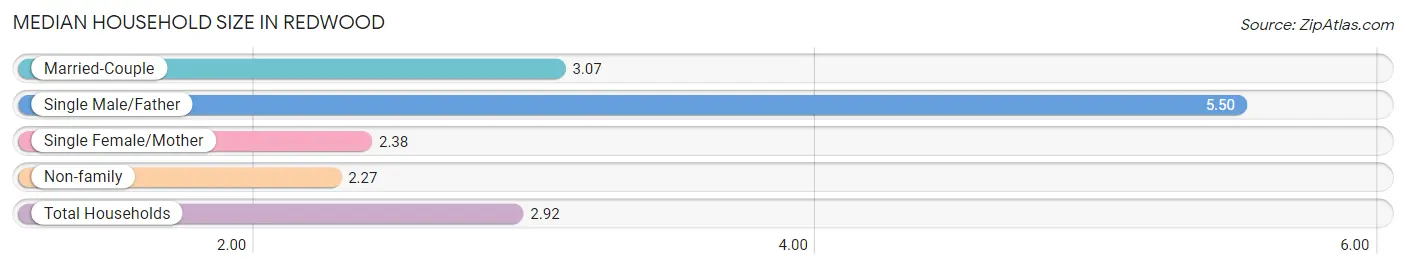
| Household Type | # Households | Household Size |
| Married-Couple | 60 (57.7%) | 3.07 |
| Single Male/Father | 6 (5.8%) | 5.50 |
| Single Female/Mother | 8 (7.7%) | 2.38 |
| Non-family | 30 (28.8%) | 2.27 |
| Total Households | 104 (100.0%) | 2.92 |
Household Size by Marriage Status in Redwood
Out of a total of 104 households in Redwood, 74 (71.2%) are family households, while 30 (28.8%) are nonfamily households. The most numerous type of family households are 2-person households, comprising 46, and the most common type of nonfamily households are 2-person households, comprising 30.
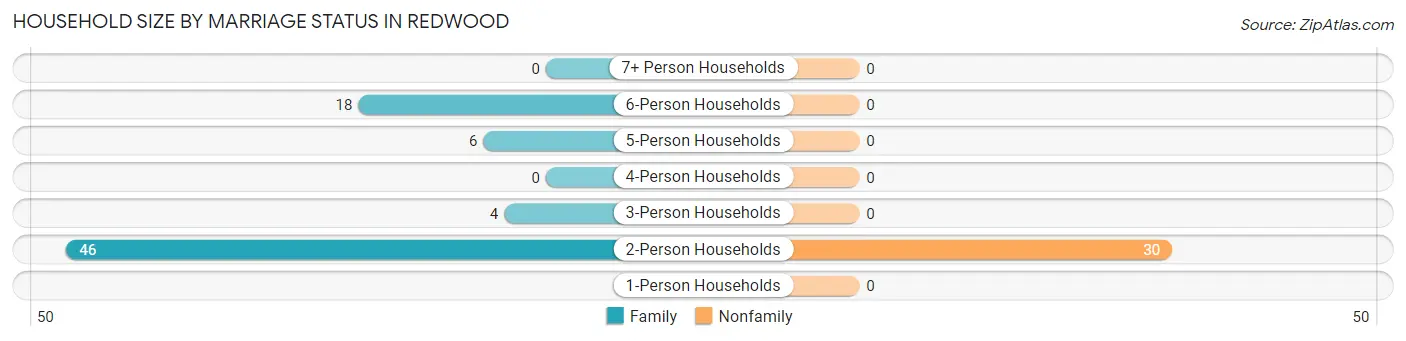
| Household Size | Family Households | Nonfamily Households |
| 1-Person Households | - | 0 (0.0%) |
| 2-Person Households | 46 (44.2%) | 30 (28.8%) |
| 3-Person Households | 4 (3.8%) | 0 (0.0%) |
| 4-Person Households | 0 (0.0%) | 0 (0.0%) |
| 5-Person Households | 6 (5.8%) | 0 (0.0%) |
| 6-Person Households | 18 (17.3%) | 0 (0.0%) |
| 7+ Person Households | 0 (0.0%) | 0 (0.0%) |
| Total | 74 (71.2%) | 30 (28.8%) |
Female Fertility in Redwood
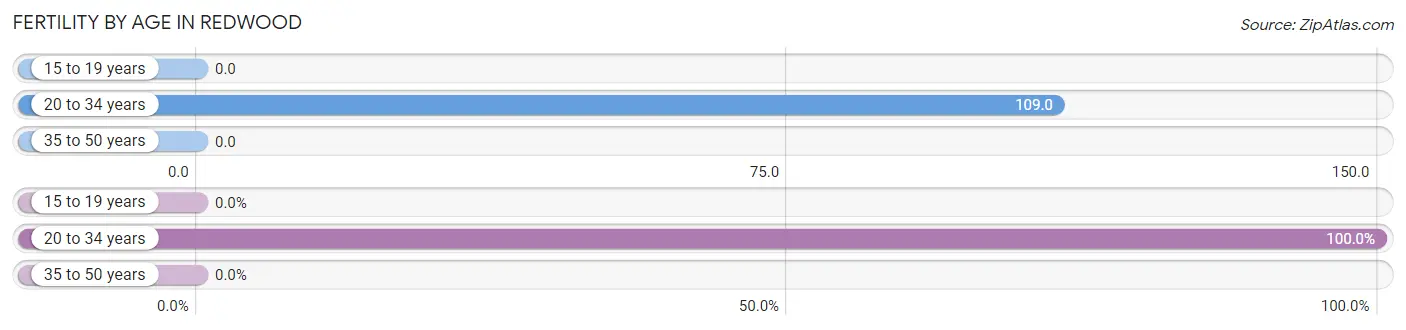
Fertility by Age in Redwood
Average fertility rate in Redwood is 63.0 births per 1,000 women. Women in the age bracket of 20 to 34 years have the highest fertility rate with 109.0 births per 1,000 women. Women in the age bracket of 20 to 34 years acount for 100.0% of all women with births.
| Age Bracket | Women with Births | Births / 1,000 Women |
| 15 to 19 years | 0 (0.0%) | 0.0 |
| 20 to 34 years | 5 (100.0%) | 109.0 |
| 35 to 50 years | 0 (0.0%) | 0.0 |
| Total | 5 (100.0%) | 63.0 |
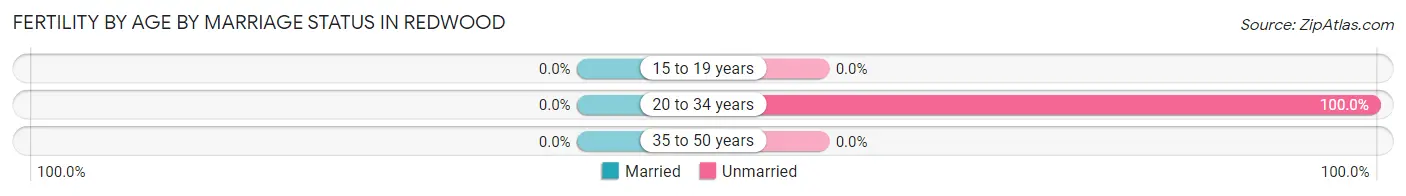
Fertility by Age by Marriage Status in Redwood
| Age Bracket | Married | Unmarried |
| 15 to 19 years | 0 (0.0%) | 0 (0.0%) |
| 20 to 34 years | 0 (0.0%) | 5 (100.0%) |
| 35 to 50 years | 0 (0.0%) | 0 (0.0%) |
| Total | 0 (0.0%) | 5 (100.0%) |
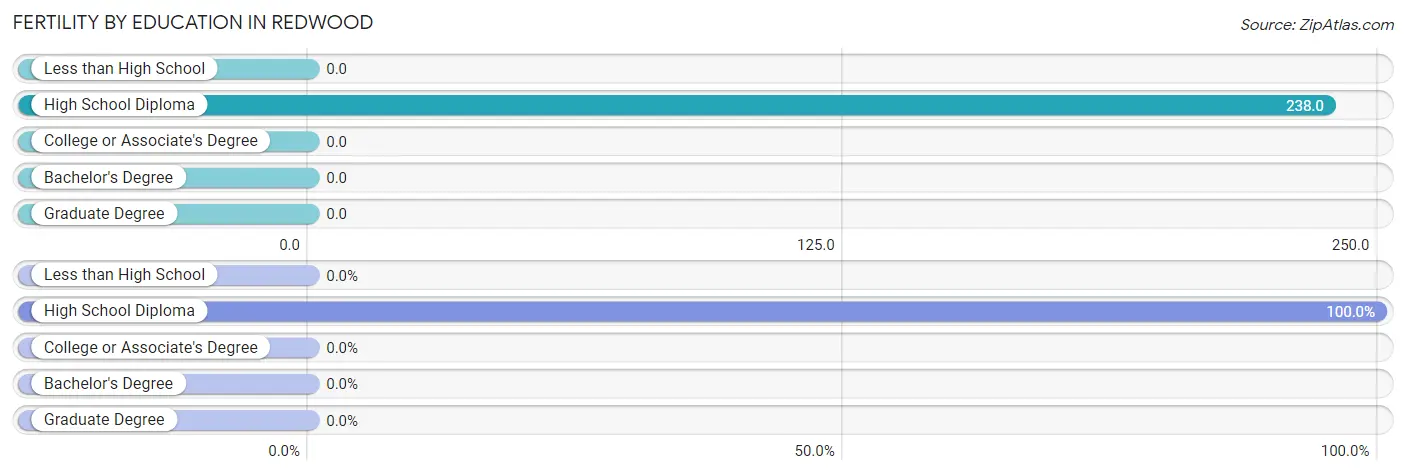
Fertility by Education in Redwood
| Educational Attainment | Women with Births | Births / 1,000 Women |
| Less than High School | 0 (0.0%) | 0.0 |
| High School Diploma | 5 (100.0%) | 238.0 |
| College or Associate's Degree | 0 (0.0%) | 0.0 |
| Bachelor's Degree | 0 (0.0%) | 0.0 |
| Graduate Degree | 0 (0.0%) | 0.0 |
| Total | 5 (100.0%) | 63.0 |
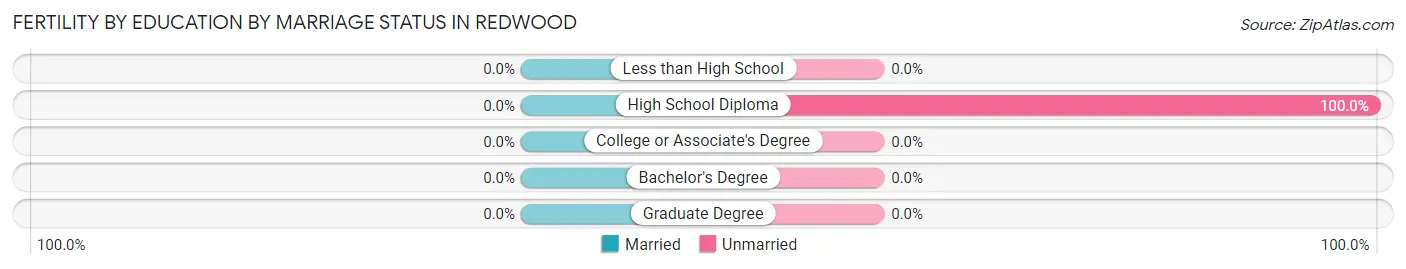
Fertility by Education by Marriage Status in Redwood
| Educational Attainment | Married | Unmarried |
| Less than High School | 0 (0.0%) | 0 (0.0%) |
| High School Diploma | 0 (0.0%) | 5 (100.0%) |
| College or Associate's Degree | 0 (0.0%) | 0 (0.0%) |
| Bachelor's Degree | 0 (0.0%) | 0 (0.0%) |
| Graduate Degree | 0 (0.0%) | 0 (0.0%) |
| Total | 0 (0.0%) | 5 (100.0%) |
Employment Characteristics in Redwood
Employment by Class of Employer in Redwood
Among the 150 employed individuals in Redwood, private company employees (80 | 53.3%), not-for-profit organizations (34 | 22.7%), and federal government employees (25 | 16.7%) make up the most common classes of employment.
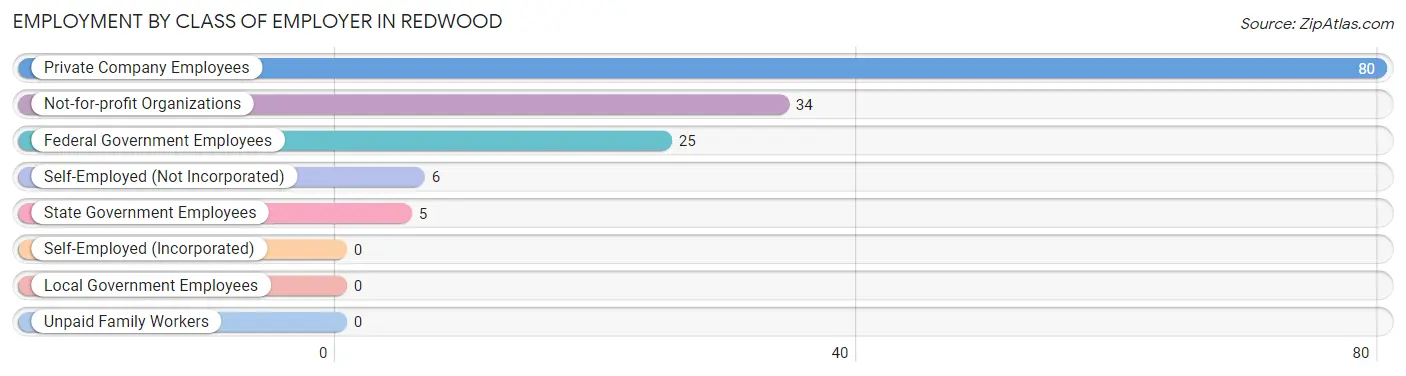
| Employer Class | # Employees | % Employees |
| Private Company Employees | 80 | 53.3% |
| Self-Employed (Incorporated) | 0 | 0.0% |
| Self-Employed (Not Incorporated) | 6 | 4.0% |
| Not-for-profit Organizations | 34 | 22.7% |
| Local Government Employees | 0 | 0.0% |
| State Government Employees | 5 | 3.3% |
| Federal Government Employees | 25 | 16.7% |
| Unpaid Family Workers | 0 | 0.0% |
| Total | 150 | 100.0% |
Employment Status by Age in Redwood
According to the labor force statistics for Redwood, out of the total population over 16 years of age (240), 69.6% or 167 individuals are in the labor force, with 3.6% or 6 of them unemployed. The age group with the highest labor force participation rate is 20 to 24 years, with 100.0% or 68 individuals in the labor force. Within the labor force, the 45 to 54 years age range has the highest percentage of unemployed individuals, with 16.7% or 6 of them being unemployed.
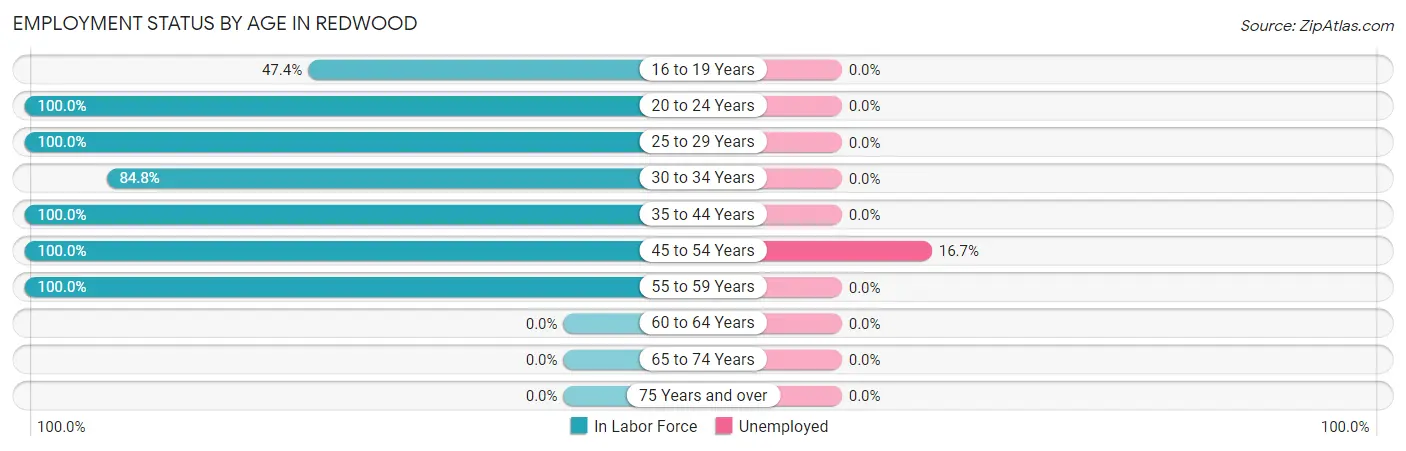
| Age Bracket | In Labor Force | Unemployed |
| 16 to 19 Years | 9 (47.4%) | 0 (0.0%) |
| 20 to 24 Years | 68 (100.0%) | 0 (0.0%) |
| 25 to 29 Years | 11 (100.0%) | 0 (0.0%) |
| 30 to 34 Years | 28 (84.8%) | 0 (0.0%) |
| 35 to 44 Years | 6 (100.0%) | 0 (0.0%) |
| 45 to 54 Years | 36 (100.0%) | 6 (16.7%) |
| 55 to 59 Years | 9 (100.0%) | 0 (0.0%) |
| 60 to 64 Years | 0 (0.0%) | 0 (0.0%) |
| 65 to 74 Years | 0 (0.0%) | 0 (0.0%) |
| 75 Years and over | 0 (0.0%) | 0 (0.0%) |
| Total | 167 (69.6%) | 6 (3.6%) |
Employment Status by Educational Attainment in Redwood
According to labor force statistics for Redwood, 94.7% of individuals (90) out of the total population between 25 and 64 years of age (95) are in the labor force, with 6.7% or 6 of them being unemployed. The group with the highest labor force participation rate are those with the educational attainment of less than high school, with 100.0% or 6 individuals in the labor force. Within the labor force, individuals with college / associate degree education have the highest percentage of unemployment, with 31.6% or 6 of them being unemployed.
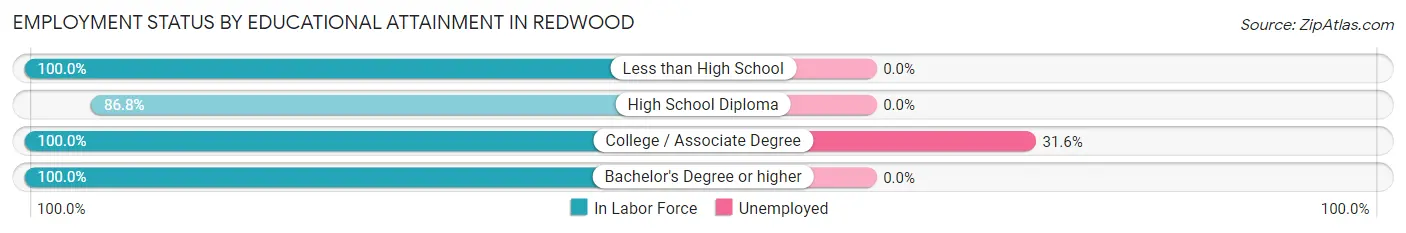
| Educational Attainment | In Labor Force | Unemployed |
| Less than High School | 6 (100.0%) | 0 (0.0%) |
| High School Diploma | 33 (86.8%) | 0 (0.0%) |
| College / Associate Degree | 19 (100.0%) | 6 (31.6%) |
| Bachelor's Degree or higher | 32 (100.0%) | 0 (0.0%) |
| Total | 90 (94.7%) | 6 (6.7%) |
Employment Occupations by Sex in Redwood
Management, Business, Science and Arts Occupations
The most common Management, Business, Science and Arts occupations in Redwood are Computers, Engineering & Science (50 | 31.1%), Community & Social Service (43 | 26.7%), Education Instruction & Library (43 | 26.7%), Architecture & Engineering (38 | 23.6%), and Computers & Mathematics (12 | 7.4%).
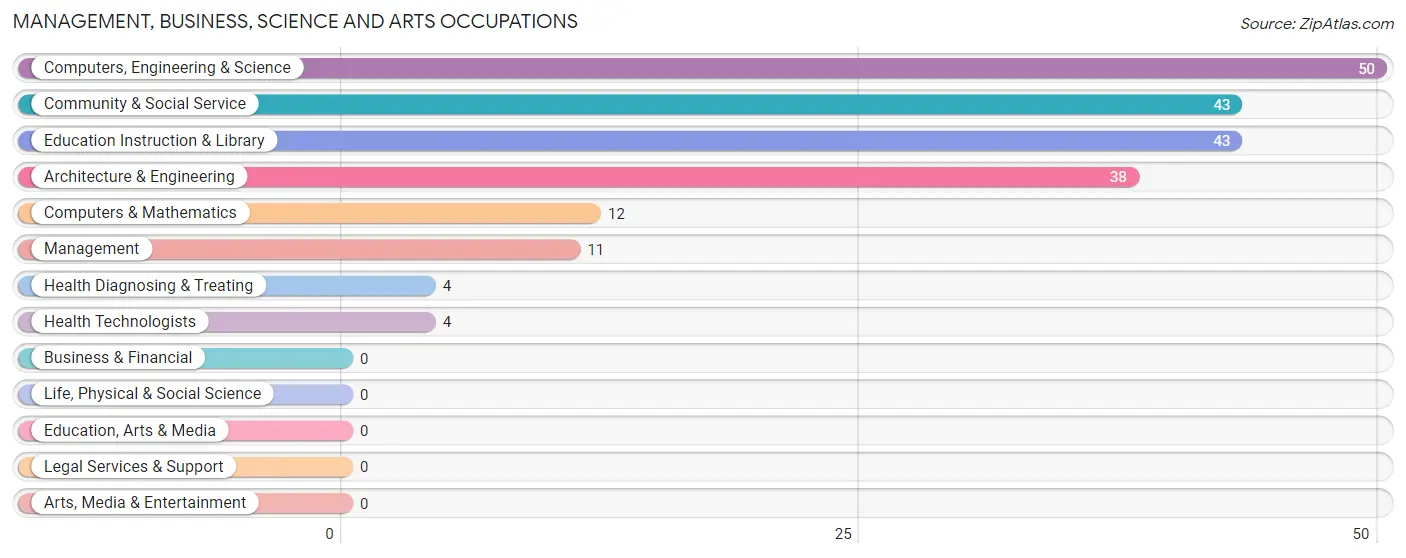
Management, Business, Science and Arts Occupations by Sex
Within the Management, Business, Science and Arts occupations in Redwood, the most male-oriented occupations are Management (100.0%), Computers, Engineering & Science (100.0%), and Computers & Mathematics (100.0%), while the most female-oriented occupations are Community & Social Service (100.0%), Education Instruction & Library (100.0%), and Health Diagnosing & Treating (100.0%).
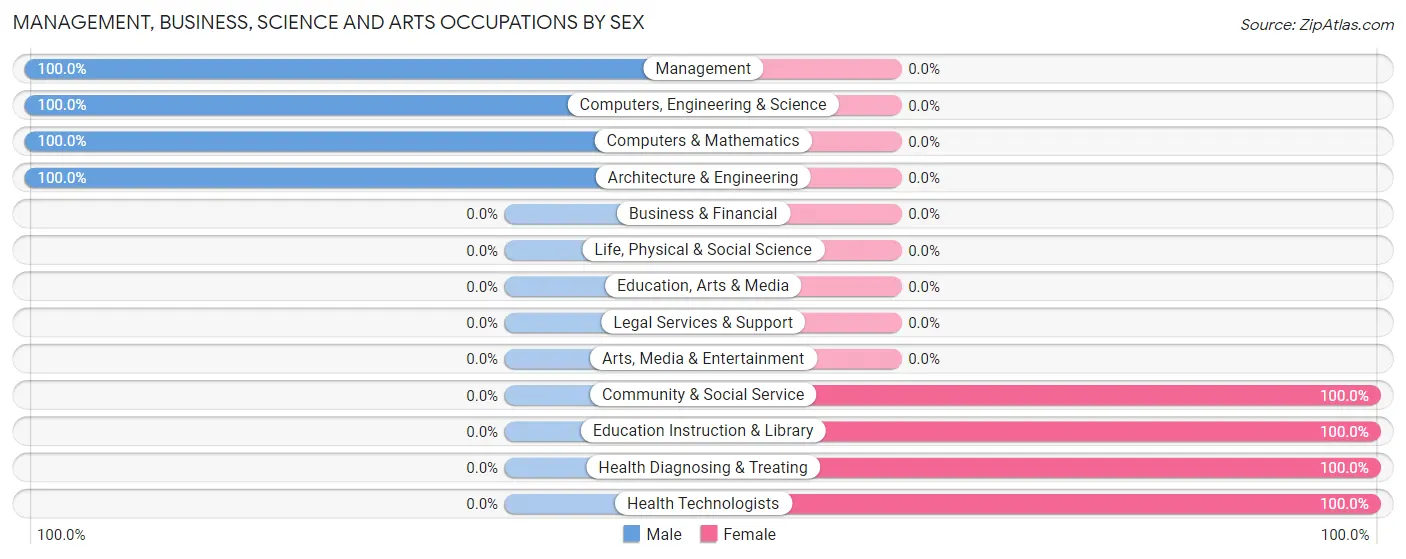
| Occupation | Male | Female |
| Management | 11 (100.0%) | 0 (0.0%) |
| Business & Financial | 0 (0.0%) | 0 (0.0%) |
| Computers, Engineering & Science | 50 (100.0%) | 0 (0.0%) |
| Computers & Mathematics | 12 (100.0%) | 0 (0.0%) |
| Architecture & Engineering | 38 (100.0%) | 0 (0.0%) |
| Life, Physical & Social Science | 0 (0.0%) | 0 (0.0%) |
| Community & Social Service | 0 (0.0%) | 43 (100.0%) |
| Education, Arts & Media | 0 (0.0%) | 0 (0.0%) |
| Legal Services & Support | 0 (0.0%) | 0 (0.0%) |
| Education Instruction & Library | 0 (0.0%) | 43 (100.0%) |
| Arts, Media & Entertainment | 0 (0.0%) | 0 (0.0%) |
| Health Diagnosing & Treating | 0 (0.0%) | 4 (100.0%) |
| Health Technologists | 0 (0.0%) | 4 (100.0%) |
| Total (Category) | 61 (56.5%) | 47 (43.5%) |
| Total (Overall) | 98 (60.9%) | 63 (39.1%) |
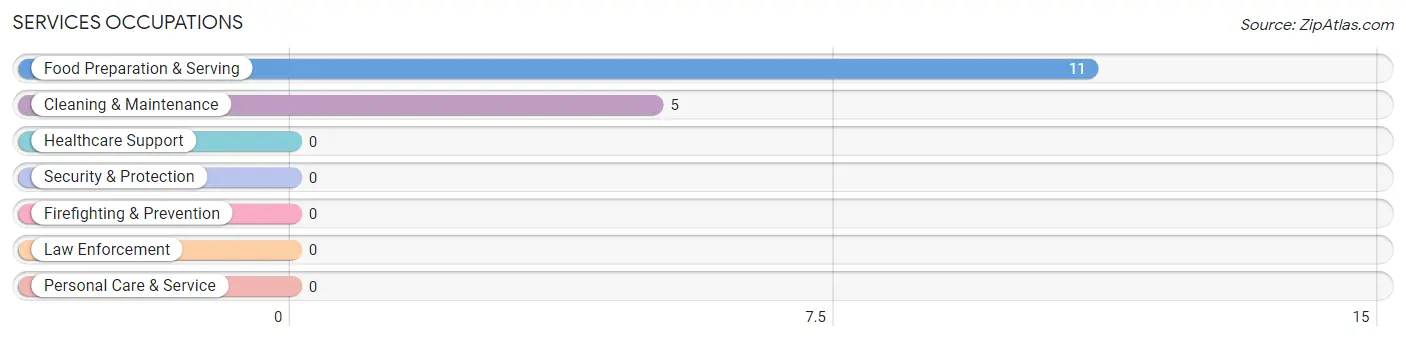
Services Occupations
The most common Services occupations in Redwood are Food Preparation & Serving (11 | 6.8%), and Cleaning & Maintenance (5 | 3.1%).
Services Occupations by Sex
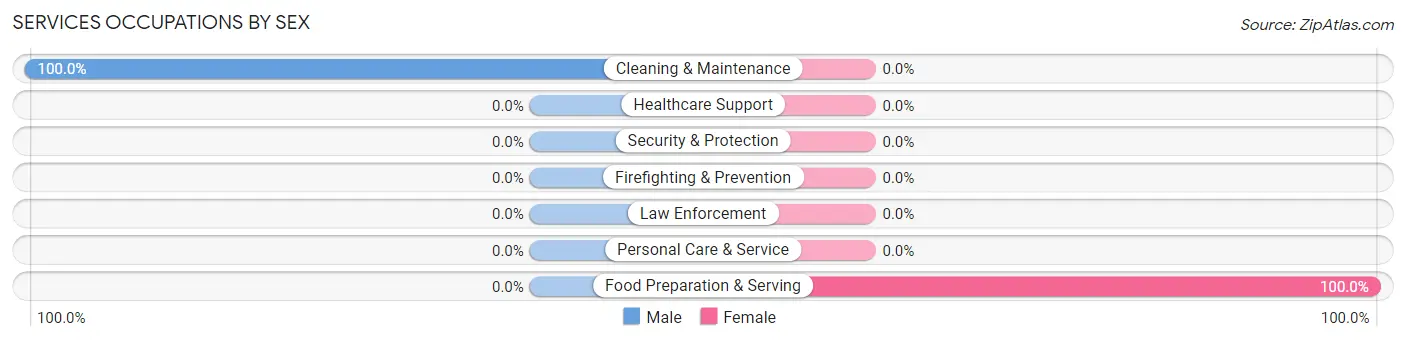
| Occupation | Male | Female |
| Healthcare Support | 0 (0.0%) | 0 (0.0%) |
| Security & Protection | 0 (0.0%) | 0 (0.0%) |
| Firefighting & Prevention | 0 (0.0%) | 0 (0.0%) |
| Law Enforcement | 0 (0.0%) | 0 (0.0%) |
| Food Preparation & Serving | 0 (0.0%) | 11 (100.0%) |
| Cleaning & Maintenance | 5 (100.0%) | 0 (0.0%) |
| Personal Care & Service | 0 (0.0%) | 0 (0.0%) |
| Total (Category) | 5 (31.2%) | 11 (68.8%) |
| Total (Overall) | 98 (60.9%) | 63 (39.1%) |
Sales and Office Occupations
The most common Sales and Office occupations in Redwood are Office & Administration (16 | 9.9%), and Sales & Related (9 | 5.6%).
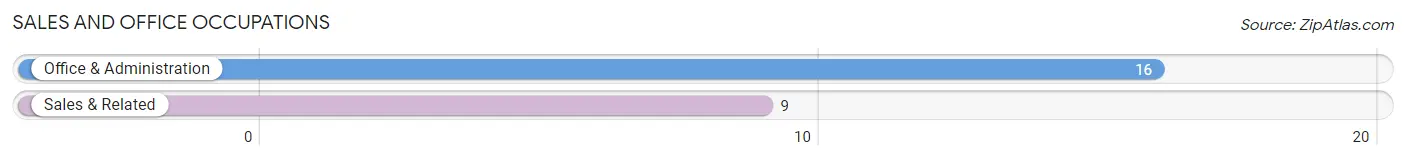
Sales and Office Occupations by Sex
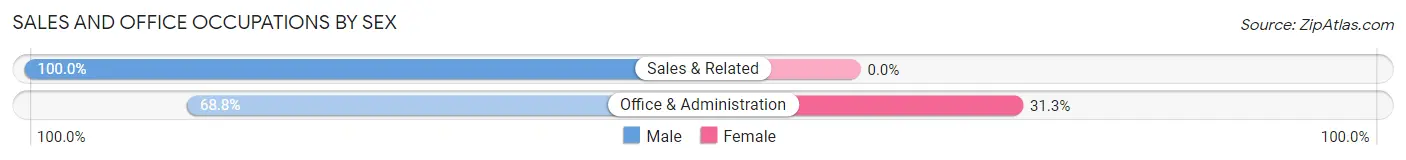
| Occupation | Male | Female |
| Sales & Related | 9 (100.0%) | 0 (0.0%) |
| Office & Administration | 11 (68.8%) | 5 (31.2%) |
| Total (Category) | 20 (80.0%) | 5 (20.0%) |
| Total (Overall) | 98 (60.9%) | 63 (39.1%) |
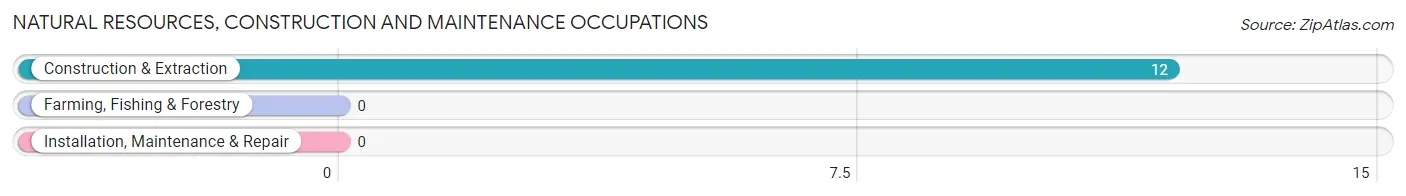
Natural Resources, Construction and Maintenance Occupations
The most common Natural Resources, Construction and Maintenance occupations in Redwood are , and Construction & Extraction (12 | 7.4%).
Natural Resources, Construction and Maintenance Occupations by Sex
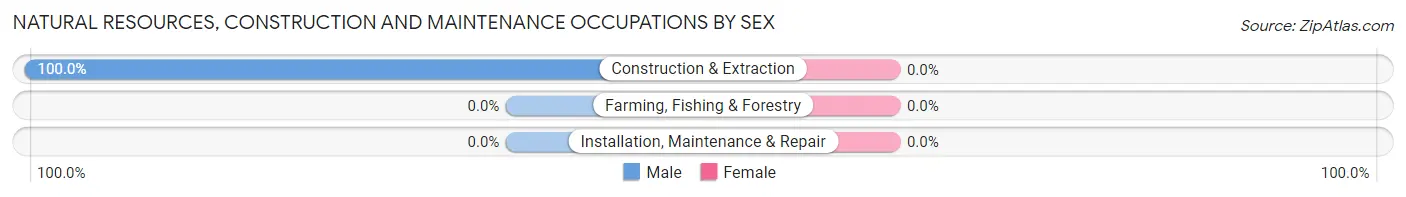
| Occupation | Male | Female |
| Farming, Fishing & Forestry | 0 (0.0%) | 0 (0.0%) |
| Construction & Extraction | 12 (100.0%) | 0 (0.0%) |
| Installation, Maintenance & Repair | 0 (0.0%) | 0 (0.0%) |
| Total (Category) | 12 (100.0%) | 0 (0.0%) |
| Total (Overall) | 98 (60.9%) | 63 (39.1%) |
Production, Transportation and Moving Occupations
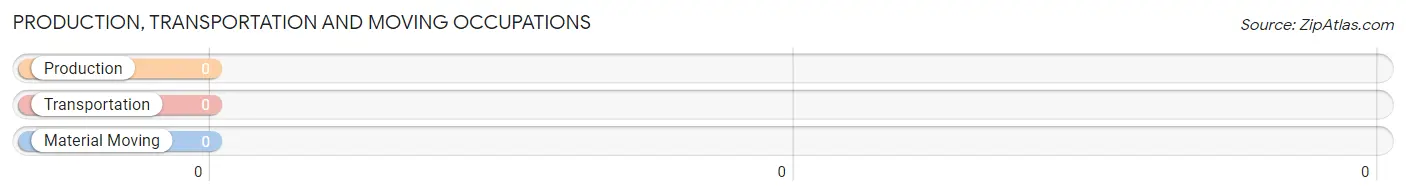
Production, Transportation and Moving Occupations by Sex
| Occupation | Male | Female |
| Production | 0 (0.0%) | 0 (0.0%) |
| Transportation | 0 (0.0%) | 0 (0.0%) |
| Material Moving | 0 (0.0%) | 0 (0.0%) |
| Total (Category) | 0 (0.0%) | 0 (0.0%) |
| Total (Overall) | 98 (60.9%) | 63 (39.1%) |
Employment Industries by Sex in Redwood
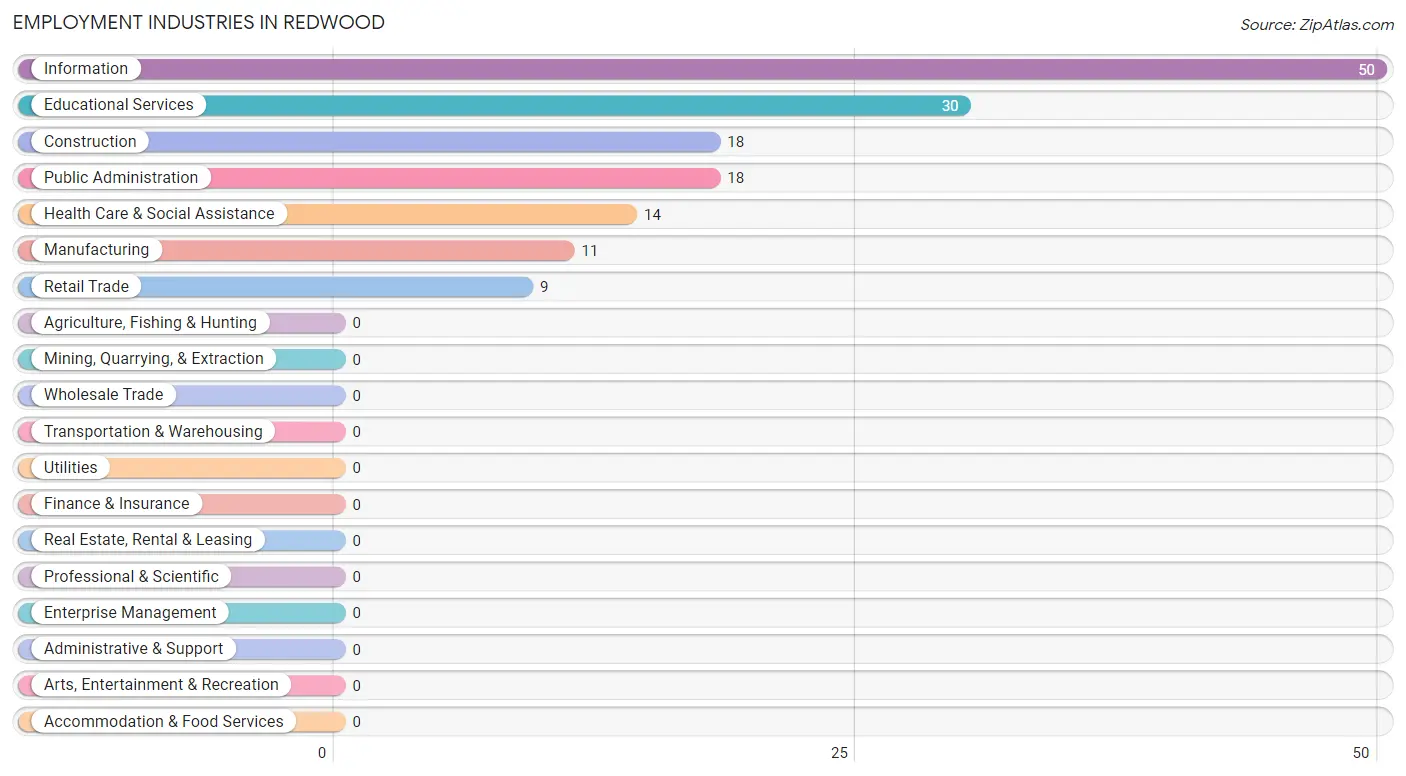
Employment Industries in Redwood
The major employment industries in Redwood include Information (50 | 31.1%), Educational Services (30 | 18.6%), Construction (18 | 11.2%), Public Administration (18 | 11.2%), and Health Care & Social Assistance (14 | 8.7%).
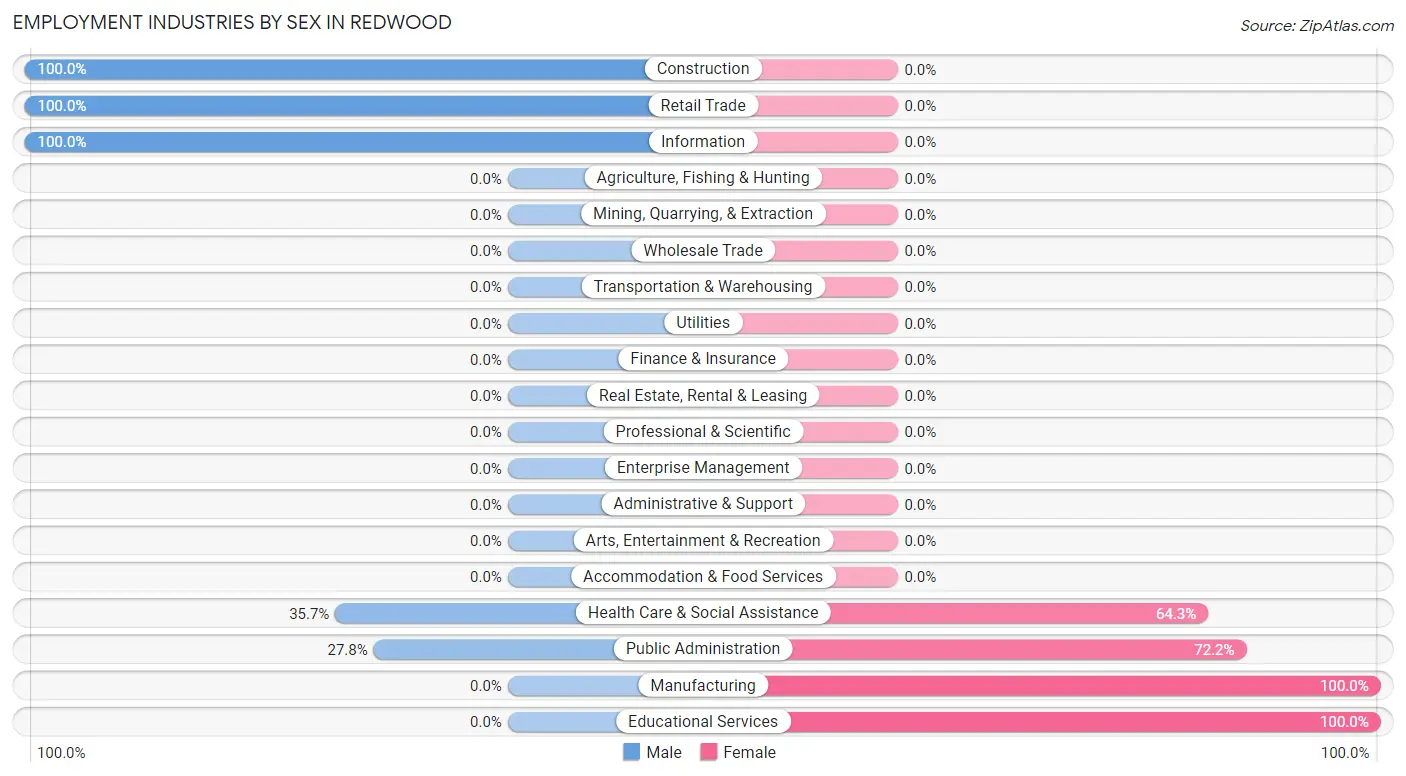
Employment Industries by Sex in Redwood
The Redwood industries that see more men than women are Construction (100.0%), Retail Trade (100.0%), and Information (100.0%), whereas the industries that tend to have a higher number of women are Manufacturing (100.0%), Educational Services (100.0%), and Public Administration (72.2%).
| Industry | Male | Female |
| Agriculture, Fishing & Hunting | 0 (0.0%) | 0 (0.0%) |
| Mining, Quarrying, & Extraction | 0 (0.0%) | 0 (0.0%) |
| Construction | 18 (100.0%) | 0 (0.0%) |
| Manufacturing | 0 (0.0%) | 11 (100.0%) |
| Wholesale Trade | 0 (0.0%) | 0 (0.0%) |
| Retail Trade | 9 (100.0%) | 0 (0.0%) |
| Transportation & Warehousing | 0 (0.0%) | 0 (0.0%) |
| Utilities | 0 (0.0%) | 0 (0.0%) |
| Information | 50 (100.0%) | 0 (0.0%) |
| Finance & Insurance | 0 (0.0%) | 0 (0.0%) |
| Real Estate, Rental & Leasing | 0 (0.0%) | 0 (0.0%) |
| Professional & Scientific | 0 (0.0%) | 0 (0.0%) |
| Enterprise Management | 0 (0.0%) | 0 (0.0%) |
| Administrative & Support | 0 (0.0%) | 0 (0.0%) |
| Educational Services | 0 (0.0%) | 30 (100.0%) |
| Health Care & Social Assistance | 5 (35.7%) | 9 (64.3%) |
| Arts, Entertainment & Recreation | 0 (0.0%) | 0 (0.0%) |
| Accommodation & Food Services | 0 (0.0%) | 0 (0.0%) |
| Public Administration | 5 (27.8%) | 13 (72.2%) |
| Total | 98 (60.9%) | 63 (39.1%) |
Education in Redwood
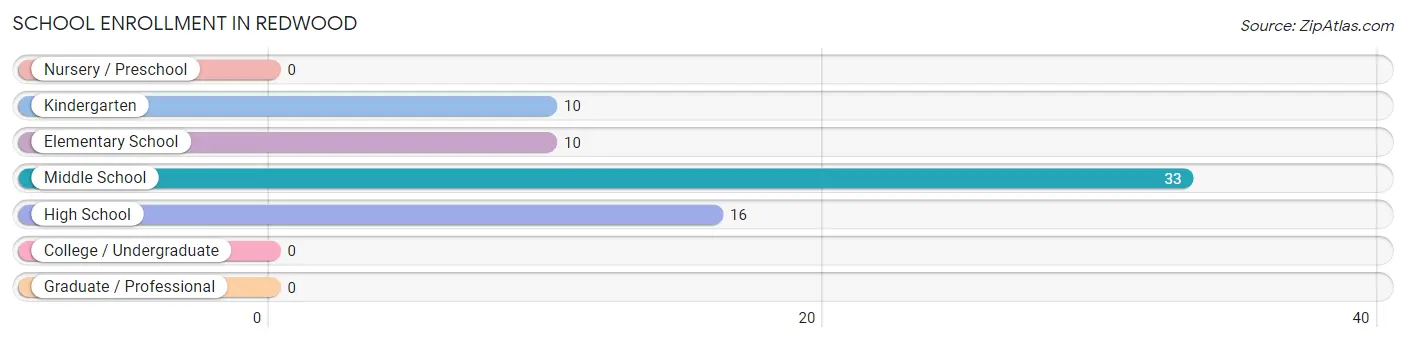
School Enrollment in Redwood
The most common levels of schooling among the 69 students in Redwood are middle school (33 | 47.8%), high school (16 | 23.2%), and kindergarten (10 | 14.5%).
| School Level | # Students | % Students |
| Nursery / Preschool | 0 | 0.0% |
| Kindergarten | 10 | 14.5% |
| Elementary School | 10 | 14.5% |
| Middle School | 33 | 47.8% |
| High School | 16 | 23.2% |
| College / Undergraduate | 0 | 0.0% |
| Graduate / Professional | 0 | 0.0% |
| Total | 69 | 100.0% |
School Enrollment by Age by Funding Source in Redwood
Out of a total of 69 students who are enrolled in schools in Redwood, 10 (14.5%) attend a private institution, while the remaining 59 (85.5%) are enrolled in public schools. The age group of 5 to 9 year old has the highest likelihood of being enrolled in private schools, with 10 (50.0% in the age bracket) enrolled. Conversely, the age group of 10 to 14 year olds has the lowest likelihood of being enrolled in a private school, with 33 (100.0% in the age bracket) attending a public institution.
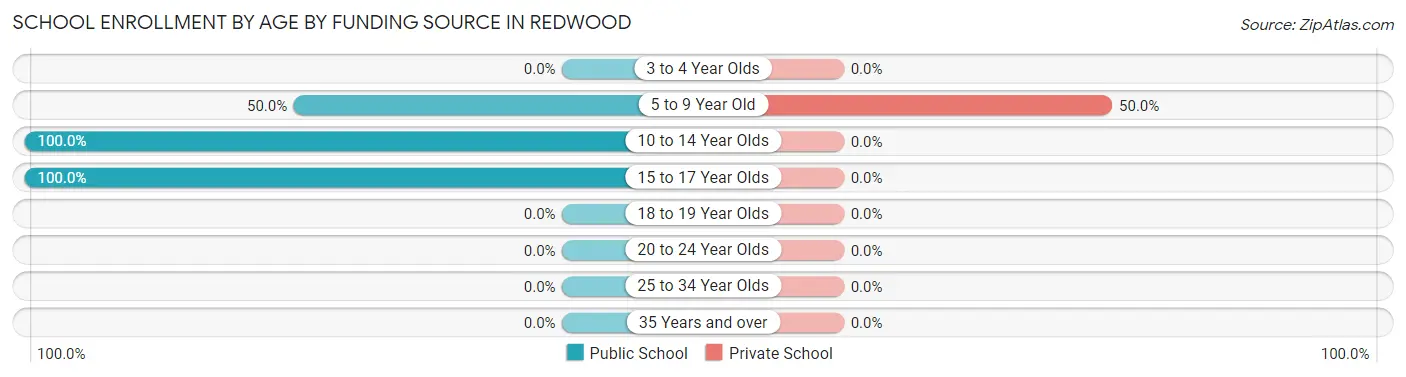
| Age Bracket | Public School | Private School |
| 3 to 4 Year Olds | 0 (0.0%) | 0 (0.0%) |
| 5 to 9 Year Old | 10 (50.0%) | 10 (50.0%) |
| 10 to 14 Year Olds | 33 (100.0%) | 0 (0.0%) |
| 15 to 17 Year Olds | 16 (100.0%) | 0 (0.0%) |
| 18 to 19 Year Olds | 0 (0.0%) | 0 (0.0%) |
| 20 to 24 Year Olds | 0 (0.0%) | 0 (0.0%) |
| 25 to 34 Year Olds | 0 (0.0%) | 0 (0.0%) |
| 35 Years and over | 0 (0.0%) | 0 (0.0%) |
| Total | 59 (85.5%) | 10 (14.5%) |
Educational Attainment by Field of Study in Redwood
Social sciences (12 | 37.5%), psychology (11 | 34.4%), physical & health sciences (5 | 15.6%), and science & technology (4 | 12.5%) are the most common fields of study among 32 individuals in Redwood who have obtained a bachelor's degree or higher.
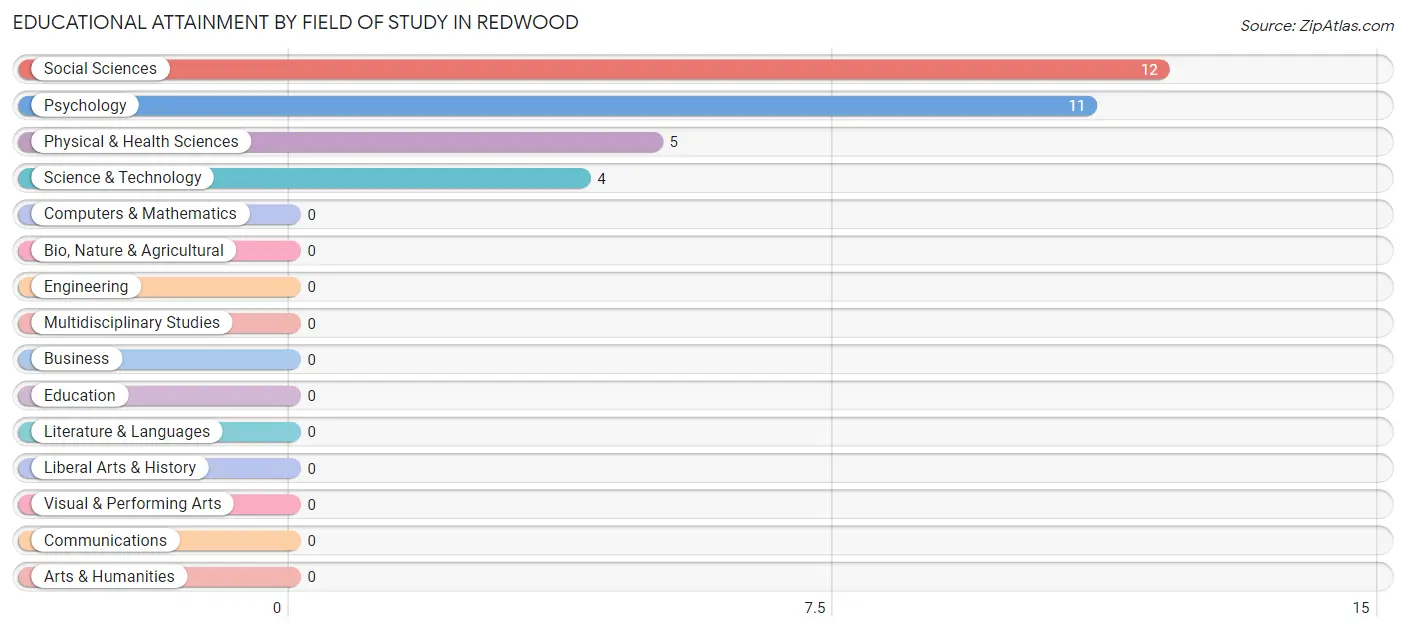
| Field of Study | # Graduates | % Graduates |
| Computers & Mathematics | 0 | 0.0% |
| Bio, Nature & Agricultural | 0 | 0.0% |
| Physical & Health Sciences | 5 | 15.6% |
| Psychology | 11 | 34.4% |
| Social Sciences | 12 | 37.5% |
| Engineering | 0 | 0.0% |
| Multidisciplinary Studies | 0 | 0.0% |
| Science & Technology | 4 | 12.5% |
| Business | 0 | 0.0% |
| Education | 0 | 0.0% |
| Literature & Languages | 0 | 0.0% |
| Liberal Arts & History | 0 | 0.0% |
| Visual & Performing Arts | 0 | 0.0% |
| Communications | 0 | 0.0% |
| Arts & Humanities | 0 | 0.0% |
| Total | 32 | 100.0% |
Transportation & Commute in Redwood
Vehicle Availability by Sex in Redwood
The most prevalent vehicle ownership categories in Redwood are males with 2 vehicles (48, accounting for 55.2%) and females with 2 vehicles (34, making up 76.2%).
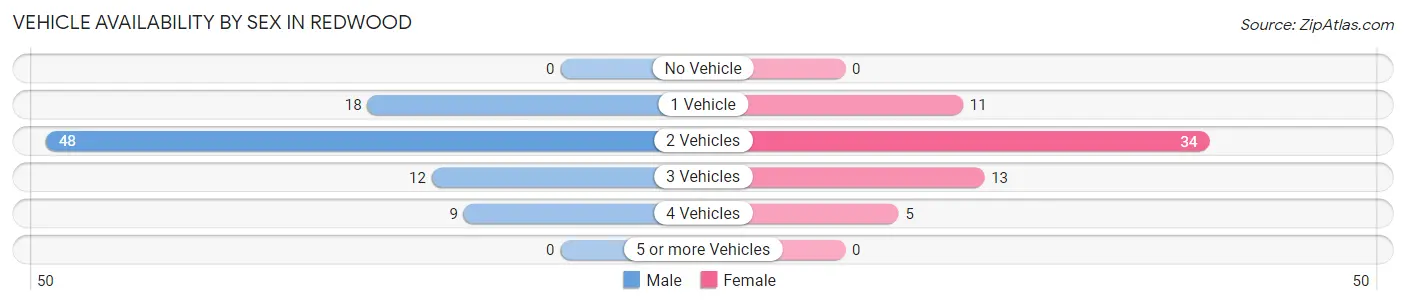
| Vehicles Available | Male | Female |
| No Vehicle | 0 (0.0%) | 0 (0.0%) |
| 1 Vehicle | 18 (20.7%) | 11 (17.5%) |
| 2 Vehicles | 48 (55.2%) | 34 (54.0%) |
| 3 Vehicles | 12 (13.8%) | 13 (20.6%) |
| 4 Vehicles | 9 (10.3%) | 5 (7.9%) |
| 5 or more Vehicles | 0 (0.0%) | 0 (0.0%) |
| Total | 87 (100.0%) | 63 (100.0%) |
Commute Time in Redwood
The most frequently occuring commute durations in Redwood are 35 to 39 minutes (50 commuters, 34.5%), 10 to 14 minutes (30 commuters, 20.7%), and 25 to 29 minutes (25 commuters, 17.2%).
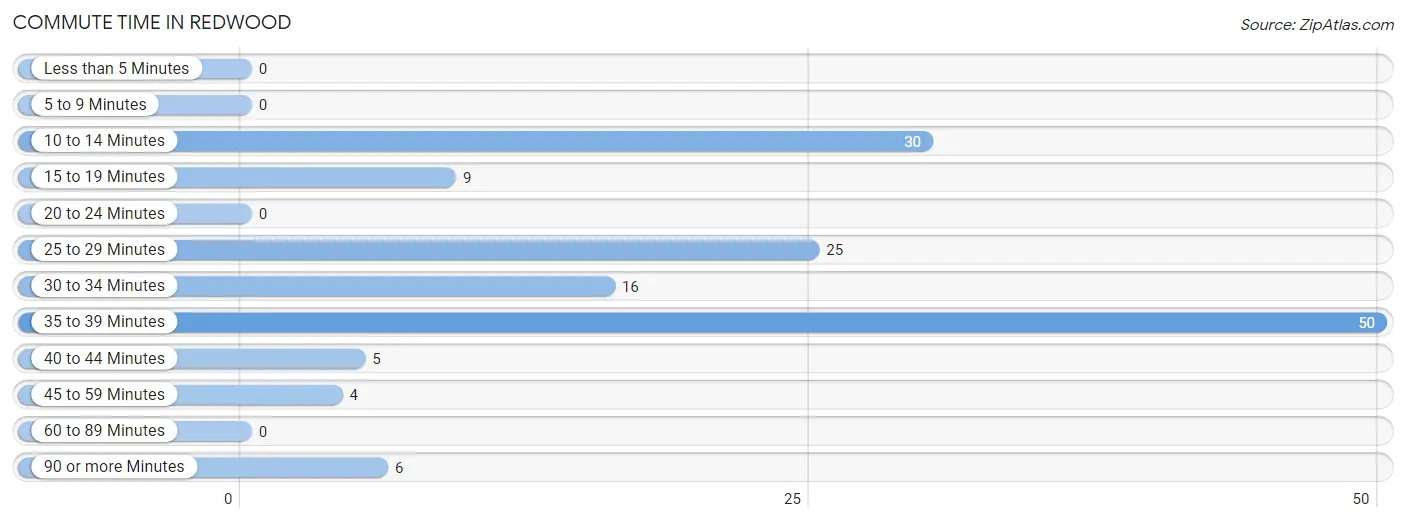
| Commute Time | # Commuters | % Commuters |
| Less than 5 Minutes | 0 | 0.0% |
| 5 to 9 Minutes | 0 | 0.0% |
| 10 to 14 Minutes | 30 | 20.7% |
| 15 to 19 Minutes | 9 | 6.2% |
| 20 to 24 Minutes | 0 | 0.0% |
| 25 to 29 Minutes | 25 | 17.2% |
| 30 to 34 Minutes | 16 | 11.0% |
| 35 to 39 Minutes | 50 | 34.5% |
| 40 to 44 Minutes | 5 | 3.5% |
| 45 to 59 Minutes | 4 | 2.8% |
| 60 to 89 Minutes | 0 | 0.0% |
| 90 or more Minutes | 6 | 4.1% |
Commute Time by Sex in Redwood
The most common commute times in Redwood are 35 to 39 minutes (50 commuters, 61.0%) for males and 10 to 14 minutes (30 commuters, 47.6%) for females.
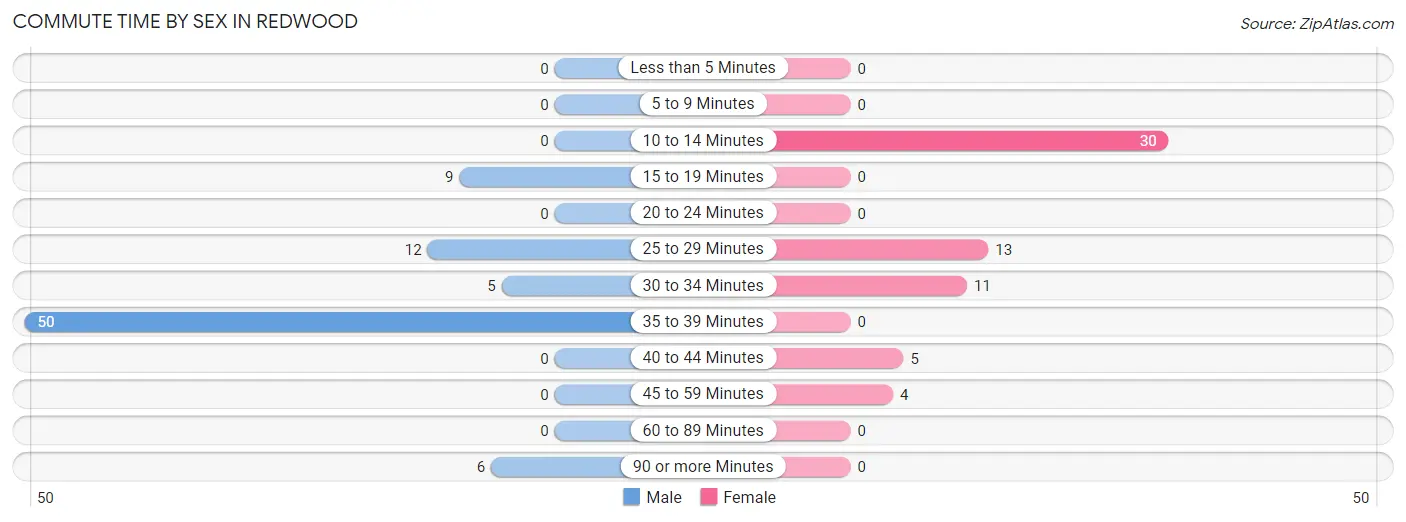
| Commute Time | Male | Female |
| Less than 5 Minutes | 0 (0.0%) | 0 (0.0%) |
| 5 to 9 Minutes | 0 (0.0%) | 0 (0.0%) |
| 10 to 14 Minutes | 0 (0.0%) | 30 (47.6%) |
| 15 to 19 Minutes | 9 (11.0%) | 0 (0.0%) |
| 20 to 24 Minutes | 0 (0.0%) | 0 (0.0%) |
| 25 to 29 Minutes | 12 (14.6%) | 13 (20.6%) |
| 30 to 34 Minutes | 5 (6.1%) | 11 (17.5%) |
| 35 to 39 Minutes | 50 (61.0%) | 0 (0.0%) |
| 40 to 44 Minutes | 0 (0.0%) | 5 (7.9%) |
| 45 to 59 Minutes | 0 (0.0%) | 4 (6.4%) |
| 60 to 89 Minutes | 0 (0.0%) | 0 (0.0%) |
| 90 or more Minutes | 6 (7.3%) | 0 (0.0%) |
Time of Departure to Work by Sex in Redwood
The most frequent times of departure to work in Redwood are 6:00 AM to 6:29 AM (44, 53.7%) for males and 7:00 AM to 7:29 AM (43, 68.2%) for females.
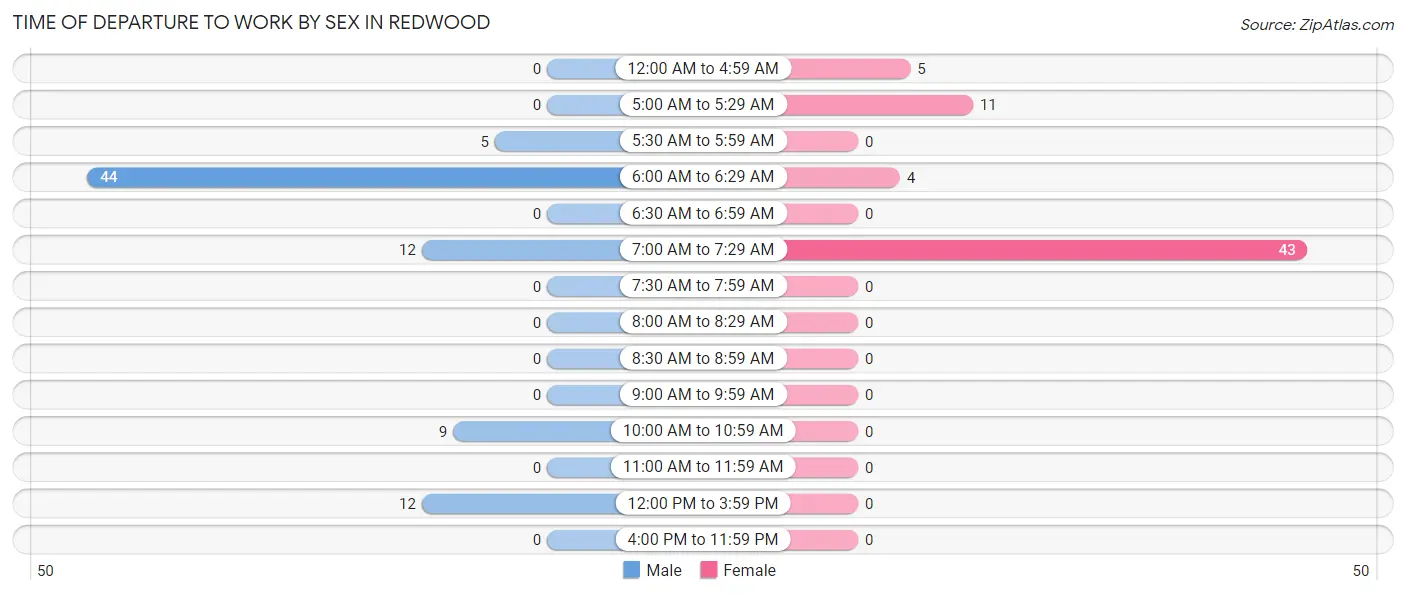
| Time of Departure | Male | Female |
| 12:00 AM to 4:59 AM | 0 (0.0%) | 5 (7.9%) |
| 5:00 AM to 5:29 AM | 0 (0.0%) | 11 (17.5%) |
| 5:30 AM to 5:59 AM | 5 (6.1%) | 0 (0.0%) |
| 6:00 AM to 6:29 AM | 44 (53.7%) | 4 (6.4%) |
| 6:30 AM to 6:59 AM | 0 (0.0%) | 0 (0.0%) |
| 7:00 AM to 7:29 AM | 12 (14.6%) | 43 (68.2%) |
| 7:30 AM to 7:59 AM | 0 (0.0%) | 0 (0.0%) |
| 8:00 AM to 8:29 AM | 0 (0.0%) | 0 (0.0%) |
| 8:30 AM to 8:59 AM | 0 (0.0%) | 0 (0.0%) |
| 9:00 AM to 9:59 AM | 0 (0.0%) | 0 (0.0%) |
| 10:00 AM to 10:59 AM | 9 (11.0%) | 0 (0.0%) |
| 11:00 AM to 11:59 AM | 0 (0.0%) | 0 (0.0%) |
| 12:00 PM to 3:59 PM | 12 (14.6%) | 0 (0.0%) |
| 4:00 PM to 11:59 PM | 0 (0.0%) | 0 (0.0%) |
| Total | 82 (100.0%) | 63 (100.0%) |
Housing Occupancy in Redwood
Occupancy by Ownership in Redwood
Of the total 104 dwellings in Redwood, owner-occupied units account for 92 (88.5%), while renter-occupied units make up 12 (11.5%).
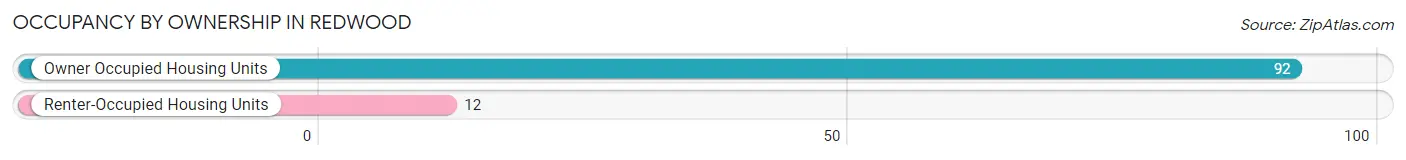
| Occupancy | # Housing Units | % Housing Units |
| Owner Occupied Housing Units | 92 | 88.5% |
| Renter-Occupied Housing Units | 12 | 11.5% |
| Total Occupied Housing Units | 104 | 100.0% |
Occupancy by Household Size in Redwood
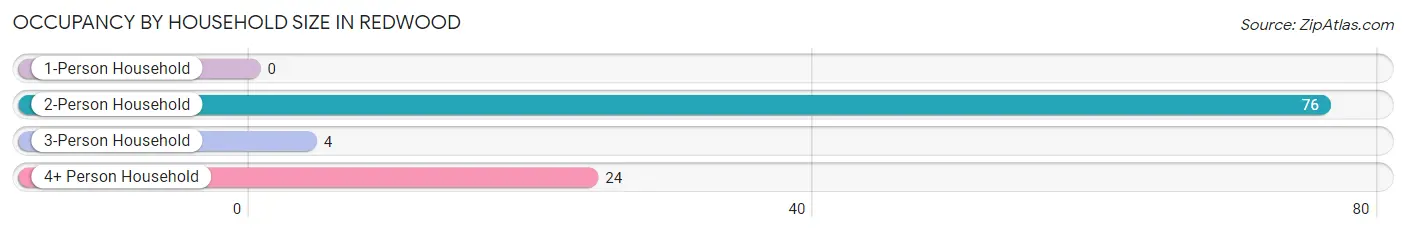
| Household Size | # Housing Units | % Housing Units |
| 1-Person Household | 0 | 0.0% |
| 2-Person Household | 76 | 73.1% |
| 3-Person Household | 4 | 3.8% |
| 4+ Person Household | 24 | 23.1% |
| Total Housing Units | 104 | 100.0% |
Occupancy by Ownership by Household Size in Redwood
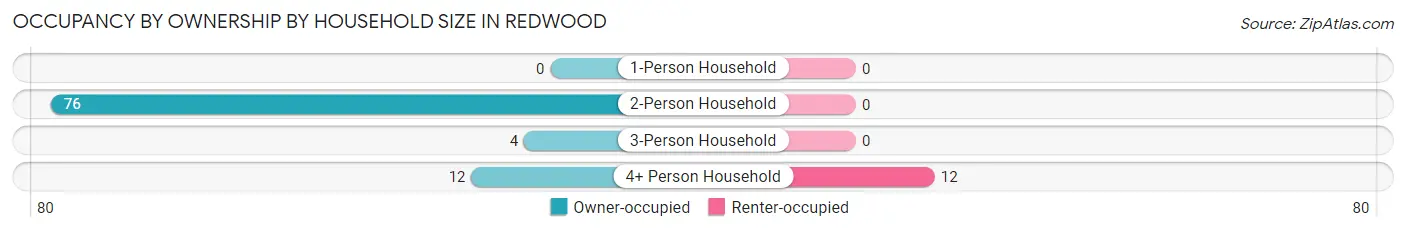
| Household Size | Owner-occupied | Renter-occupied |
| 1-Person Household | 0 (0.0%) | 0 (0.0%) |
| 2-Person Household | 76 (100.0%) | 0 (0.0%) |
| 3-Person Household | 4 (100.0%) | 0 (0.0%) |
| 4+ Person Household | 12 (50.0%) | 12 (50.0%) |
| Total Housing Units | 92 (88.5%) | 12 (11.5%) |
Occupancy by Educational Attainment in Redwood
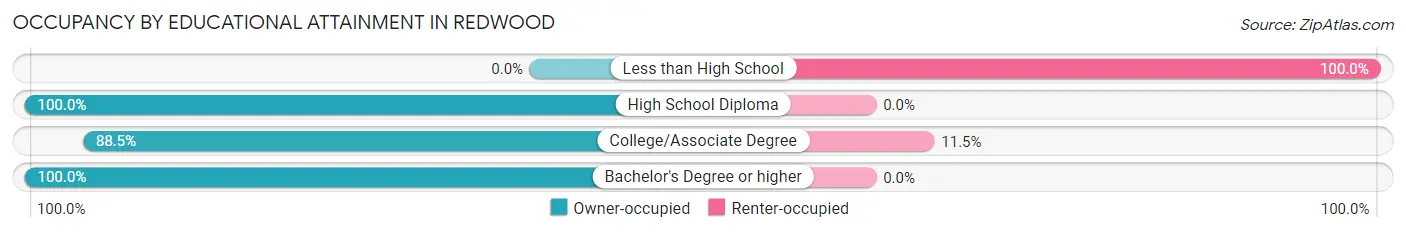
| Household Size | Owner-occupied | Renter-occupied |
| Less than High School | 0 (0.0%) | 6 (100.0%) |
| High School Diploma | 12 (100.0%) | 0 (0.0%) |
| College/Associate Degree | 46 (88.5%) | 6 (11.5%) |
| Bachelor's Degree or higher | 34 (100.0%) | 0 (0.0%) |
Occupancy by Age of Householder in Redwood
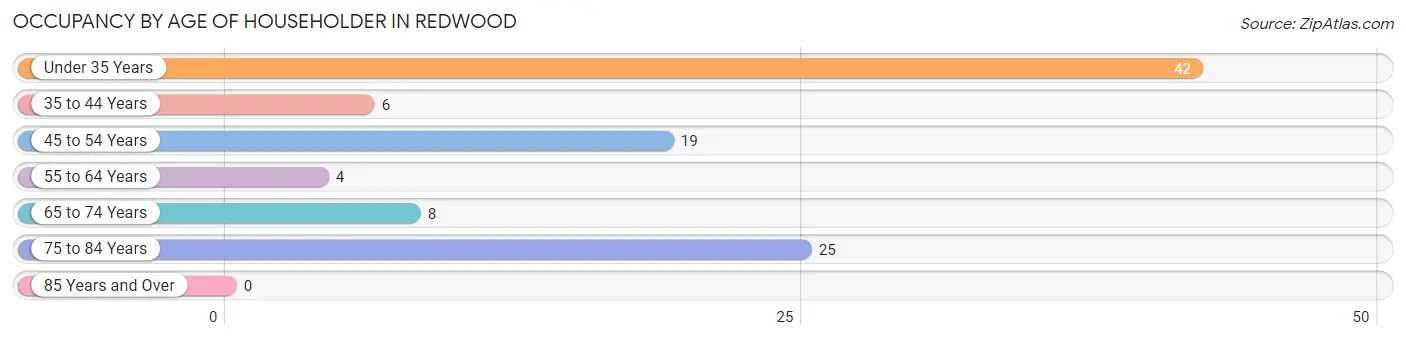
| Age Bracket | # Households | % Households |
| Under 35 Years | 42 | 40.4% |
| 35 to 44 Years | 6 | 5.8% |
| 45 to 54 Years | 19 | 18.3% |
| 55 to 64 Years | 4 | 3.8% |
| 65 to 74 Years | 8 | 7.7% |
| 75 to 84 Years | 25 | 24.0% |
| 85 Years and Over | 0 | 0.0% |
| Total | 104 | 100.0% |
Housing Finances in Redwood
Median Income by Occupancy in Redwood
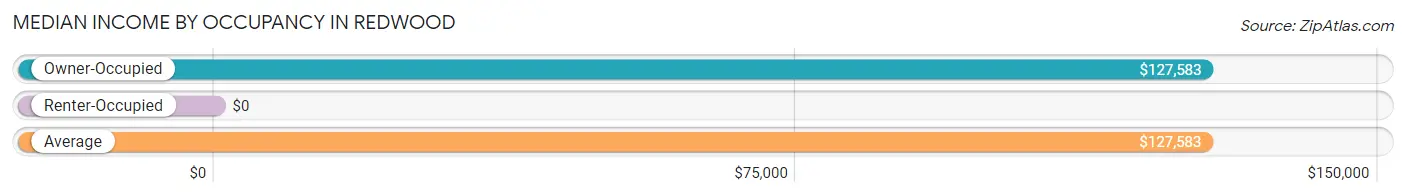
| Occupancy Type | # Households | Median Income |
| Owner-Occupied | 92 (88.5%) | $127,583 |
| Renter-Occupied | 12 (11.5%) | $0 |
| Average | 104 (100.0%) | $127,583 |
Occupancy by Householder Income Bracket in Redwood
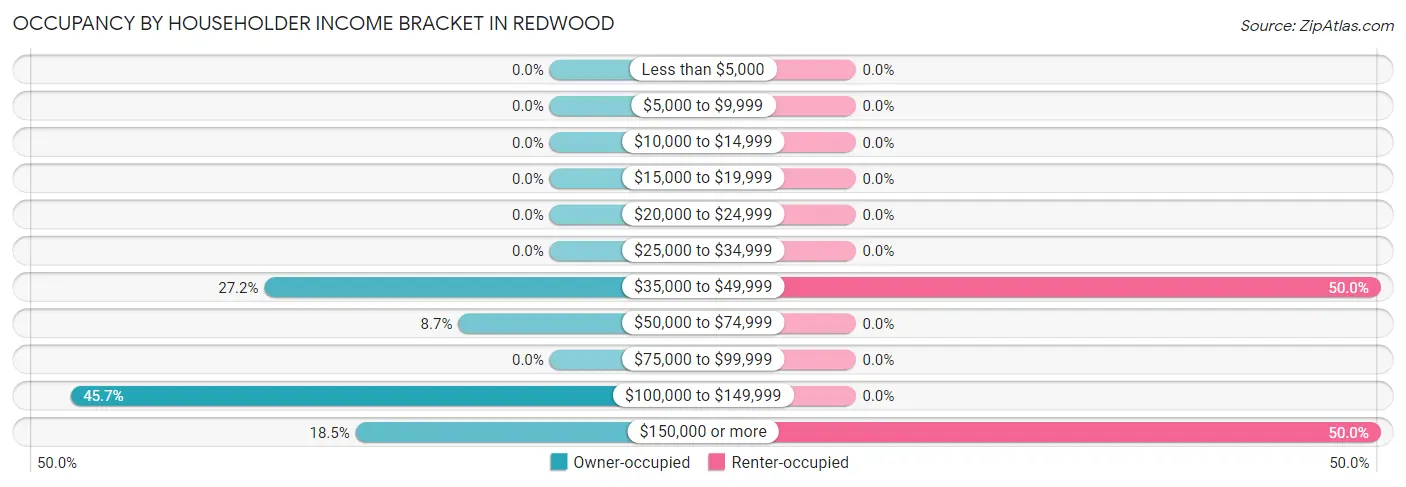
| Income Bracket | Owner-occupied | Renter-occupied |
| Less than $5,000 | 0 (0.0%) | 0 (0.0%) |
| $5,000 to $9,999 | 0 (0.0%) | 0 (0.0%) |
| $10,000 to $14,999 | 0 (0.0%) | 0 (0.0%) |
| $15,000 to $19,999 | 0 (0.0%) | 0 (0.0%) |
| $20,000 to $24,999 | 0 (0.0%) | 0 (0.0%) |
| $25,000 to $34,999 | 0 (0.0%) | 0 (0.0%) |
| $35,000 to $49,999 | 25 (27.2%) | 6 (50.0%) |
| $50,000 to $74,999 | 8 (8.7%) | 0 (0.0%) |
| $75,000 to $99,999 | 0 (0.0%) | 0 (0.0%) |
| $100,000 to $149,999 | 42 (45.7%) | 0 (0.0%) |
| $150,000 or more | 17 (18.5%) | 6 (50.0%) |
| Total | 92 (100.0%) | 12 (100.0%) |
Monthly Housing Cost Tiers in Redwood
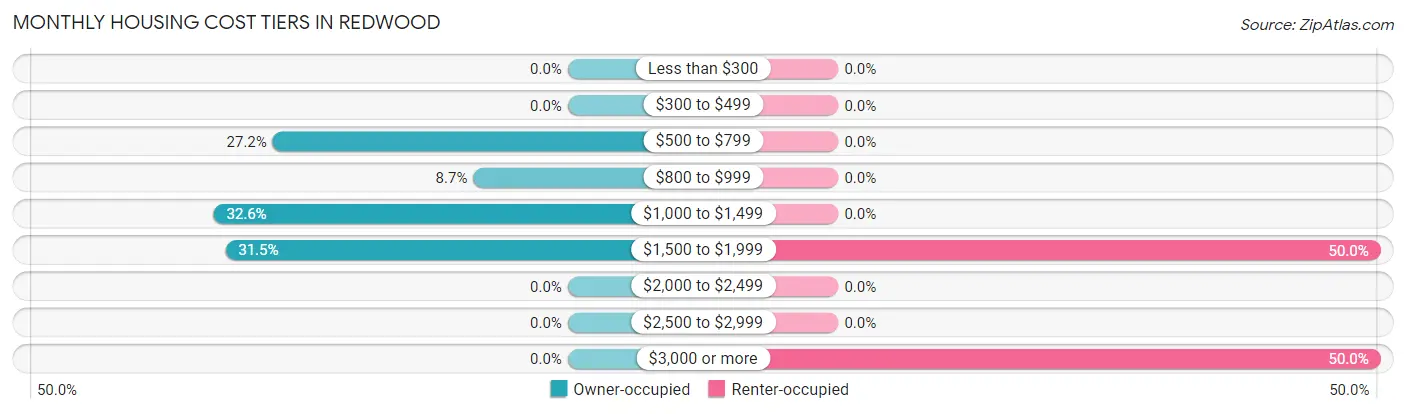
| Monthly Cost | Owner-occupied | Renter-occupied |
| Less than $300 | 0 (0.0%) | 0 (0.0%) |
| $300 to $499 | 0 (0.0%) | 0 (0.0%) |
| $500 to $799 | 25 (27.2%) | 0 (0.0%) |
| $800 to $999 | 8 (8.7%) | 0 (0.0%) |
| $1,000 to $1,499 | 30 (32.6%) | 0 (0.0%) |
| $1,500 to $1,999 | 29 (31.5%) | 6 (50.0%) |
| $2,000 to $2,499 | 0 (0.0%) | 0 (0.0%) |
| $2,500 to $2,999 | 0 (0.0%) | 0 (0.0%) |
| $3,000 or more | 0 (0.0%) | 6 (50.0%) |
| Total | 92 (100.0%) | 12 (100.0%) |
Physical Housing Characteristics in Redwood
Housing Structures in Redwood
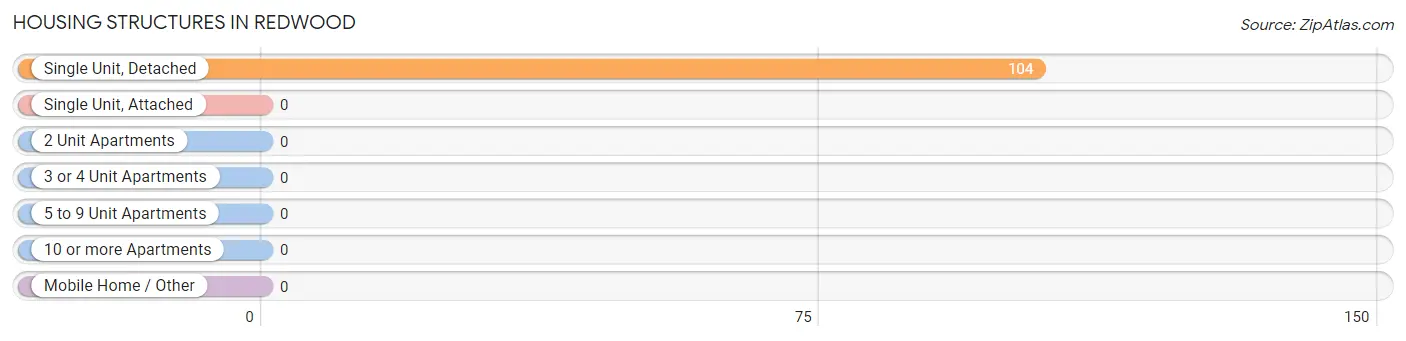
| Structure Type | # Housing Units | % Housing Units |
| Single Unit, Detached | 104 | 100.0% |
| Single Unit, Attached | 0 | 0.0% |
| 2 Unit Apartments | 0 | 0.0% |
| 3 or 4 Unit Apartments | 0 | 0.0% |
| 5 to 9 Unit Apartments | 0 | 0.0% |
| 10 or more Apartments | 0 | 0.0% |
| Mobile Home / Other | 0 | 0.0% |
| Total | 104 | 100.0% |
Housing Structures by Occupancy in Redwood
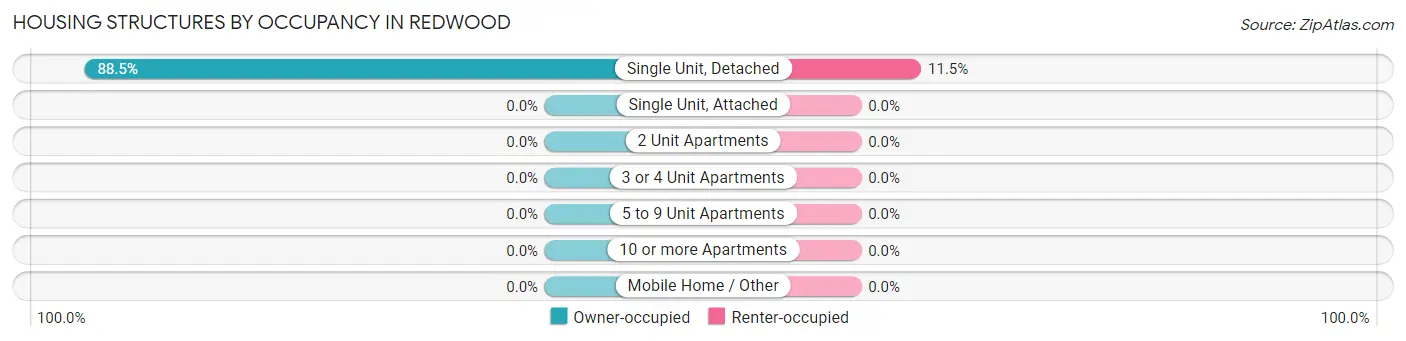
| Structure Type | Owner-occupied | Renter-occupied |
| Single Unit, Detached | 92 (88.5%) | 12 (11.5%) |
| Single Unit, Attached | 0 (0.0%) | 0 (0.0%) |
| 2 Unit Apartments | 0 (0.0%) | 0 (0.0%) |
| 3 or 4 Unit Apartments | 0 (0.0%) | 0 (0.0%) |
| 5 to 9 Unit Apartments | 0 (0.0%) | 0 (0.0%) |
| 10 or more Apartments | 0 (0.0%) | 0 (0.0%) |
| Mobile Home / Other | 0 (0.0%) | 0 (0.0%) |
| Total | 92 (88.5%) | 12 (11.5%) |
Housing Structures by Number of Rooms in Redwood
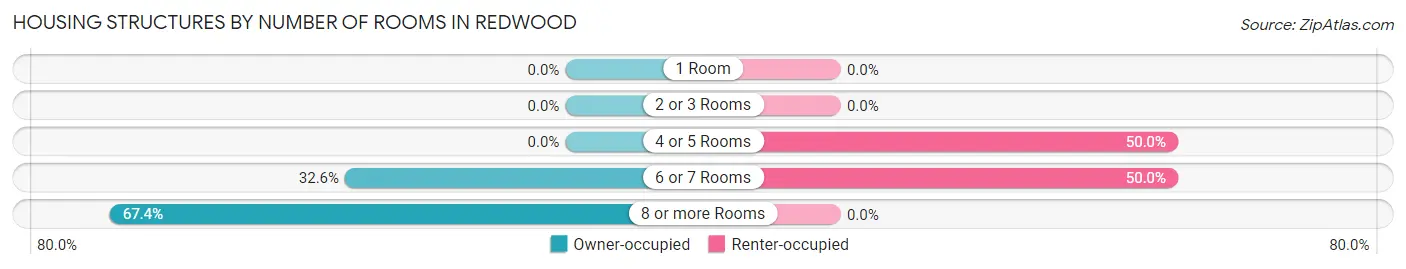
| Number of Rooms | Owner-occupied | Renter-occupied |
| 1 Room | 0 (0.0%) | 0 (0.0%) |
| 2 or 3 Rooms | 0 (0.0%) | 0 (0.0%) |
| 4 or 5 Rooms | 0 (0.0%) | 6 (50.0%) |
| 6 or 7 Rooms | 30 (32.6%) | 6 (50.0%) |
| 8 or more Rooms | 62 (67.4%) | 0 (0.0%) |
| Total | 92 (100.0%) | 12 (100.0%) |
Housing Structure by Heating Type in Redwood
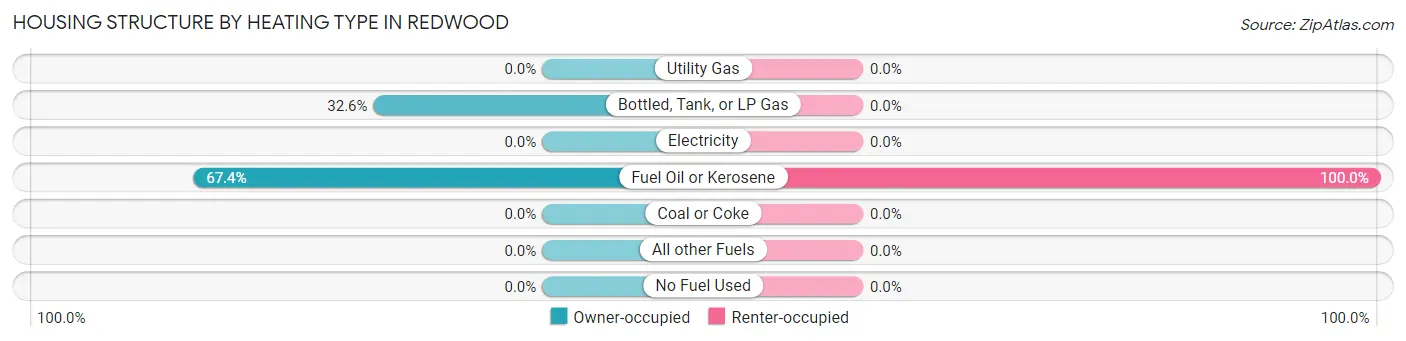
| Heating Type | Owner-occupied | Renter-occupied |
| Utility Gas | 0 (0.0%) | 0 (0.0%) |
| Bottled, Tank, or LP Gas | 30 (32.6%) | 0 (0.0%) |
| Electricity | 0 (0.0%) | 0 (0.0%) |
| Fuel Oil or Kerosene | 62 (67.4%) | 12 (100.0%) |
| Coal or Coke | 0 (0.0%) | 0 (0.0%) |
| All other Fuels | 0 (0.0%) | 0 (0.0%) |
| No Fuel Used | 0 (0.0%) | 0 (0.0%) |
| Total | 92 (100.0%) | 12 (100.0%) |
Household Vehicle Usage in Redwood
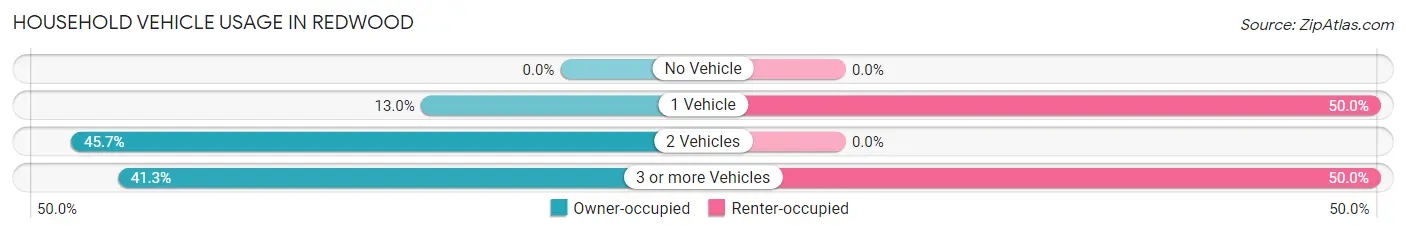
| Vehicles per Household | Owner-occupied | Renter-occupied |
| No Vehicle | 0 (0.0%) | 0 (0.0%) |
| 1 Vehicle | 12 (13.0%) | 6 (50.0%) |
| 2 Vehicles | 42 (45.7%) | 0 (0.0%) |
| 3 or more Vehicles | 38 (41.3%) | 6 (50.0%) |
| Total | 92 (100.0%) | 12 (100.0%) |
Real Estate & Mortgages in Redwood
Real Estate and Mortgage Overview in Redwood
| Characteristic | Without Mortgage | With Mortgage |
| Housing Units | 25 | 67 |
| Median Property Value | - | - |
| Median Household Income | - | - |
| Monthly Housing Costs | - | - |
| Real Estate Taxes | - | - |
Property Value by Mortgage Status in Redwood
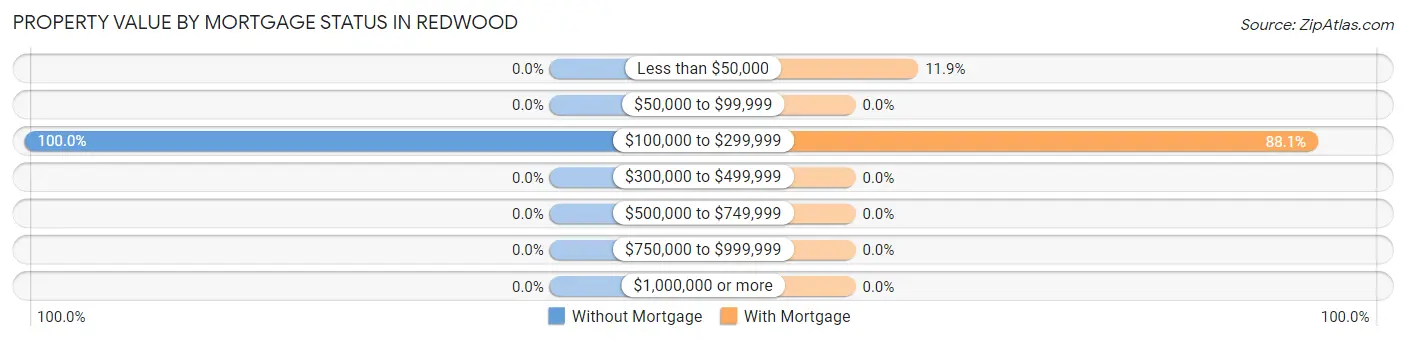
| Property Value | Without Mortgage | With Mortgage |
| Less than $50,000 | 0 (0.0%) | 8 (11.9%) |
| $50,000 to $99,999 | 0 (0.0%) | 0 (0.0%) |
| $100,000 to $299,999 | 25 (100.0%) | 59 (88.1%) |
| $300,000 to $499,999 | 0 (0.0%) | 0 (0.0%) |
| $500,000 to $749,999 | 0 (0.0%) | 0 (0.0%) |
| $750,000 to $999,999 | 0 (0.0%) | 0 (0.0%) |
| $1,000,000 or more | 0 (0.0%) | 0 (0.0%) |
| Total | 25 (100.0%) | 67 (100.0%) |
Household Income by Mortgage Status in Redwood
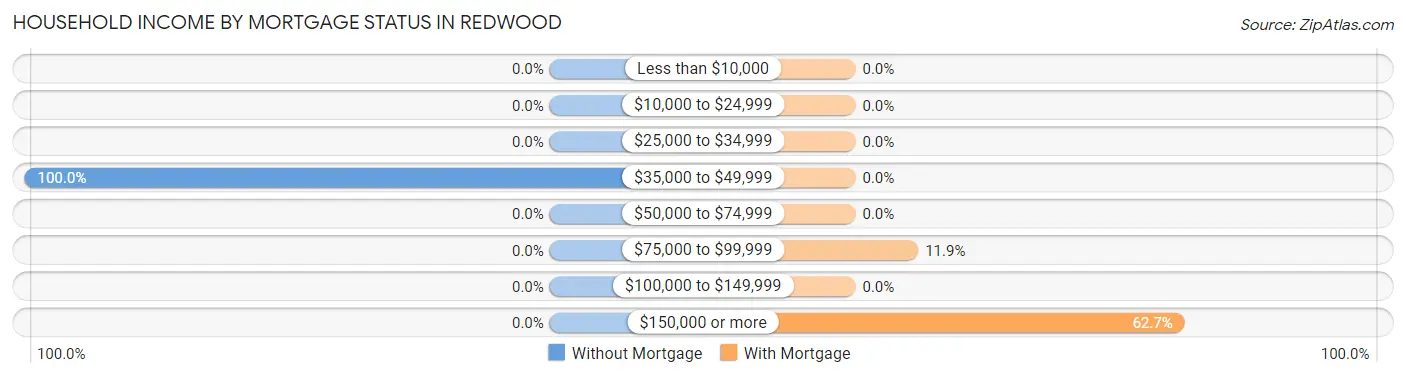
| Household Income | Without Mortgage | With Mortgage |
| Less than $10,000 | 0 (0.0%) | 0 (0.0%) |
| $10,000 to $24,999 | 0 (0.0%) | 0 (0.0%) |
| $25,000 to $34,999 | 0 (0.0%) | 0 (0.0%) |
| $35,000 to $49,999 | 25 (100.0%) | 0 (0.0%) |
| $50,000 to $74,999 | 0 (0.0%) | 0 (0.0%) |
| $75,000 to $99,999 | 0 (0.0%) | 8 (11.9%) |
| $100,000 to $149,999 | 0 (0.0%) | 0 (0.0%) |
| $150,000 or more | 0 (0.0%) | 42 (62.7%) |
| Total | 25 (100.0%) | 67 (100.0%) |
Property Value to Household Income Ratio in Redwood
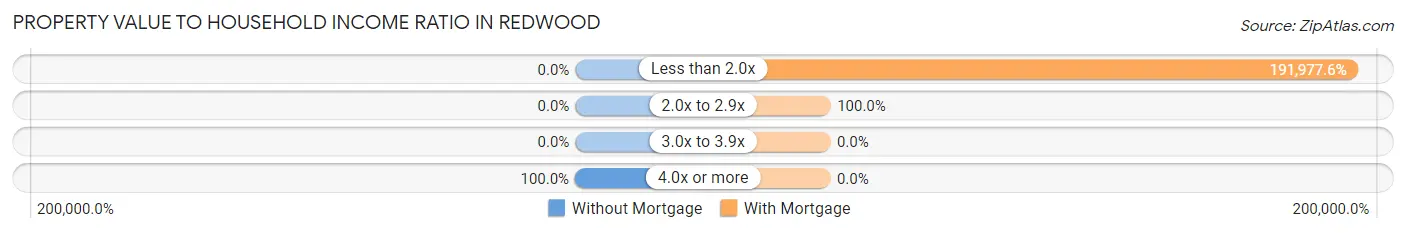
| Value-to-Income Ratio | Without Mortgage | With Mortgage |
| Less than 2.0x | 0 (0.0%) | 128,625 (191,977.6%) |
| 2.0x to 2.9x | 0 (0.0%) | 67 (100.0%) |
| 3.0x to 3.9x | 0 (0.0%) | 0 (0.0%) |
| 4.0x or more | 25 (100.0%) | 0 (0.0%) |
| Total | 25 (100.0%) | 67 (100.0%) |
Real Estate Taxes by Mortgage Status in Redwood
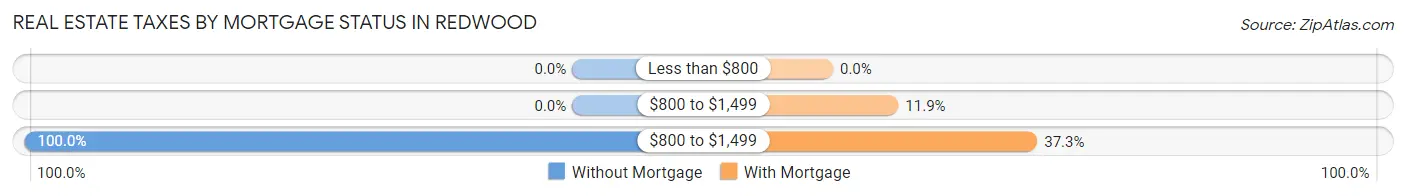
| Property Taxes | Without Mortgage | With Mortgage |
| Less than $800 | 0 (0.0%) | 0 (0.0%) |
| $800 to $1,499 | 0 (0.0%) | 8 (11.9%) |
| $800 to $1,499 | 25 (100.0%) | 25 (37.3%) |
| Total | 25 (100.0%) | 67 (100.0%) |
Health & Disability in Redwood
Health Insurance Coverage by Age in Redwood
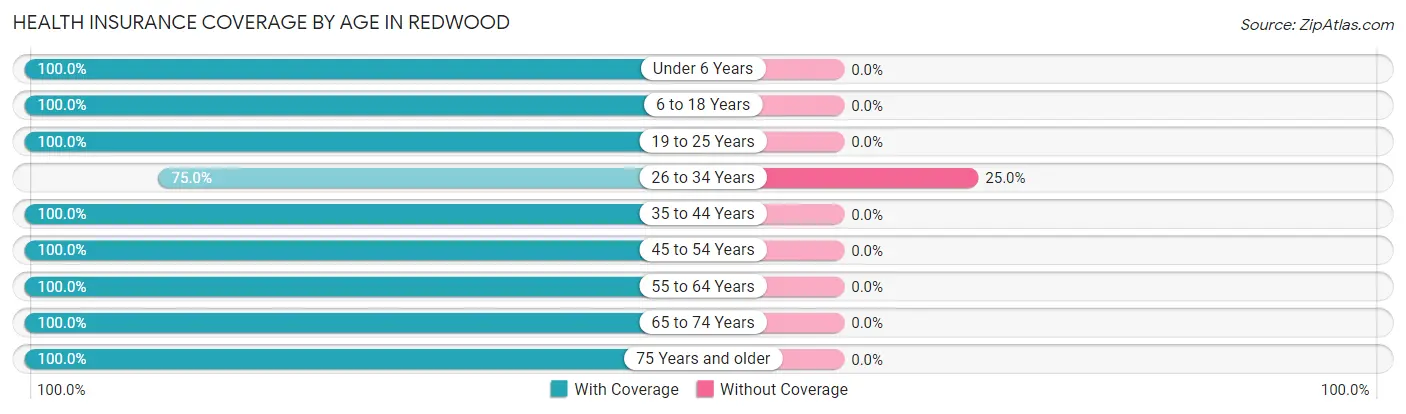
| Age Bracket | With Coverage | Without Coverage |
| Under 6 Years | 15 (100.0%) | 0 (0.0%) |
| 6 to 18 Years | 68 (100.0%) | 0 (0.0%) |
| 19 to 25 Years | 68 (100.0%) | 0 (0.0%) |
| 26 to 34 Years | 33 (75.0%) | 11 (25.0%) |
| 35 to 44 Years | 6 (100.0%) | 0 (0.0%) |
| 45 to 54 Years | 36 (100.0%) | 0 (0.0%) |
| 55 to 64 Years | 9 (100.0%) | 0 (0.0%) |
| 65 to 74 Years | 10 (100.0%) | 0 (0.0%) |
| 75 Years and older | 48 (100.0%) | 0 (0.0%) |
| Total | 293 (96.4%) | 11 (3.6%) |
Health Insurance Coverage by Citizenship Status in Redwood
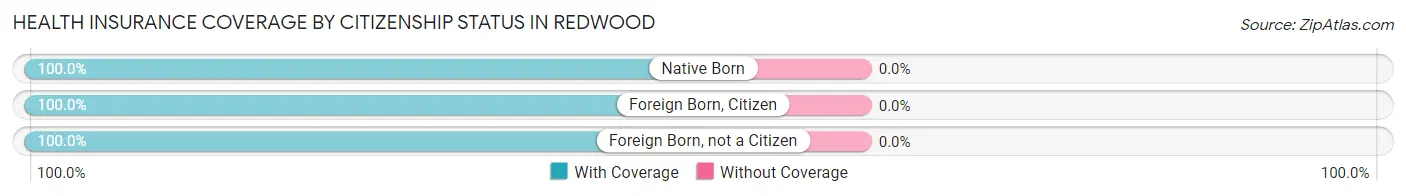
| Citizenship Status | With Coverage | Without Coverage |
| Native Born | 15 (100.0%) | 0 (0.0%) |
| Foreign Born, Citizen | 68 (100.0%) | 0 (0.0%) |
| Foreign Born, not a Citizen | 68 (100.0%) | 0 (0.0%) |
Health Insurance Coverage by Household Income in Redwood
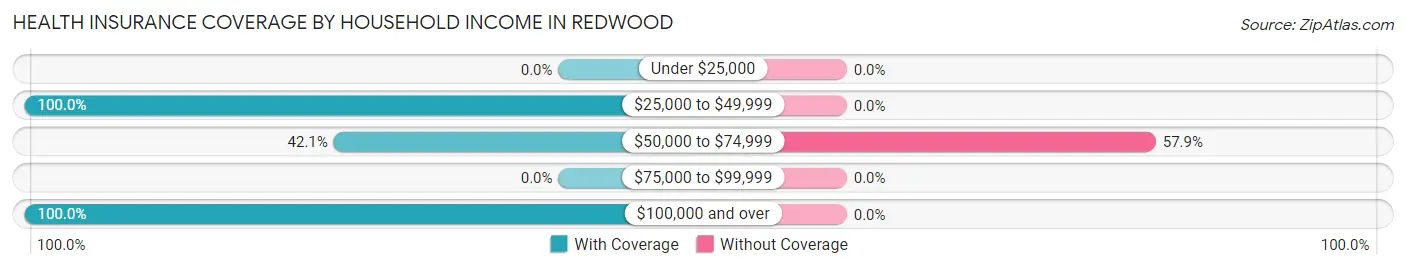
| Household Income | With Coverage | Without Coverage |
| Under $25,000 | 0 (0.0%) | 0 (0.0%) |
| $25,000 to $49,999 | 81 (100.0%) | 0 (0.0%) |
| $50,000 to $74,999 | 8 (42.1%) | 11 (57.9%) |
| $75,000 to $99,999 | 0 (0.0%) | 0 (0.0%) |
| $100,000 and over | 204 (100.0%) | 0 (0.0%) |
Public vs Private Health Insurance Coverage by Age in Redwood
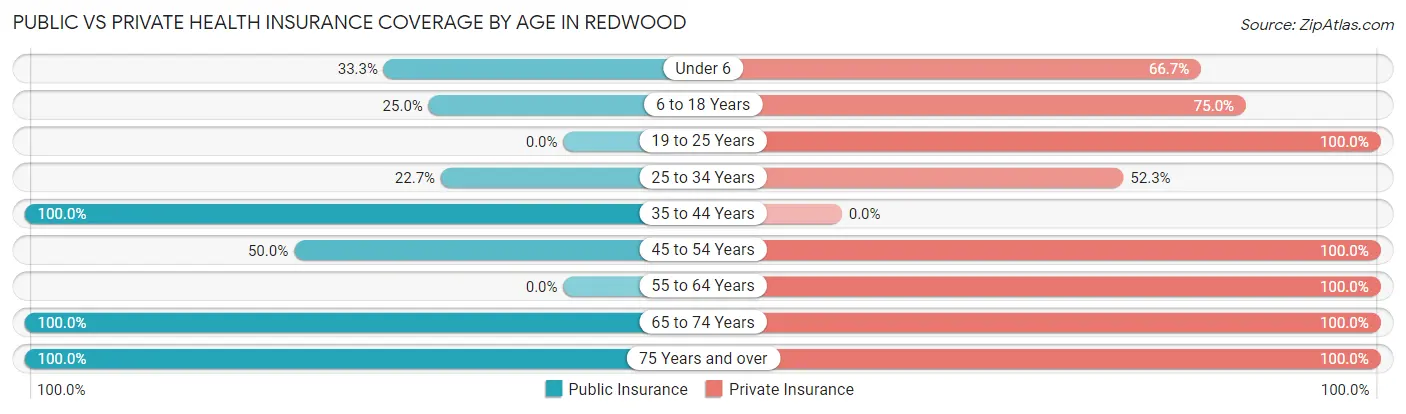
| Age Bracket | Public Insurance | Private Insurance |
| Under 6 | 5 (33.3%) | 10 (66.7%) |
| 6 to 18 Years | 17 (25.0%) | 51 (75.0%) |
| 19 to 25 Years | 0 (0.0%) | 68 (100.0%) |
| 25 to 34 Years | 10 (22.7%) | 23 (52.3%) |
| 35 to 44 Years | 6 (100.0%) | 0 (0.0%) |
| 45 to 54 Years | 18 (50.0%) | 36 (100.0%) |
| 55 to 64 Years | 0 (0.0%) | 9 (100.0%) |
| 65 to 74 Years | 10 (100.0%) | 10 (100.0%) |
| 75 Years and over | 48 (100.0%) | 48 (100.0%) |
| Total | 114 (37.5%) | 255 (83.9%) |
Disability Status by Sex by Age in Redwood
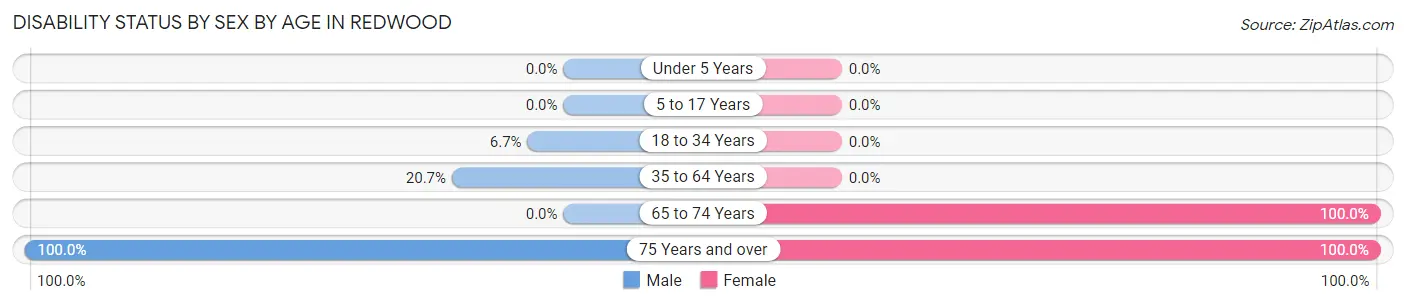
| Age Bracket | Male | Female |
| Under 5 Years | 0 (0.0%) | 0 (0.0%) |
| 5 to 17 Years | 0 (0.0%) | 0 (0.0%) |
| 18 to 34 Years | 5 (6.7%) | 0 (0.0%) |
| 35 to 64 Years | 6 (20.7%) | 0 (0.0%) |
| 65 to 74 Years | 0 (0.0%) | 10 (100.0%) |
| 75 Years and over | 23 (100.0%) | 25 (100.0%) |
Disability Class by Sex by Age in Redwood
Disability Class: Hearing Difficulty
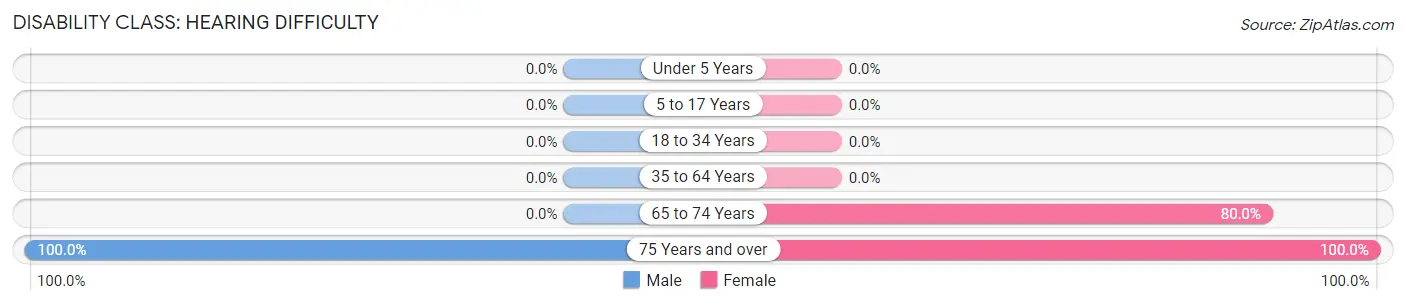
| Age Bracket | Male | Female |
| Under 5 Years | 0 (0.0%) | 0 (0.0%) |
| 5 to 17 Years | 0 (0.0%) | 0 (0.0%) |
| 18 to 34 Years | 0 (0.0%) | 0 (0.0%) |
| 35 to 64 Years | 0 (0.0%) | 0 (0.0%) |
| 65 to 74 Years | 0 (0.0%) | 8 (80.0%) |
| 75 Years and over | 23 (100.0%) | 25 (100.0%) |
Disability Class: Vision Difficulty
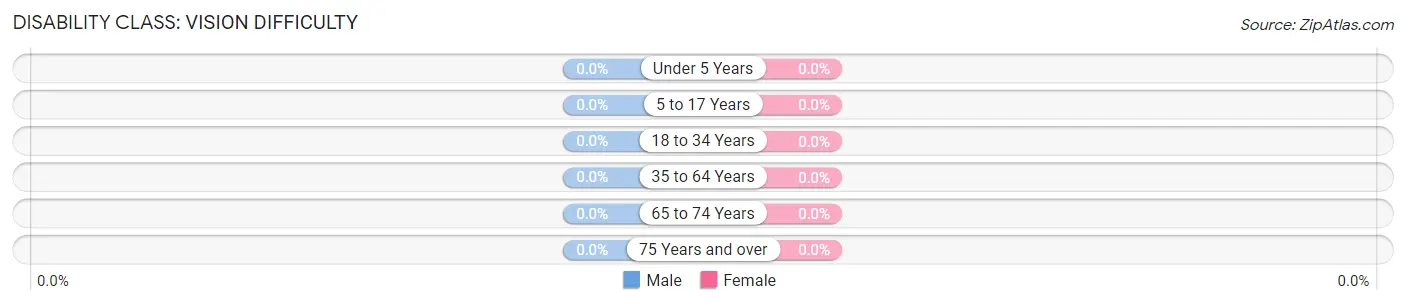
| Age Bracket | Male | Female |
| Under 5 Years | 0 (0.0%) | 0 (0.0%) |
| 5 to 17 Years | 0 (0.0%) | 0 (0.0%) |
| 18 to 34 Years | 0 (0.0%) | 0 (0.0%) |
| 35 to 64 Years | 0 (0.0%) | 0 (0.0%) |
| 65 to 74 Years | 0 (0.0%) | 0 (0.0%) |
| 75 Years and over | 0 (0.0%) | 0 (0.0%) |
Disability Class: Cognitive Difficulty
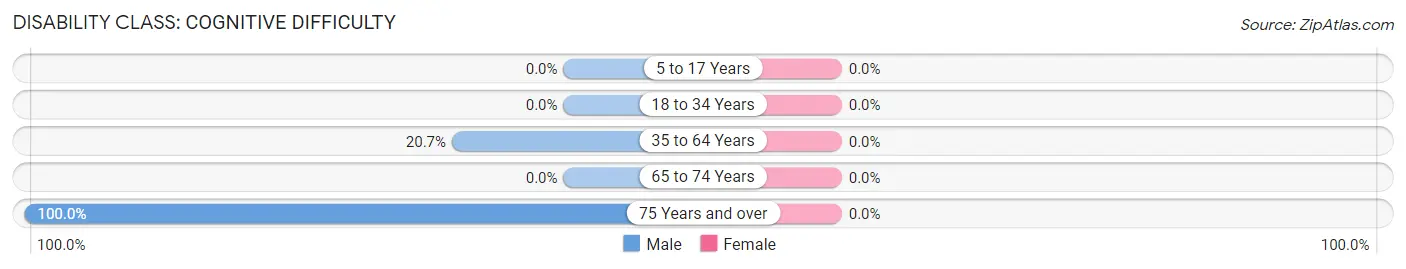
| Age Bracket | Male | Female |
| 5 to 17 Years | 0 (0.0%) | 0 (0.0%) |
| 18 to 34 Years | 0 (0.0%) | 0 (0.0%) |
| 35 to 64 Years | 6 (20.7%) | 0 (0.0%) |
| 65 to 74 Years | 0 (0.0%) | 0 (0.0%) |
| 75 Years and over | 23 (100.0%) | 0 (0.0%) |
Disability Class: Ambulatory Difficulty
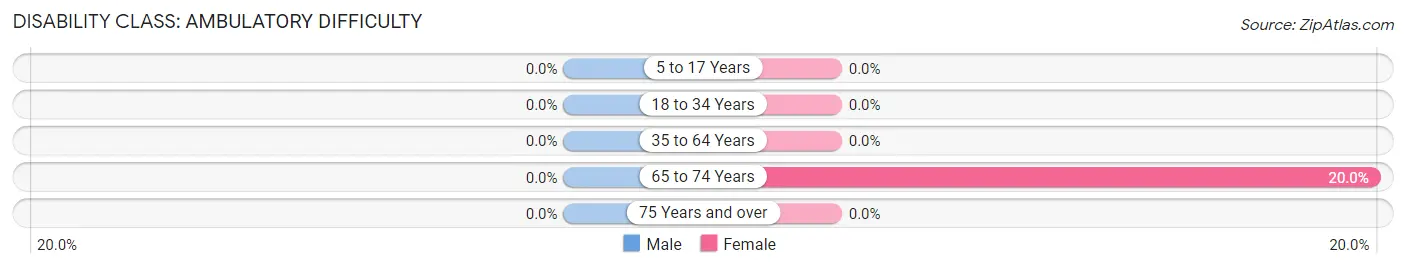
| Age Bracket | Male | Female |
| 5 to 17 Years | 0 (0.0%) | 0 (0.0%) |
| 18 to 34 Years | 0 (0.0%) | 0 (0.0%) |
| 35 to 64 Years | 0 (0.0%) | 0 (0.0%) |
| 65 to 74 Years | 0 (0.0%) | 2 (20.0%) |
| 75 Years and over | 0 (0.0%) | 0 (0.0%) |
Disability Class: Self-Care Difficulty
| Age Bracket | Male | Female |
| 5 to 17 Years | 0 (0.0%) | 0 (0.0%) |
| 18 to 34 Years | 0 (0.0%) | 0 (0.0%) |
| 35 to 64 Years | 0 (0.0%) | 0 (0.0%) |
| 65 to 74 Years | 0 (0.0%) | 0 (0.0%) |
| 75 Years and over | 0 (0.0%) | 0 (0.0%) |
Technology Access in Redwood
Computing Device Access in Redwood
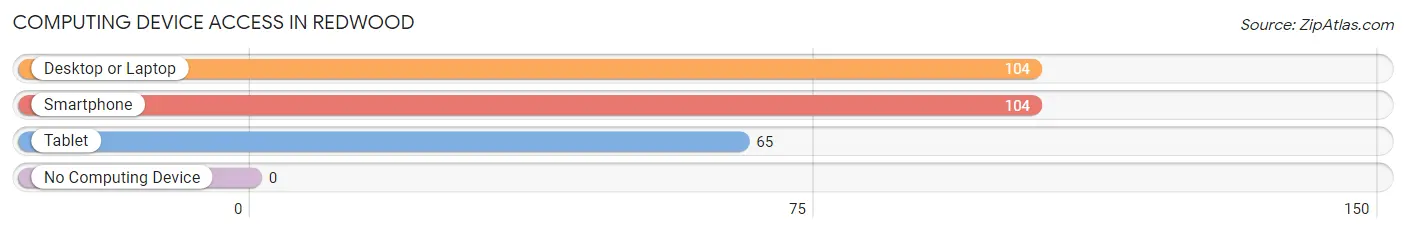
| Device Type | # Households | % Households |
| Desktop or Laptop | 104 | 100.0% |
| Smartphone | 104 | 100.0% |
| Tablet | 65 | 62.5% |
| No Computing Device | 0 | 0.0% |
| Total | 104 | 100.0% |
Internet Access in Redwood
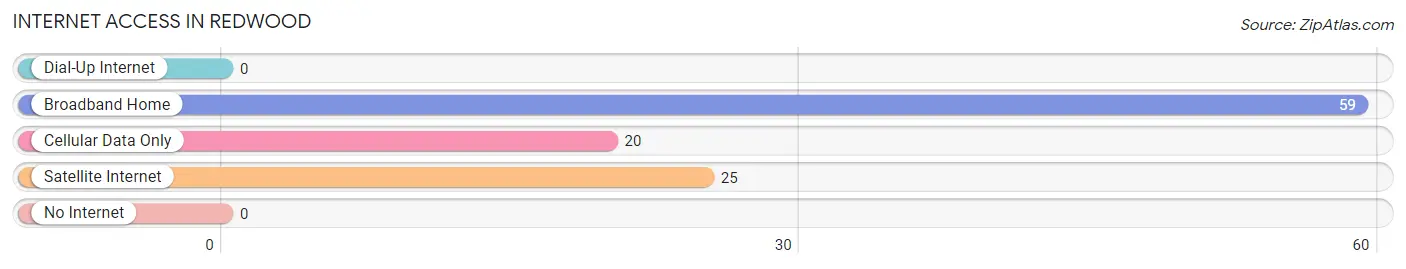
| Internet Type | # Households | % Households |
| Dial-Up Internet | 0 | 0.0% |
| Broadband Home | 59 | 56.7% |
| Cellular Data Only | 20 | 19.2% |
| Satellite Internet | 25 | 24.0% |
| No Internet | 0 | 0.0% |
| Total | 104 | 100.0% |
Redwood Summary
Redwood is a small town located in the state of New York. It is situated in the northern part of the state, in Jefferson County. The town is bordered by the towns of Watertown, Brownville, and Lyme. The population of Redwood was 1,845 as of the 2010 census.
Geography
Redwood is located at 43°59'N 75°45'W (43.983, -75.75). The town has a total area of 24.2 square miles, of which 24.1 square miles is land and 0.1 square miles is water. The town is located in the Tug Hill Plateau region of New York, and is characterized by rolling hills and valleys. The highest point in the town is 1,890 feet above sea level.
The town is home to several small lakes, including Lake Redwood, Lake Lorraine, and Lake Lillian. The Black River flows through the town, and is a popular destination for fishing and canoeing.
History
The area that is now Redwood was first settled in the late 1700s by settlers from New England. The town was originally part of the town of Watertown, but was incorporated as its own town in 1817. The town was named after the redwood trees that were abundant in the area.
The town was an agricultural community for much of its history, with dairy farming being the primary industry. The town also had several sawmills and gristmills, which were powered by the Black River.
Economy
The economy of Redwood is largely based on agriculture. Dairy farming is the primary industry, and the town is home to several dairy farms. The town also has several small businesses, including a grocery store, a hardware store, and a restaurant.
Demographics
As of the 2010 census, the population of Redwood was 1,845. The racial makeup of the town was 97.3% White, 0.7% African American, 0.3% Native American, 0.2% Asian, 0.1% Pacific Islander, 0.2% from other races, and 1.2% from two or more races. Hispanic or Latino of any race were 1.2% of the population.
The median income for a household in Redwood was $41,250, and the median income for a family was $48,750. The per capita income for the town was $19,945. About 8.3% of families and 11.2% of the population were below the poverty line, including 14.2% of those under age 18 and 8.2% of those age 65 or over.
Common Questions
What is Per Capita Income in Redwood?
Per Capita income in Redwood is $39,292.
What is the Median Household income in Redwood?
Median Household Income in Redwood is $127,583.
What is Income or Wage Gap in Redwood?
Income or Wage Gap in Redwood is 45.6%.
Women in Redwood earn 54.4 cents for every dollar earned by a man.
What is Inequality or Gini Index in Redwood?
Inequality or Gini Index in Redwood is 0.30.
What is the Total Population of Redwood?
Total Population of Redwood is 304.
What is the Total Male Population of Redwood?
Total Male Population of Redwood is 163.
What is the Total Female Population of Redwood?
Total Female Population of Redwood is 141.
What is the Ratio of Males per 100 Females in Redwood?
There are 115.60 Males per 100 Females in Redwood.
What is the Ratio of Females per 100 Males in Redwood?
There are 86.50 Females per 100 Males in Redwood.
What is the Median Population Age in Redwood?
Median Population Age in Redwood is 27.1 Years.
What is the Average Family Size in Redwood
Average Family Size in Redwood is 3.1 People.
What is the Average Household Size in Redwood
Average Household Size in Redwood is 2.9 People.
How Large is the Labor Force in Redwood?
There are 167 People in the Labor Forcein in Redwood.
What is the Percentage of People in the Labor Force in Redwood?
69.6% of People are in the Labor Force in Redwood.
What is the Unemployment Rate in Redwood?
Unemployment Rate in Redwood is 3.6%.