Red Creek, NY Map & Demographics
Red Creek Map
Red Creek Overview
$35,735
PER CAPITA INCOME
$72,727
AVG FAMILY INCOME
$71,250
AVG HOUSEHOLD INCOME
58.6%
WAGE / INCOME GAP [ % ]
41.4¢/ $1
WAGE / INCOME GAP [ $ ]
0.55
INEQUALITY / GINI INDEX
746
TOTAL POPULATION
331
MALE POPULATION
415
FEMALE POPULATION
79.76
MALES / 100 FEMALES
125.38
FEMALES / 100 MALES
27.9
MEDIAN AGE
3.0
AVG FAMILY SIZE
3.2
AVG HOUSEHOLD SIZE
300
LABOR FORCE [ PEOPLE ]
61.2%
PERCENT IN LABOR FORCE
5.7%
UNEMPLOYMENT RATE
Red Creek Zip Codes
Red Creek Area Codes
Income in Red Creek
Income Overview in Red Creek
Per Capita Income in Red Creek is $35,735, while median incomes of families and households are $72,727 and $71,250 respectively.
| Characteristic | Number | Measure |
| Per Capita Income | 746 | $35,735 |
| Median Family Income | 192 | $72,727 |
| Mean Family Income | 192 | $94,074 |
| Median Household Income | 233 | $71,250 |
| Mean Household Income | 233 | $112,136 |
| Income Deficit | 192 | $0 |
| Wage / Income Gap (%) | 746 | 58.62% |
| Wage / Income Gap ($) | 746 | 41.38¢ per $1 |
| Gini / Inequality Index | 746 | 0.55 |
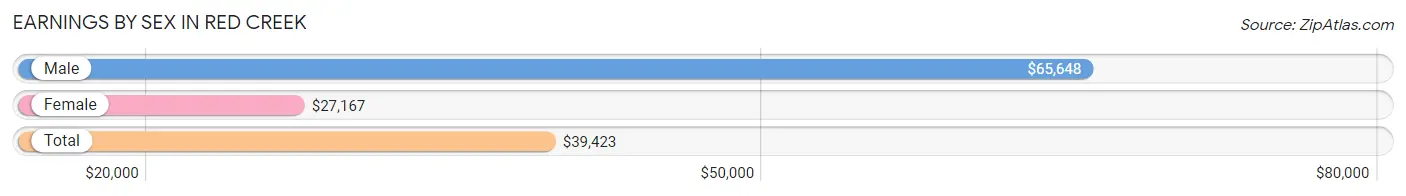
Earnings by Sex in Red Creek
Average Earnings in Red Creek are $39,423, $65,648 for men and $27,167 for women, a difference of 58.6%.
| Sex | Number | Average Earnings |
| Male | 132 (44.0%) | $65,648 |
| Female | 168 (56.0%) | $27,167 |
| Total | 300 (100.0%) | $39,423 |
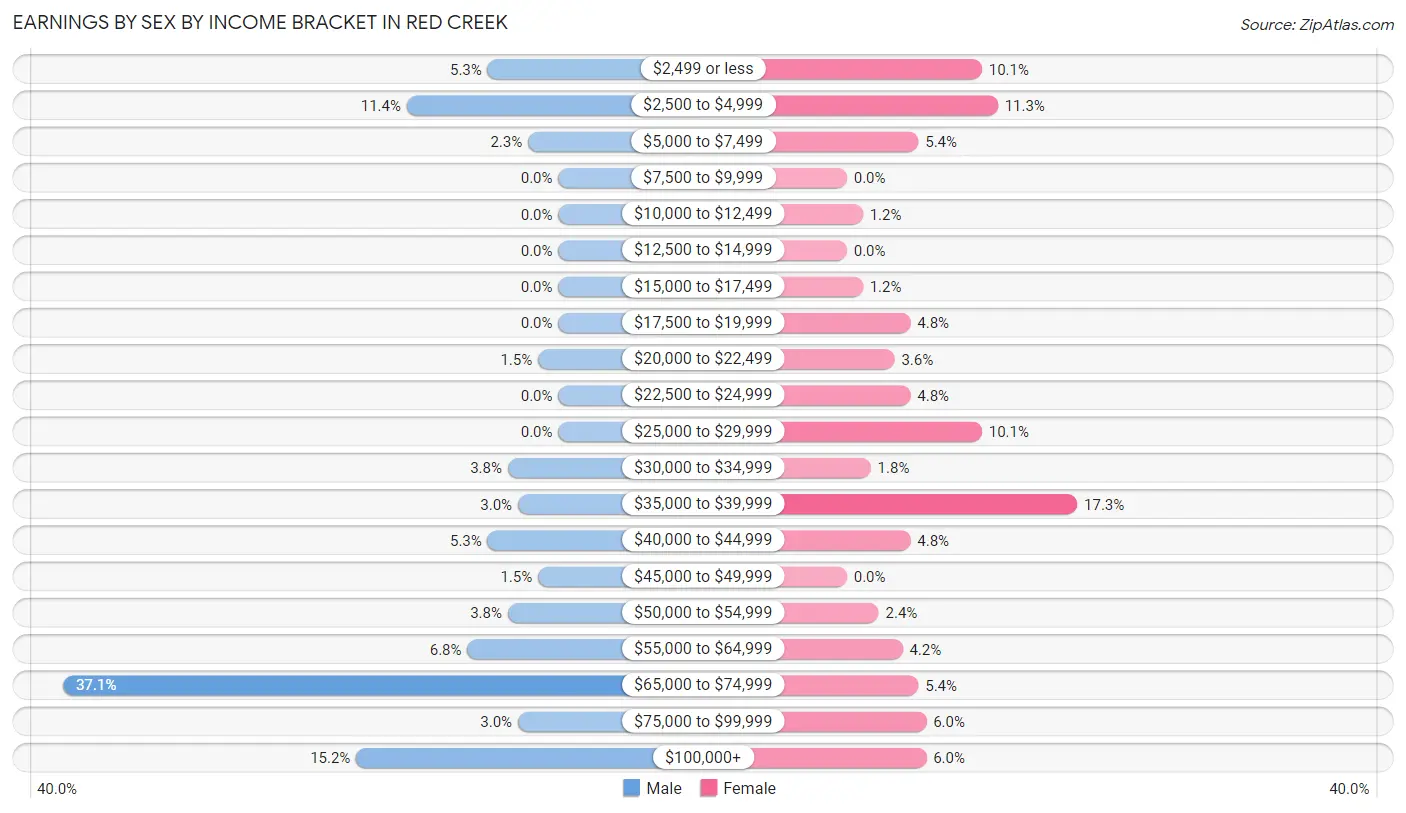
Earnings by Sex by Income Bracket in Red Creek
The most common earnings brackets in Red Creek are $65,000 to $74,999 for men (49 | 37.1%) and $35,000 to $39,999 for women (29 | 17.3%).
| Income | Male | Female |
| $2,499 or less | 7 (5.3%) | 17 (10.1%) |
| $2,500 to $4,999 | 15 (11.4%) | 19 (11.3%) |
| $5,000 to $7,499 | 3 (2.3%) | 9 (5.4%) |
| $7,500 to $9,999 | 0 (0.0%) | 0 (0.0%) |
| $10,000 to $12,499 | 0 (0.0%) | 2 (1.2%) |
| $12,500 to $14,999 | 0 (0.0%) | 0 (0.0%) |
| $15,000 to $17,499 | 0 (0.0%) | 2 (1.2%) |
| $17,500 to $19,999 | 0 (0.0%) | 8 (4.8%) |
| $20,000 to $22,499 | 2 (1.5%) | 6 (3.6%) |
| $22,500 to $24,999 | 0 (0.0%) | 8 (4.8%) |
| $25,000 to $29,999 | 0 (0.0%) | 17 (10.1%) |
| $30,000 to $34,999 | 5 (3.8%) | 3 (1.8%) |
| $35,000 to $39,999 | 4 (3.0%) | 29 (17.3%) |
| $40,000 to $44,999 | 7 (5.3%) | 8 (4.8%) |
| $45,000 to $49,999 | 2 (1.5%) | 0 (0.0%) |
| $50,000 to $54,999 | 5 (3.8%) | 4 (2.4%) |
| $55,000 to $64,999 | 9 (6.8%) | 7 (4.2%) |
| $65,000 to $74,999 | 49 (37.1%) | 9 (5.4%) |
| $75,000 to $99,999 | 4 (3.0%) | 10 (5.9%) |
| $100,000+ | 20 (15.1%) | 10 (5.9%) |
| Total | 132 (100.0%) | 168 (100.0%) |
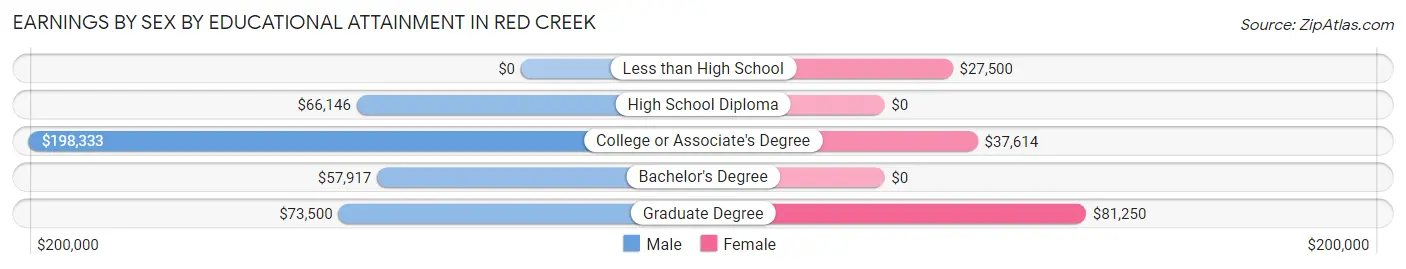
Earnings by Sex by Educational Attainment in Red Creek
Average earnings in Red Creek are $66,481 for men and $36,429 for women, a difference of 45.2%. Men with an educational attainment of college or associate's degree enjoy the highest average annual earnings of $198,333, while those with bachelor's degree education earn the least with $57,917. Women with an educational attainment of graduate degree earn the most with the average annual earnings of $81,250, while those with less than high school education have the smallest earnings of $27,500.
| Educational Attainment | Male Income | Female Income |
| Less than High School | - | - |
| High School Diploma | $66,146 | $0 |
| College or Associate's Degree | $198,333 | $37,614 |
| Bachelor's Degree | $57,917 | $0 |
| Graduate Degree | $73,500 | $81,250 |
| Total | $66,481 | $36,429 |
Family Income in Red Creek
Family Income Brackets in Red Creek
According to the Red Creek family income data, there are 53 families falling into the $50,000 to $74,999 income range, which is the most common income bracket and makes up 27.6% of all families.
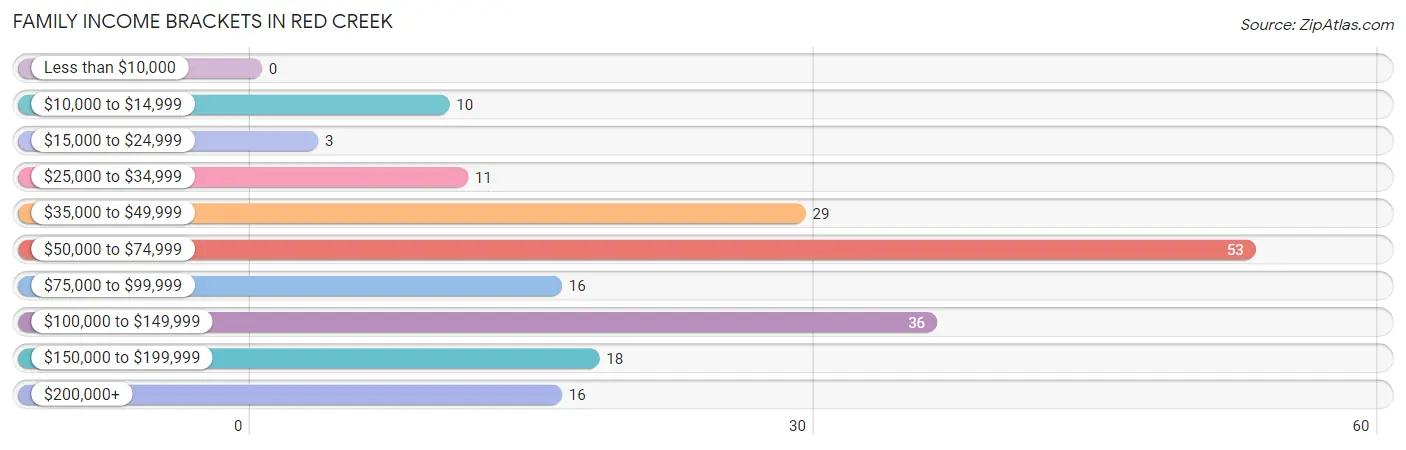
| Income Bracket | # Families | % Families |
| Less than $10,000 | 0 | 0.0% |
| $10,000 to $14,999 | 10 | 5.2% |
| $15,000 to $24,999 | 3 | 1.6% |
| $25,000 to $34,999 | 11 | 5.7% |
| $35,000 to $49,999 | 29 | 15.1% |
| $50,000 to $74,999 | 53 | 27.6% |
| $75,000 to $99,999 | 16 | 8.3% |
| $100,000 to $149,999 | 36 | 18.8% |
| $150,000 to $199,999 | 18 | 9.4% |
| $200,000+ | 16 | 8.3% |
Family Income by Famaliy Size in Red Creek
4-person families (31 | 16.2%) account for the highest median family income in Red Creek with $107,813 per family, while 4-person families (31 | 16.2%) have the highest median income of $26,953 per family member.
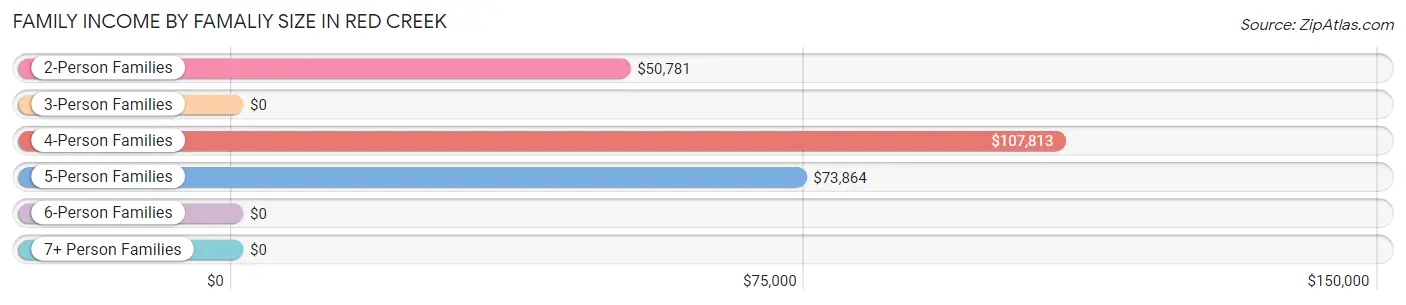
| Income Bracket | # Families | Median Income |
| 2-Person Families | 65 (33.9%) | $50,781 |
| 3-Person Families | 65 (33.9%) | $0 |
| 4-Person Families | 31 (16.2%) | $107,813 |
| 5-Person Families | 28 (14.6%) | $73,864 |
| 6-Person Families | 3 (1.6%) | $0 |
| 7+ Person Families | 0 (0.0%) | $0 |
| Total | 192 (100.0%) | $72,727 |
Family Income by Number of Earners in Red Creek
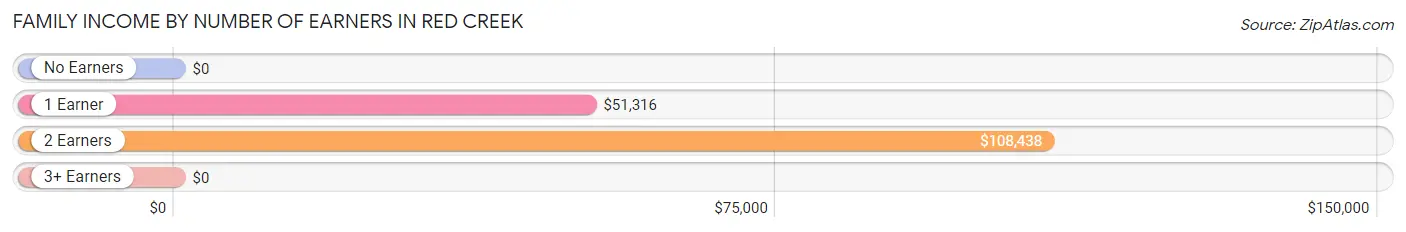
| Number of Earners | # Families | Median Income |
| No Earners | 12 (6.2%) | $0 |
| 1 Earner | 98 (51.0%) | $51,316 |
| 2 Earners | 77 (40.1%) | $108,438 |
| 3+ Earners | 5 (2.6%) | $0 |
| Total | 192 (100.0%) | $72,727 |
Household Income in Red Creek
Household Income Brackets in Red Creek
With 56 households falling in the category, the $50,000 to $74,999 income range is the most frequent in Red Creek, accounting for 24.0% of all households.
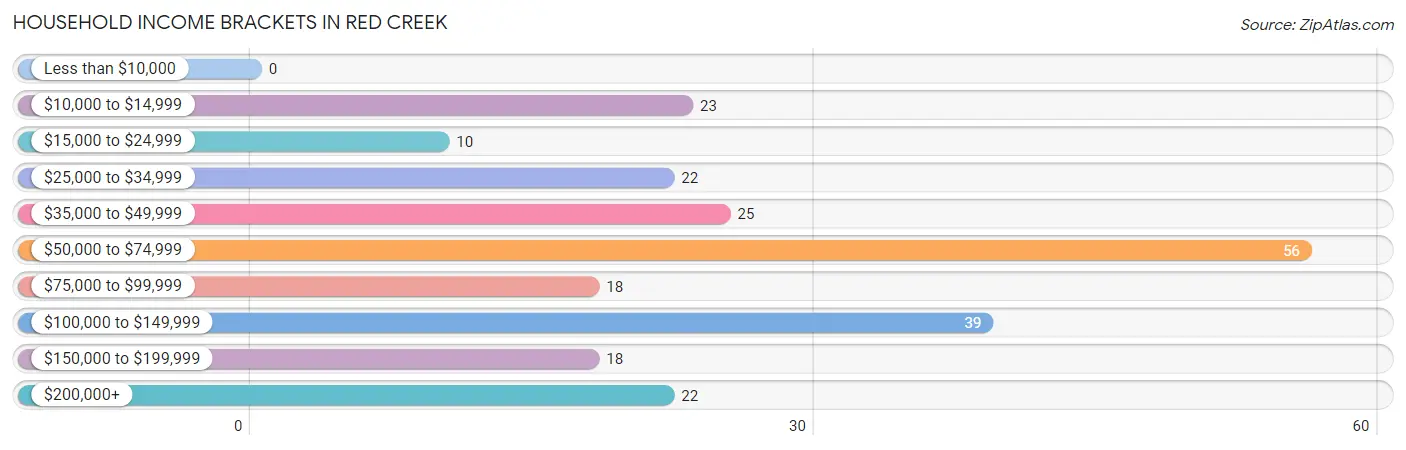
| Income Bracket | # Households | % Households |
| Less than $10,000 | 0 | 0.0% |
| $10,000 to $14,999 | 23 | 9.9% |
| $15,000 to $24,999 | 10 | 4.3% |
| $25,000 to $34,999 | 22 | 9.4% |
| $35,000 to $49,999 | 25 | 10.7% |
| $50,000 to $74,999 | 56 | 24.0% |
| $75,000 to $99,999 | 18 | 7.7% |
| $100,000 to $149,999 | 39 | 16.7% |
| $150,000 to $199,999 | 18 | 7.7% |
| $200,000+ | 22 | 9.4% |
Household Income by Householder Age in Red Creek
The median household income in Red Creek is $71,250, with the highest median household income of $78,438 found in the 45 to 64 years age bracket for the primary householder. A total of 91 households (39.1%) fall into this category. Meanwhile, the 15 to 24 years age bracket for the primary householder has the lowest median household income of $0, with 3 households (1.3%) in this group.
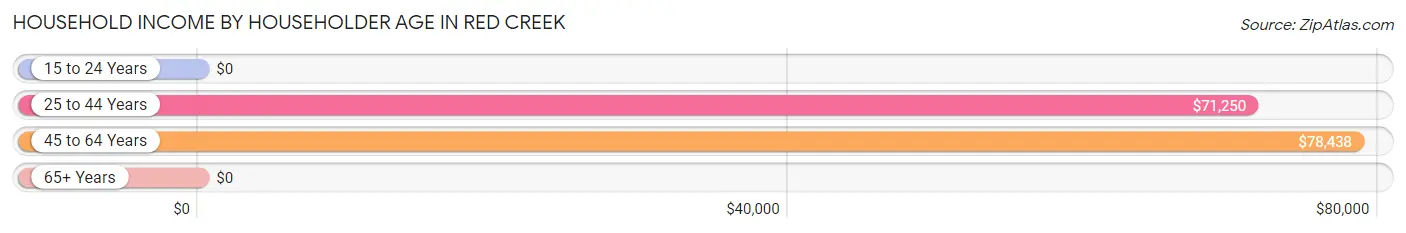
| Income Bracket | # Households | Median Income |
| 15 to 24 Years | 3 (1.3%) | $0 |
| 25 to 44 Years | 101 (43.3%) | $71,250 |
| 45 to 64 Years | 91 (39.1%) | $78,438 |
| 65+ Years | 38 (16.3%) | $0 |
| Total | 233 (100.0%) | $71,250 |
Poverty in Red Creek
Income Below Poverty by Sex and Age in Red Creek
With 8.3% poverty level for males and 17.2% for females among the residents of Red Creek, 18 to 24 year old males and 25 to 34 year old females are the most vulnerable to poverty, with 7 males (29.2%) and 41 females (42.3%) in their respective age groups living below the poverty level.
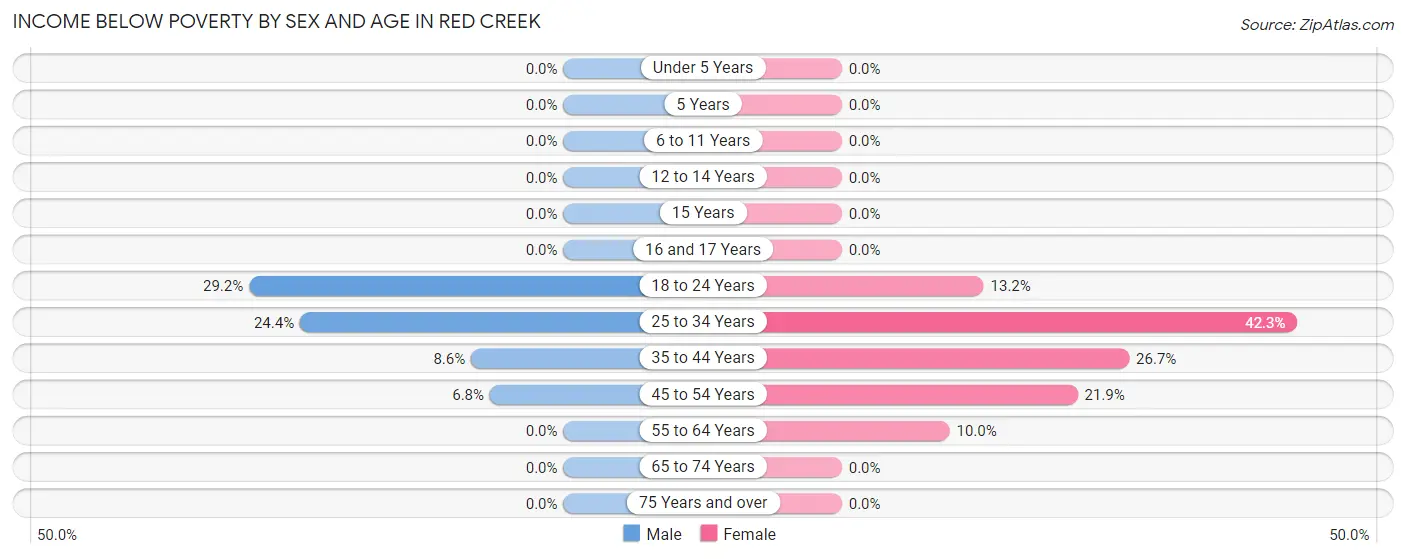
| Age Bracket | Male | Female |
| Under 5 Years | 0 (0.0%) | 0 (0.0%) |
| 5 Years | 0 (0.0%) | 0 (0.0%) |
| 6 to 11 Years | 0 (0.0%) | 0 (0.0%) |
| 12 to 14 Years | 0 (0.0%) | 0 (0.0%) |
| 15 Years | 0 (0.0%) | 0 (0.0%) |
| 16 and 17 Years | 0 (0.0%) | 0 (0.0%) |
| 18 to 24 Years | 7 (29.2%) | 5 (13.2%) |
| 25 to 34 Years | 11 (24.4%) | 41 (42.3%) |
| 35 to 44 Years | 3 (8.6%) | 8 (26.7%) |
| 45 to 54 Years | 3 (6.8%) | 14 (21.9%) |
| 55 to 64 Years | 0 (0.0%) | 2 (10.0%) |
| 65 to 74 Years | 0 (0.0%) | 0 (0.0%) |
| 75 Years and over | 0 (0.0%) | 0 (0.0%) |
| Total | 24 (8.3%) | 70 (17.2%) |
Income Above Poverty by Sex and Age in Red Creek
According to the poverty statistics in Red Creek, males aged under 5 years and females aged under 5 years are the age groups that are most secure financially, with 100.0% of males and 100.0% of females in these age groups living above the poverty line.
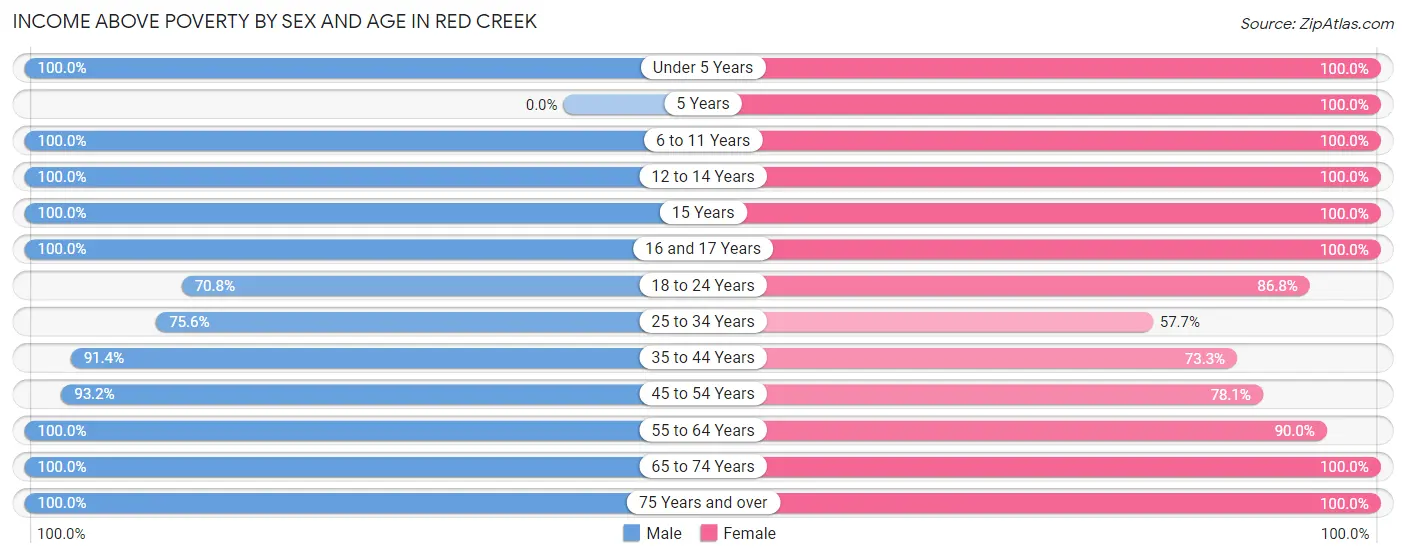
| Age Bracket | Male | Female |
| Under 5 Years | 30 (100.0%) | 46 (100.0%) |
| 5 Years | 0 (0.0%) | 7 (100.0%) |
| 6 to 11 Years | 53 (100.0%) | 39 (100.0%) |
| 12 to 14 Years | 12 (100.0%) | 9 (100.0%) |
| 15 Years | 3 (100.0%) | 8 (100.0%) |
| 16 and 17 Years | 6 (100.0%) | 4 (100.0%) |
| 18 to 24 Years | 17 (70.8%) | 33 (86.8%) |
| 25 to 34 Years | 34 (75.6%) | 56 (57.7%) |
| 35 to 44 Years | 32 (91.4%) | 22 (73.3%) |
| 45 to 54 Years | 41 (93.2%) | 50 (78.1%) |
| 55 to 64 Years | 14 (100.0%) | 18 (90.0%) |
| 65 to 74 Years | 9 (100.0%) | 18 (100.0%) |
| 75 Years and over | 16 (100.0%) | 26 (100.0%) |
| Total | 267 (91.7%) | 336 (82.8%) |
Income Below Poverty Among Married-Couple Families in Red Creek
The poverty statistics for married-couple families in Red Creek show that 2.7% or 3 of the total 110 families live below the poverty line. Families with no children have the highest poverty rate of 6.0%, comprising of 3 families. On the other hand, families with 1 or 2 children have the lowest poverty rate of 0.0%, which includes 0 families.
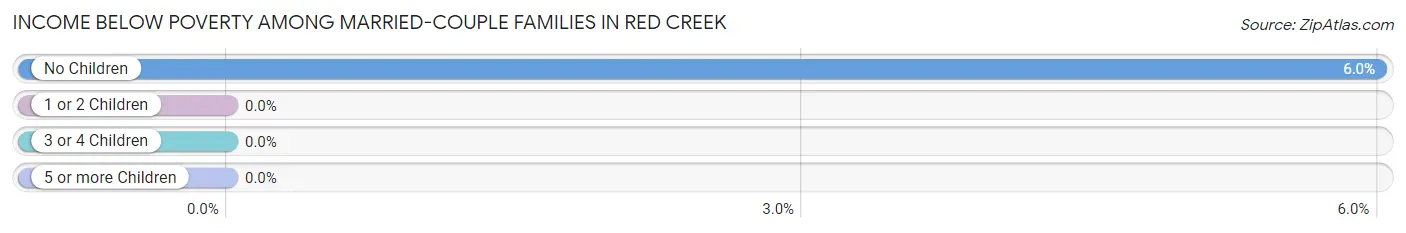
| Children | Above Poverty | Below Poverty |
| No Children | 47 (94.0%) | 3 (6.0%) |
| 1 or 2 Children | 41 (100.0%) | 0 (0.0%) |
| 3 or 4 Children | 19 (100.0%) | 0 (0.0%) |
| 5 or more Children | 0 (0.0%) | 0 (0.0%) |
| Total | 107 (97.3%) | 3 (2.7%) |
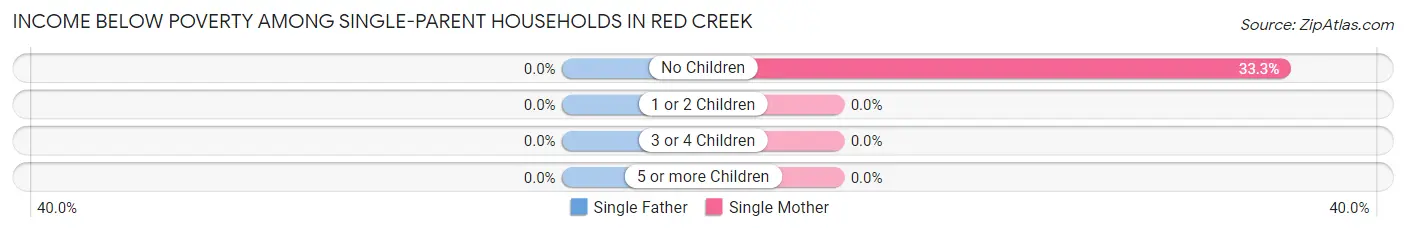
Income Below Poverty Among Single-Parent Households in Red Creek
| Children | Single Father | Single Mother |
| No Children | 0 (0.0%) | 10 (33.3%) |
| 1 or 2 Children | 0 (0.0%) | 0 (0.0%) |
| 3 or 4 Children | 0 (0.0%) | 0 (0.0%) |
| 5 or more Children | 0 (0.0%) | 0 (0.0%) |
| Total | 0 (0.0%) | 10 (18.9%) |
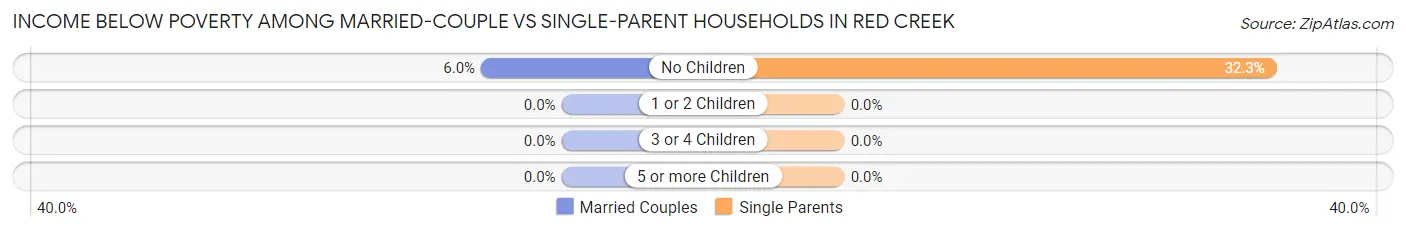
Income Below Poverty Among Married-Couple vs Single-Parent Households in Red Creek
The poverty data for Red Creek shows that 3 of the married-couple family households (2.7%) and 10 of the single-parent households (12.2%) are living below the poverty level. Within the married-couple family households, those with no children have the highest poverty rate, with 3 households (6.0%) falling below the poverty line. Among the single-parent households, those with no children have the highest poverty rate, with 10 household (32.3%) living below poverty.
| Children | Married-Couple Families | Single-Parent Households |
| No Children | 3 (6.0%) | 10 (32.3%) |
| 1 or 2 Children | 0 (0.0%) | 0 (0.0%) |
| 3 or 4 Children | 0 (0.0%) | 0 (0.0%) |
| 5 or more Children | 0 (0.0%) | 0 (0.0%) |
| Total | 3 (2.7%) | 10 (12.2%) |
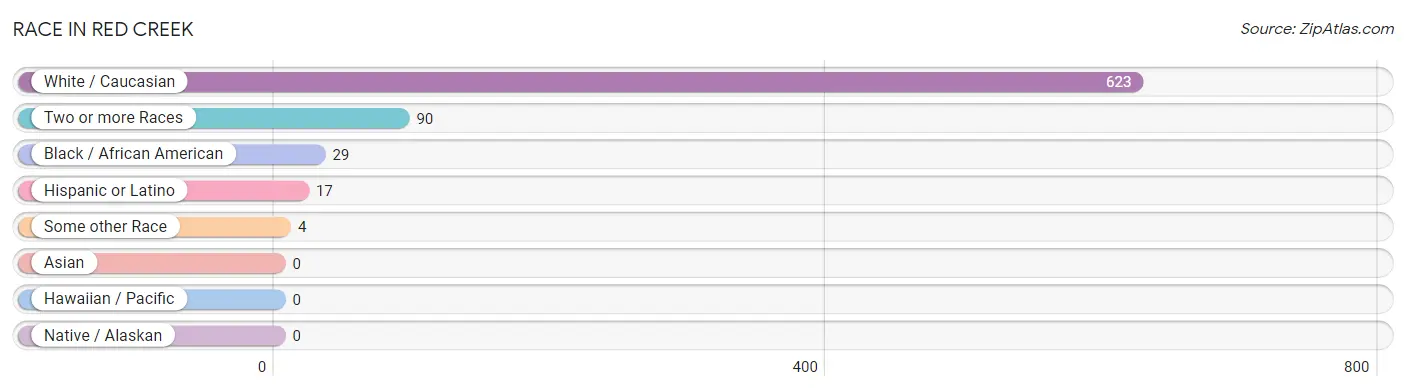
Race in Red Creek
The most populous races in Red Creek are White / Caucasian (623 | 83.5%), Two or more Races (90 | 12.1%), and Black / African American (29 | 3.9%).
| Race | # Population | % Population |
| Asian | 0 | 0.0% |
| Black / African American | 29 | 3.9% |
| Hawaiian / Pacific | 0 | 0.0% |
| Hispanic or Latino | 17 | 2.3% |
| Native / Alaskan | 0 | 0.0% |
| White / Caucasian | 623 | 83.5% |
| Two or more Races | 90 | 12.1% |
| Some other Race | 4 | 0.5% |
| Total | 746 | 100.0% |
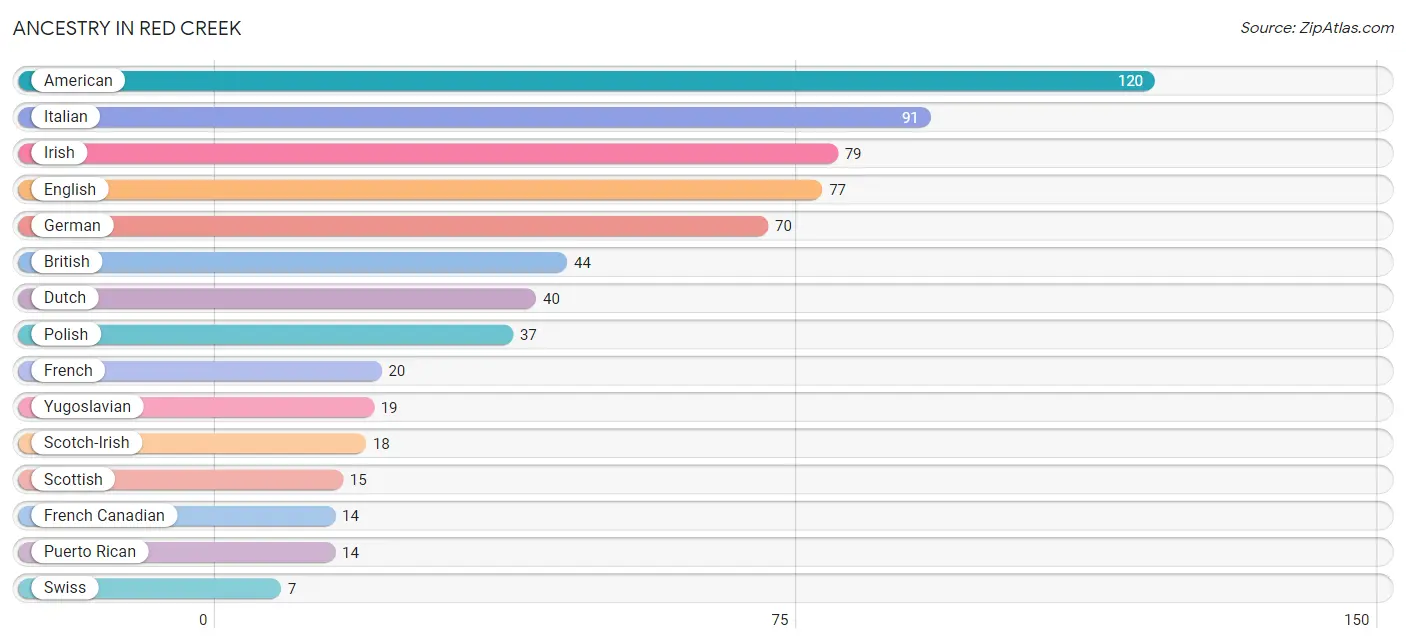
Ancestry in Red Creek
The most populous ancestries reported in Red Creek are American (120 | 16.1%), Italian (91 | 12.2%), Irish (79 | 10.6%), English (77 | 10.3%), and German (70 | 9.4%), together accounting for 58.6% of all Red Creek residents.
| Ancestry | # Population | % Population |
| American | 120 | 16.1% |
| British | 44 | 5.9% |
| Cuban | 3 | 0.4% |
| Dutch | 40 | 5.4% |
| English | 77 | 10.3% |
| European | 2 | 0.3% |
| French | 20 | 2.7% |
| French Canadian | 14 | 1.9% |
| German | 70 | 9.4% |
| Greek | 3 | 0.4% |
| Irish | 79 | 10.6% |
| Italian | 91 | 12.2% |
| Polish | 37 | 5.0% |
| Puerto Rican | 14 | 1.9% |
| Russian | 5 | 0.7% |
| Scotch-Irish | 18 | 2.4% |
| Scottish | 15 | 2.0% |
| Swiss | 7 | 0.9% |
| Yugoslavian | 19 | 2.5% | View All 19 Rows |
Immigrants in Red Creek
The most numerous immigrant groups reported in Red Creek came from , and Canada (6 | 0.8%), together accounting for 0.8% of all Red Creek residents.

| Immigration Origin | # Population | % Population |
| Canada | 6 | 0.8% | View All 1 Rows |
Sex and Age in Red Creek
Sex and Age in Red Creek
The most populous age groups in Red Creek are Under 5 Years (58 | 17.5%) for men and 25 to 29 Years (70 | 16.9%) for women.
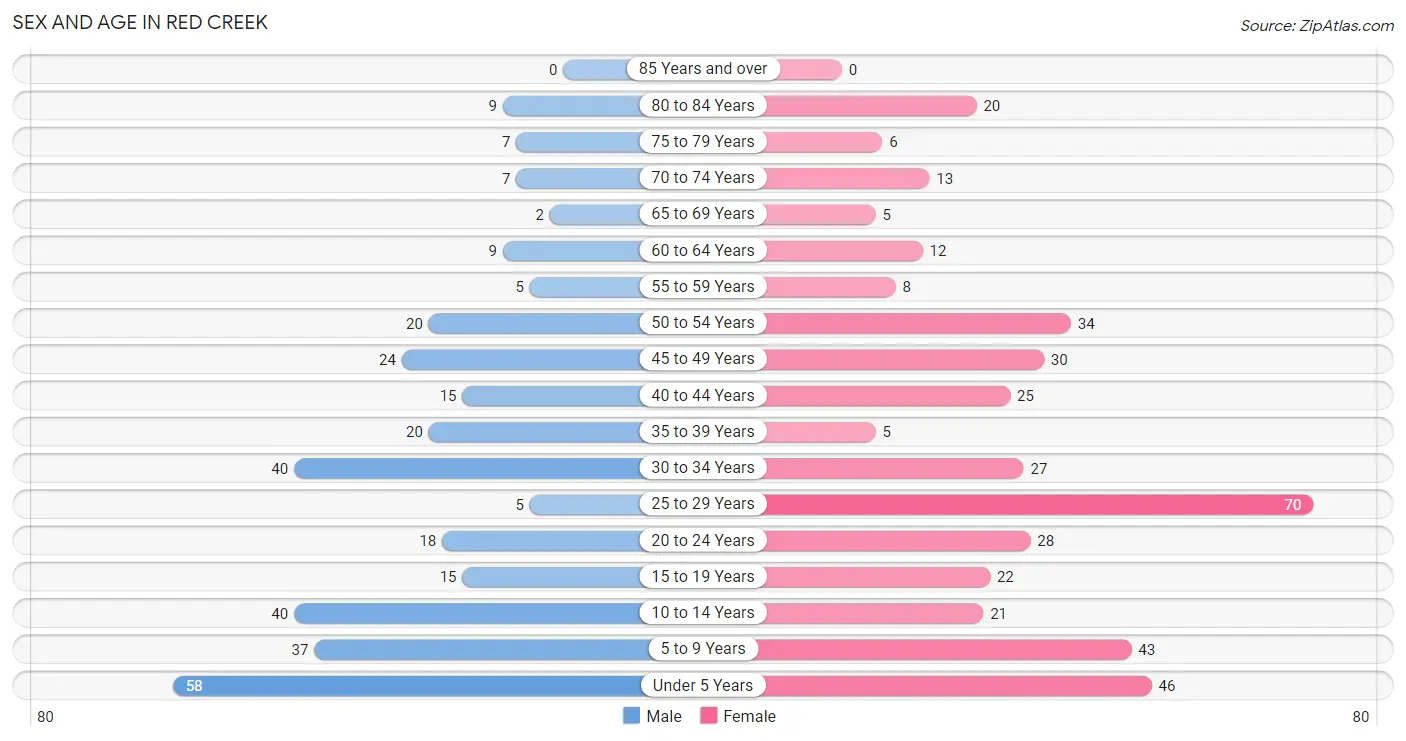
| Age Bracket | Male | Female |
| Under 5 Years | 58 (17.5%) | 46 (11.1%) |
| 5 to 9 Years | 37 (11.2%) | 43 (10.4%) |
| 10 to 14 Years | 40 (12.1%) | 21 (5.1%) |
| 15 to 19 Years | 15 (4.5%) | 22 (5.3%) |
| 20 to 24 Years | 18 (5.4%) | 28 (6.8%) |
| 25 to 29 Years | 5 (1.5%) | 70 (16.9%) |
| 30 to 34 Years | 40 (12.1%) | 27 (6.5%) |
| 35 to 39 Years | 20 (6.0%) | 5 (1.2%) |
| 40 to 44 Years | 15 (4.5%) | 25 (6.0%) |
| 45 to 49 Years | 24 (7.2%) | 30 (7.2%) |
| 50 to 54 Years | 20 (6.0%) | 34 (8.2%) |
| 55 to 59 Years | 5 (1.5%) | 8 (1.9%) |
| 60 to 64 Years | 9 (2.7%) | 12 (2.9%) |
| 65 to 69 Years | 2 (0.6%) | 5 (1.2%) |
| 70 to 74 Years | 7 (2.1%) | 13 (3.1%) |
| 75 to 79 Years | 7 (2.1%) | 6 (1.5%) |
| 80 to 84 Years | 9 (2.7%) | 20 (4.8%) |
| 85 Years and over | 0 (0.0%) | 0 (0.0%) |
| Total | 331 (100.0%) | 415 (100.0%) |
Families and Households in Red Creek
Median Family Size in Red Creek
The median family size in Red Creek is 3.03 persons per family, with married-couple families (110 | 57.3%) accounting for the largest median family size of 3.4 persons per family. On the other hand, single female/mother families (53 | 27.6%) represent the smallest median family size with 2.21 persons per family.
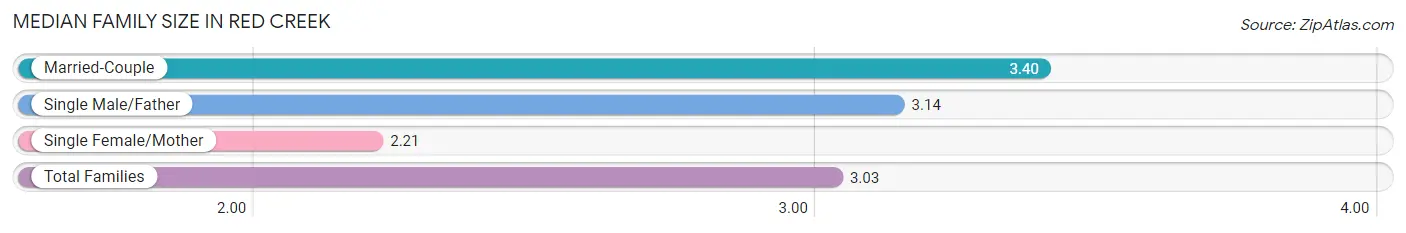
| Family Type | # Families | Family Size |
| Married-Couple | 110 (57.3%) | 3.40 |
| Single Male/Father | 29 (15.1%) | 3.14 |
| Single Female/Mother | 53 (27.6%) | 2.21 |
| Total Families | 192 (100.0%) | 3.03 |
Median Household Size in Red Creek
The median household size in Red Creek is 3.20 persons per household, with single male/father households (29 | 12.4%) accounting for the largest median household size of 4.62 persons per household. non-family households (41 | 17.6%) represent the smallest median household size with 1.68 persons per household.
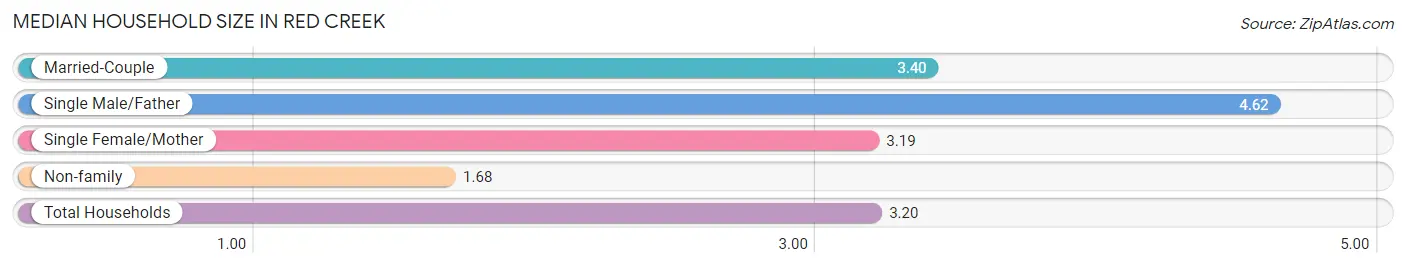
| Household Type | # Households | Household Size |
| Married-Couple | 110 (47.2%) | 3.40 |
| Single Male/Father | 29 (12.4%) | 4.62 |
| Single Female/Mother | 53 (22.8%) | 3.19 |
| Non-family | 41 (17.6%) | 1.68 |
| Total Households | 233 (100.0%) | 3.20 |
Household Size by Marriage Status in Red Creek
Out of a total of 233 households in Red Creek, 192 (82.4%) are family households, while 41 (17.6%) are nonfamily households. The most numerous type of family households are 4-person households, comprising 62, and the most common type of nonfamily households are 1-person households, comprising 32.
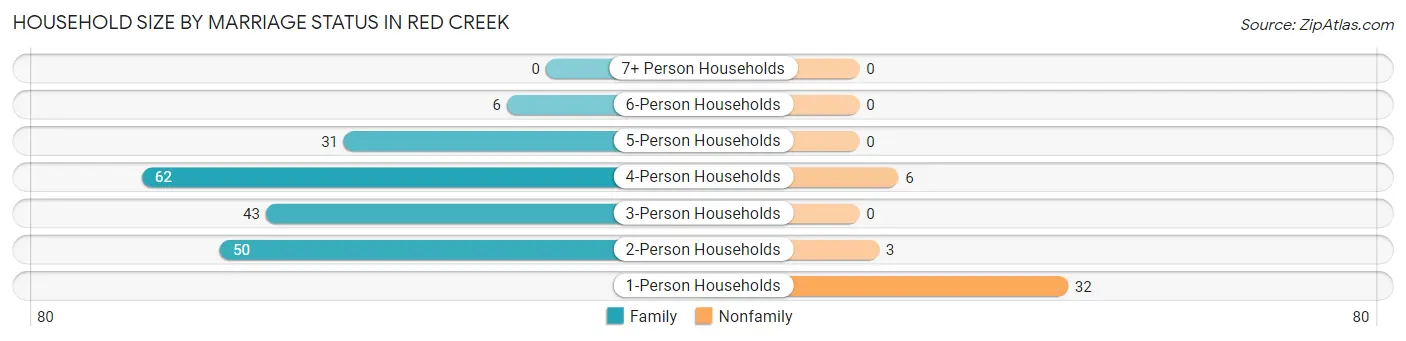
| Household Size | Family Households | Nonfamily Households |
| 1-Person Households | - | 32 (13.7%) |
| 2-Person Households | 50 (21.5%) | 3 (1.3%) |
| 3-Person Households | 43 (18.4%) | 0 (0.0%) |
| 4-Person Households | 62 (26.6%) | 6 (2.6%) |
| 5-Person Households | 31 (13.3%) | 0 (0.0%) |
| 6-Person Households | 6 (2.6%) | 0 (0.0%) |
| 7+ Person Households | 0 (0.0%) | 0 (0.0%) |
| Total | 192 (82.4%) | 41 (17.6%) |
Female Fertility in Red Creek
Fertility by Age in Red Creek
Average fertility rate in Red Creek is 192.0 births per 1,000 women. Women in the age bracket of 20 to 34 years have the highest fertility rate with 328.0 births per 1,000 women. Women in the age bracket of 20 to 34 years acount for 100.0% of all women with births.
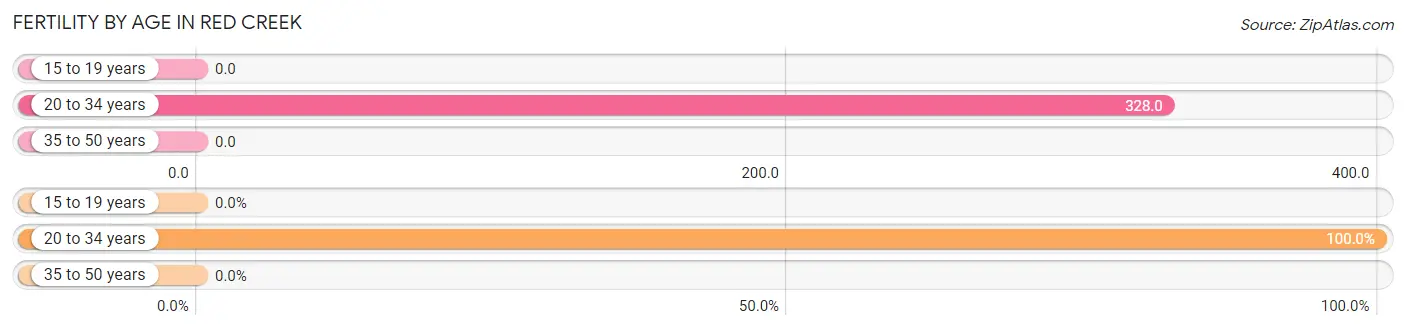
| Age Bracket | Women with Births | Births / 1,000 Women |
| 15 to 19 years | 0 (0.0%) | 0.0 |
| 20 to 34 years | 41 (100.0%) | 328.0 |
| 35 to 50 years | 0 (0.0%) | 0.0 |
| Total | 41 (100.0%) | 192.0 |
Fertility by Age by Marriage Status in Red Creek
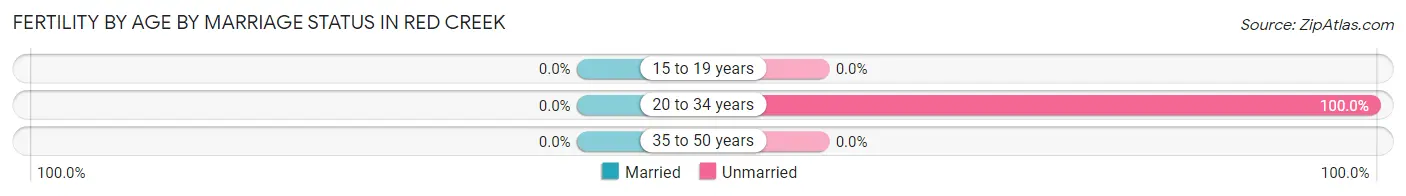
| Age Bracket | Married | Unmarried |
| 15 to 19 years | 0 (0.0%) | 0 (0.0%) |
| 20 to 34 years | 0 (0.0%) | 41 (100.0%) |
| 35 to 50 years | 0 (0.0%) | 0 (0.0%) |
| Total | 0 (0.0%) | 41 (100.0%) |
Fertility by Education in Red Creek
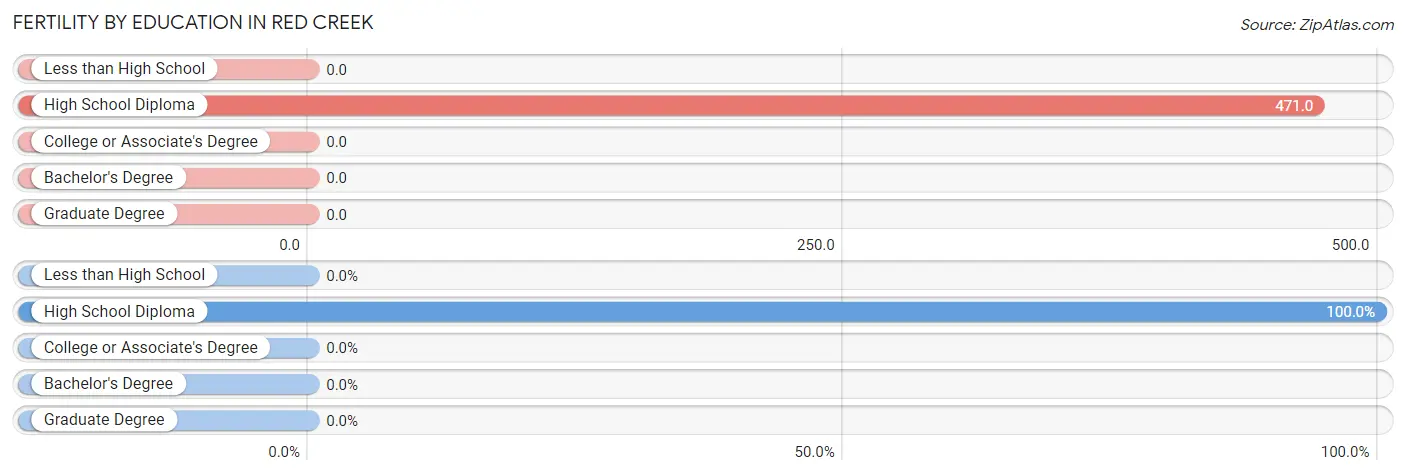
| Educational Attainment | Women with Births | Births / 1,000 Women |
| Less than High School | 0 (0.0%) | 0.0 |
| High School Diploma | 41 (100.0%) | 471.0 |
| College or Associate's Degree | 0 (0.0%) | 0.0 |
| Bachelor's Degree | 0 (0.0%) | 0.0 |
| Graduate Degree | 0 (0.0%) | 0.0 |
| Total | 41 (100.0%) | 192.0 |
Fertility by Education by Marriage Status in Red Creek
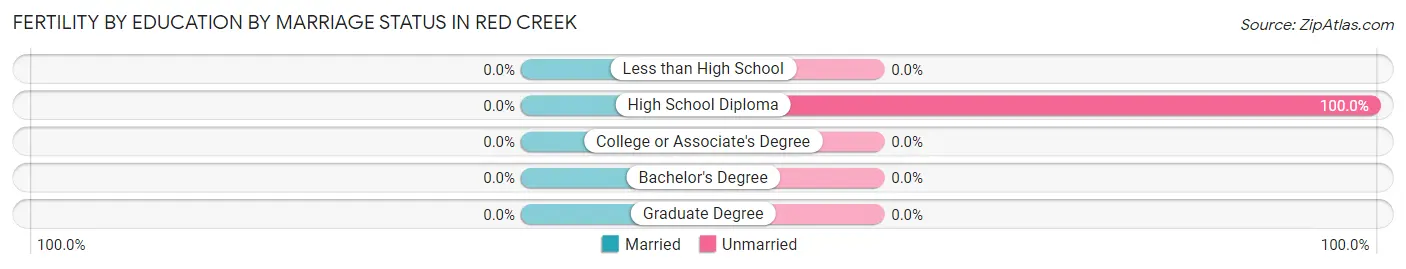
| Educational Attainment | Married | Unmarried |
| Less than High School | 0 (0.0%) | 0 (0.0%) |
| High School Diploma | 0 (0.0%) | 41 (100.0%) |
| College or Associate's Degree | 0 (0.0%) | 0 (0.0%) |
| Bachelor's Degree | 0 (0.0%) | 0 (0.0%) |
| Graduate Degree | 0 (0.0%) | 0 (0.0%) |
| Total | 0 (0.0%) | 41 (100.0%) |
Employment Characteristics in Red Creek
Employment by Class of Employer in Red Creek
Among the 272 employed individuals in Red Creek, private company employees (174 | 64.0%), local government employees (32 | 11.8%), and not-for-profit organizations (27 | 9.9%) make up the most common classes of employment.
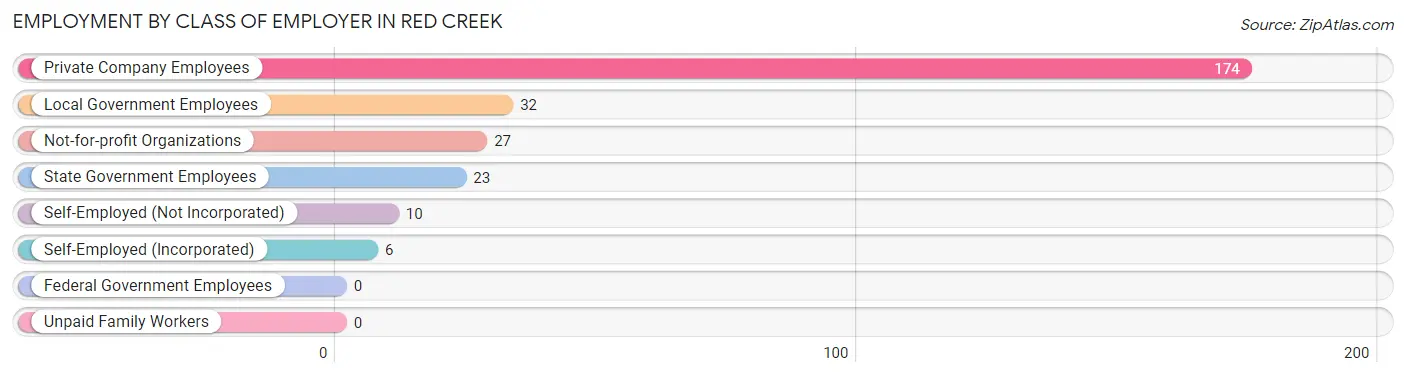
| Employer Class | # Employees | % Employees |
| Private Company Employees | 174 | 64.0% |
| Self-Employed (Incorporated) | 6 | 2.2% |
| Self-Employed (Not Incorporated) | 10 | 3.7% |
| Not-for-profit Organizations | 27 | 9.9% |
| Local Government Employees | 32 | 11.8% |
| State Government Employees | 23 | 8.5% |
| Federal Government Employees | 0 | 0.0% |
| Unpaid Family Workers | 0 | 0.0% |
| Total | 272 | 100.0% |
Employment Status by Age in Red Creek
According to the labor force statistics for Red Creek, out of the total population over 16 years of age (490), 61.2% or 300 individuals are in the labor force, with 5.7% or 17 of them unemployed. The age group with the highest labor force participation rate is 60 to 64 years, with 90.5% or 19 individuals in the labor force. Within the labor force, the 20 to 24 years age range has the highest percentage of unemployed individuals, with 33.3% or 11 of them being unemployed.
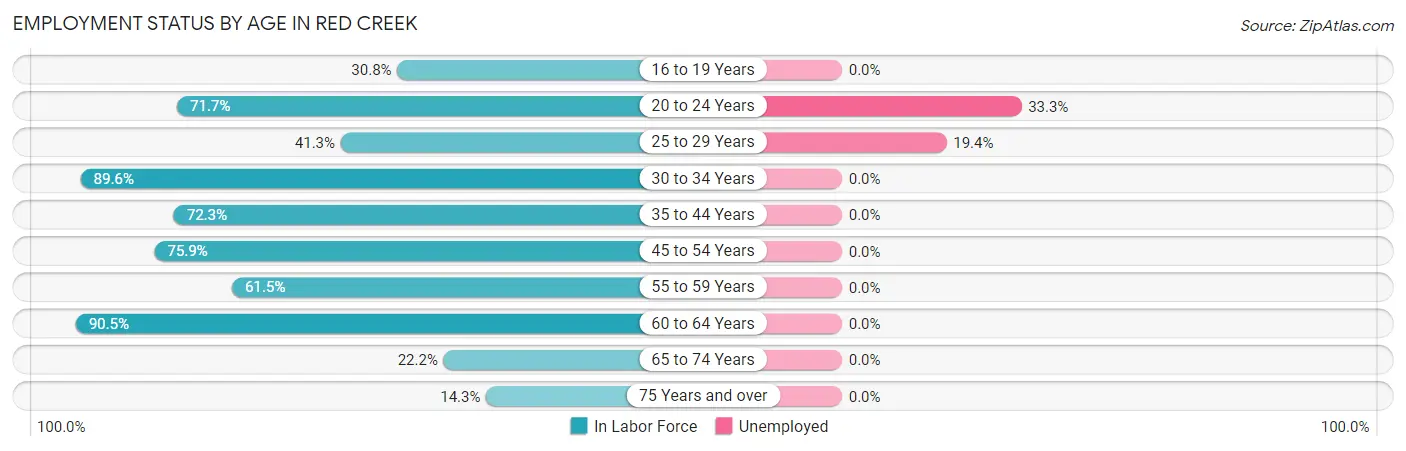
| Age Bracket | In Labor Force | Unemployed |
| 16 to 19 Years | 8 (30.8%) | 0 (0.0%) |
| 20 to 24 Years | 33 (71.7%) | 11 (33.3%) |
| 25 to 29 Years | 31 (41.3%) | 6 (19.4%) |
| 30 to 34 Years | 60 (89.6%) | 0 (0.0%) |
| 35 to 44 Years | 47 (72.3%) | 0 (0.0%) |
| 45 to 54 Years | 82 (75.9%) | 0 (0.0%) |
| 55 to 59 Years | 8 (61.5%) | 0 (0.0%) |
| 60 to 64 Years | 19 (90.5%) | 0 (0.0%) |
| 65 to 74 Years | 6 (22.2%) | 0 (0.0%) |
| 75 Years and over | 6 (14.3%) | 0 (0.0%) |
| Total | 300 (61.2%) | 17 (5.7%) |
Employment Status by Educational Attainment in Red Creek
According to labor force statistics for Red Creek, 70.8% of individuals (247) out of the total population between 25 and 64 years of age (349) are in the labor force, with 2.4% or 6 of them being unemployed. The group with the highest labor force participation rate are those with the educational attainment of bachelor's degree or higher, with 100.0% or 78 individuals in the labor force. Within the labor force, individuals with high school diploma education have the highest percentage of unemployment, with 7.8% or 6 of them being unemployed.
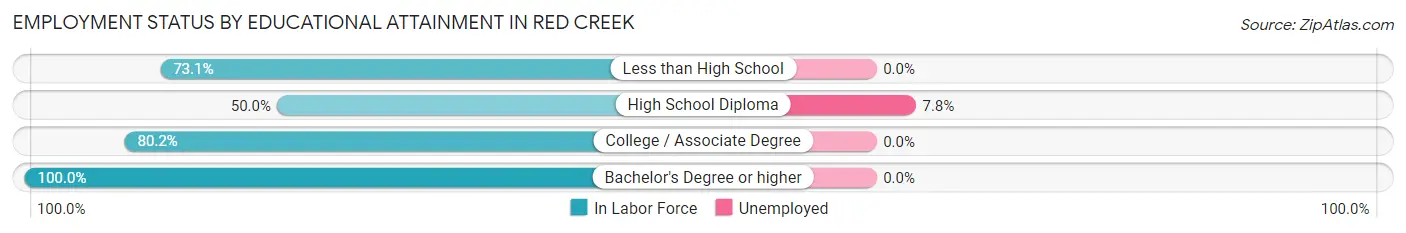
| Educational Attainment | In Labor Force | Unemployed |
| Less than High School | 19 (73.1%) | 0 (0.0%) |
| High School Diploma | 77 (50.0%) | 12 (7.8%) |
| College / Associate Degree | 73 (80.2%) | 0 (0.0%) |
| Bachelor's Degree or higher | 78 (100.0%) | 0 (0.0%) |
| Total | 247 (70.8%) | 8 (2.4%) |
Employment Occupations by Sex in Red Creek
Management, Business, Science and Arts Occupations
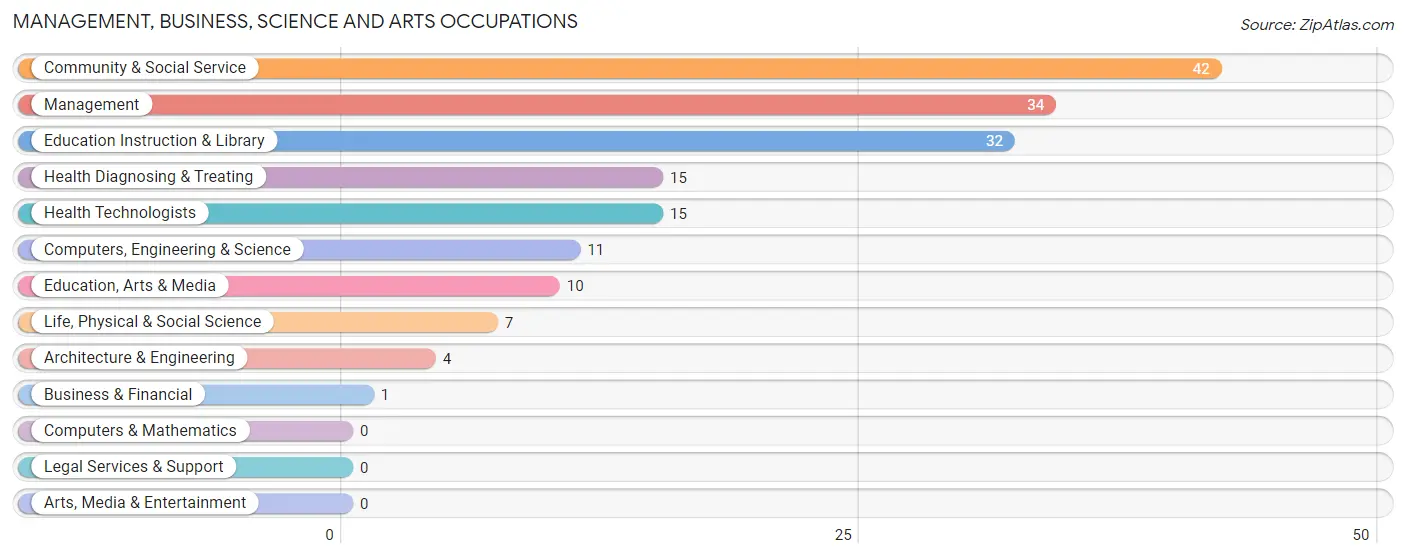
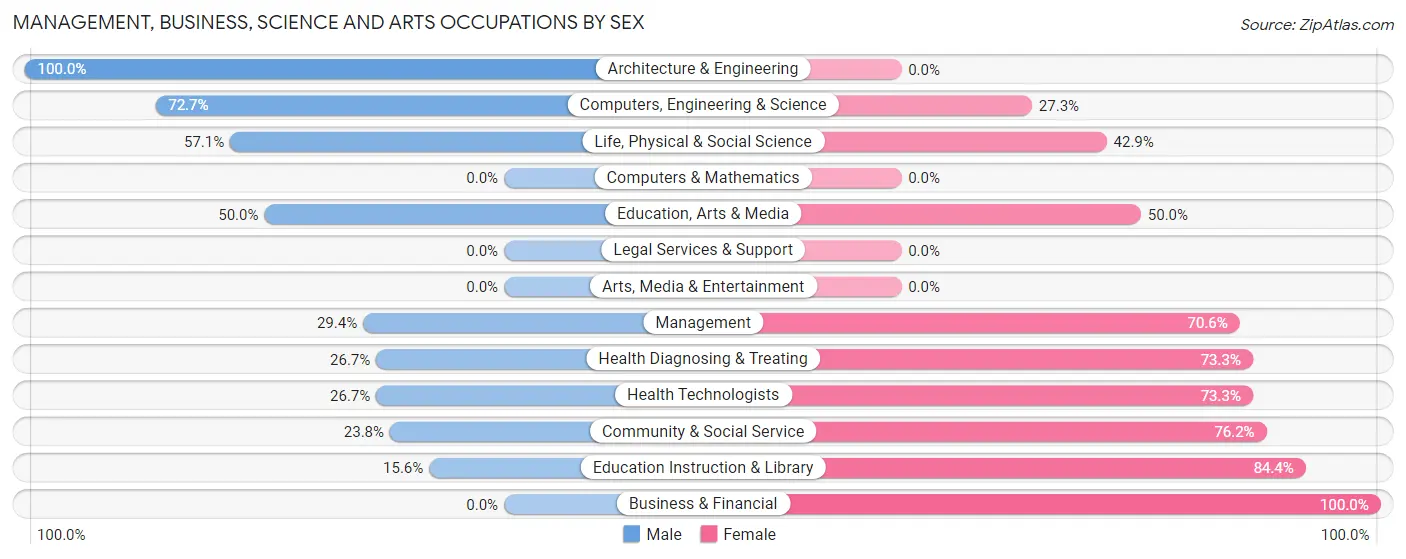
The most common Management, Business, Science and Arts occupations in Red Creek are Community & Social Service (42 | 14.8%), Management (34 | 12.0%), Education Instruction & Library (32 | 11.3%), Health Diagnosing & Treating (15 | 5.3%), and Health Technologists (15 | 5.3%).
Management, Business, Science and Arts Occupations by Sex
Within the Management, Business, Science and Arts occupations in Red Creek, the most male-oriented occupations are Architecture & Engineering (100.0%), Computers, Engineering & Science (72.7%), and Life, Physical & Social Science (57.1%), while the most female-oriented occupations are Business & Financial (100.0%), Education Instruction & Library (84.4%), and Community & Social Service (76.2%).
| Occupation | Male | Female |
| Management | 10 (29.4%) | 24 (70.6%) |
| Business & Financial | 0 (0.0%) | 1 (100.0%) |
| Computers, Engineering & Science | 8 (72.7%) | 3 (27.3%) |
| Computers & Mathematics | 0 (0.0%) | 0 (0.0%) |
| Architecture & Engineering | 4 (100.0%) | 0 (0.0%) |
| Life, Physical & Social Science | 4 (57.1%) | 3 (42.9%) |
| Community & Social Service | 10 (23.8%) | 32 (76.2%) |
| Education, Arts & Media | 5 (50.0%) | 5 (50.0%) |
| Legal Services & Support | 0 (0.0%) | 0 (0.0%) |
| Education Instruction & Library | 5 (15.6%) | 27 (84.4%) |
| Arts, Media & Entertainment | 0 (0.0%) | 0 (0.0%) |
| Health Diagnosing & Treating | 4 (26.7%) | 11 (73.3%) |
| Health Technologists | 4 (26.7%) | 11 (73.3%) |
| Total (Category) | 32 (31.1%) | 71 (68.9%) |
| Total (Overall) | 125 (44.2%) | 158 (55.8%) |
Services Occupations
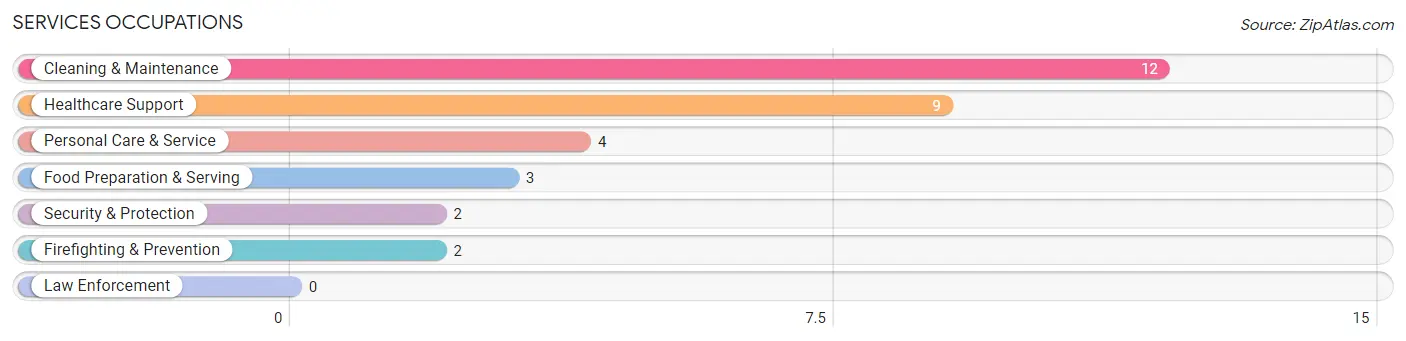
The most common Services occupations in Red Creek are Cleaning & Maintenance (12 | 4.2%), Healthcare Support (9 | 3.2%), Personal Care & Service (4 | 1.4%), Food Preparation & Serving (3 | 1.1%), and Security & Protection (2 | 0.7%).
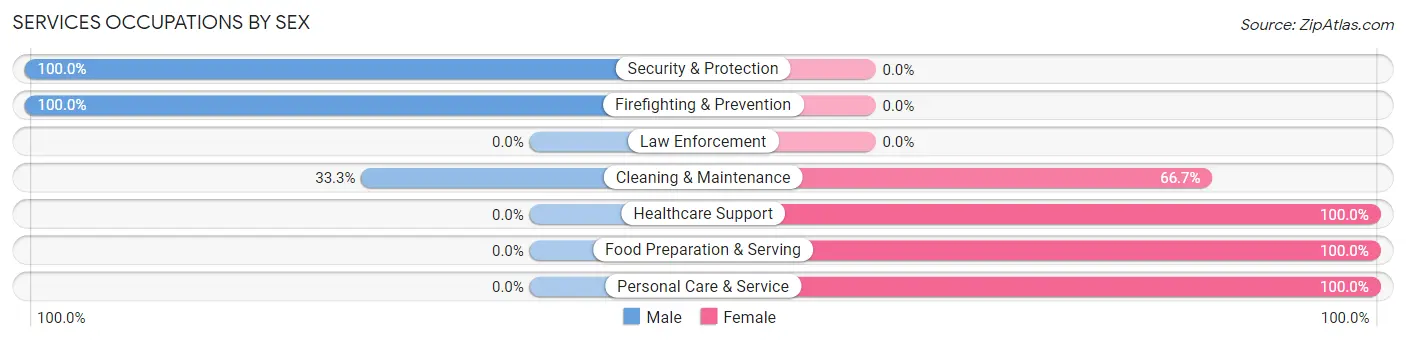
Services Occupations by Sex
Within the Services occupations in Red Creek, the most male-oriented occupations are Security & Protection (100.0%), Firefighting & Prevention (100.0%), and Cleaning & Maintenance (33.3%), while the most female-oriented occupations are Healthcare Support (100.0%), Food Preparation & Serving (100.0%), and Personal Care & Service (100.0%).
| Occupation | Male | Female |
| Healthcare Support | 0 (0.0%) | 9 (100.0%) |
| Security & Protection | 2 (100.0%) | 0 (0.0%) |
| Firefighting & Prevention | 2 (100.0%) | 0 (0.0%) |
| Law Enforcement | 0 (0.0%) | 0 (0.0%) |
| Food Preparation & Serving | 0 (0.0%) | 3 (100.0%) |
| Cleaning & Maintenance | 4 (33.3%) | 8 (66.7%) |
| Personal Care & Service | 0 (0.0%) | 4 (100.0%) |
| Total (Category) | 6 (20.0%) | 24 (80.0%) |
| Total (Overall) | 125 (44.2%) | 158 (55.8%) |
Sales and Office Occupations
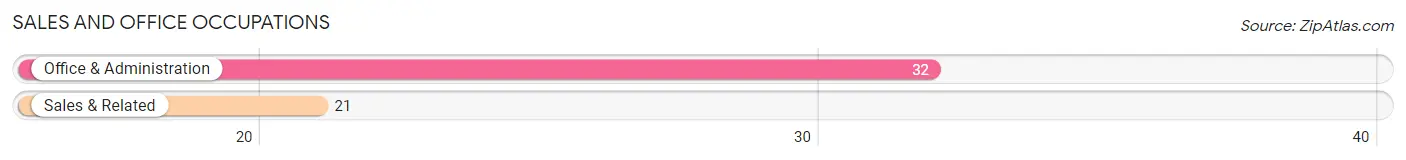
The most common Sales and Office occupations in Red Creek are Office & Administration (32 | 11.3%), and Sales & Related (21 | 7.4%).
Sales and Office Occupations by Sex
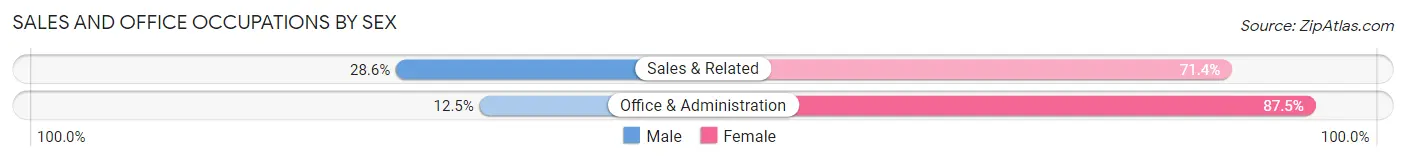
| Occupation | Male | Female |
| Sales & Related | 6 (28.6%) | 15 (71.4%) |
| Office & Administration | 4 (12.5%) | 28 (87.5%) |
| Total (Category) | 10 (18.9%) | 43 (81.1%) |
| Total (Overall) | 125 (44.2%) | 158 (55.8%) |
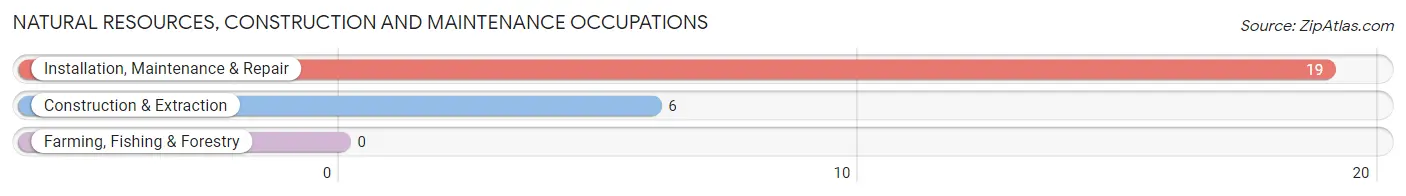
Natural Resources, Construction and Maintenance Occupations
The most common Natural Resources, Construction and Maintenance occupations in Red Creek are Installation, Maintenance & Repair (19 | 6.7%), and Construction & Extraction (6 | 2.1%).
Natural Resources, Construction and Maintenance Occupations by Sex
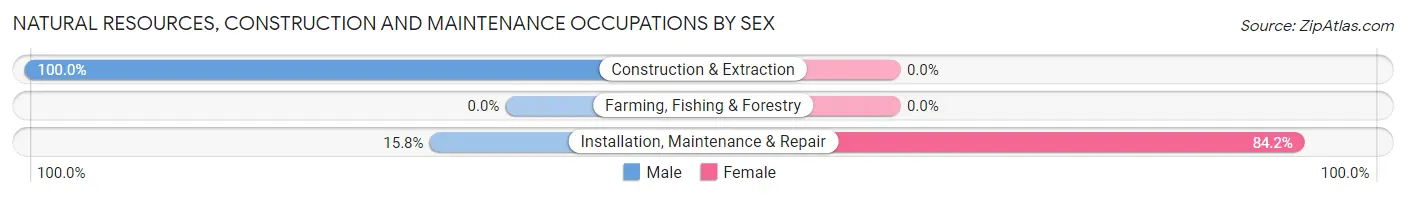
| Occupation | Male | Female |
| Farming, Fishing & Forestry | 0 (0.0%) | 0 (0.0%) |
| Construction & Extraction | 6 (100.0%) | 0 (0.0%) |
| Installation, Maintenance & Repair | 3 (15.8%) | 16 (84.2%) |
| Total (Category) | 9 (36.0%) | 16 (64.0%) |
| Total (Overall) | 125 (44.2%) | 158 (55.8%) |
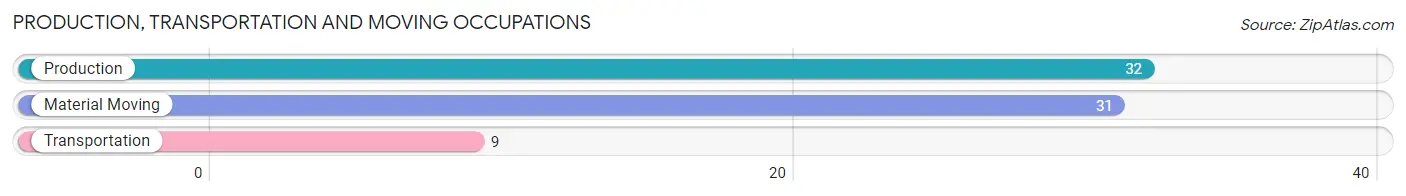
Production, Transportation and Moving Occupations
The most common Production, Transportation and Moving occupations in Red Creek are Production (32 | 11.3%), Material Moving (31 | 11.0%), and Transportation (9 | 3.2%).
Production, Transportation and Moving Occupations by Sex
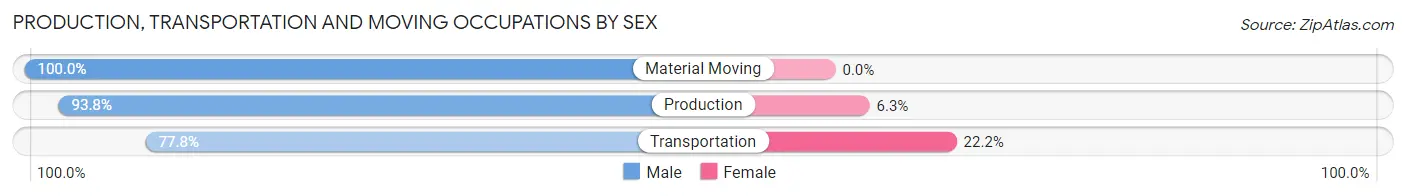
| Occupation | Male | Female |
| Production | 30 (93.8%) | 2 (6.2%) |
| Transportation | 7 (77.8%) | 2 (22.2%) |
| Material Moving | 31 (100.0%) | 0 (0.0%) |
| Total (Category) | 68 (94.4%) | 4 (5.6%) |
| Total (Overall) | 125 (44.2%) | 158 (55.8%) |
Employment Industries by Sex in Red Creek
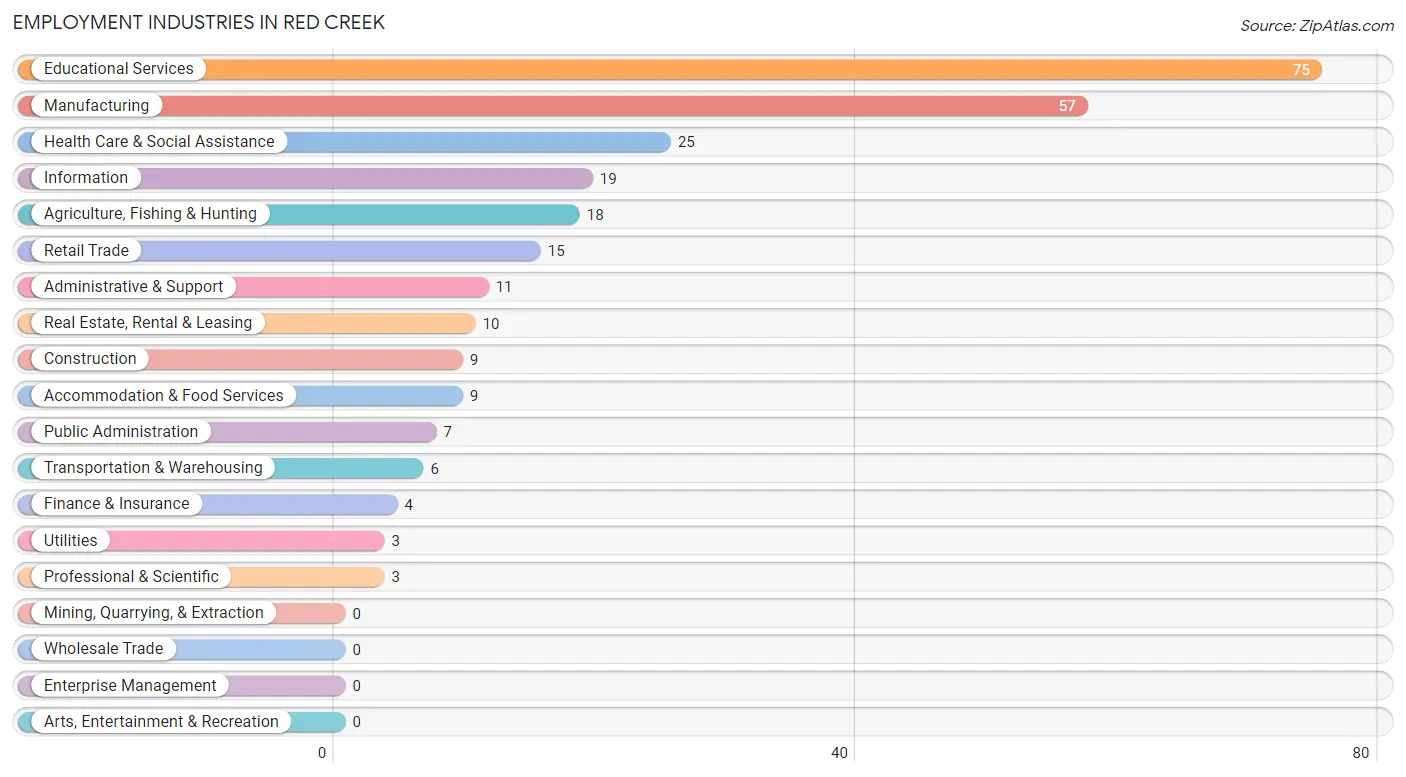
Employment Industries in Red Creek
The major employment industries in Red Creek include Educational Services (75 | 26.5%), Manufacturing (57 | 20.1%), Health Care & Social Assistance (25 | 8.8%), Information (19 | 6.7%), and Agriculture, Fishing & Hunting (18 | 6.4%).
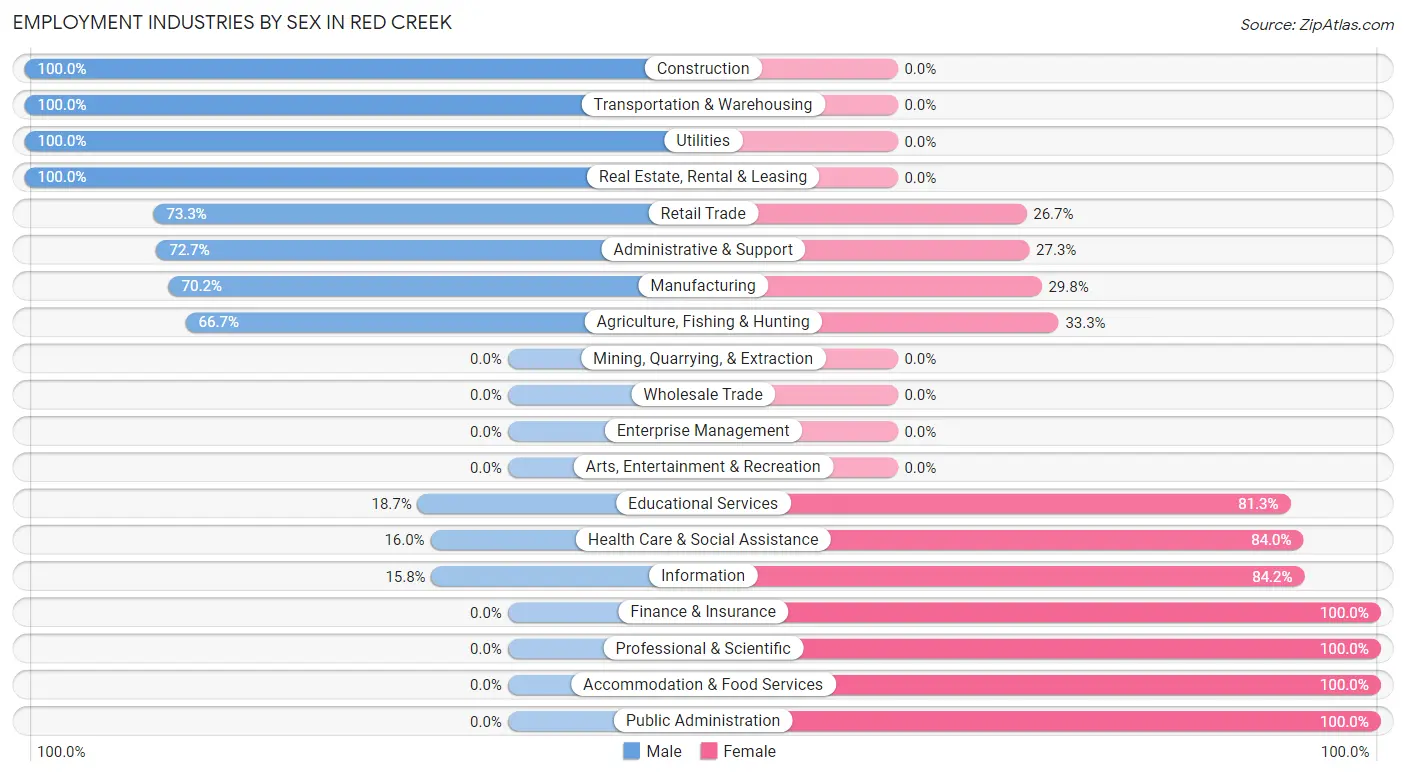
Employment Industries by Sex in Red Creek
The Red Creek industries that see more men than women are Construction (100.0%), Transportation & Warehousing (100.0%), and Utilities (100.0%), whereas the industries that tend to have a higher number of women are Finance & Insurance (100.0%), Professional & Scientific (100.0%), and Accommodation & Food Services (100.0%).
| Industry | Male | Female |
| Agriculture, Fishing & Hunting | 12 (66.7%) | 6 (33.3%) |
| Mining, Quarrying, & Extraction | 0 (0.0%) | 0 (0.0%) |
| Construction | 9 (100.0%) | 0 (0.0%) |
| Manufacturing | 40 (70.2%) | 17 (29.8%) |
| Wholesale Trade | 0 (0.0%) | 0 (0.0%) |
| Retail Trade | 11 (73.3%) | 4 (26.7%) |
| Transportation & Warehousing | 6 (100.0%) | 0 (0.0%) |
| Utilities | 3 (100.0%) | 0 (0.0%) |
| Information | 3 (15.8%) | 16 (84.2%) |
| Finance & Insurance | 0 (0.0%) | 4 (100.0%) |
| Real Estate, Rental & Leasing | 10 (100.0%) | 0 (0.0%) |
| Professional & Scientific | 0 (0.0%) | 3 (100.0%) |
| Enterprise Management | 0 (0.0%) | 0 (0.0%) |
| Administrative & Support | 8 (72.7%) | 3 (27.3%) |
| Educational Services | 14 (18.7%) | 61 (81.3%) |
| Health Care & Social Assistance | 4 (16.0%) | 21 (84.0%) |
| Arts, Entertainment & Recreation | 0 (0.0%) | 0 (0.0%) |
| Accommodation & Food Services | 0 (0.0%) | 9 (100.0%) |
| Public Administration | 0 (0.0%) | 7 (100.0%) |
| Total | 125 (44.2%) | 158 (55.8%) |
Education in Red Creek
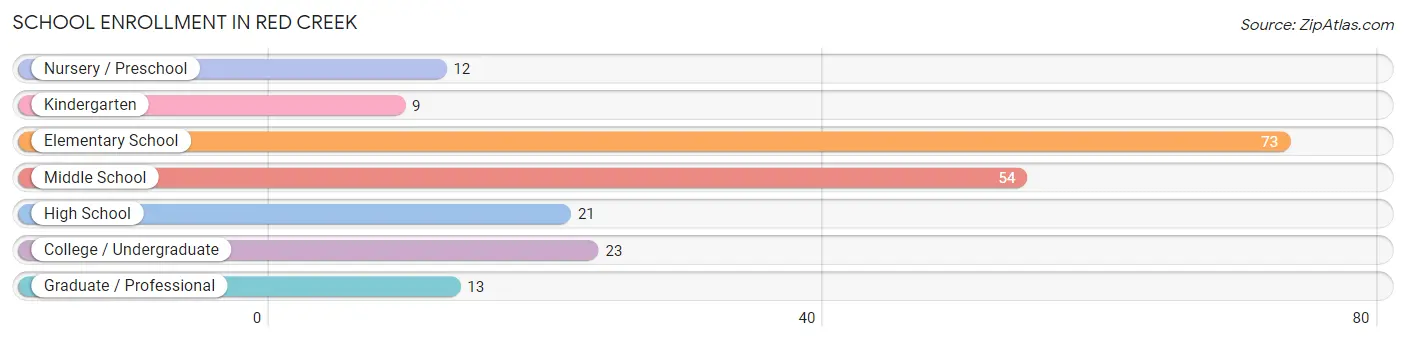
School Enrollment in Red Creek
The most common levels of schooling among the 205 students in Red Creek are elementary school (73 | 35.6%), middle school (54 | 26.3%), and college / undergraduate (23 | 11.2%).
| School Level | # Students | % Students |
| Nursery / Preschool | 12 | 5.9% |
| Kindergarten | 9 | 4.4% |
| Elementary School | 73 | 35.6% |
| Middle School | 54 | 26.3% |
| High School | 21 | 10.2% |
| College / Undergraduate | 23 | 11.2% |
| Graduate / Professional | 13 | 6.3% |
| Total | 205 | 100.0% |
School Enrollment by Age by Funding Source in Red Creek
Out of a total of 205 students who are enrolled in schools in Red Creek, 20 (9.8%) attend a private institution, while the remaining 185 (90.2%) are enrolled in public schools. The age group of 35 years and over has the highest likelihood of being enrolled in private schools, with 5 (50.0% in the age bracket) enrolled. Conversely, the age group of 3 to 4 year olds has the lowest likelihood of being enrolled in a private school, with 14 (100.0% in the age bracket) attending a public institution.
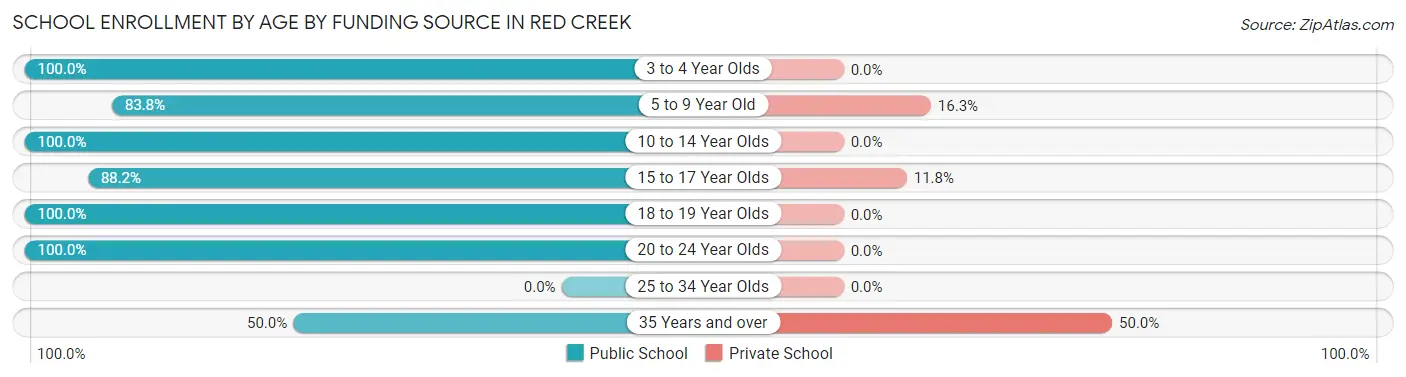
| Age Bracket | Public School | Private School |
| 3 to 4 Year Olds | 14 (100.0%) | 0 (0.0%) |
| 5 to 9 Year Old | 67 (83.8%) | 13 (16.3%) |
| 10 to 14 Year Olds | 57 (100.0%) | 0 (0.0%) |
| 15 to 17 Year Olds | 15 (88.2%) | 2 (11.8%) |
| 18 to 19 Year Olds | 6 (100.0%) | 0 (0.0%) |
| 20 to 24 Year Olds | 21 (100.0%) | 0 (0.0%) |
| 25 to 34 Year Olds | 0 (0.0%) | 0 (0.0%) |
| 35 Years and over | 5 (50.0%) | 5 (50.0%) |
| Total | 185 (90.2%) | 20 (9.8%) |
Educational Attainment by Field of Study in Red Creek
Education (19 | 22.1%), business (18 | 20.9%), communications (11 | 12.8%), computers & mathematics (10 | 11.6%), and science & technology (7 | 8.1%) are the most common fields of study among 86 individuals in Red Creek who have obtained a bachelor's degree or higher.
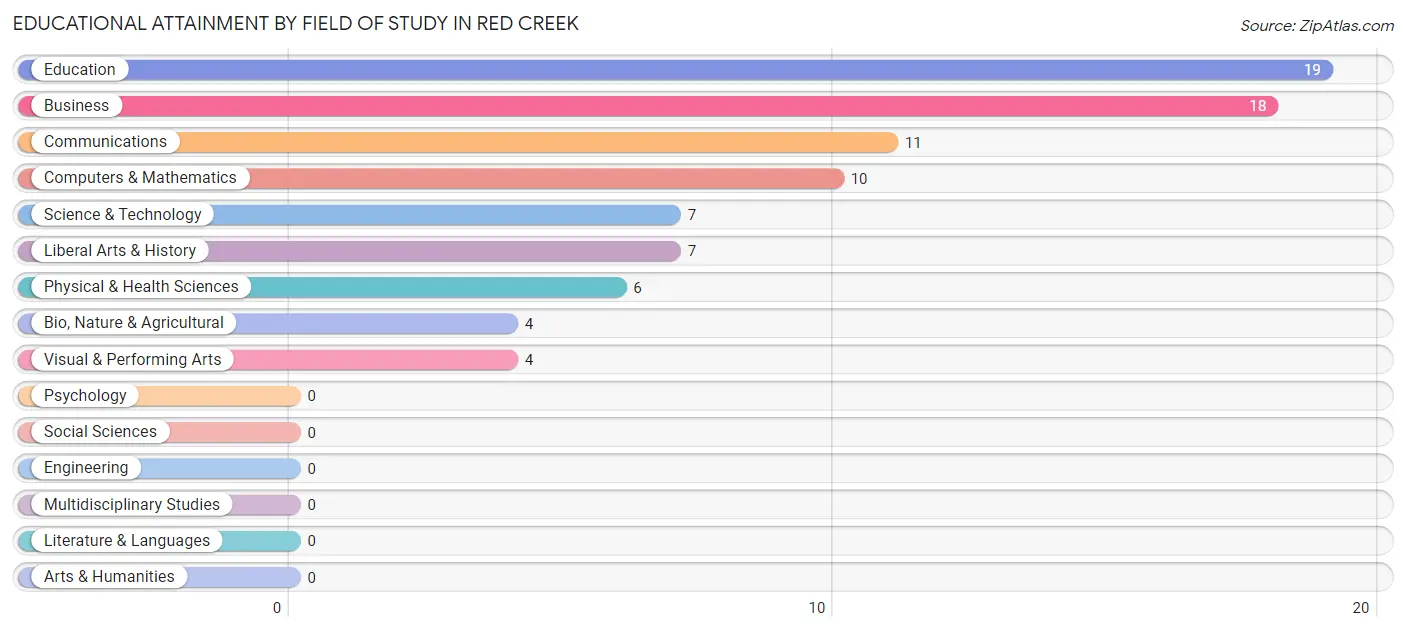
| Field of Study | # Graduates | % Graduates |
| Computers & Mathematics | 10 | 11.6% |
| Bio, Nature & Agricultural | 4 | 4.6% |
| Physical & Health Sciences | 6 | 7.0% |
| Psychology | 0 | 0.0% |
| Social Sciences | 0 | 0.0% |
| Engineering | 0 | 0.0% |
| Multidisciplinary Studies | 0 | 0.0% |
| Science & Technology | 7 | 8.1% |
| Business | 18 | 20.9% |
| Education | 19 | 22.1% |
| Literature & Languages | 0 | 0.0% |
| Liberal Arts & History | 7 | 8.1% |
| Visual & Performing Arts | 4 | 4.6% |
| Communications | 11 | 12.8% |
| Arts & Humanities | 0 | 0.0% |
| Total | 86 | 100.0% |
Transportation & Commute in Red Creek
Vehicle Availability by Sex in Red Creek
The most prevalent vehicle ownership categories in Red Creek are males with 2 vehicles (73, accounting for 61.9%) and females with 2 vehicles (46, making up 47.4%).
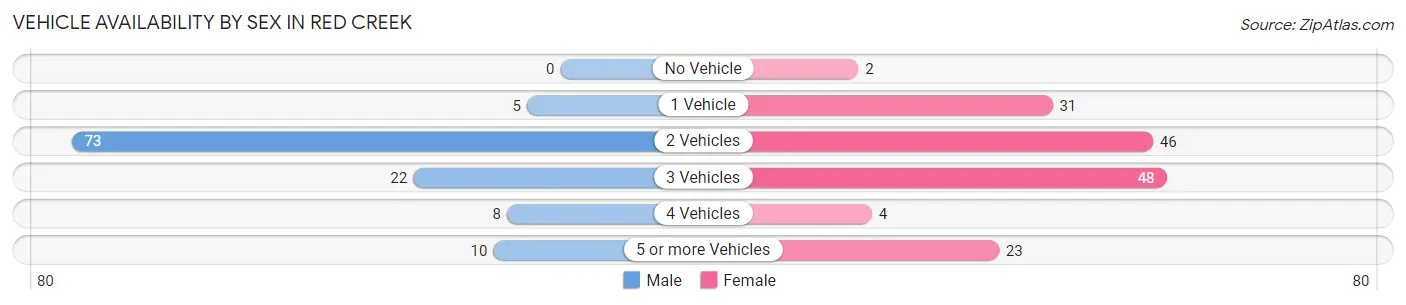
| Vehicles Available | Male | Female |
| No Vehicle | 0 (0.0%) | 2 (1.3%) |
| 1 Vehicle | 5 (4.2%) | 31 (20.1%) |
| 2 Vehicles | 73 (61.9%) | 46 (29.9%) |
| 3 Vehicles | 22 (18.6%) | 48 (31.2%) |
| 4 Vehicles | 8 (6.8%) | 4 (2.6%) |
| 5 or more Vehicles | 10 (8.5%) | 23 (14.9%) |
| Total | 118 (100.0%) | 154 (100.0%) |
Commute Time in Red Creek
The most frequently occuring commute durations in Red Creek are 30 to 34 minutes (42 commuters, 15.6%), 40 to 44 minutes (41 commuters, 15.2%), and 45 to 59 minutes (40 commuters, 14.8%).
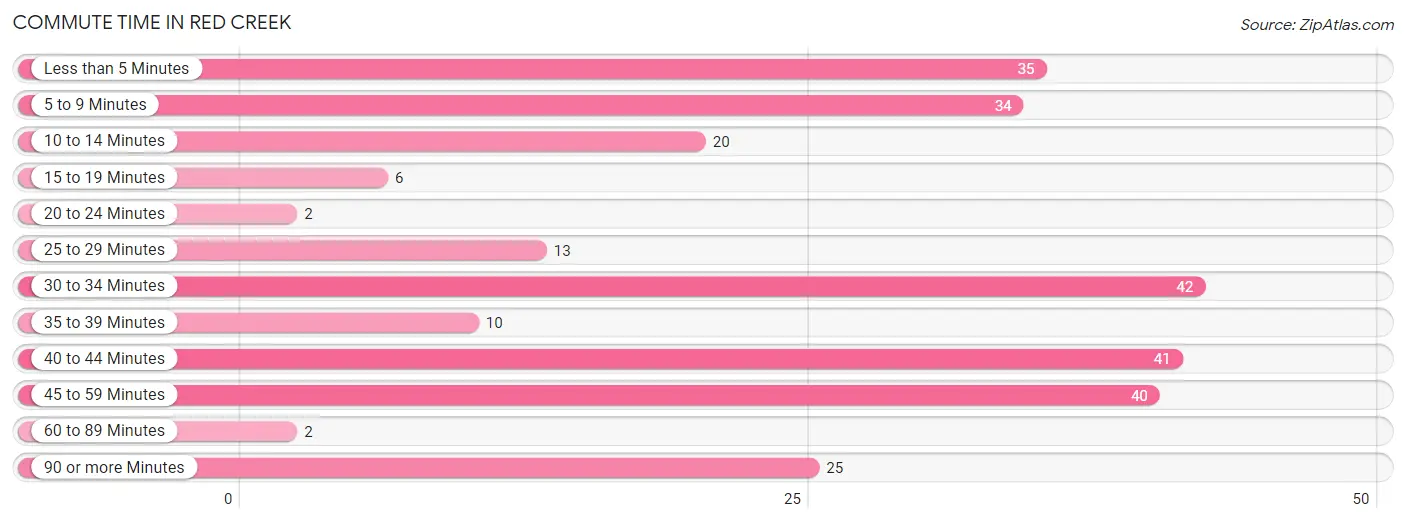
| Commute Time | # Commuters | % Commuters |
| Less than 5 Minutes | 35 | 13.0% |
| 5 to 9 Minutes | 34 | 12.6% |
| 10 to 14 Minutes | 20 | 7.4% |
| 15 to 19 Minutes | 6 | 2.2% |
| 20 to 24 Minutes | 2 | 0.7% |
| 25 to 29 Minutes | 13 | 4.8% |
| 30 to 34 Minutes | 42 | 15.6% |
| 35 to 39 Minutes | 10 | 3.7% |
| 40 to 44 Minutes | 41 | 15.2% |
| 45 to 59 Minutes | 40 | 14.8% |
| 60 to 89 Minutes | 2 | 0.7% |
| 90 or more Minutes | 25 | 9.3% |
Commute Time by Sex in Red Creek
The most common commute times in Red Creek are 40 to 44 minutes (37 commuters, 31.6%) for males and 30 to 34 minutes (30 commuters, 19.6%) for females.
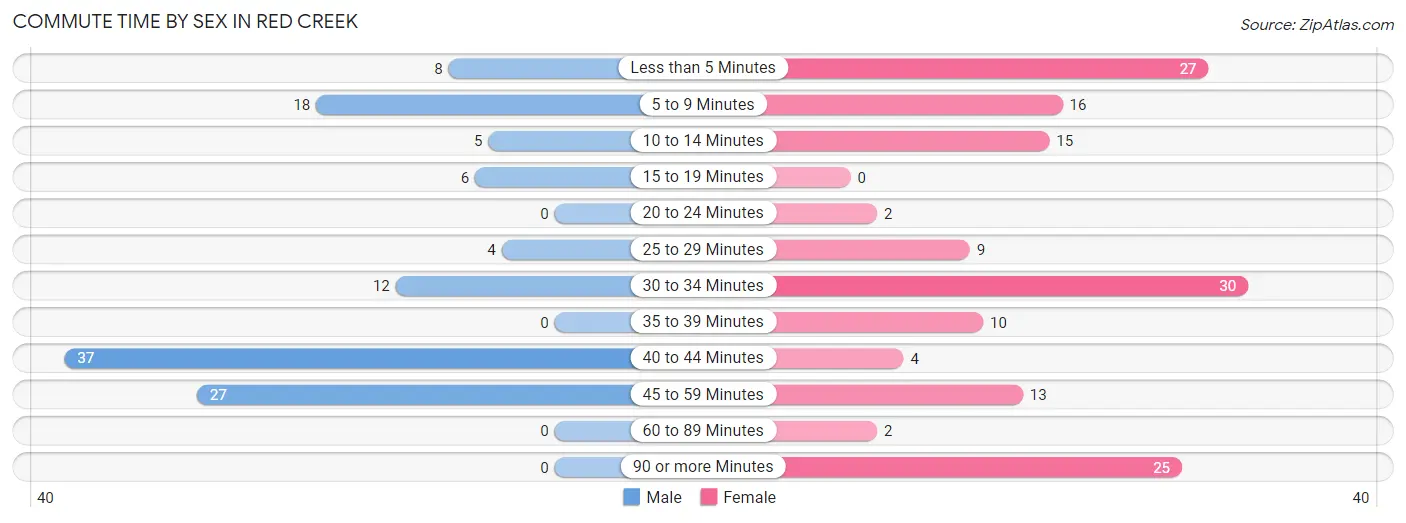
| Commute Time | Male | Female |
| Less than 5 Minutes | 8 (6.8%) | 27 (17.6%) |
| 5 to 9 Minutes | 18 (15.4%) | 16 (10.5%) |
| 10 to 14 Minutes | 5 (4.3%) | 15 (9.8%) |
| 15 to 19 Minutes | 6 (5.1%) | 0 (0.0%) |
| 20 to 24 Minutes | 0 (0.0%) | 2 (1.3%) |
| 25 to 29 Minutes | 4 (3.4%) | 9 (5.9%) |
| 30 to 34 Minutes | 12 (10.3%) | 30 (19.6%) |
| 35 to 39 Minutes | 0 (0.0%) | 10 (6.5%) |
| 40 to 44 Minutes | 37 (31.6%) | 4 (2.6%) |
| 45 to 59 Minutes | 27 (23.1%) | 13 (8.5%) |
| 60 to 89 Minutes | 0 (0.0%) | 2 (1.3%) |
| 90 or more Minutes | 0 (0.0%) | 25 (16.3%) |
Time of Departure to Work by Sex in Red Creek
The most frequent times of departure to work in Red Creek are 5:00 AM to 5:29 AM (38, 32.5%) for males and 5:30 AM to 5:59 AM (37, 24.2%) for females.
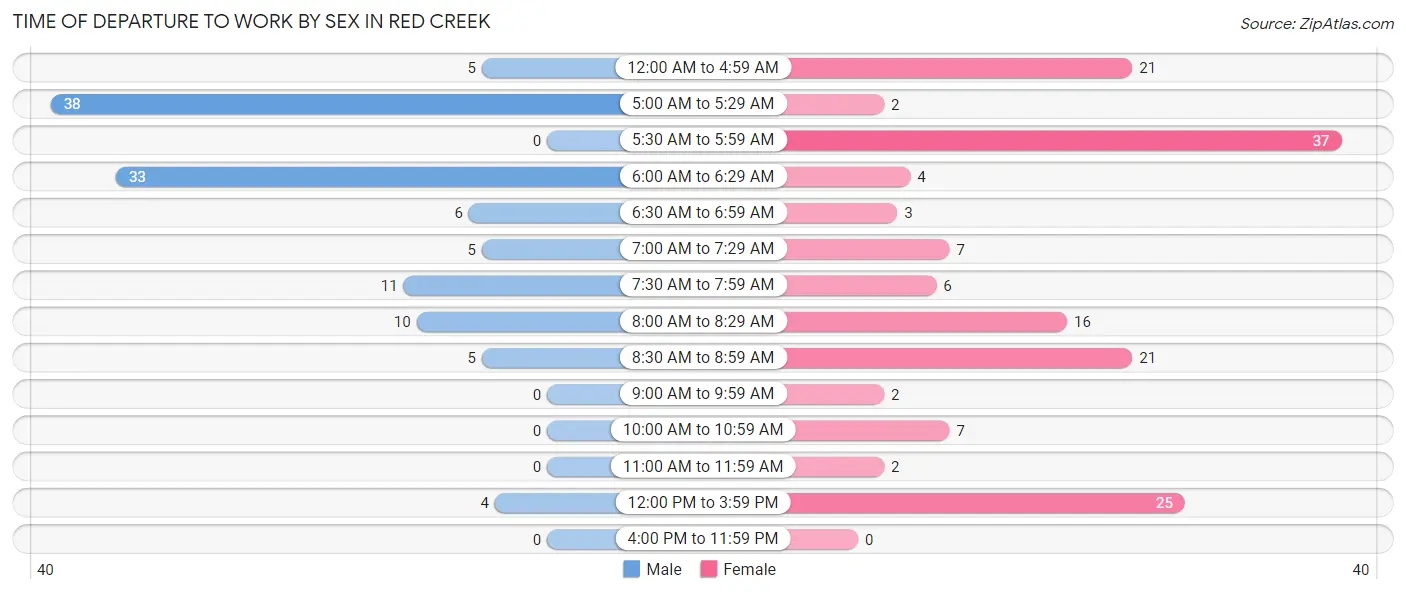
| Time of Departure | Male | Female |
| 12:00 AM to 4:59 AM | 5 (4.3%) | 21 (13.7%) |
| 5:00 AM to 5:29 AM | 38 (32.5%) | 2 (1.3%) |
| 5:30 AM to 5:59 AM | 0 (0.0%) | 37 (24.2%) |
| 6:00 AM to 6:29 AM | 33 (28.2%) | 4 (2.6%) |
| 6:30 AM to 6:59 AM | 6 (5.1%) | 3 (2.0%) |
| 7:00 AM to 7:29 AM | 5 (4.3%) | 7 (4.6%) |
| 7:30 AM to 7:59 AM | 11 (9.4%) | 6 (3.9%) |
| 8:00 AM to 8:29 AM | 10 (8.6%) | 16 (10.5%) |
| 8:30 AM to 8:59 AM | 5 (4.3%) | 21 (13.7%) |
| 9:00 AM to 9:59 AM | 0 (0.0%) | 2 (1.3%) |
| 10:00 AM to 10:59 AM | 0 (0.0%) | 7 (4.6%) |
| 11:00 AM to 11:59 AM | 0 (0.0%) | 2 (1.3%) |
| 12:00 PM to 3:59 PM | 4 (3.4%) | 25 (16.3%) |
| 4:00 PM to 11:59 PM | 0 (0.0%) | 0 (0.0%) |
| Total | 117 (100.0%) | 153 (100.0%) |
Housing Occupancy in Red Creek
Occupancy by Ownership in Red Creek
Of the total 233 dwellings in Red Creek, owner-occupied units account for 168 (72.1%), while renter-occupied units make up 65 (27.9%).
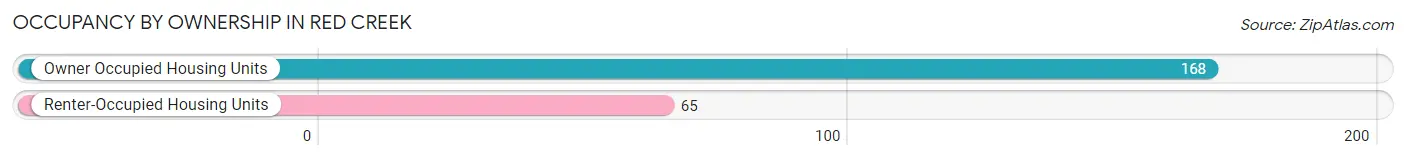
| Occupancy | # Housing Units | % Housing Units |
| Owner Occupied Housing Units | 168 | 72.1% |
| Renter-Occupied Housing Units | 65 | 27.9% |
| Total Occupied Housing Units | 233 | 100.0% |
Occupancy by Household Size in Red Creek
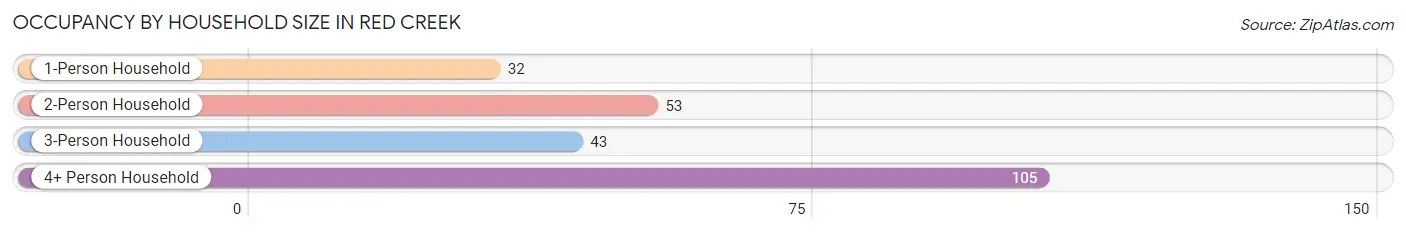
| Household Size | # Housing Units | % Housing Units |
| 1-Person Household | 32 | 13.7% |
| 2-Person Household | 53 | 22.8% |
| 3-Person Household | 43 | 18.4% |
| 4+ Person Household | 105 | 45.1% |
| Total Housing Units | 233 | 100.0% |
Occupancy by Ownership by Household Size in Red Creek
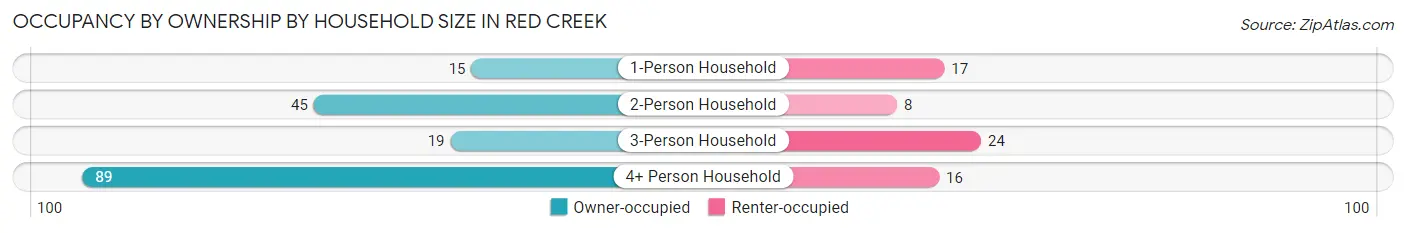
| Household Size | Owner-occupied | Renter-occupied |
| 1-Person Household | 15 (46.9%) | 17 (53.1%) |
| 2-Person Household | 45 (84.9%) | 8 (15.1%) |
| 3-Person Household | 19 (44.2%) | 24 (55.8%) |
| 4+ Person Household | 89 (84.8%) | 16 (15.2%) |
| Total Housing Units | 168 (72.1%) | 65 (27.9%) |
Occupancy by Educational Attainment in Red Creek
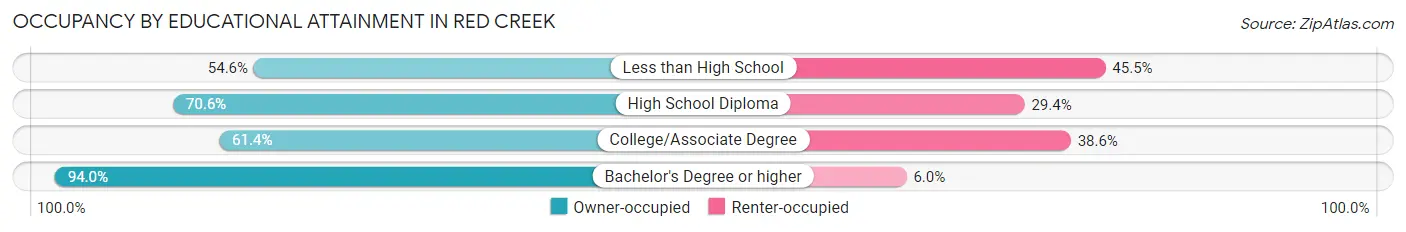
| Household Size | Owner-occupied | Renter-occupied |
| Less than High School | 6 (54.5%) | 5 (45.5%) |
| High School Diploma | 72 (70.6%) | 30 (29.4%) |
| College/Associate Degree | 43 (61.4%) | 27 (38.6%) |
| Bachelor's Degree or higher | 47 (94.0%) | 3 (6.0%) |
Occupancy by Age of Householder in Red Creek
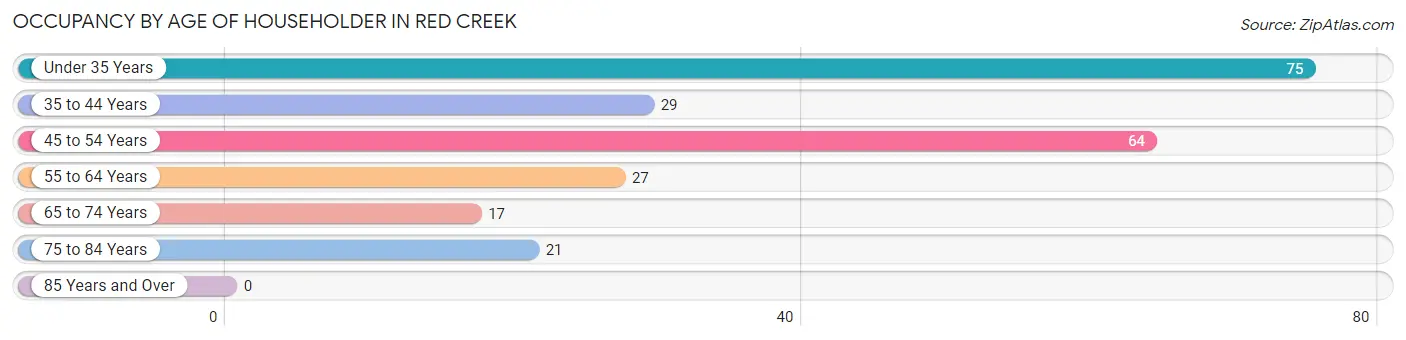
| Age Bracket | # Households | % Households |
| Under 35 Years | 75 | 32.2% |
| 35 to 44 Years | 29 | 12.4% |
| 45 to 54 Years | 64 | 27.5% |
| 55 to 64 Years | 27 | 11.6% |
| 65 to 74 Years | 17 | 7.3% |
| 75 to 84 Years | 21 | 9.0% |
| 85 Years and Over | 0 | 0.0% |
| Total | 233 | 100.0% |
Housing Finances in Red Creek
Median Income by Occupancy in Red Creek
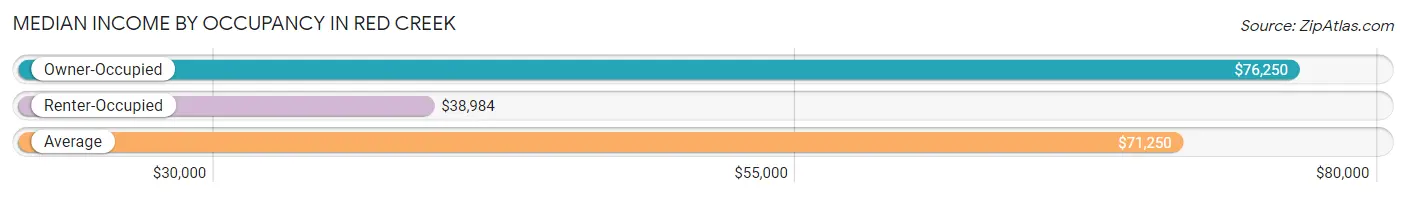
| Occupancy Type | # Households | Median Income |
| Owner-Occupied | 168 (72.1%) | $76,250 |
| Renter-Occupied | 65 (27.9%) | $38,984 |
| Average | 233 (100.0%) | $71,250 |
Occupancy by Householder Income Bracket in Red Creek
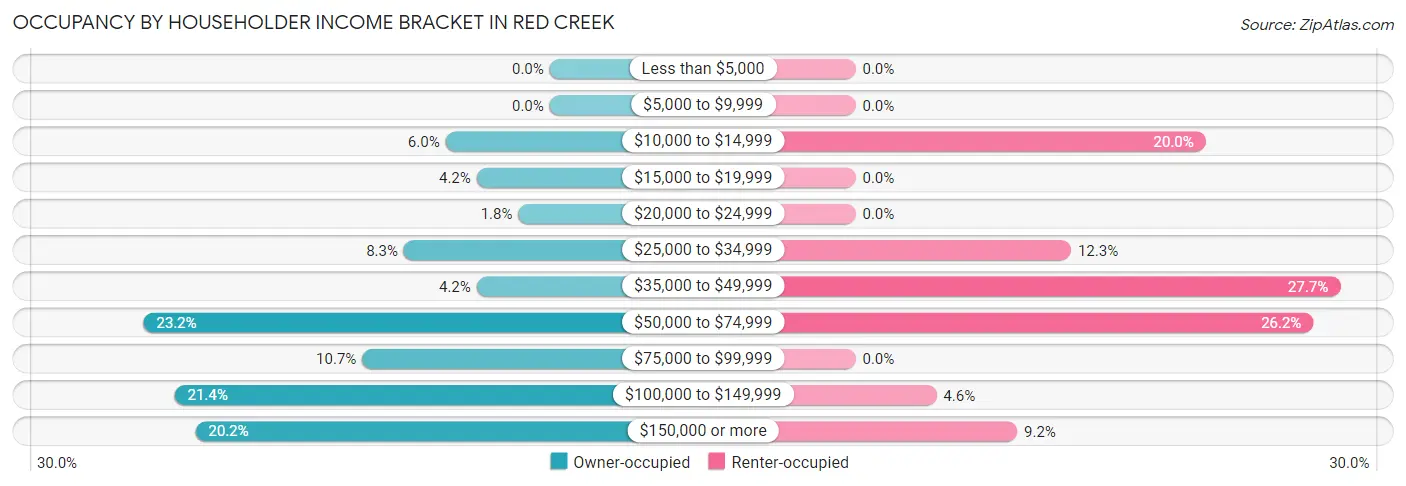
| Income Bracket | Owner-occupied | Renter-occupied |
| Less than $5,000 | 0 (0.0%) | 0 (0.0%) |
| $5,000 to $9,999 | 0 (0.0%) | 0 (0.0%) |
| $10,000 to $14,999 | 10 (5.9%) | 13 (20.0%) |
| $15,000 to $19,999 | 7 (4.2%) | 0 (0.0%) |
| $20,000 to $24,999 | 3 (1.8%) | 0 (0.0%) |
| $25,000 to $34,999 | 14 (8.3%) | 8 (12.3%) |
| $35,000 to $49,999 | 7 (4.2%) | 18 (27.7%) |
| $50,000 to $74,999 | 39 (23.2%) | 17 (26.2%) |
| $75,000 to $99,999 | 18 (10.7%) | 0 (0.0%) |
| $100,000 to $149,999 | 36 (21.4%) | 3 (4.6%) |
| $150,000 or more | 34 (20.2%) | 6 (9.2%) |
| Total | 168 (100.0%) | 65 (100.0%) |
Monthly Housing Cost Tiers in Red Creek
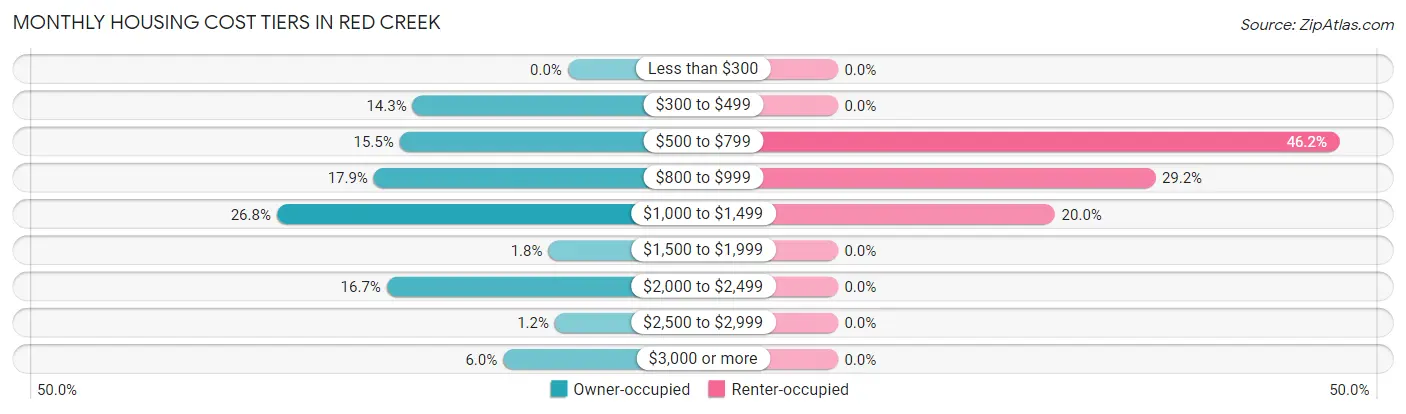
| Monthly Cost | Owner-occupied | Renter-occupied |
| Less than $300 | 0 (0.0%) | 0 (0.0%) |
| $300 to $499 | 24 (14.3%) | 0 (0.0%) |
| $500 to $799 | 26 (15.5%) | 30 (46.2%) |
| $800 to $999 | 30 (17.9%) | 19 (29.2%) |
| $1,000 to $1,499 | 45 (26.8%) | 13 (20.0%) |
| $1,500 to $1,999 | 3 (1.8%) | 0 (0.0%) |
| $2,000 to $2,499 | 28 (16.7%) | 0 (0.0%) |
| $2,500 to $2,999 | 2 (1.2%) | 0 (0.0%) |
| $3,000 or more | 10 (5.9%) | 0 (0.0%) |
| Total | 168 (100.0%) | 65 (100.0%) |
Physical Housing Characteristics in Red Creek
Housing Structures in Red Creek
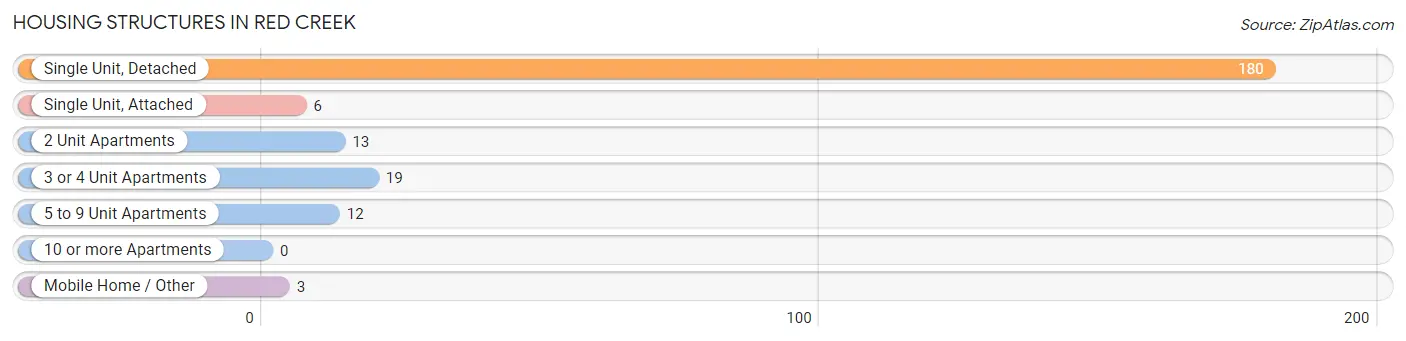
| Structure Type | # Housing Units | % Housing Units |
| Single Unit, Detached | 180 | 77.2% |
| Single Unit, Attached | 6 | 2.6% |
| 2 Unit Apartments | 13 | 5.6% |
| 3 or 4 Unit Apartments | 19 | 8.2% |
| 5 to 9 Unit Apartments | 12 | 5.1% |
| 10 or more Apartments | 0 | 0.0% |
| Mobile Home / Other | 3 | 1.3% |
| Total | 233 | 100.0% |
Housing Structures by Occupancy in Red Creek
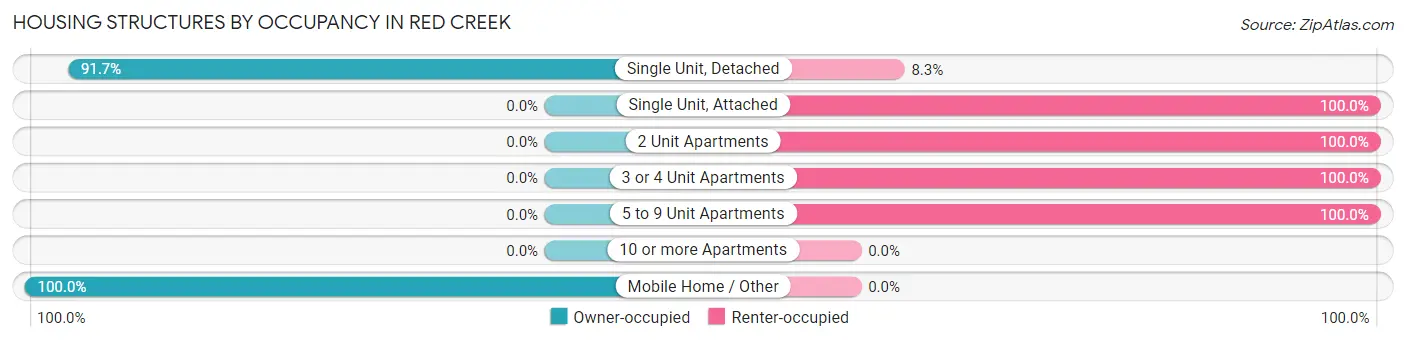
| Structure Type | Owner-occupied | Renter-occupied |
| Single Unit, Detached | 165 (91.7%) | 15 (8.3%) |
| Single Unit, Attached | 0 (0.0%) | 6 (100.0%) |
| 2 Unit Apartments | 0 (0.0%) | 13 (100.0%) |
| 3 or 4 Unit Apartments | 0 (0.0%) | 19 (100.0%) |
| 5 to 9 Unit Apartments | 0 (0.0%) | 12 (100.0%) |
| 10 or more Apartments | 0 (0.0%) | 0 (0.0%) |
| Mobile Home / Other | 3 (100.0%) | 0 (0.0%) |
| Total | 168 (72.1%) | 65 (27.9%) |
Housing Structures by Number of Rooms in Red Creek
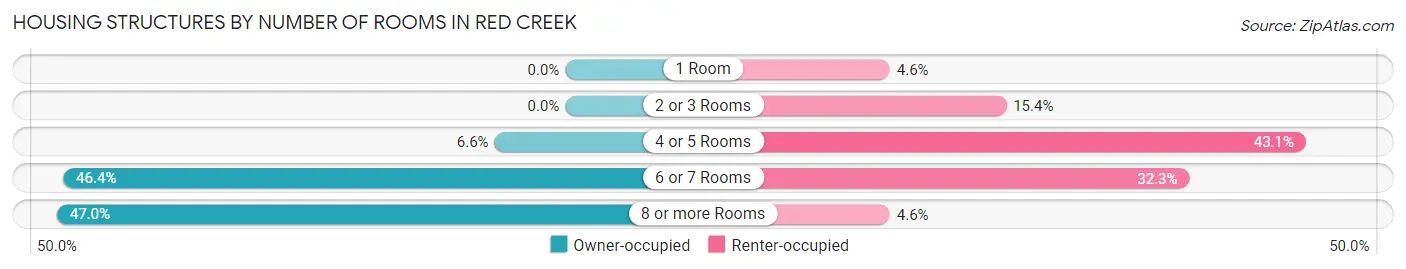
| Number of Rooms | Owner-occupied | Renter-occupied |
| 1 Room | 0 (0.0%) | 3 (4.6%) |
| 2 or 3 Rooms | 0 (0.0%) | 10 (15.4%) |
| 4 or 5 Rooms | 11 (6.6%) | 28 (43.1%) |
| 6 or 7 Rooms | 78 (46.4%) | 21 (32.3%) |
| 8 or more Rooms | 79 (47.0%) | 3 (4.6%) |
| Total | 168 (100.0%) | 65 (100.0%) |
Housing Structure by Heating Type in Red Creek
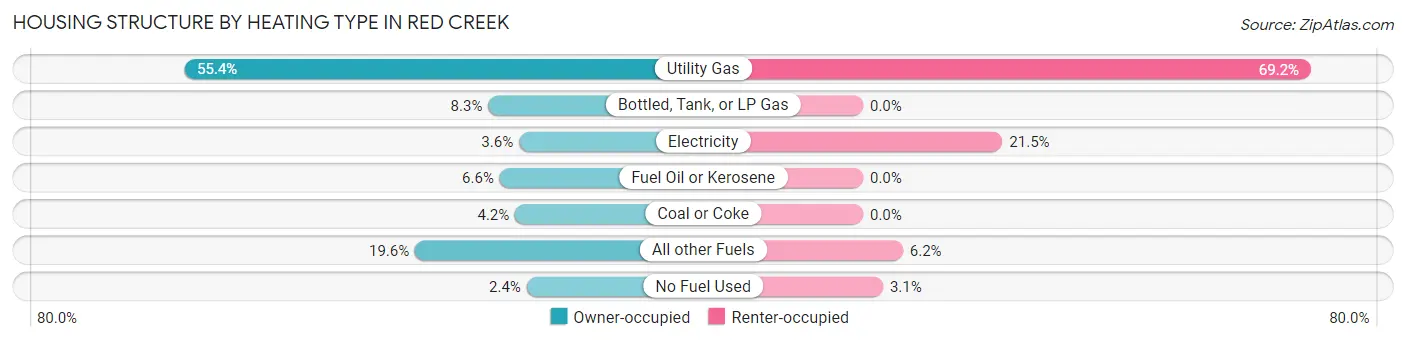
| Heating Type | Owner-occupied | Renter-occupied |
| Utility Gas | 93 (55.4%) | 45 (69.2%) |
| Bottled, Tank, or LP Gas | 14 (8.3%) | 0 (0.0%) |
| Electricity | 6 (3.6%) | 14 (21.5%) |
| Fuel Oil or Kerosene | 11 (6.6%) | 0 (0.0%) |
| Coal or Coke | 7 (4.2%) | 0 (0.0%) |
| All other Fuels | 33 (19.6%) | 4 (6.1%) |
| No Fuel Used | 4 (2.4%) | 2 (3.1%) |
| Total | 168 (100.0%) | 65 (100.0%) |
Household Vehicle Usage in Red Creek
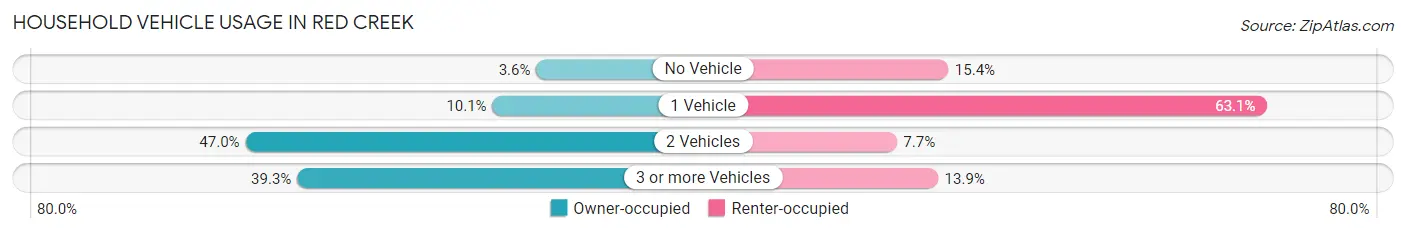
| Vehicles per Household | Owner-occupied | Renter-occupied |
| No Vehicle | 6 (3.6%) | 10 (15.4%) |
| 1 Vehicle | 17 (10.1%) | 41 (63.1%) |
| 2 Vehicles | 79 (47.0%) | 5 (7.7%) |
| 3 or more Vehicles | 66 (39.3%) | 9 (13.9%) |
| Total | 168 (100.0%) | 65 (100.0%) |
Real Estate & Mortgages in Red Creek
Real Estate and Mortgage Overview in Red Creek
| Characteristic | Without Mortgage | With Mortgage |
| Housing Units | 43 | 125 |
| Median Property Value | $95,700 | $124,600 |
| Median Household Income | - | - |
| Monthly Housing Costs | $486 | $10 |
| Real Estate Taxes | $2,727 | $0 |
Property Value by Mortgage Status in Red Creek
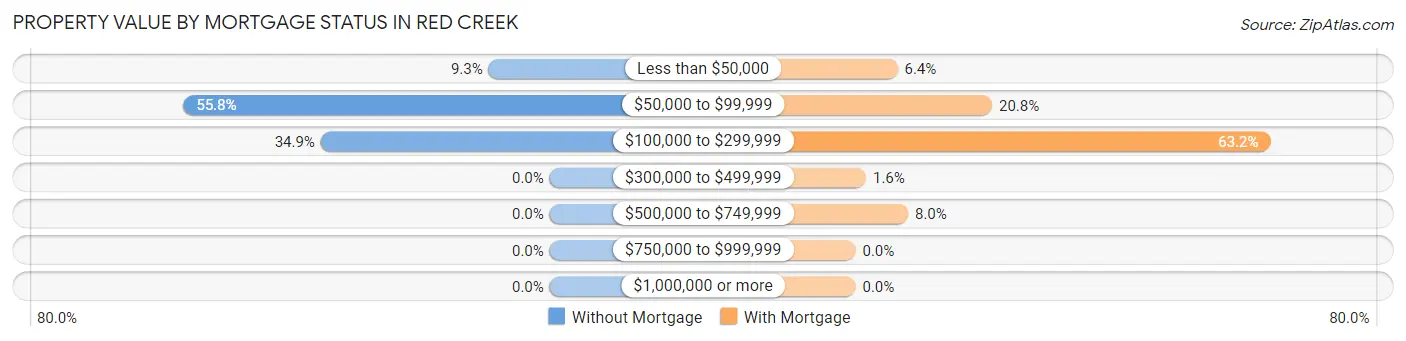
| Property Value | Without Mortgage | With Mortgage |
| Less than $50,000 | 4 (9.3%) | 8 (6.4%) |
| $50,000 to $99,999 | 24 (55.8%) | 26 (20.8%) |
| $100,000 to $299,999 | 15 (34.9%) | 79 (63.2%) |
| $300,000 to $499,999 | 0 (0.0%) | 2 (1.6%) |
| $500,000 to $749,999 | 0 (0.0%) | 10 (8.0%) |
| $750,000 to $999,999 | 0 (0.0%) | 0 (0.0%) |
| $1,000,000 or more | 0 (0.0%) | 0 (0.0%) |
| Total | 43 (100.0%) | 125 (100.0%) |
Household Income by Mortgage Status in Red Creek
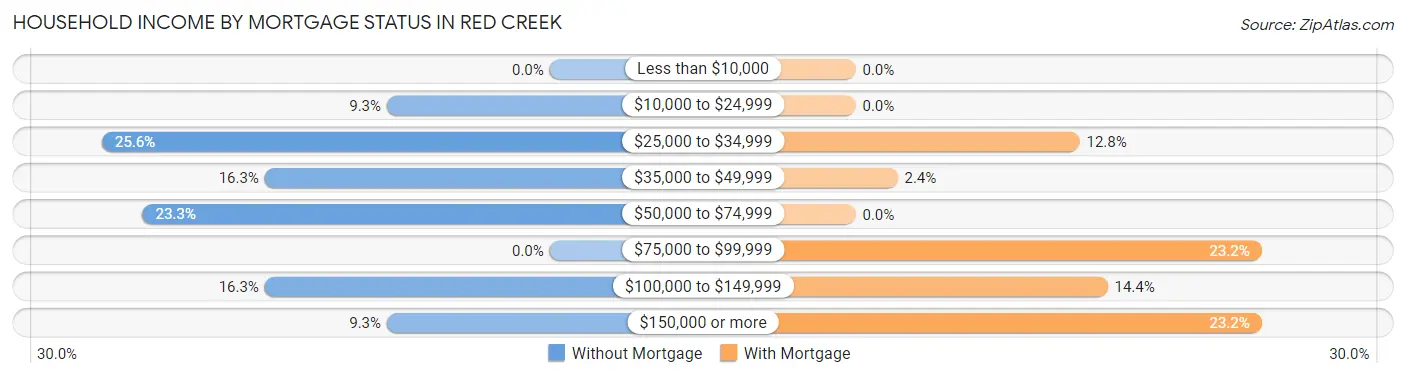
| Household Income | Without Mortgage | With Mortgage |
| Less than $10,000 | 0 (0.0%) | 0 (0.0%) |
| $10,000 to $24,999 | 4 (9.3%) | 0 (0.0%) |
| $25,000 to $34,999 | 11 (25.6%) | 16 (12.8%) |
| $35,000 to $49,999 | 7 (16.3%) | 3 (2.4%) |
| $50,000 to $74,999 | 10 (23.3%) | 0 (0.0%) |
| $75,000 to $99,999 | 0 (0.0%) | 29 (23.2%) |
| $100,000 to $149,999 | 7 (16.3%) | 18 (14.4%) |
| $150,000 or more | 4 (9.3%) | 29 (23.2%) |
| Total | 43 (100.0%) | 125 (100.0%) |
Property Value to Household Income Ratio in Red Creek
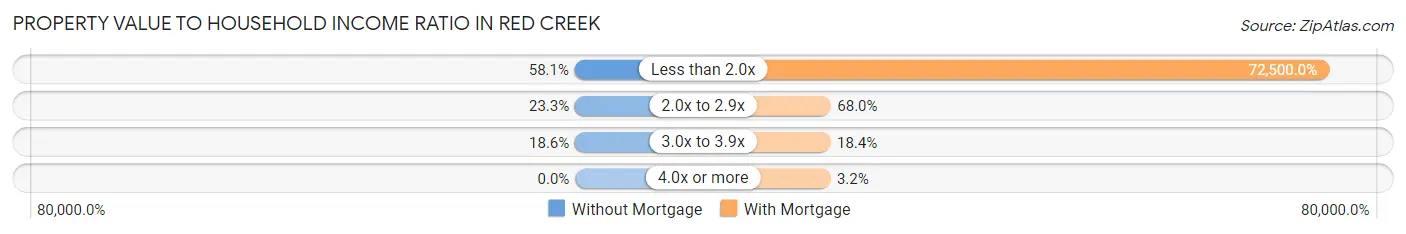
| Value-to-Income Ratio | Without Mortgage | With Mortgage |
| Less than 2.0x | 25 (58.1%) | 90,625 (72,500.0%) |
| 2.0x to 2.9x | 10 (23.3%) | 85 (68.0%) |
| 3.0x to 3.9x | 8 (18.6%) | 23 (18.4%) |
| 4.0x or more | 0 (0.0%) | 4 (3.2%) |
| Total | 43 (100.0%) | 125 (100.0%) |
Real Estate Taxes by Mortgage Status in Red Creek
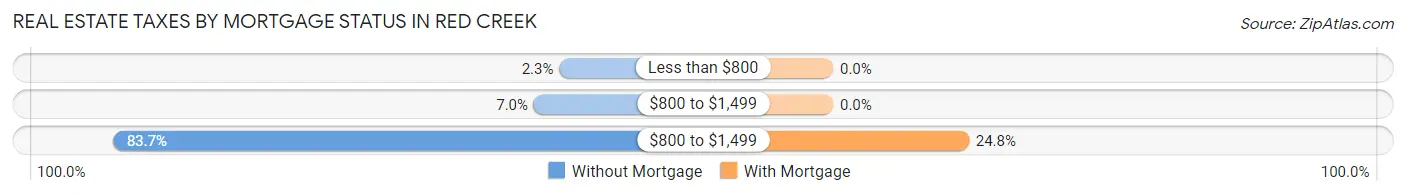
| Property Taxes | Without Mortgage | With Mortgage |
| Less than $800 | 1 (2.3%) | 0 (0.0%) |
| $800 to $1,499 | 3 (7.0%) | 0 (0.0%) |
| $800 to $1,499 | 36 (83.7%) | 31 (24.8%) |
| Total | 43 (100.0%) | 125 (100.0%) |
Health & Disability in Red Creek
Health Insurance Coverage by Age in Red Creek
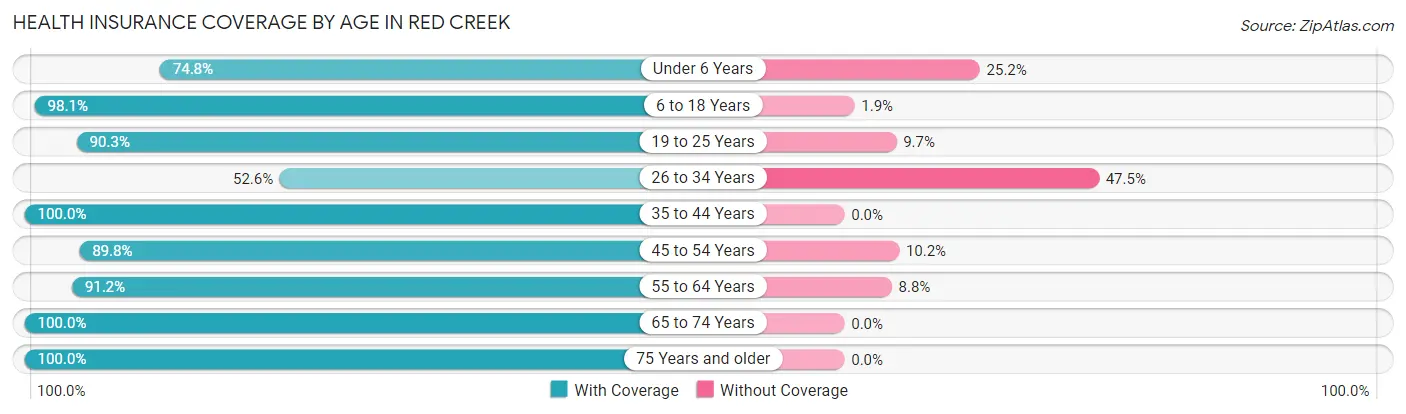
| Age Bracket | With Coverage | Without Coverage |
| Under 6 Years | 83 (74.8%) | 28 (25.2%) |
| 6 to 18 Years | 157 (98.1%) | 3 (1.9%) |
| 19 to 25 Years | 56 (90.3%) | 6 (9.7%) |
| 26 to 34 Years | 72 (52.5%) | 65 (47.4%) |
| 35 to 44 Years | 65 (100.0%) | 0 (0.0%) |
| 45 to 54 Years | 97 (89.8%) | 11 (10.2%) |
| 55 to 64 Years | 31 (91.2%) | 3 (8.8%) |
| 65 to 74 Years | 27 (100.0%) | 0 (0.0%) |
| 75 Years and older | 42 (100.0%) | 0 (0.0%) |
| Total | 630 (84.5%) | 116 (15.5%) |
Health Insurance Coverage by Citizenship Status in Red Creek
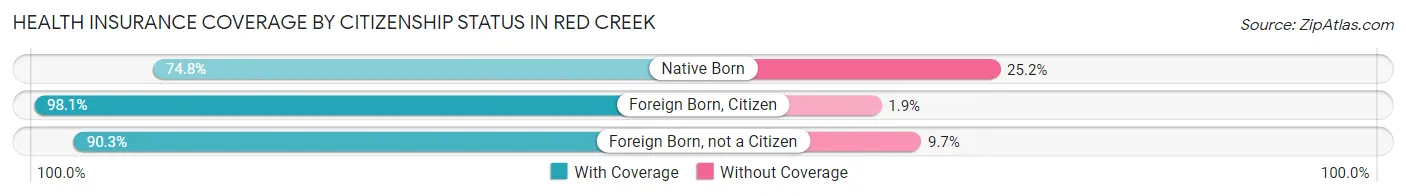
| Citizenship Status | With Coverage | Without Coverage |
| Native Born | 83 (74.8%) | 28 (25.2%) |
| Foreign Born, Citizen | 157 (98.1%) | 3 (1.9%) |
| Foreign Born, not a Citizen | 56 (90.3%) | 6 (9.7%) |
Health Insurance Coverage by Household Income in Red Creek
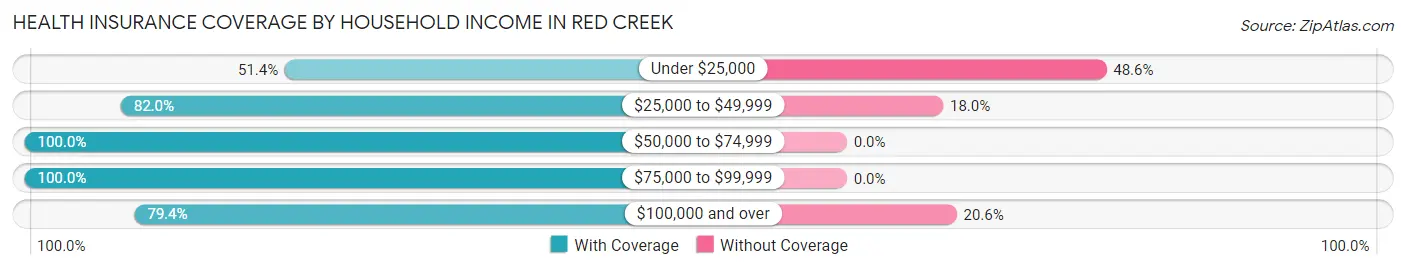
| Household Income | With Coverage | Without Coverage |
| Under $25,000 | 37 (51.4%) | 35 (48.6%) |
| $25,000 to $49,999 | 100 (82.0%) | 22 (18.0%) |
| $50,000 to $74,999 | 210 (100.0%) | 0 (0.0%) |
| $75,000 to $99,999 | 55 (100.0%) | 0 (0.0%) |
| $100,000 and over | 228 (79.4%) | 59 (20.6%) |
Public vs Private Health Insurance Coverage by Age in Red Creek
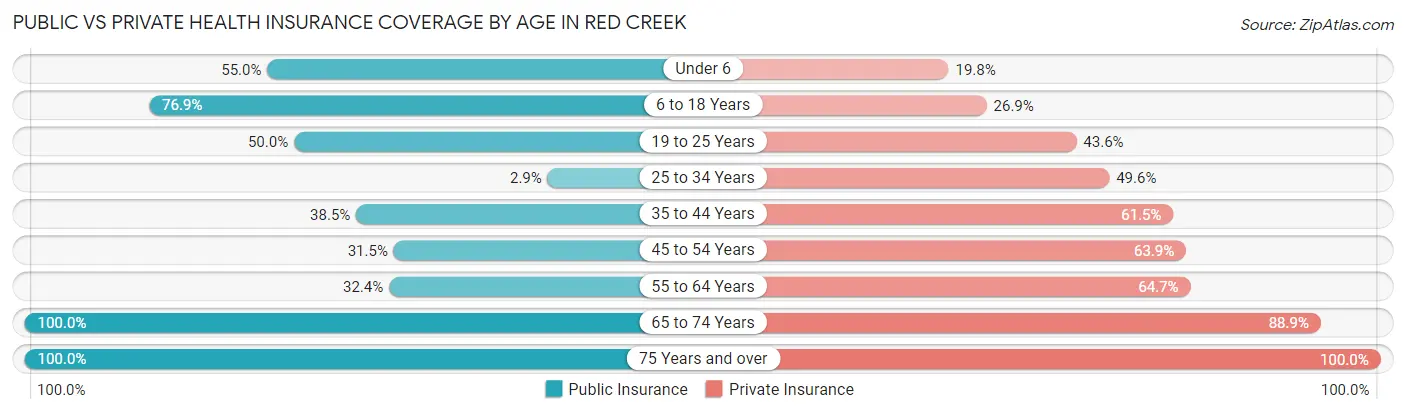
| Age Bracket | Public Insurance | Private Insurance |
| Under 6 | 61 (54.9%) | 22 (19.8%) |
| 6 to 18 Years | 123 (76.9%) | 43 (26.9%) |
| 19 to 25 Years | 31 (50.0%) | 27 (43.5%) |
| 25 to 34 Years | 4 (2.9%) | 68 (49.6%) |
| 35 to 44 Years | 25 (38.5%) | 40 (61.5%) |
| 45 to 54 Years | 34 (31.5%) | 69 (63.9%) |
| 55 to 64 Years | 11 (32.4%) | 22 (64.7%) |
| 65 to 74 Years | 27 (100.0%) | 24 (88.9%) |
| 75 Years and over | 42 (100.0%) | 42 (100.0%) |
| Total | 358 (48.0%) | 357 (47.9%) |
Disability Status by Sex by Age in Red Creek
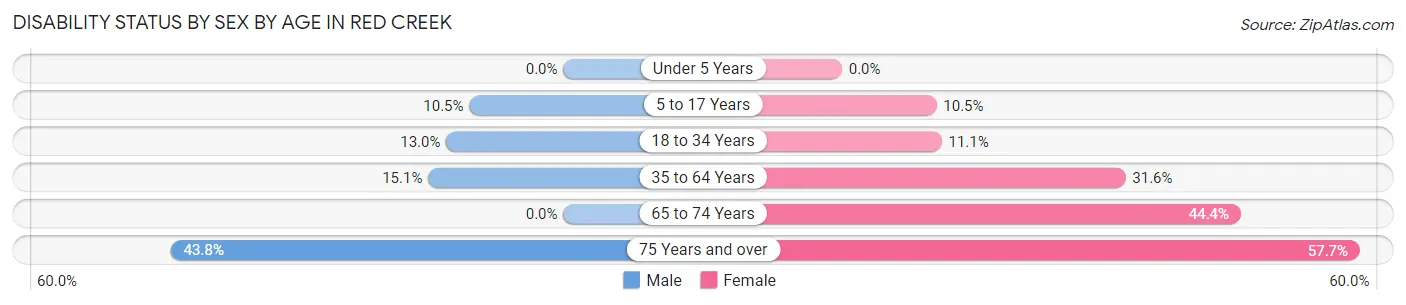
| Age Bracket | Male | Female |
| Under 5 Years | 0 (0.0%) | 0 (0.0%) |
| 5 to 17 Years | 9 (10.5%) | 8 (10.5%) |
| 18 to 34 Years | 9 (13.0%) | 15 (11.1%) |
| 35 to 64 Years | 14 (15.0%) | 36 (31.6%) |
| 65 to 74 Years | 0 (0.0%) | 8 (44.4%) |
| 75 Years and over | 7 (43.8%) | 15 (57.7%) |
Disability Class by Sex by Age in Red Creek
Disability Class: Hearing Difficulty
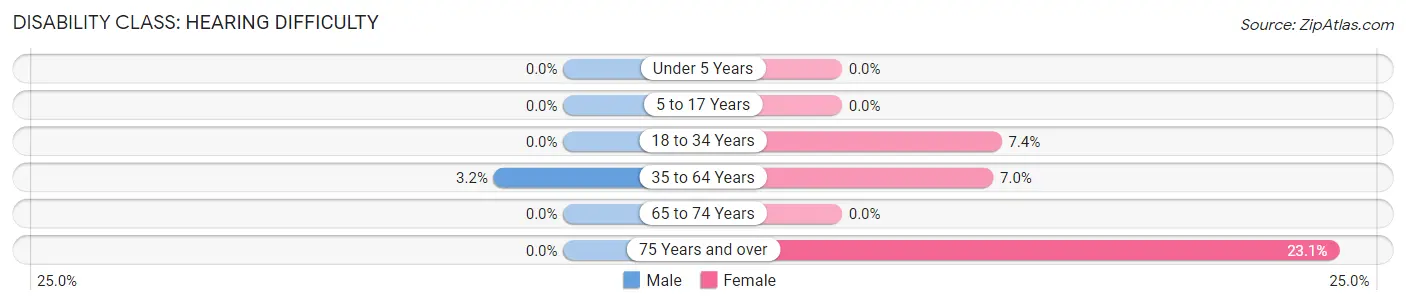
| Age Bracket | Male | Female |
| Under 5 Years | 0 (0.0%) | 0 (0.0%) |
| 5 to 17 Years | 0 (0.0%) | 0 (0.0%) |
| 18 to 34 Years | 0 (0.0%) | 10 (7.4%) |
| 35 to 64 Years | 3 (3.2%) | 8 (7.0%) |
| 65 to 74 Years | 0 (0.0%) | 0 (0.0%) |
| 75 Years and over | 0 (0.0%) | 6 (23.1%) |
Disability Class: Vision Difficulty
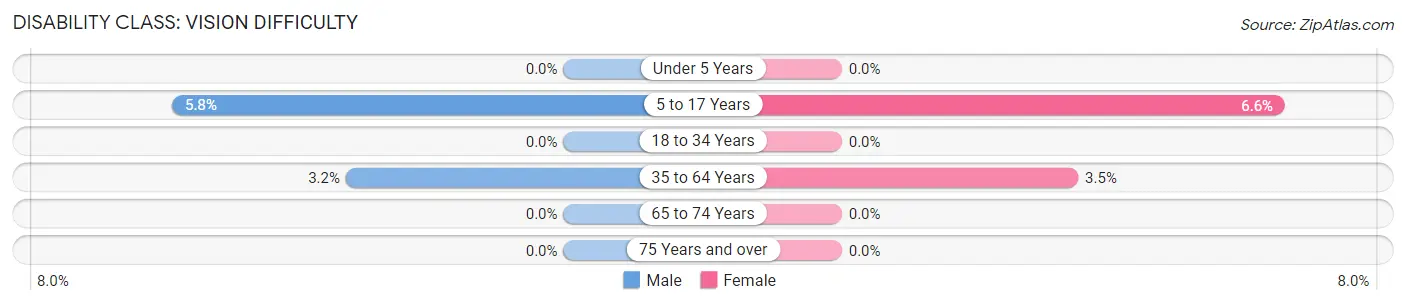
| Age Bracket | Male | Female |
| Under 5 Years | 0 (0.0%) | 0 (0.0%) |
| 5 to 17 Years | 5 (5.8%) | 5 (6.6%) |
| 18 to 34 Years | 0 (0.0%) | 0 (0.0%) |
| 35 to 64 Years | 3 (3.2%) | 4 (3.5%) |
| 65 to 74 Years | 0 (0.0%) | 0 (0.0%) |
| 75 Years and over | 0 (0.0%) | 0 (0.0%) |
Disability Class: Cognitive Difficulty
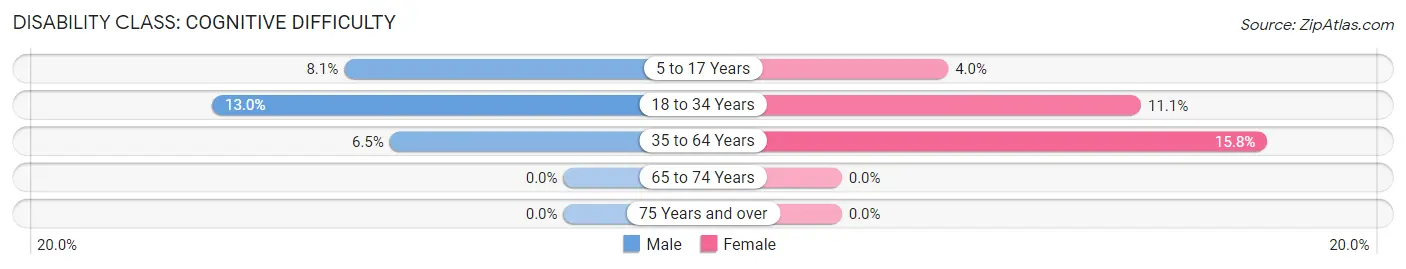
| Age Bracket | Male | Female |
| 5 to 17 Years | 7 (8.1%) | 3 (4.0%) |
| 18 to 34 Years | 9 (13.0%) | 15 (11.1%) |
| 35 to 64 Years | 6 (6.5%) | 18 (15.8%) |
| 65 to 74 Years | 0 (0.0%) | 0 (0.0%) |
| 75 Years and over | 0 (0.0%) | 0 (0.0%) |
Disability Class: Ambulatory Difficulty
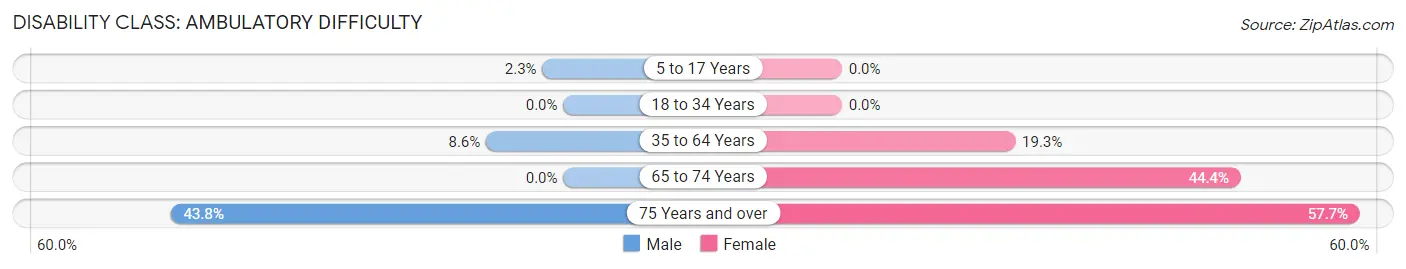
| Age Bracket | Male | Female |
| 5 to 17 Years | 2 (2.3%) | 0 (0.0%) |
| 18 to 34 Years | 0 (0.0%) | 0 (0.0%) |
| 35 to 64 Years | 8 (8.6%) | 22 (19.3%) |
| 65 to 74 Years | 0 (0.0%) | 8 (44.4%) |
| 75 Years and over | 7 (43.8%) | 15 (57.7%) |
Disability Class: Self-Care Difficulty
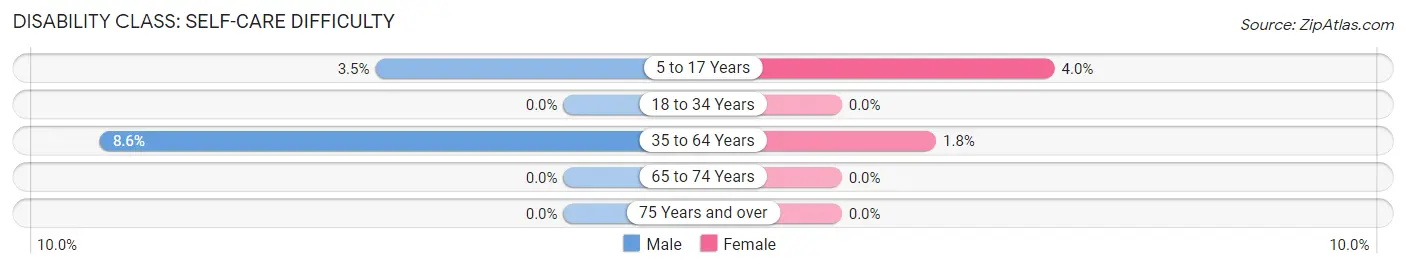
| Age Bracket | Male | Female |
| 5 to 17 Years | 3 (3.5%) | 3 (4.0%) |
| 18 to 34 Years | 0 (0.0%) | 0 (0.0%) |
| 35 to 64 Years | 8 (8.6%) | 2 (1.8%) |
| 65 to 74 Years | 0 (0.0%) | 0 (0.0%) |
| 75 Years and over | 0 (0.0%) | 0 (0.0%) |
Technology Access in Red Creek
Computing Device Access in Red Creek
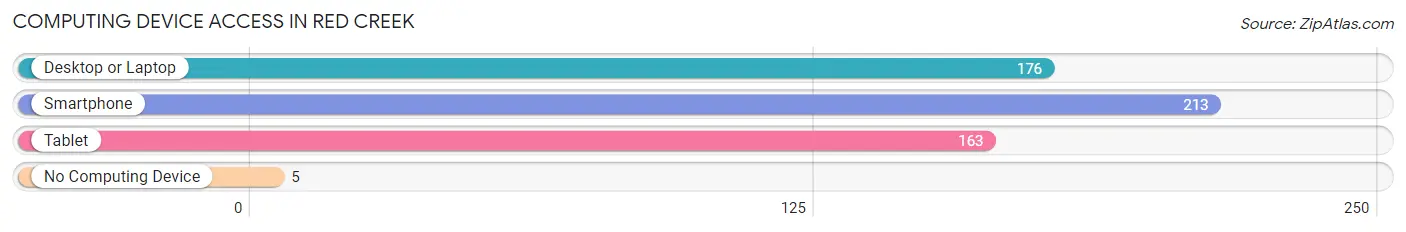
| Device Type | # Households | % Households |
| Desktop or Laptop | 176 | 75.5% |
| Smartphone | 213 | 91.4% |
| Tablet | 163 | 70.0% |
| No Computing Device | 5 | 2.1% |
| Total | 233 | 100.0% |
Internet Access in Red Creek
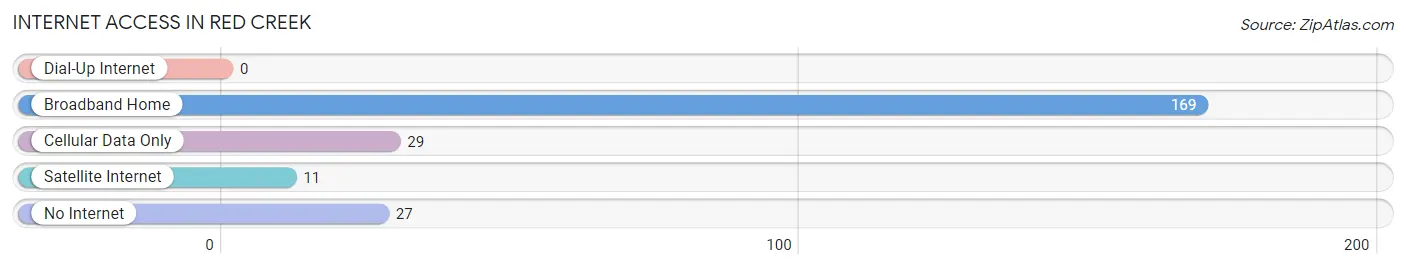
| Internet Type | # Households | % Households |
| Dial-Up Internet | 0 | 0.0% |
| Broadband Home | 169 | 72.5% |
| Cellular Data Only | 29 | 12.4% |
| Satellite Internet | 11 | 4.7% |
| No Internet | 27 | 11.6% |
| Total | 233 | 100.0% |
Red Creek Summary
Red Creek is a small village located in the town of Wolcott in Wayne County, New York. It is situated on the banks of Red Creek, a tributary of the Clyde River. The village is located approximately 20 miles east of Rochester and is part of the Finger Lakes region.
History
The area that is now Red Creek was first settled in the early 1800s by a group of settlers from Connecticut. The village was originally known as “Red Creek Settlement” and was incorporated in 1848. The village was named after the creek that runs through it, which was named for its reddish-brown color.
The village was an important stop on the Underground Railroad, with many of the local residents helping to hide and transport escaped slaves. The village was also home to a number of mills, including a grist mill, a saw mill, and a woolen mill.
Geography
Red Creek is located in the Finger Lakes region of New York, approximately 20 miles east of Rochester. The village is situated on the banks of Red Creek, a tributary of the Clyde River. The village is surrounded by rolling hills and farmland, with the nearest major city being Syracuse, which is about 40 miles away.
The climate in Red Creek is generally mild, with cold winters and warm summers. The average annual temperature is around 50 degrees Fahrenheit, with an average annual precipitation of around 40 inches.
Economy
The economy of Red Creek is largely based on agriculture and tourism. The village is home to a number of farms, which produce a variety of crops, including corn, soybeans, and hay. The village is also home to a number of wineries, which produce a variety of wines.
The village is also home to a number of small businesses, including restaurants, shops, and other services. The village is also home to a number of bed and breakfasts, which attract tourists from all over the world.
Demographics
As of the 2010 census, the population of Red Creek was 1,093. The racial makeup of the village was 97.3% White, 0.7% African American, 0.2% Native American, 0.2% Asian, and 1.6% from other races. The median household income was $41,250, and the median family income was $50,000.
Conclusion
Red Creek is a small village located in the Finger Lakes region of New York. It is situated on the banks of Red Creek, a tributary of the Clyde River. The village was first settled in the early 1800s and was an important stop on the Underground Railroad. The economy of Red Creek is largely based on agriculture and tourism, and the village is home to a number of small businesses. As of the 2010 census, the population of Red Creek was 1,093.
Common Questions
What is Per Capita Income in Red Creek?
Per Capita income in Red Creek is $35,735.
What is the Median Family Income in Red Creek?
Median Family Income in Red Creek is $72,727.
What is the Median Household income in Red Creek?
Median Household Income in Red Creek is $71,250.
What is Income or Wage Gap in Red Creek?
Income or Wage Gap in Red Creek is 58.6%.
Women in Red Creek earn 41.4 cents for every dollar earned by a man.
What is Inequality or Gini Index in Red Creek?
Inequality or Gini Index in Red Creek is 0.55.
What is the Total Population of Red Creek?
Total Population of Red Creek is 746.
What is the Total Male Population of Red Creek?
Total Male Population of Red Creek is 331.
What is the Total Female Population of Red Creek?
Total Female Population of Red Creek is 415.
What is the Ratio of Males per 100 Females in Red Creek?
There are 79.76 Males per 100 Females in Red Creek.
What is the Ratio of Females per 100 Males in Red Creek?
There are 125.38 Females per 100 Males in Red Creek.
What is the Median Population Age in Red Creek?
Median Population Age in Red Creek is 27.9 Years.
What is the Average Family Size in Red Creek
Average Family Size in Red Creek is 3.0 People.
What is the Average Household Size in Red Creek
Average Household Size in Red Creek is 3.2 People.
How Large is the Labor Force in Red Creek?
There are 300 People in the Labor Forcein in Red Creek.
What is the Percentage of People in the Labor Force in Red Creek?
61.2% of People are in the Labor Force in Red Creek.
What is the Unemployment Rate in Red Creek?
Unemployment Rate in Red Creek is 5.7%.