Rapids, NY Map & Demographics
Rapids Map
Rapids Overview
$49,379
PER CAPITA INCOME
$119,115
AVG FAMILY INCOME
$106,739
AVG HOUSEHOLD INCOME
60.0%
WAGE / INCOME GAP [ % ]
40.0¢/ $1
WAGE / INCOME GAP [ $ ]
0.44
INEQUALITY / GINI INDEX
1,380
TOTAL POPULATION
675
MALE POPULATION
705
FEMALE POPULATION
95.74
MALES / 100 FEMALES
104.44
FEMALES / 100 MALES
40.3
MEDIAN AGE
3.0
AVG FAMILY SIZE
2.7
AVG HOUSEHOLD SIZE
604
LABOR FORCE [ PEOPLE ]
56.1%
PERCENT IN LABOR FORCE
6.1%
UNEMPLOYMENT RATE
Income in Rapids
Income Overview in Rapids
Per Capita Income in Rapids is $49,379, while median incomes of families and households are $119,115 and $106,739 respectively.
| Characteristic | Number | Measure |
| Per Capita Income | 1,380 | $49,379 |
| Median Family Income | 389 | $119,115 |
| Mean Family Income | 389 | $154,601 |
| Median Household Income | 518 | $106,739 |
| Mean Household Income | 518 | $131,226 |
| Income Deficit | 389 | $0 |
| Wage / Income Gap (%) | 1,380 | 60.01% |
| Wage / Income Gap ($) | 1,380 | 39.99¢ per $1 |
| Gini / Inequality Index | 1,380 | 0.44 |
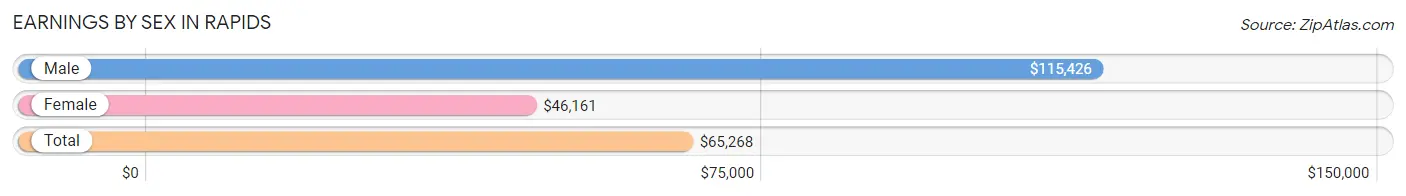
Earnings by Sex in Rapids
Average Earnings in Rapids are $65,268, $115,426 for men and $46,161 for women, a difference of 60.0%.
| Sex | Number | Average Earnings |
| Male | 362 (55.0%) | $115,426 |
| Female | 296 (45.0%) | $46,161 |
| Total | 658 (100.0%) | $65,268 |
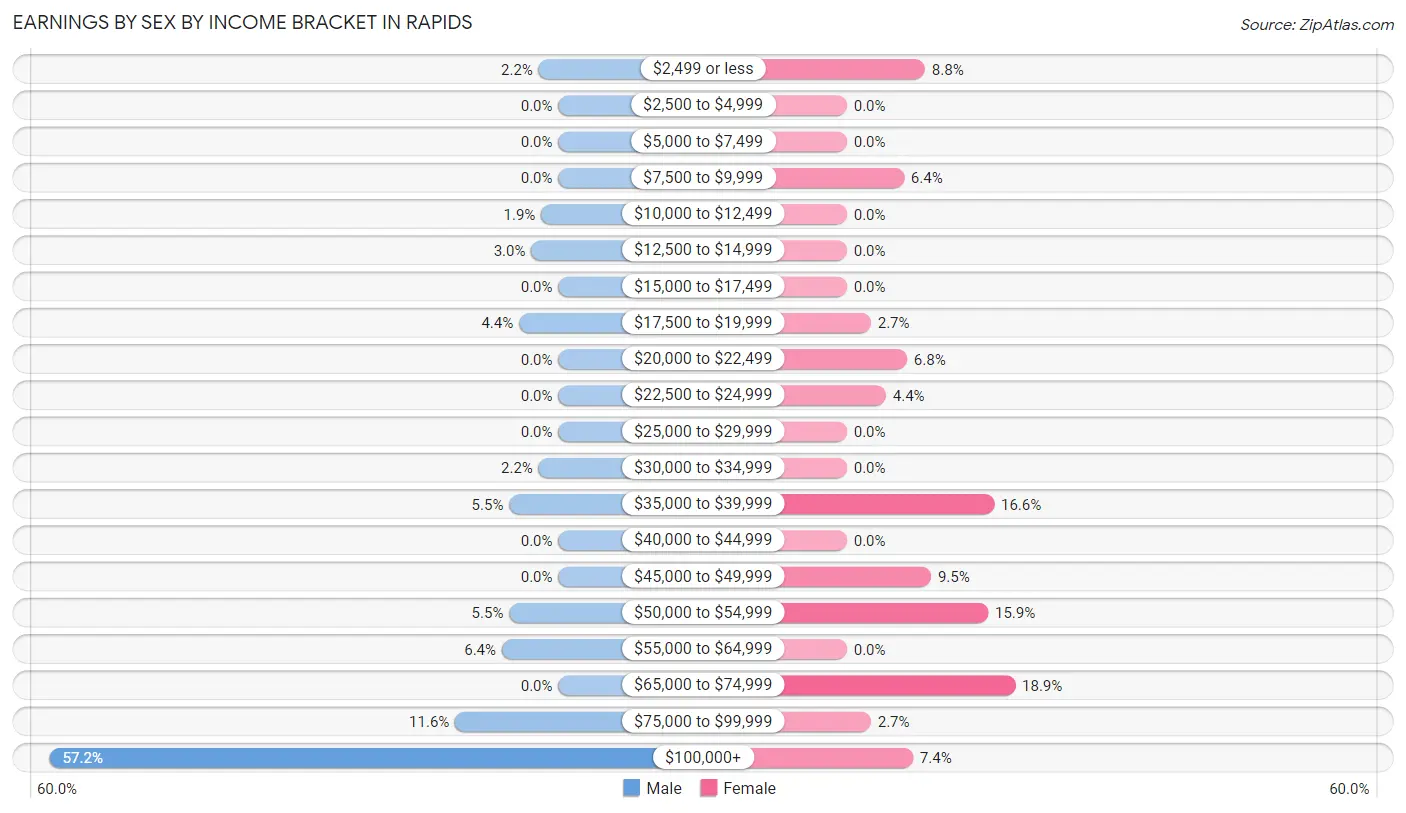
Earnings by Sex by Income Bracket in Rapids
The most common earnings brackets in Rapids are $100,000+ for men (207 | 57.2%) and $65,000 to $74,999 for women (56 | 18.9%).
| Income | Male | Female |
| $2,499 or less | 8 (2.2%) | 26 (8.8%) |
| $2,500 to $4,999 | 0 (0.0%) | 0 (0.0%) |
| $5,000 to $7,499 | 0 (0.0%) | 0 (0.0%) |
| $7,500 to $9,999 | 0 (0.0%) | 19 (6.4%) |
| $10,000 to $12,499 | 7 (1.9%) | 0 (0.0%) |
| $12,500 to $14,999 | 11 (3.0%) | 0 (0.0%) |
| $15,000 to $17,499 | 0 (0.0%) | 0 (0.0%) |
| $17,500 to $19,999 | 16 (4.4%) | 8 (2.7%) |
| $20,000 to $22,499 | 0 (0.0%) | 20 (6.8%) |
| $22,500 to $24,999 | 0 (0.0%) | 13 (4.4%) |
| $25,000 to $29,999 | 0 (0.0%) | 0 (0.0%) |
| $30,000 to $34,999 | 8 (2.2%) | 0 (0.0%) |
| $35,000 to $39,999 | 20 (5.5%) | 49 (16.6%) |
| $40,000 to $44,999 | 0 (0.0%) | 0 (0.0%) |
| $45,000 to $49,999 | 0 (0.0%) | 28 (9.5%) |
| $50,000 to $54,999 | 20 (5.5%) | 47 (15.9%) |
| $55,000 to $64,999 | 23 (6.4%) | 0 (0.0%) |
| $65,000 to $74,999 | 0 (0.0%) | 56 (18.9%) |
| $75,000 to $99,999 | 42 (11.6%) | 8 (2.7%) |
| $100,000+ | 207 (57.2%) | 22 (7.4%) |
| Total | 362 (100.0%) | 296 (100.0%) |
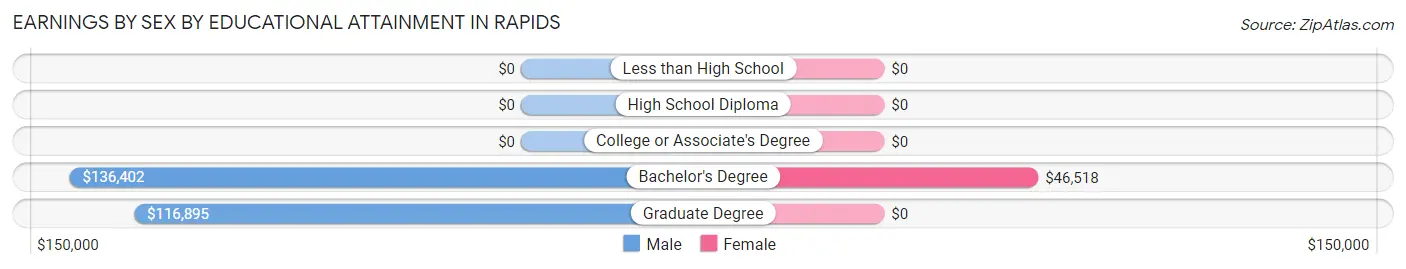
Earnings by Sex by Educational Attainment in Rapids
Average earnings in Rapids are $116,090 for men and $46,652 for women, a difference of 59.8%. Men with an educational attainment of bachelor's degree enjoy the highest average annual earnings of $136,402, while those with graduate degree education earn the least with $116,895. Women with an educational attainment of bachelor's degree earn the most with the average annual earnings of $46,518, while those with bachelor's degree education have the smallest earnings of $46,518.
| Educational Attainment | Male Income | Female Income |
| Less than High School | - | - |
| High School Diploma | - | - |
| College or Associate's Degree | - | - |
| Bachelor's Degree | $136,402 | $46,518 |
| Graduate Degree | $116,895 | $0 |
| Total | $116,090 | $46,652 |
Family Income in Rapids
Family Income Brackets in Rapids
According to the Rapids family income data, there are 101 families falling into the $100,000 to $149,999 income range, which is the most common income bracket and makes up 26.0% of all families.
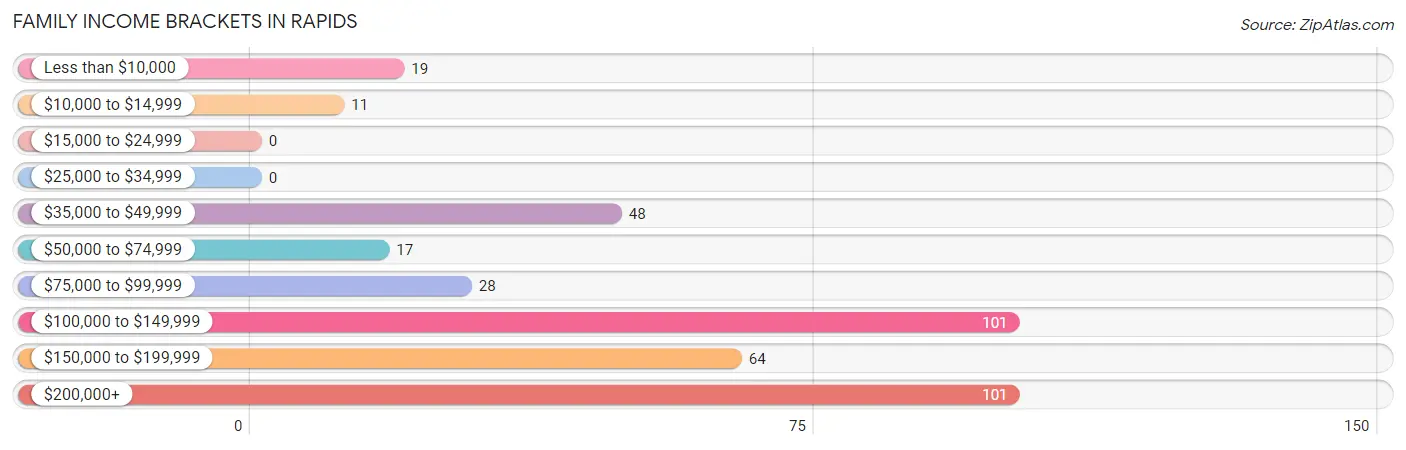
| Income Bracket | # Families | % Families |
| Less than $10,000 | 19 | 4.9% |
| $10,000 to $14,999 | 11 | 2.8% |
| $15,000 to $24,999 | 0 | 0.0% |
| $25,000 to $34,999 | 0 | 0.0% |
| $35,000 to $49,999 | 48 | 12.3% |
| $50,000 to $74,999 | 17 | 4.4% |
| $75,000 to $99,999 | 28 | 7.2% |
| $100,000 to $149,999 | 101 | 26.0% |
| $150,000 to $199,999 | 64 | 16.5% |
| $200,000+ | 101 | 26.0% |
Family Income by Famaliy Size in Rapids
4-person families (100 | 25.7%) account for the highest median family income in Rapids with $250,001 per family, while 4-person families (100 | 25.7%) have the highest median income of $62,500 per family member.
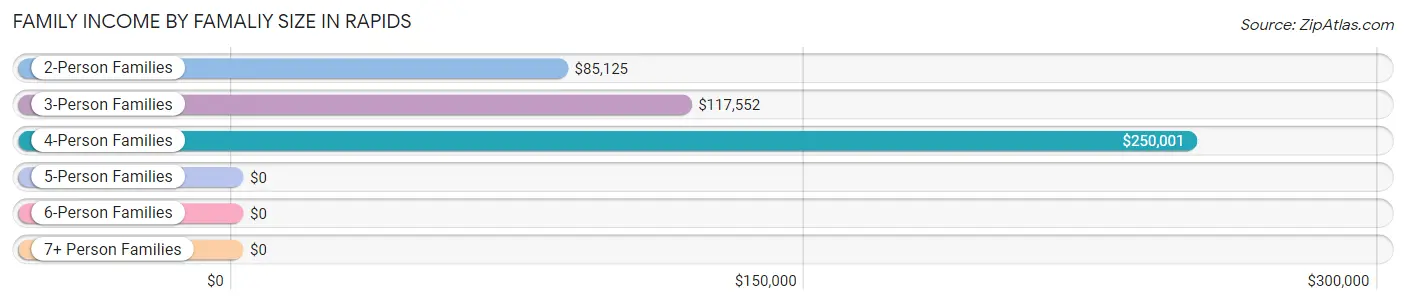
| Income Bracket | # Families | Median Income |
| 2-Person Families | 153 (39.3%) | $85,125 |
| 3-Person Families | 95 (24.4%) | $117,552 |
| 4-Person Families | 100 (25.7%) | $250,001 |
| 5-Person Families | 33 (8.5%) | $0 |
| 6-Person Families | 8 (2.1%) | $0 |
| 7+ Person Families | 0 (0.0%) | $0 |
| Total | 389 (100.0%) | $119,115 |
Family Income by Number of Earners in Rapids
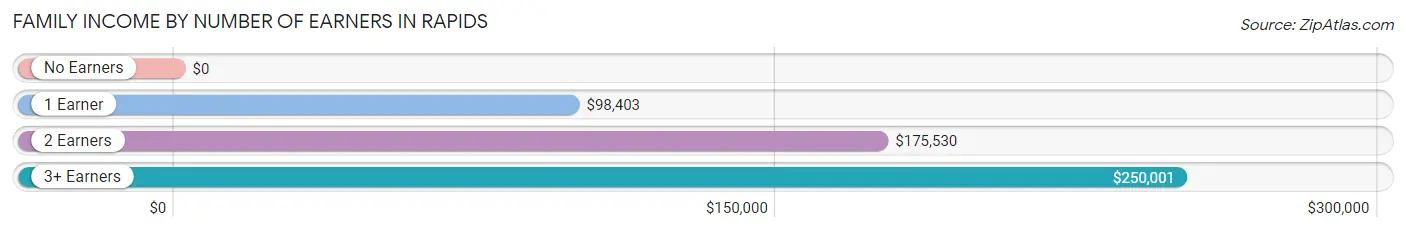
| Number of Earners | # Families | Median Income |
| No Earners | 100 (25.7%) | $0 |
| 1 Earner | 71 (18.2%) | $98,403 |
| 2 Earners | 182 (46.8%) | $175,530 |
| 3+ Earners | 36 (9.2%) | $250,001 |
| Total | 389 (100.0%) | $119,115 |
Household Income in Rapids
Household Income Brackets in Rapids
With 102 households falling in the category, the $100,000 to $149,999 income range is the most frequent in Rapids, accounting for 19.7% of all households.
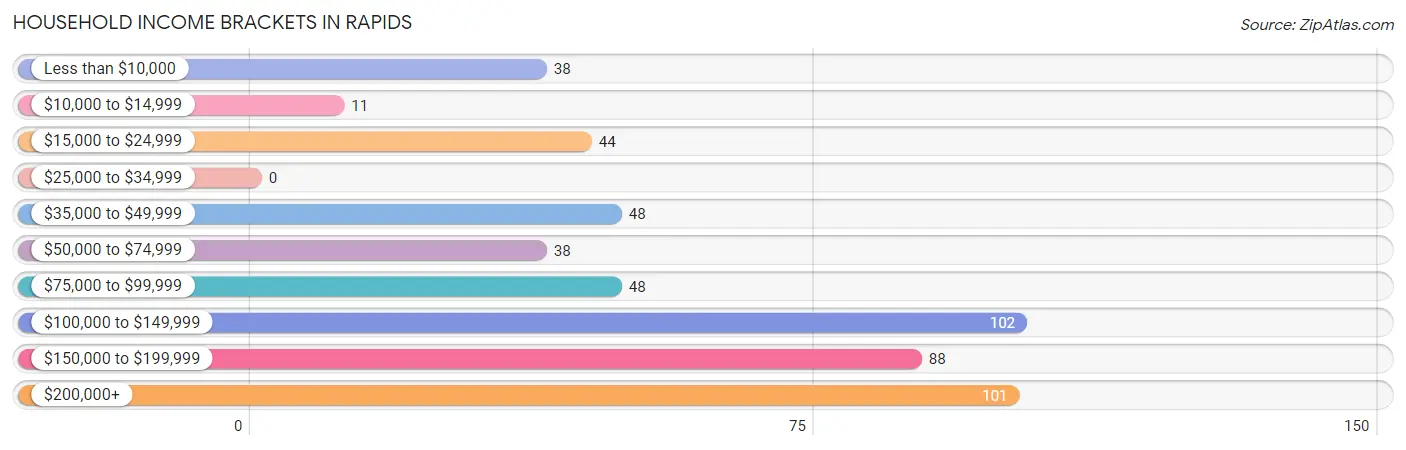
| Income Bracket | # Households | % Households |
| Less than $10,000 | 38 | 7.3% |
| $10,000 to $14,999 | 11 | 2.1% |
| $15,000 to $24,999 | 44 | 8.5% |
| $25,000 to $34,999 | 0 | 0.0% |
| $35,000 to $49,999 | 48 | 9.3% |
| $50,000 to $74,999 | 38 | 7.3% |
| $75,000 to $99,999 | 48 | 9.3% |
| $100,000 to $149,999 | 102 | 19.7% |
| $150,000 to $199,999 | 88 | 17.0% |
| $200,000+ | 101 | 19.5% |
Household Income by Householder Age in Rapids
The median household income in Rapids is $106,739, with the highest median household income of $156,250 found in the 25 to 44 years age bracket for the primary householder. A total of 142 households (27.4%) fall into this category.
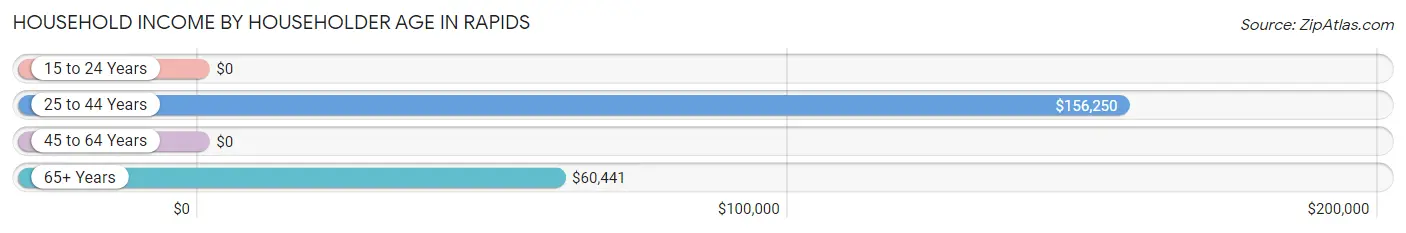
| Income Bracket | # Households | Median Income |
| 15 to 24 Years | 0 (0.0%) | $0 |
| 25 to 44 Years | 142 (27.4%) | $156,250 |
| 45 to 64 Years | 218 (42.1%) | $0 |
| 65+ Years | 158 (30.5%) | $60,441 |
| Total | 518 (100.0%) | $106,739 |
Poverty in Rapids
Income Below Poverty by Sex and Age in Rapids
With 7.3% poverty level for males and 7.8% for females among the residents of Rapids, 25 to 34 year old males and under 5 year old females are the most vulnerable to poverty, with 19 males (40.4%) and 30 females (100.0%) in their respective age groups living below the poverty level.
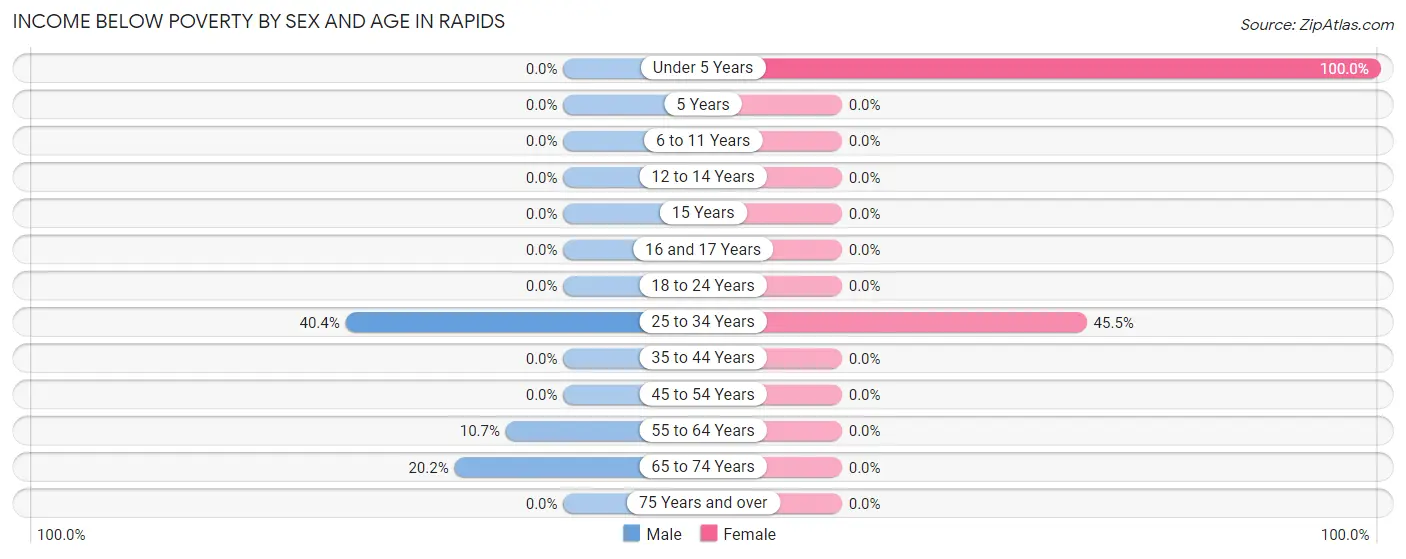
| Age Bracket | Male | Female |
| Under 5 Years | 0 (0.0%) | 30 (100.0%) |
| 5 Years | 0 (0.0%) | 0 (0.0%) |
| 6 to 11 Years | 0 (0.0%) | 0 (0.0%) |
| 12 to 14 Years | 0 (0.0%) | 0 (0.0%) |
| 15 Years | 0 (0.0%) | 0 (0.0%) |
| 16 and 17 Years | 0 (0.0%) | 0 (0.0%) |
| 18 to 24 Years | 0 (0.0%) | 0 (0.0%) |
| 25 to 34 Years | 19 (40.4%) | 25 (45.5%) |
| 35 to 44 Years | 0 (0.0%) | 0 (0.0%) |
| 45 to 54 Years | 0 (0.0%) | 0 (0.0%) |
| 55 to 64 Years | 11 (10.7%) | 0 (0.0%) |
| 65 to 74 Years | 19 (20.2%) | 0 (0.0%) |
| 75 Years and over | 0 (0.0%) | 0 (0.0%) |
| Total | 49 (7.3%) | 55 (7.8%) |
Income Above Poverty by Sex and Age in Rapids
According to the poverty statistics in Rapids, males aged under 5 years and females aged 6 to 11 years are the age groups that are most secure financially, with 100.0% of males and 100.0% of females in these age groups living above the poverty line.
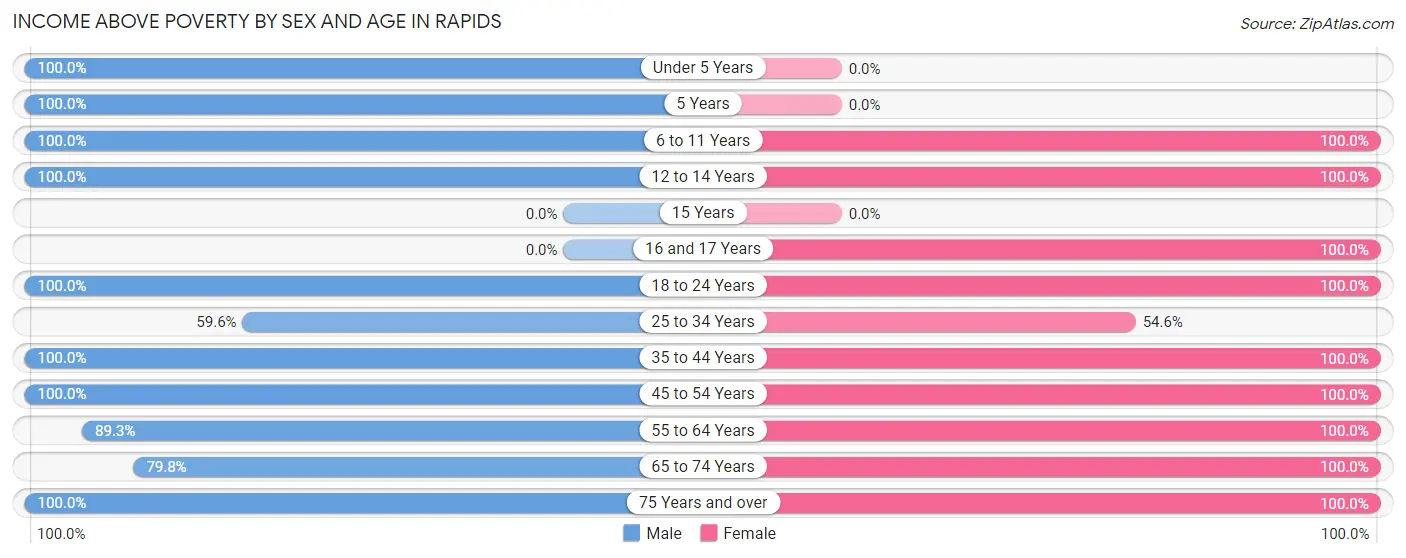
| Age Bracket | Male | Female |
| Under 5 Years | 53 (100.0%) | 0 (0.0%) |
| 5 Years | 32 (100.0%) | 0 (0.0%) |
| 6 to 11 Years | 42 (100.0%) | 73 (100.0%) |
| 12 to 14 Years | 11 (100.0%) | 62 (100.0%) |
| 15 Years | 0 (0.0%) | 0 (0.0%) |
| 16 and 17 Years | 0 (0.0%) | 61 (100.0%) |
| 18 to 24 Years | 25 (100.0%) | 65 (100.0%) |
| 25 to 34 Years | 28 (59.6%) | 30 (54.5%) |
| 35 to 44 Years | 102 (100.0%) | 114 (100.0%) |
| 45 to 54 Years | 129 (100.0%) | 70 (100.0%) |
| 55 to 64 Years | 92 (89.3%) | 56 (100.0%) |
| 65 to 74 Years | 75 (79.8%) | 91 (100.0%) |
| 75 Years and over | 37 (100.0%) | 28 (100.0%) |
| Total | 626 (92.7%) | 650 (92.2%) |
Income Below Poverty Among Married-Couple Families in Rapids
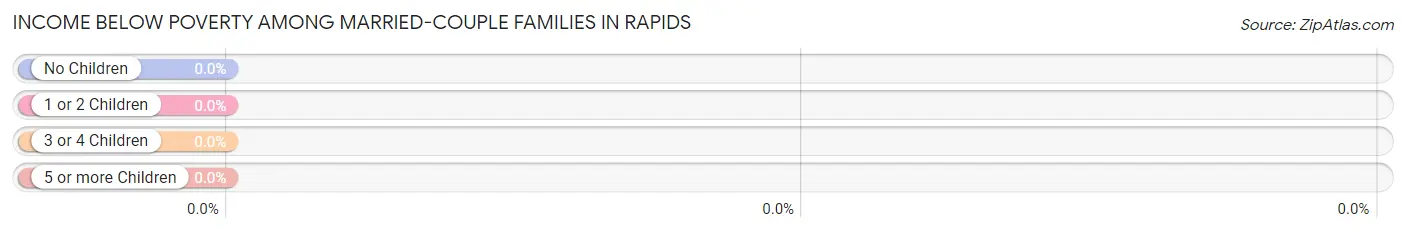
| Children | Above Poverty | Below Poverty |
| No Children | 160 (100.0%) | 0 (0.0%) |
| 1 or 2 Children | 120 (100.0%) | 0 (0.0%) |
| 3 or 4 Children | 33 (100.0%) | 0 (0.0%) |
| 5 or more Children | 0 (0.0%) | 0 (0.0%) |
| Total | 313 (100.0%) | 0 (0.0%) |
Income Below Poverty Among Single-Parent Households in Rapids
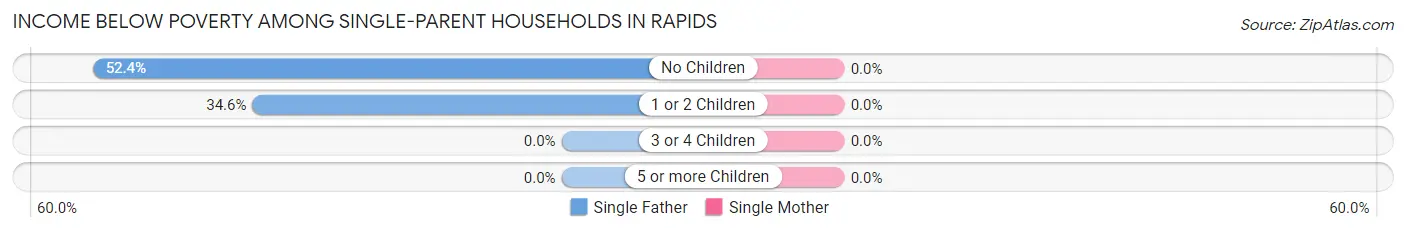
| Children | Single Father | Single Mother |
| No Children | 11 (52.4%) | 0 (0.0%) |
| 1 or 2 Children | 19 (34.5%) | 0 (0.0%) |
| 3 or 4 Children | 0 (0.0%) | 0 (0.0%) |
| 5 or more Children | 0 (0.0%) | 0 (0.0%) |
| Total | 30 (39.5%) | 0 (0.0%) |
Income Below Poverty Among Married-Couple vs Single-Parent Households in Rapids
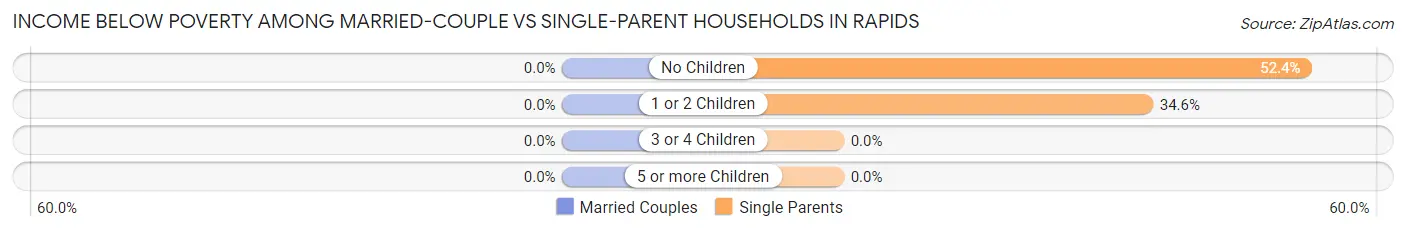
| Children | Married-Couple Families | Single-Parent Households |
| No Children | 0 (0.0%) | 11 (52.4%) |
| 1 or 2 Children | 0 (0.0%) | 19 (34.5%) |
| 3 or 4 Children | 0 (0.0%) | 0 (0.0%) |
| 5 or more Children | 0 (0.0%) | 0 (0.0%) |
| Total | 0 (0.0%) | 30 (39.5%) |
Race in Rapids
The most populous races in Rapids are White / Caucasian (1,251 | 90.6%), Two or more Races (118 | 8.6%), and Hispanic or Latino (19 | 1.4%).
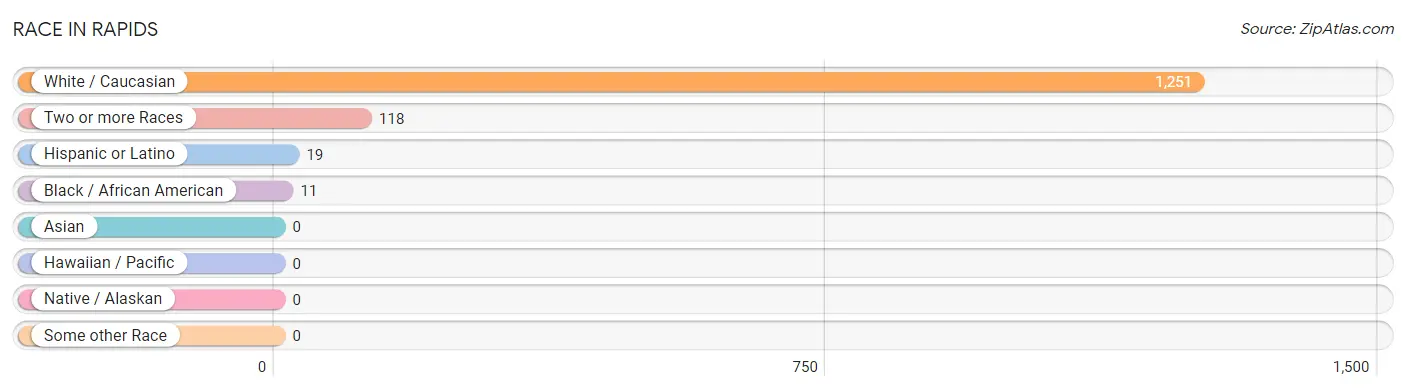
| Race | # Population | % Population |
| Asian | 0 | 0.0% |
| Black / African American | 11 | 0.8% |
| Hawaiian / Pacific | 0 | 0.0% |
| Hispanic or Latino | 19 | 1.4% |
| Native / Alaskan | 0 | 0.0% |
| White / Caucasian | 1,251 | 90.6% |
| Two or more Races | 118 | 8.6% |
| Some other Race | 0 | 0.0% |
| Total | 1,380 | 100.0% |
Ancestry in Rapids
The most populous ancestries reported in Rapids are German (616 | 44.6%), Polish (290 | 21.0%), Italian (156 | 11.3%), English (133 | 9.6%), and Irish (122 | 8.8%), together accounting for 95.4% of all Rapids residents.
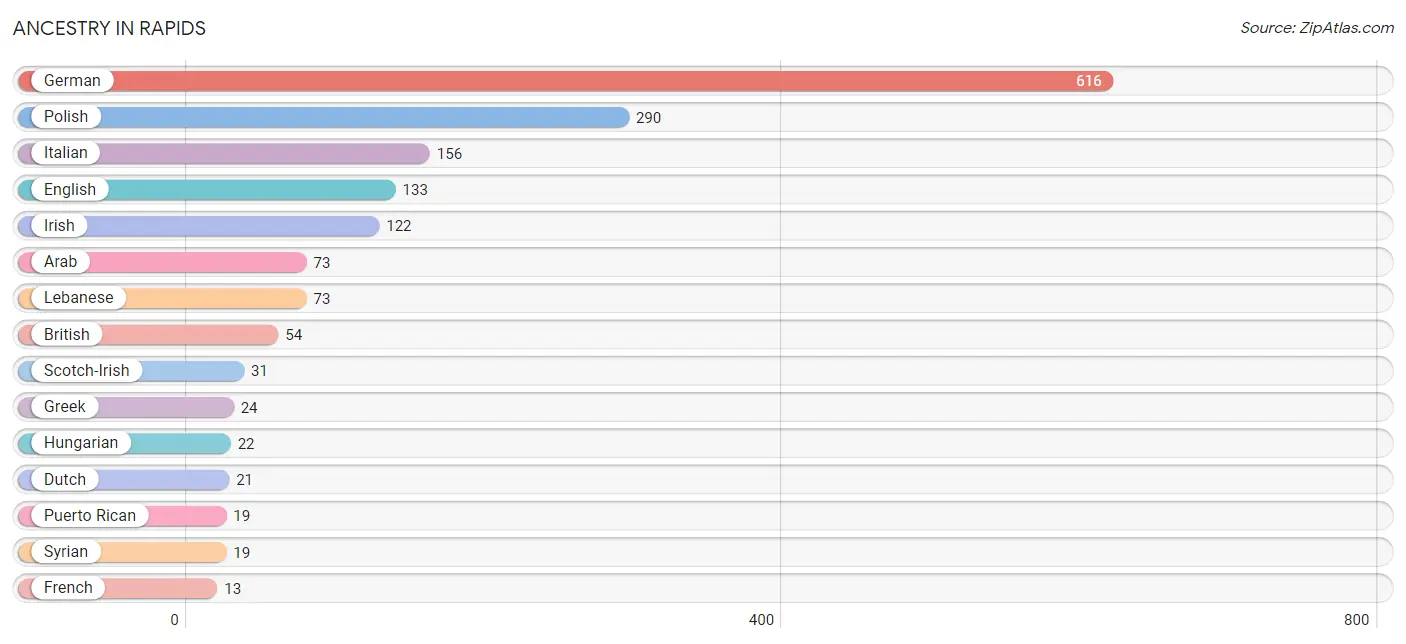
| Ancestry | # Population | % Population |
| Arab | 73 | 5.3% |
| British | 54 | 3.9% |
| Dutch | 21 | 1.5% |
| English | 133 | 9.6% |
| French | 13 | 0.9% |
| German | 616 | 44.6% |
| Greek | 24 | 1.7% |
| Hungarian | 22 | 1.6% |
| Irish | 122 | 8.8% |
| Italian | 156 | 11.3% |
| Lebanese | 73 | 5.3% |
| Polish | 290 | 21.0% |
| Puerto Rican | 19 | 1.4% |
| Scotch-Irish | 31 | 2.2% |
| Swedish | 8 | 0.6% |
| Syrian | 19 | 1.4% | View All 16 Rows |
Immigrants in Rapids

| Immigration Origin | # Population | % Population | View All 0 Rows |
Sex and Age in Rapids
Sex and Age in Rapids
The most populous age groups in Rapids are 50 to 54 Years (76 | 11.3%) for men and 10 to 14 Years (93 | 13.2%) for women.
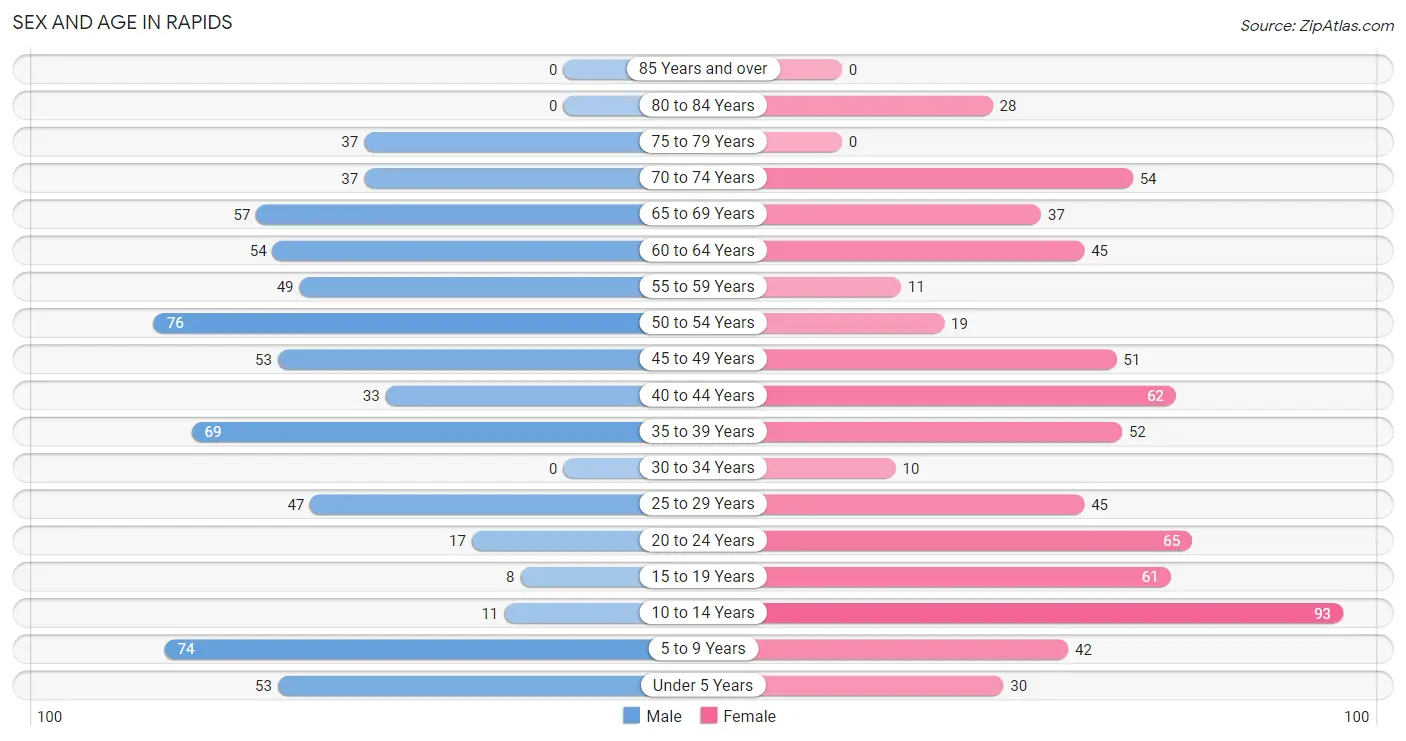
| Age Bracket | Male | Female |
| Under 5 Years | 53 (7.9%) | 30 (4.3%) |
| 5 to 9 Years | 74 (11.0%) | 42 (6.0%) |
| 10 to 14 Years | 11 (1.6%) | 93 (13.2%) |
| 15 to 19 Years | 8 (1.2%) | 61 (8.6%) |
| 20 to 24 Years | 17 (2.5%) | 65 (9.2%) |
| 25 to 29 Years | 47 (7.0%) | 45 (6.4%) |
| 30 to 34 Years | 0 (0.0%) | 10 (1.4%) |
| 35 to 39 Years | 69 (10.2%) | 52 (7.4%) |
| 40 to 44 Years | 33 (4.9%) | 62 (8.8%) |
| 45 to 49 Years | 53 (7.9%) | 51 (7.2%) |
| 50 to 54 Years | 76 (11.3%) | 19 (2.7%) |
| 55 to 59 Years | 49 (7.3%) | 11 (1.6%) |
| 60 to 64 Years | 54 (8.0%) | 45 (6.4%) |
| 65 to 69 Years | 57 (8.4%) | 37 (5.2%) |
| 70 to 74 Years | 37 (5.5%) | 54 (7.7%) |
| 75 to 79 Years | 37 (5.5%) | 0 (0.0%) |
| 80 to 84 Years | 0 (0.0%) | 28 (4.0%) |
| 85 Years and over | 0 (0.0%) | 0 (0.0%) |
| Total | 675 (100.0%) | 705 (100.0%) |
Families and Households in Rapids
Median Family Size in Rapids
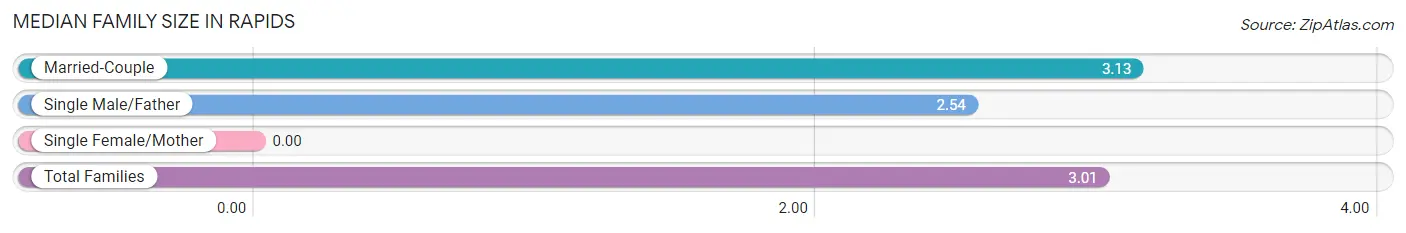
| Family Type | # Families | Family Size |
| Married-Couple | 313 (80.5%) | 3.13 |
| Single Male/Father | 76 (19.5%) | 2.54 |
| Single Female/Mother | 0 (0.0%) | - |
| Total Families | 389 (100.0%) | 3.01 |
Median Household Size in Rapids
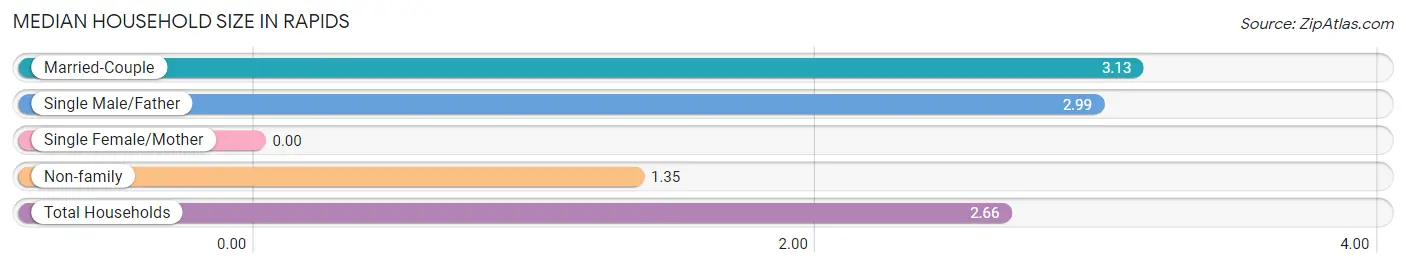
| Household Type | # Households | Household Size |
| Married-Couple | 313 (60.4%) | 3.13 |
| Single Male/Father | 76 (14.7%) | 2.99 |
| Single Female/Mother | 0 (0.0%) | - |
| Non-family | 129 (24.9%) | 1.35 |
| Total Households | 518 (100.0%) | 2.66 |
Household Size by Marriage Status in Rapids
Out of a total of 518 households in Rapids, 389 (75.1%) are family households, while 129 (24.9%) are nonfamily households. The most numerous type of family households are 2-person households, comprising 153, and the most common type of nonfamily households are 1-person households, comprising 83.
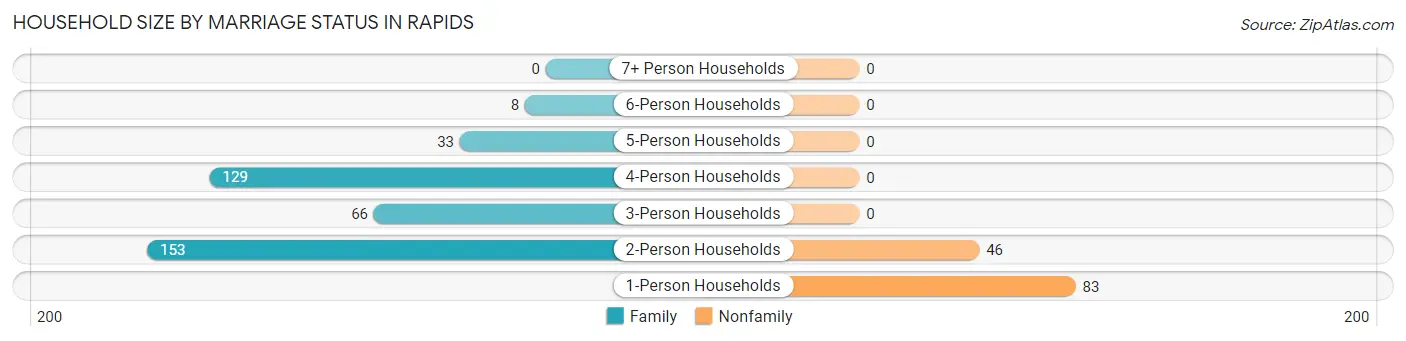
| Household Size | Family Households | Nonfamily Households |
| 1-Person Households | - | 83 (16.0%) |
| 2-Person Households | 153 (29.5%) | 46 (8.9%) |
| 3-Person Households | 66 (12.7%) | 0 (0.0%) |
| 4-Person Households | 129 (24.9%) | 0 (0.0%) |
| 5-Person Households | 33 (6.4%) | 0 (0.0%) |
| 6-Person Households | 8 (1.5%) | 0 (0.0%) |
| 7+ Person Households | 0 (0.0%) | 0 (0.0%) |
| Total | 389 (75.1%) | 129 (24.9%) |
Female Fertility in Rapids
Fertility by Age in Rapids
Average fertility rate in Rapids is 43.0 births per 1,000 women. Women in the age bracket of 20 to 34 years have the highest fertility rate with 125.0 births per 1,000 women. Women in the age bracket of 20 to 34 years acount for 100.0% of all women with births.
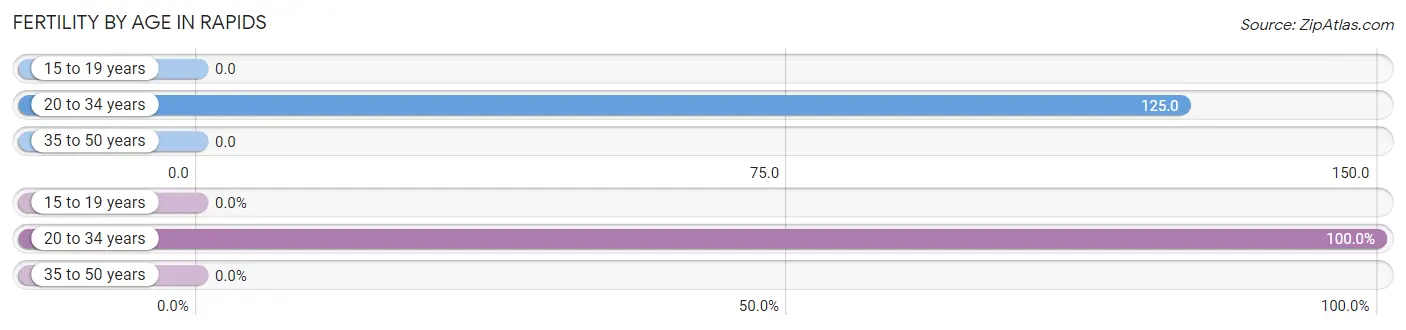
| Age Bracket | Women with Births | Births / 1,000 Women |
| 15 to 19 years | 0 (0.0%) | 0.0 |
| 20 to 34 years | 15 (100.0%) | 125.0 |
| 35 to 50 years | 0 (0.0%) | 0.0 |
| Total | 15 (100.0%) | 43.0 |
Fertility by Age by Marriage Status in Rapids
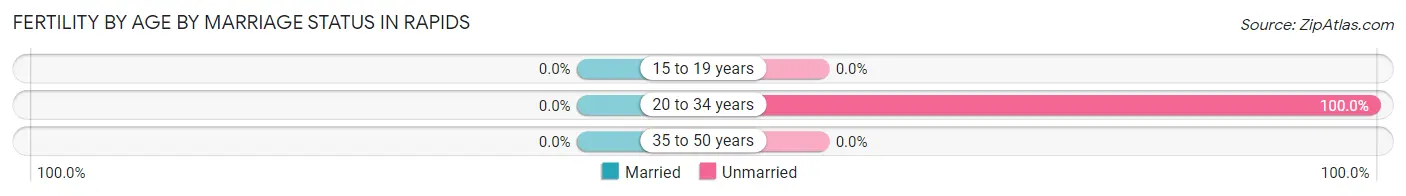
| Age Bracket | Married | Unmarried |
| 15 to 19 years | 0 (0.0%) | 0 (0.0%) |
| 20 to 34 years | 0 (0.0%) | 15 (100.0%) |
| 35 to 50 years | 0 (0.0%) | 0 (0.0%) |
| Total | 0 (0.0%) | 15 (100.0%) |
Fertility by Education in Rapids
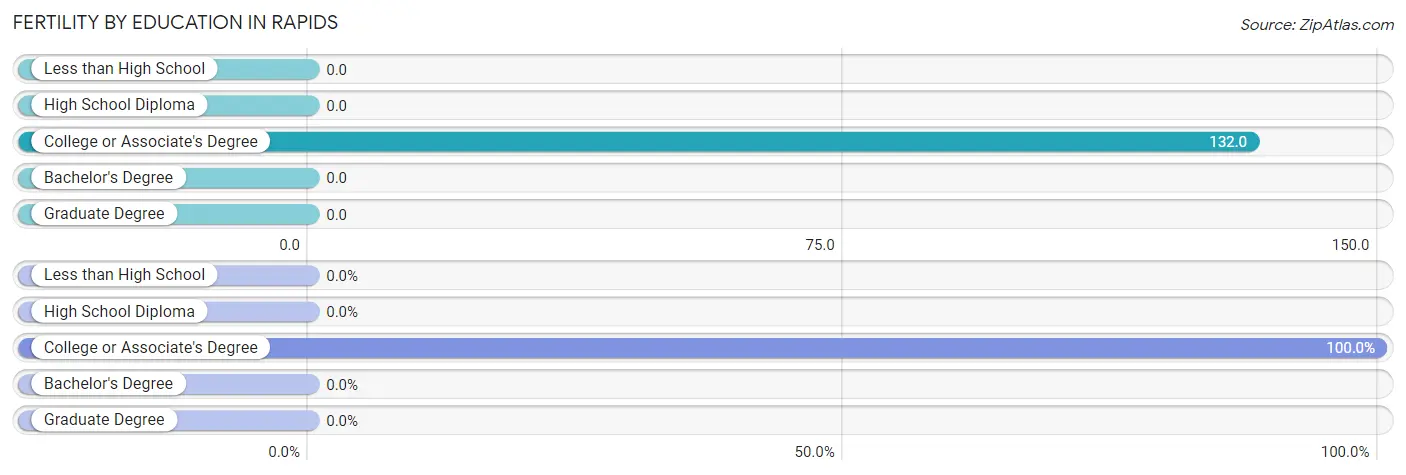
| Educational Attainment | Women with Births | Births / 1,000 Women |
| Less than High School | 0 (0.0%) | 0.0 |
| High School Diploma | 0 (0.0%) | 0.0 |
| College or Associate's Degree | 15 (100.0%) | 132.0 |
| Bachelor's Degree | 0 (0.0%) | 0.0 |
| Graduate Degree | 0 (0.0%) | 0.0 |
| Total | 15 (100.0%) | 43.0 |
Fertility by Education by Marriage Status in Rapids
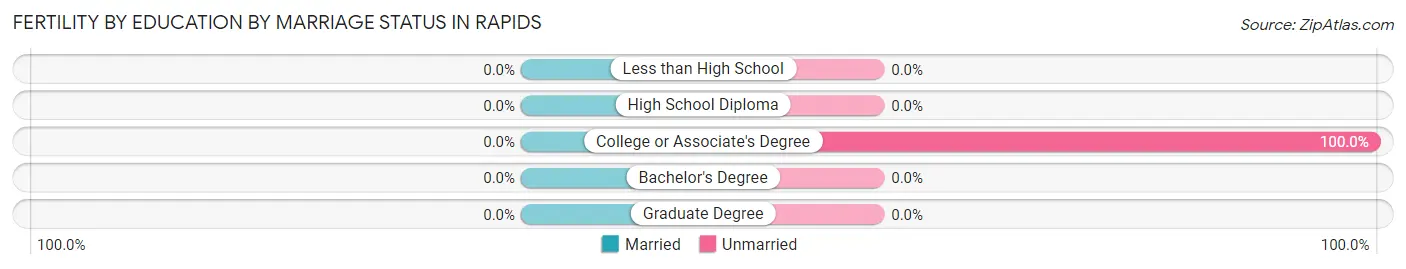
| Educational Attainment | Married | Unmarried |
| Less than High School | 0 (0.0%) | 0 (0.0%) |
| High School Diploma | 0 (0.0%) | 0 (0.0%) |
| College or Associate's Degree | 0 (0.0%) | 15 (100.0%) |
| Bachelor's Degree | 0 (0.0%) | 0 (0.0%) |
| Graduate Degree | 0 (0.0%) | 0 (0.0%) |
| Total | 0 (0.0%) | 15 (100.0%) |
Employment Characteristics in Rapids
Employment by Class of Employer in Rapids
Among the 567 employed individuals in Rapids, private company employees (360 | 63.5%), self-employed (incorporated) (52 | 9.2%), and state government employees (38 | 6.7%) make up the most common classes of employment.
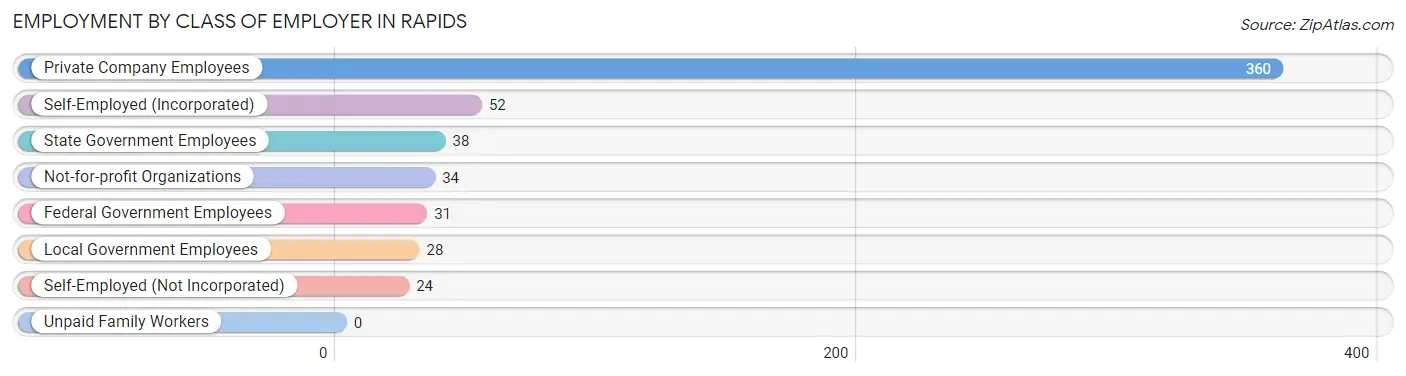
| Employer Class | # Employees | % Employees |
| Private Company Employees | 360 | 63.5% |
| Self-Employed (Incorporated) | 52 | 9.2% |
| Self-Employed (Not Incorporated) | 24 | 4.2% |
| Not-for-profit Organizations | 34 | 6.0% |
| Local Government Employees | 28 | 4.9% |
| State Government Employees | 38 | 6.7% |
| Federal Government Employees | 31 | 5.5% |
| Unpaid Family Workers | 0 | 0.0% |
| Total | 567 | 100.0% |
Employment Status by Age in Rapids
According to the labor force statistics for Rapids, out of the total population over 16 years of age (1,077), 56.1% or 604 individuals are in the labor force, with 6.1% or 37 of them unemployed. The age group with the highest labor force participation rate is 20 to 24 years, with 100.0% or 82 individuals in the labor force. Within the labor force, the 16 to 19 years age range has the highest percentage of unemployed individuals, with 100.0% or 8 of them being unemployed.
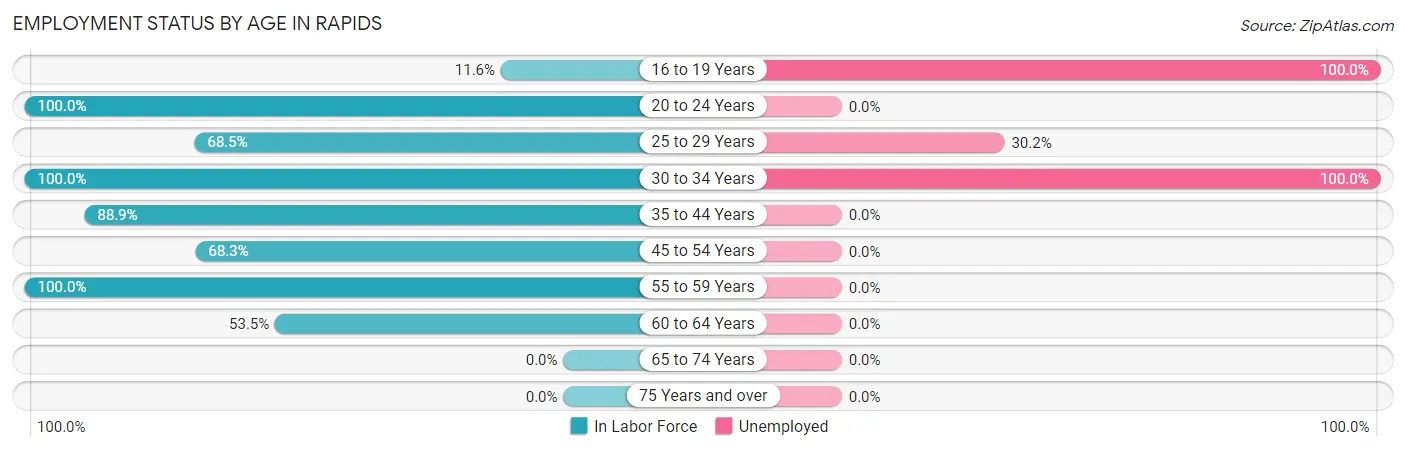
| Age Bracket | In Labor Force | Unemployed |
| 16 to 19 Years | 8 (11.6%) | 8 (100.0%) |
| 20 to 24 Years | 82 (100.0%) | 0 (0.0%) |
| 25 to 29 Years | 63 (68.5%) | 19 (30.2%) |
| 30 to 34 Years | 10 (100.0%) | 10 (100.0%) |
| 35 to 44 Years | 192 (88.9%) | 0 (0.0%) |
| 45 to 54 Years | 136 (68.3%) | 0 (0.0%) |
| 55 to 59 Years | 60 (100.0%) | 0 (0.0%) |
| 60 to 64 Years | 53 (53.5%) | 0 (0.0%) |
| 65 to 74 Years | 0 (0.0%) | 0 (0.0%) |
| 75 Years and over | 0 (0.0%) | 0 (0.0%) |
| Total | 604 (56.1%) | 37 (6.1%) |
Employment Status by Educational Attainment in Rapids
According to labor force statistics for Rapids, 76.0% of individuals (514) out of the total population between 25 and 64 years of age (676) are in the labor force, with 5.6% or 29 of them being unemployed. The group with the highest labor force participation rate are those with the educational attainment of bachelor's degree or higher, with 94.2% or 390 individuals in the labor force. Within the labor force, individuals with college / associate degree education have the highest percentage of unemployment, with 33.7% or 29 of them being unemployed.
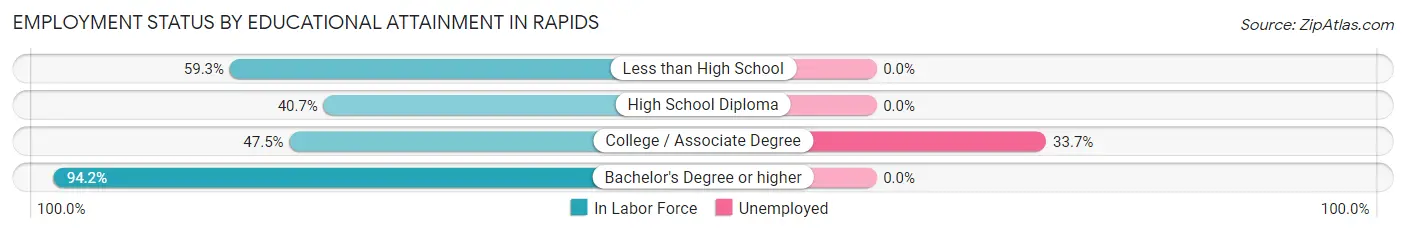
| Educational Attainment | In Labor Force | Unemployed |
| Less than High School | 16 (59.3%) | 0 (0.0%) |
| High School Diploma | 22 (40.7%) | 0 (0.0%) |
| College / Associate Degree | 86 (47.5%) | 61 (33.7%) |
| Bachelor's Degree or higher | 390 (94.2%) | 0 (0.0%) |
| Total | 514 (76.0%) | 38 (5.6%) |
Employment Occupations by Sex in Rapids
Management, Business, Science and Arts Occupations
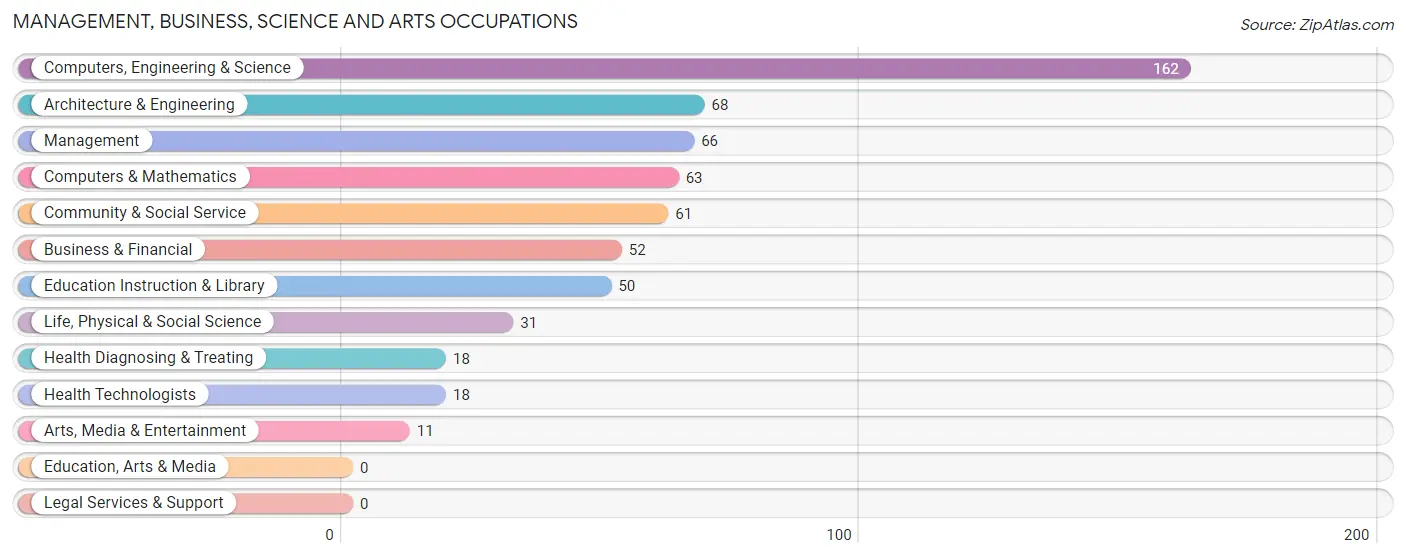
The most common Management, Business, Science and Arts occupations in Rapids are Computers, Engineering & Science (162 | 28.6%), Architecture & Engineering (68 | 12.0%), Management (66 | 11.6%), Computers & Mathematics (63 | 11.1%), and Community & Social Service (61 | 10.8%).
Management, Business, Science and Arts Occupations by Sex
Within the Management, Business, Science and Arts occupations in Rapids, the most male-oriented occupations are Business & Financial (100.0%), Life, Physical & Social Science (100.0%), and Architecture & Engineering (88.2%), while the most female-oriented occupations are Community & Social Service (100.0%), Education Instruction & Library (100.0%), and Arts, Media & Entertainment (100.0%).
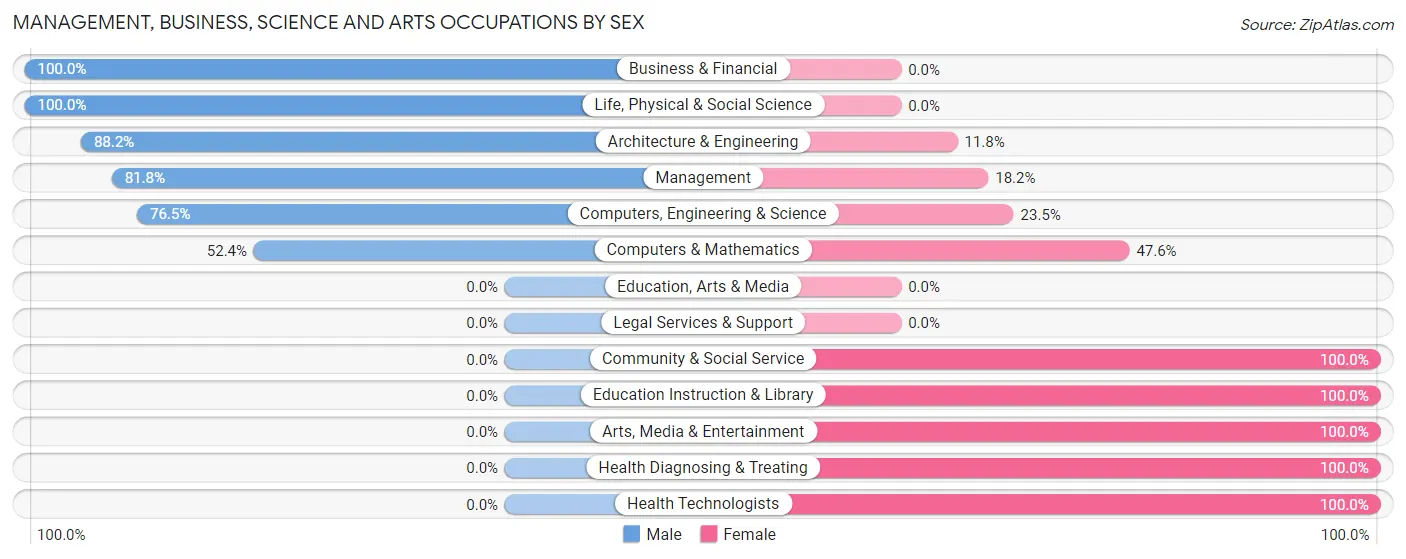
| Occupation | Male | Female |
| Management | 54 (81.8%) | 12 (18.2%) |
| Business & Financial | 52 (100.0%) | 0 (0.0%) |
| Computers, Engineering & Science | 124 (76.5%) | 38 (23.5%) |
| Computers & Mathematics | 33 (52.4%) | 30 (47.6%) |
| Architecture & Engineering | 60 (88.2%) | 8 (11.8%) |
| Life, Physical & Social Science | 31 (100.0%) | 0 (0.0%) |
| Community & Social Service | 0 (0.0%) | 61 (100.0%) |
| Education, Arts & Media | 0 (0.0%) | 0 (0.0%) |
| Legal Services & Support | 0 (0.0%) | 0 (0.0%) |
| Education Instruction & Library | 0 (0.0%) | 50 (100.0%) |
| Arts, Media & Entertainment | 0 (0.0%) | 11 (100.0%) |
| Health Diagnosing & Treating | 0 (0.0%) | 18 (100.0%) |
| Health Technologists | 0 (0.0%) | 18 (100.0%) |
| Total (Category) | 230 (64.1%) | 129 (35.9%) |
| Total (Overall) | 343 (60.5%) | 224 (39.5%) |
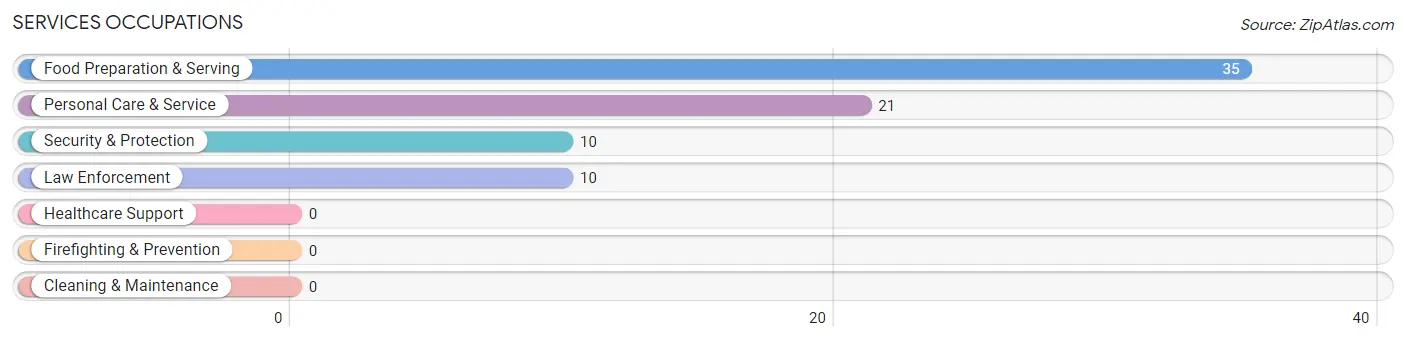
Services Occupations
The most common Services occupations in Rapids are Food Preparation & Serving (35 | 6.2%), Personal Care & Service (21 | 3.7%), Security & Protection (10 | 1.8%), and Law Enforcement (10 | 1.8%).
Services Occupations by Sex
Within the Services occupations in Rapids, the most male-oriented occupations are Security & Protection (100.0%), Law Enforcement (100.0%), and Personal Care & Service (52.4%), while the most female-oriented occupations are Food Preparation & Serving (54.3%), and Personal Care & Service (47.6%).
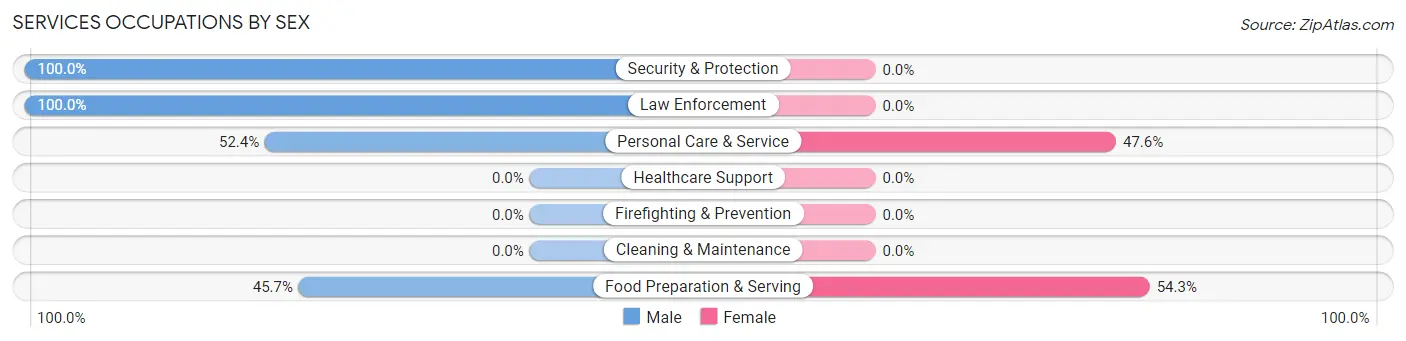
| Occupation | Male | Female |
| Healthcare Support | 0 (0.0%) | 0 (0.0%) |
| Security & Protection | 10 (100.0%) | 0 (0.0%) |
| Firefighting & Prevention | 0 (0.0%) | 0 (0.0%) |
| Law Enforcement | 10 (100.0%) | 0 (0.0%) |
| Food Preparation & Serving | 16 (45.7%) | 19 (54.3%) |
| Cleaning & Maintenance | 0 (0.0%) | 0 (0.0%) |
| Personal Care & Service | 11 (52.4%) | 10 (47.6%) |
| Total (Category) | 37 (56.1%) | 29 (43.9%) |
| Total (Overall) | 343 (60.5%) | 224 (39.5%) |
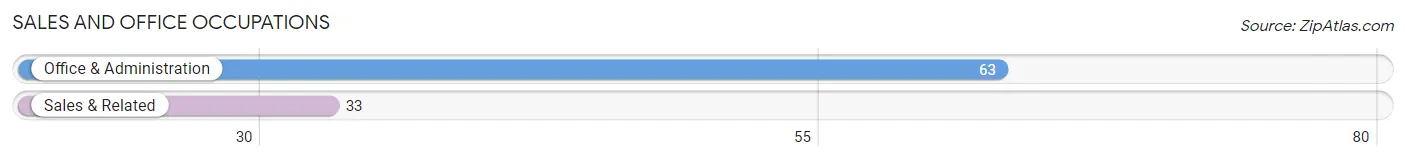
Sales and Office Occupations
The most common Sales and Office occupations in Rapids are Office & Administration (63 | 11.1%), and Sales & Related (33 | 5.8%).
Sales and Office Occupations by Sex
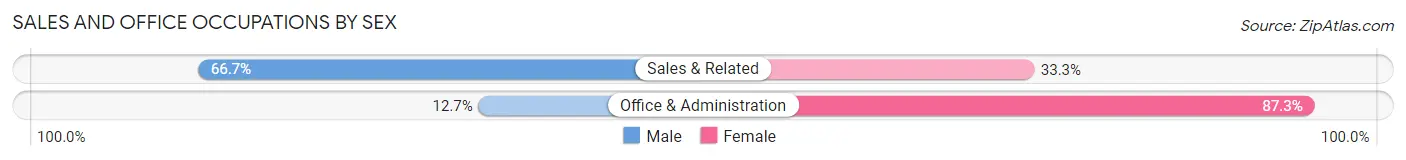
| Occupation | Male | Female |
| Sales & Related | 22 (66.7%) | 11 (33.3%) |
| Office & Administration | 8 (12.7%) | 55 (87.3%) |
| Total (Category) | 30 (31.2%) | 66 (68.8%) |
| Total (Overall) | 343 (60.5%) | 224 (39.5%) |
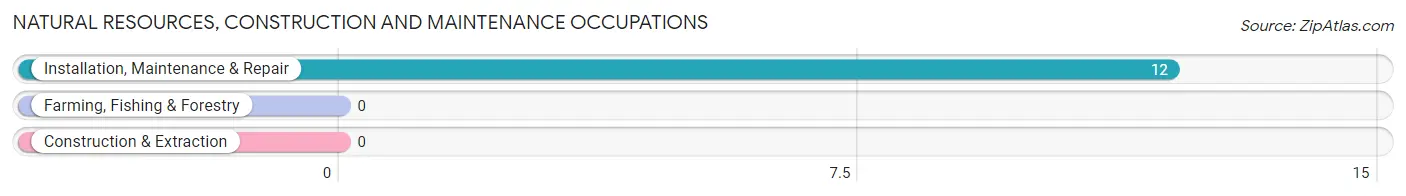
Natural Resources, Construction and Maintenance Occupations
The most common Natural Resources, Construction and Maintenance occupations in Rapids are , and Installation, Maintenance & Repair (12 | 2.1%).
Natural Resources, Construction and Maintenance Occupations by Sex
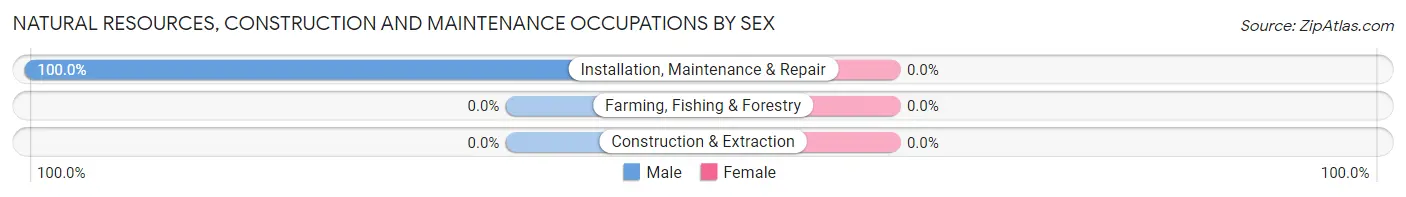
| Occupation | Male | Female |
| Farming, Fishing & Forestry | 0 (0.0%) | 0 (0.0%) |
| Construction & Extraction | 0 (0.0%) | 0 (0.0%) |
| Installation, Maintenance & Repair | 12 (100.0%) | 0 (0.0%) |
| Total (Category) | 12 (100.0%) | 0 (0.0%) |
| Total (Overall) | 343 (60.5%) | 224 (39.5%) |
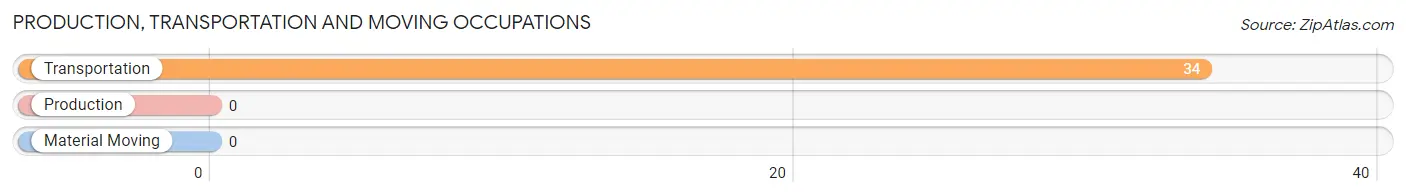
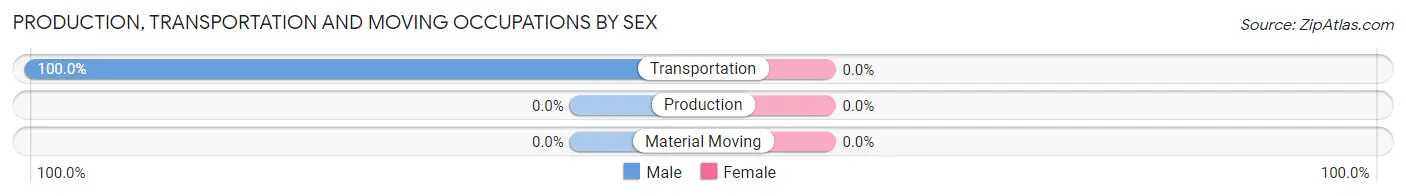
Production, Transportation and Moving Occupations
The most common Production, Transportation and Moving occupations in Rapids are , and Transportation (34 | 6.0%).
Production, Transportation and Moving Occupations by Sex
| Occupation | Male | Female |
| Production | 0 (0.0%) | 0 (0.0%) |
| Transportation | 34 (100.0%) | 0 (0.0%) |
| Material Moving | 0 (0.0%) | 0 (0.0%) |
| Total (Category) | 34 (100.0%) | 0 (0.0%) |
| Total (Overall) | 343 (60.5%) | 224 (39.5%) |
Employment Industries by Sex in Rapids
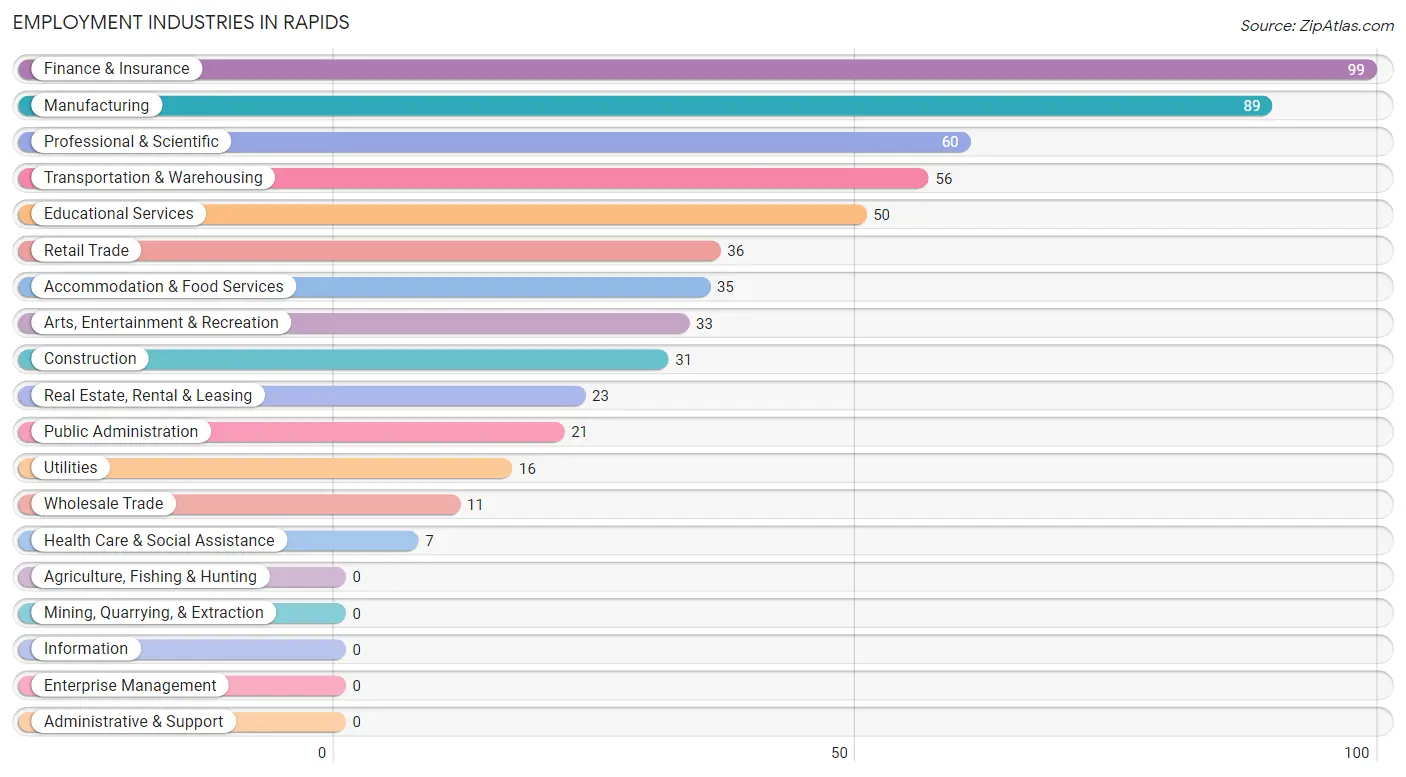
Employment Industries in Rapids
The major employment industries in Rapids include Finance & Insurance (99 | 17.5%), Manufacturing (89 | 15.7%), Professional & Scientific (60 | 10.6%), Transportation & Warehousing (56 | 9.9%), and Educational Services (50 | 8.8%).
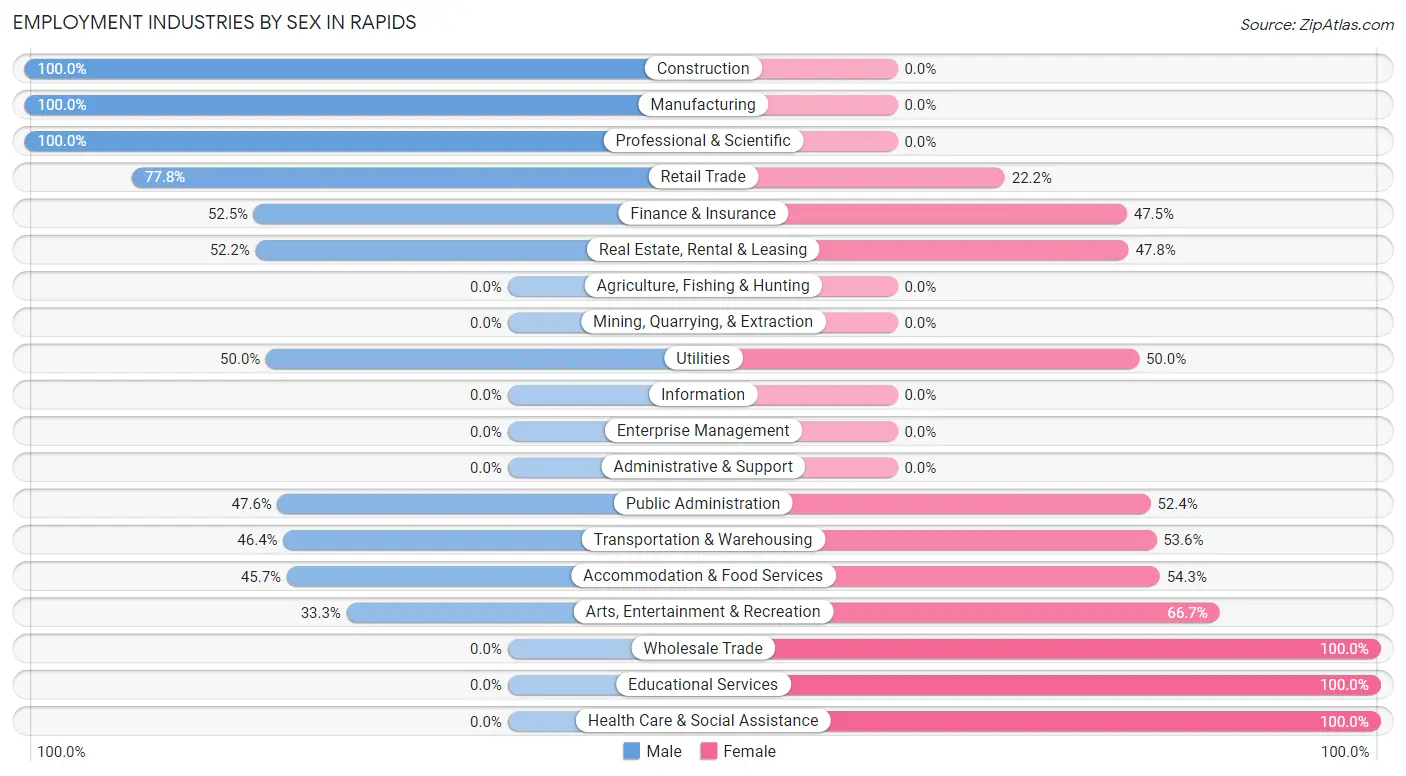
Employment Industries by Sex in Rapids
The Rapids industries that see more men than women are Construction (100.0%), Manufacturing (100.0%), and Professional & Scientific (100.0%), whereas the industries that tend to have a higher number of women are Wholesale Trade (100.0%), Educational Services (100.0%), and Health Care & Social Assistance (100.0%).
| Industry | Male | Female |
| Agriculture, Fishing & Hunting | 0 (0.0%) | 0 (0.0%) |
| Mining, Quarrying, & Extraction | 0 (0.0%) | 0 (0.0%) |
| Construction | 31 (100.0%) | 0 (0.0%) |
| Manufacturing | 89 (100.0%) | 0 (0.0%) |
| Wholesale Trade | 0 (0.0%) | 11 (100.0%) |
| Retail Trade | 28 (77.8%) | 8 (22.2%) |
| Transportation & Warehousing | 26 (46.4%) | 30 (53.6%) |
| Utilities | 8 (50.0%) | 8 (50.0%) |
| Information | 0 (0.0%) | 0 (0.0%) |
| Finance & Insurance | 52 (52.5%) | 47 (47.5%) |
| Real Estate, Rental & Leasing | 12 (52.2%) | 11 (47.8%) |
| Professional & Scientific | 60 (100.0%) | 0 (0.0%) |
| Enterprise Management | 0 (0.0%) | 0 (0.0%) |
| Administrative & Support | 0 (0.0%) | 0 (0.0%) |
| Educational Services | 0 (0.0%) | 50 (100.0%) |
| Health Care & Social Assistance | 0 (0.0%) | 7 (100.0%) |
| Arts, Entertainment & Recreation | 11 (33.3%) | 22 (66.7%) |
| Accommodation & Food Services | 16 (45.7%) | 19 (54.3%) |
| Public Administration | 10 (47.6%) | 11 (52.4%) |
| Total | 343 (60.5%) | 224 (39.5%) |
Education in Rapids
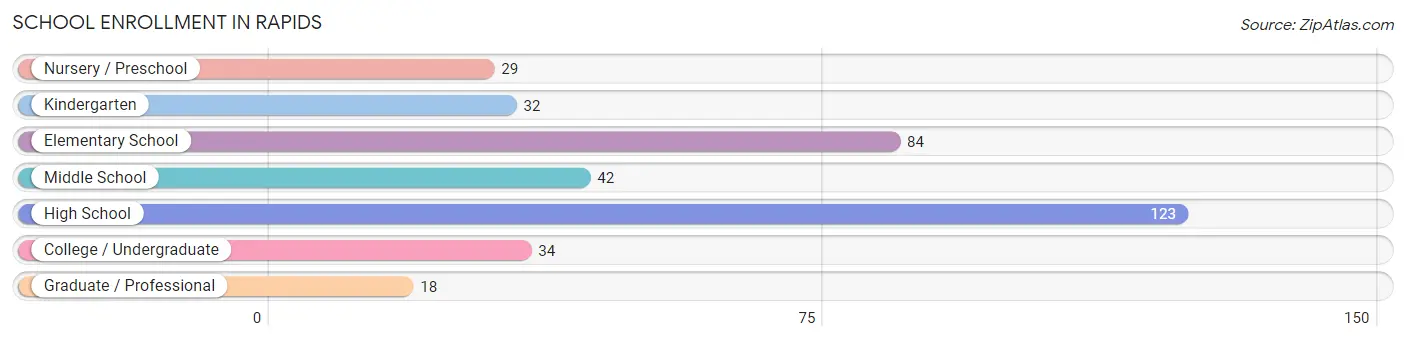
School Enrollment in Rapids
The most common levels of schooling among the 362 students in Rapids are high school (123 | 34.0%), elementary school (84 | 23.2%), and middle school (42 | 11.6%).
| School Level | # Students | % Students |
| Nursery / Preschool | 29 | 8.0% |
| Kindergarten | 32 | 8.8% |
| Elementary School | 84 | 23.2% |
| Middle School | 42 | 11.6% |
| High School | 123 | 34.0% |
| College / Undergraduate | 34 | 9.4% |
| Graduate / Professional | 18 | 5.0% |
| Total | 362 | 100.0% |
School Enrollment by Age by Funding Source in Rapids
Out of a total of 362 students who are enrolled in schools in Rapids, 121 (33.4%) attend a private institution, while the remaining 241 (66.6%) are enrolled in public schools. The age group of 18 to 19 year olds has the highest likelihood of being enrolled in private schools, with 8 (100.0% in the age bracket) enrolled. Conversely, the age group of 3 to 4 year olds has the lowest likelihood of being enrolled in a private school, with 29 (100.0% in the age bracket) attending a public institution.
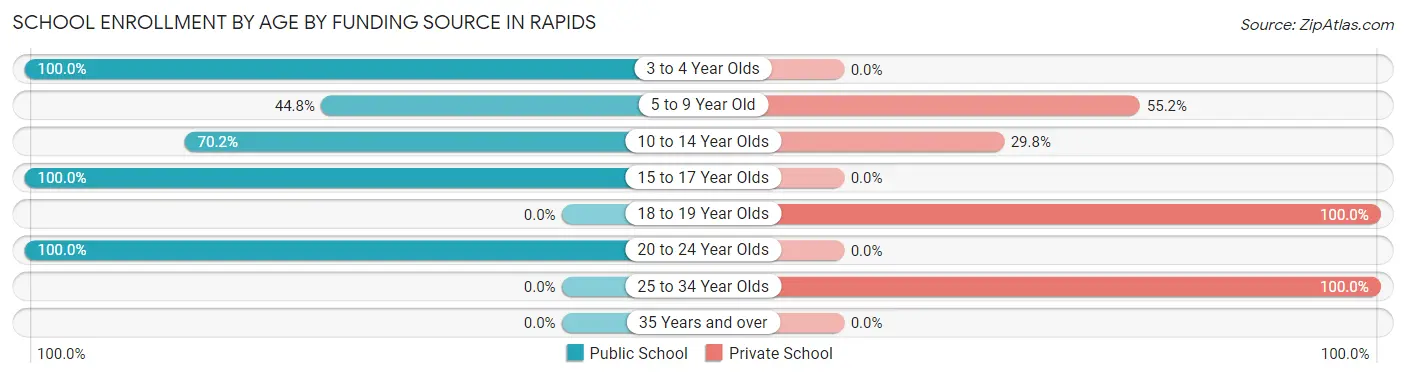
| Age Bracket | Public School | Private School |
| 3 to 4 Year Olds | 29 (100.0%) | 0 (0.0%) |
| 5 to 9 Year Old | 52 (44.8%) | 64 (55.2%) |
| 10 to 14 Year Olds | 73 (70.2%) | 31 (29.8%) |
| 15 to 17 Year Olds | 61 (100.0%) | 0 (0.0%) |
| 18 to 19 Year Olds | 0 (0.0%) | 8 (100.0%) |
| 20 to 24 Year Olds | 26 (100.0%) | 0 (0.0%) |
| 25 to 34 Year Olds | 0 (0.0%) | 18 (100.0%) |
| 35 Years and over | 0 (0.0%) | 0 (0.0%) |
| Total | 241 (66.6%) | 121 (33.4%) |
Educational Attainment by Field of Study in Rapids
Business (98 | 18.9%), psychology (75 | 14.5%), social sciences (70 | 13.5%), engineering (70 | 13.5%), and computers & mathematics (64 | 12.4%) are the most common fields of study among 518 individuals in Rapids who have obtained a bachelor's degree or higher.
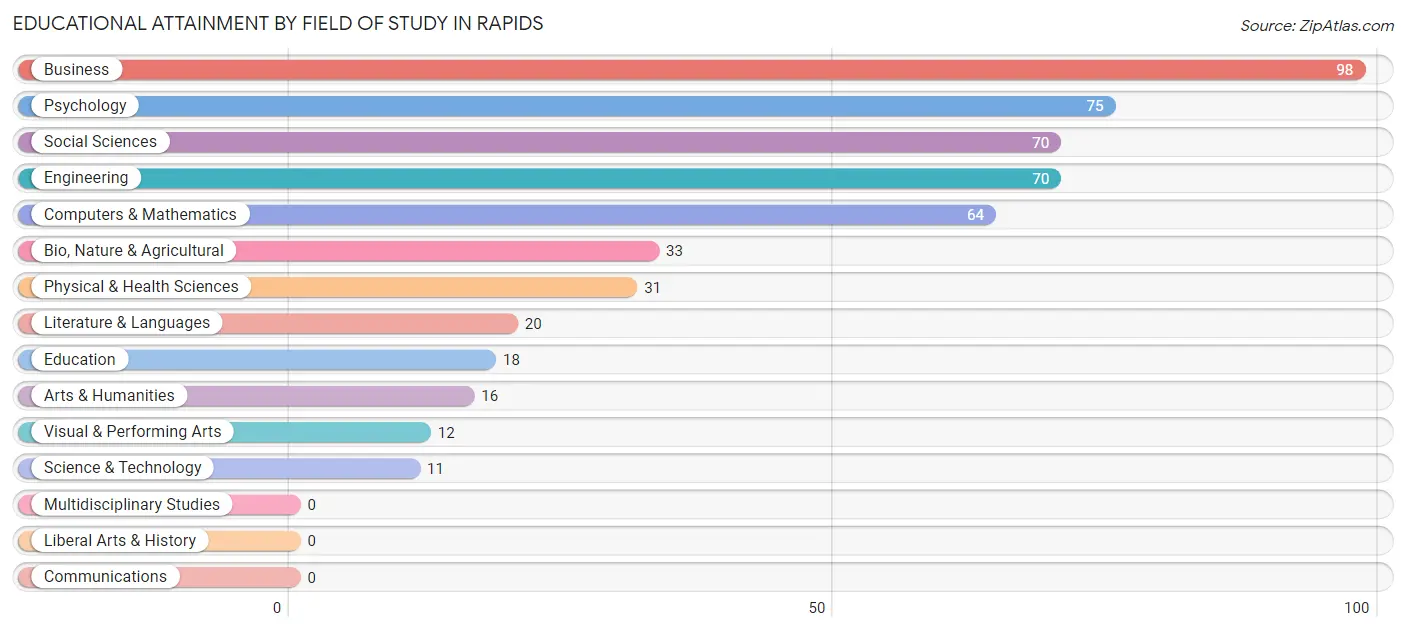
| Field of Study | # Graduates | % Graduates |
| Computers & Mathematics | 64 | 12.4% |
| Bio, Nature & Agricultural | 33 | 6.4% |
| Physical & Health Sciences | 31 | 6.0% |
| Psychology | 75 | 14.5% |
| Social Sciences | 70 | 13.5% |
| Engineering | 70 | 13.5% |
| Multidisciplinary Studies | 0 | 0.0% |
| Science & Technology | 11 | 2.1% |
| Business | 98 | 18.9% |
| Education | 18 | 3.5% |
| Literature & Languages | 20 | 3.9% |
| Liberal Arts & History | 0 | 0.0% |
| Visual & Performing Arts | 12 | 2.3% |
| Communications | 0 | 0.0% |
| Arts & Humanities | 16 | 3.1% |
| Total | 518 | 100.0% |
Transportation & Commute in Rapids
Vehicle Availability by Sex in Rapids
The most prevalent vehicle ownership categories in Rapids are males with 2 vehicles (146, accounting for 42.6%) and females with 2 vehicles (103, making up 65.2%).
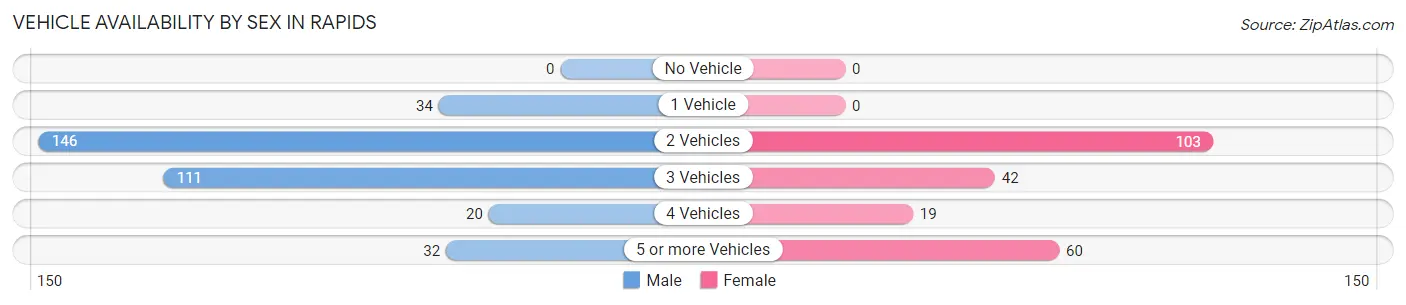
| Vehicles Available | Male | Female |
| No Vehicle | 0 (0.0%) | 0 (0.0%) |
| 1 Vehicle | 34 (9.9%) | 0 (0.0%) |
| 2 Vehicles | 146 (42.6%) | 103 (46.0%) |
| 3 Vehicles | 111 (32.4%) | 42 (18.8%) |
| 4 Vehicles | 20 (5.8%) | 19 (8.5%) |
| 5 or more Vehicles | 32 (9.3%) | 60 (26.8%) |
| Total | 343 (100.0%) | 224 (100.0%) |
Commute Time in Rapids
The most frequently occuring commute durations in Rapids are 25 to 29 minutes (107 commuters, 23.8%), 30 to 34 minutes (99 commuters, 22.0%), and 40 to 44 minutes (88 commuters, 19.6%).
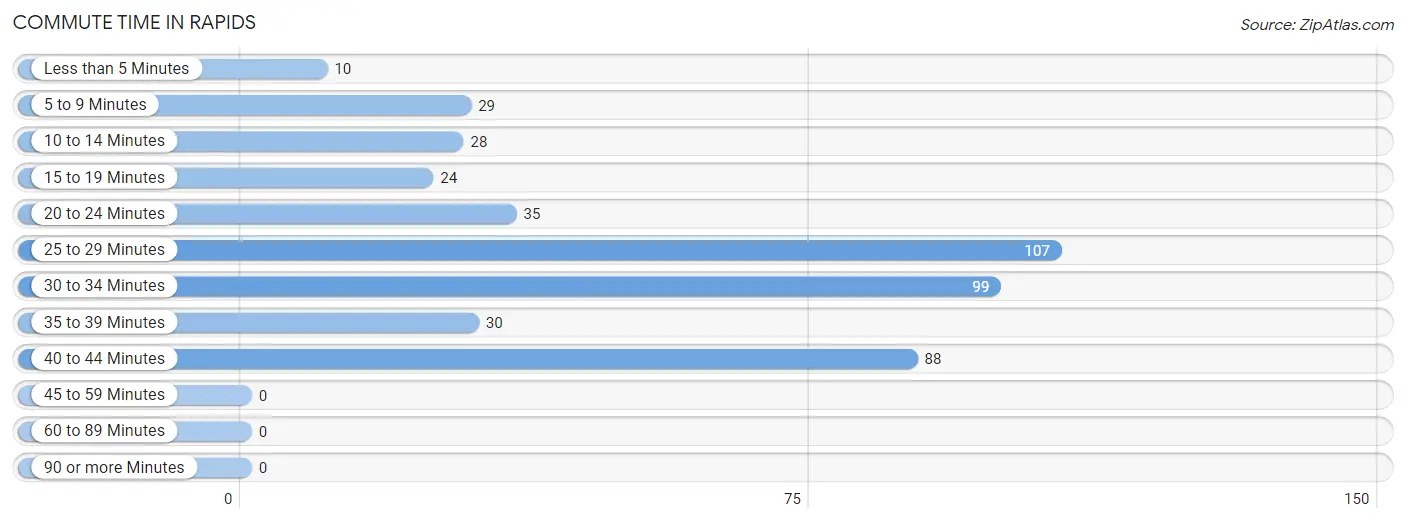
| Commute Time | # Commuters | % Commuters |
| Less than 5 Minutes | 10 | 2.2% |
| 5 to 9 Minutes | 29 | 6.4% |
| 10 to 14 Minutes | 28 | 6.2% |
| 15 to 19 Minutes | 24 | 5.3% |
| 20 to 24 Minutes | 35 | 7.8% |
| 25 to 29 Minutes | 107 | 23.8% |
| 30 to 34 Minutes | 99 | 22.0% |
| 35 to 39 Minutes | 30 | 6.7% |
| 40 to 44 Minutes | 88 | 19.6% |
| 45 to 59 Minutes | 0 | 0.0% |
| 60 to 89 Minutes | 0 | 0.0% |
| 90 or more Minutes | 0 | 0.0% |
Commute Time by Sex in Rapids
The most common commute times in Rapids are 25 to 29 minutes (107 commuters, 40.1%) for males and 40 to 44 minutes (64 commuters, 35.0%) for females.
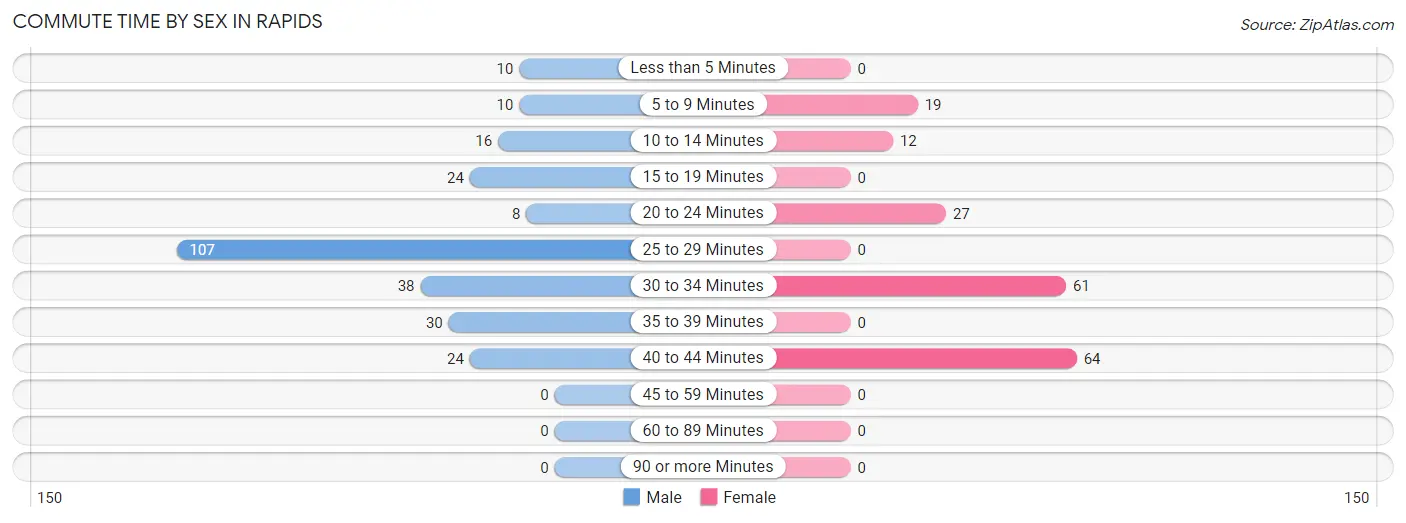
| Commute Time | Male | Female |
| Less than 5 Minutes | 10 (3.7%) | 0 (0.0%) |
| 5 to 9 Minutes | 10 (3.7%) | 19 (10.4%) |
| 10 to 14 Minutes | 16 (6.0%) | 12 (6.6%) |
| 15 to 19 Minutes | 24 (9.0%) | 0 (0.0%) |
| 20 to 24 Minutes | 8 (3.0%) | 27 (14.7%) |
| 25 to 29 Minutes | 107 (40.1%) | 0 (0.0%) |
| 30 to 34 Minutes | 38 (14.2%) | 61 (33.3%) |
| 35 to 39 Minutes | 30 (11.2%) | 0 (0.0%) |
| 40 to 44 Minutes | 24 (9.0%) | 64 (35.0%) |
| 45 to 59 Minutes | 0 (0.0%) | 0 (0.0%) |
| 60 to 89 Minutes | 0 (0.0%) | 0 (0.0%) |
| 90 or more Minutes | 0 (0.0%) | 0 (0.0%) |
Time of Departure to Work by Sex in Rapids
The most frequent times of departure to work in Rapids are 7:30 AM to 7:59 AM (76, 28.5%) for males and 8:00 AM to 8:29 AM (48, 26.2%) for females.
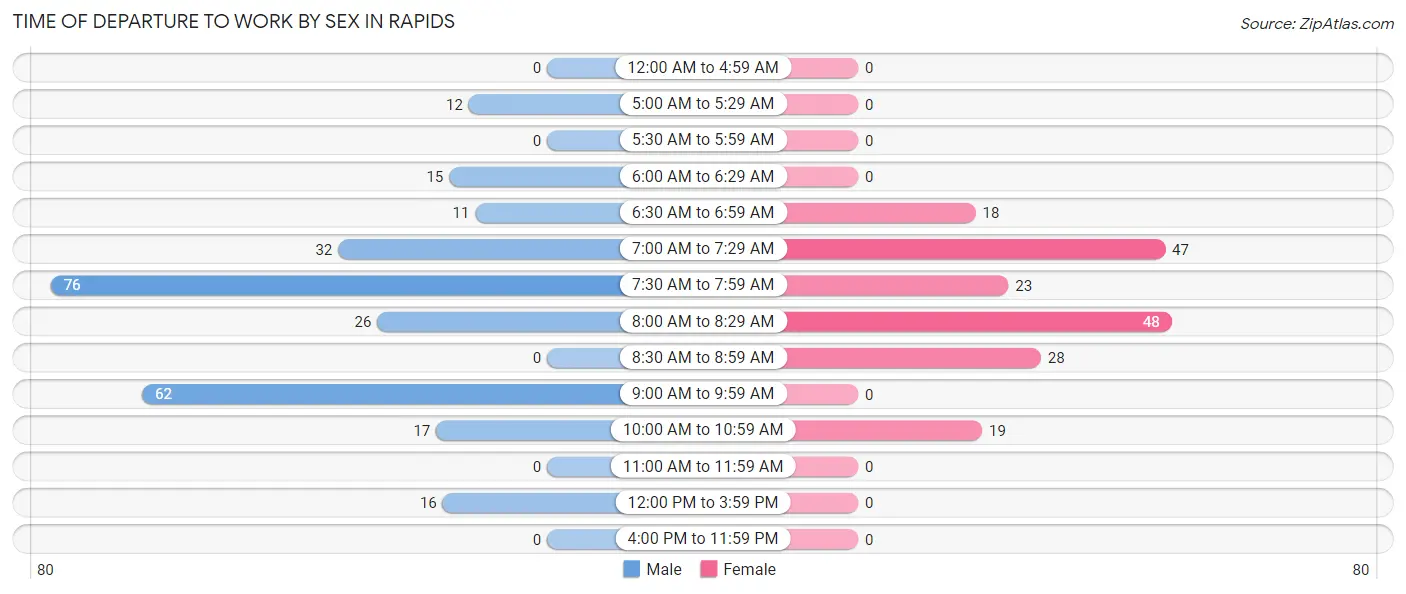
| Time of Departure | Male | Female |
| 12:00 AM to 4:59 AM | 0 (0.0%) | 0 (0.0%) |
| 5:00 AM to 5:29 AM | 12 (4.5%) | 0 (0.0%) |
| 5:30 AM to 5:59 AM | 0 (0.0%) | 0 (0.0%) |
| 6:00 AM to 6:29 AM | 15 (5.6%) | 0 (0.0%) |
| 6:30 AM to 6:59 AM | 11 (4.1%) | 18 (9.8%) |
| 7:00 AM to 7:29 AM | 32 (12.0%) | 47 (25.7%) |
| 7:30 AM to 7:59 AM | 76 (28.5%) | 23 (12.6%) |
| 8:00 AM to 8:29 AM | 26 (9.7%) | 48 (26.2%) |
| 8:30 AM to 8:59 AM | 0 (0.0%) | 28 (15.3%) |
| 9:00 AM to 9:59 AM | 62 (23.2%) | 0 (0.0%) |
| 10:00 AM to 10:59 AM | 17 (6.4%) | 19 (10.4%) |
| 11:00 AM to 11:59 AM | 0 (0.0%) | 0 (0.0%) |
| 12:00 PM to 3:59 PM | 16 (6.0%) | 0 (0.0%) |
| 4:00 PM to 11:59 PM | 0 (0.0%) | 0 (0.0%) |
| Total | 267 (100.0%) | 183 (100.0%) |
Housing Occupancy in Rapids
Occupancy by Ownership in Rapids
Of the total 518 dwellings in Rapids, owner-occupied units account for 510 (98.5%), while renter-occupied units make up 8 (1.5%).
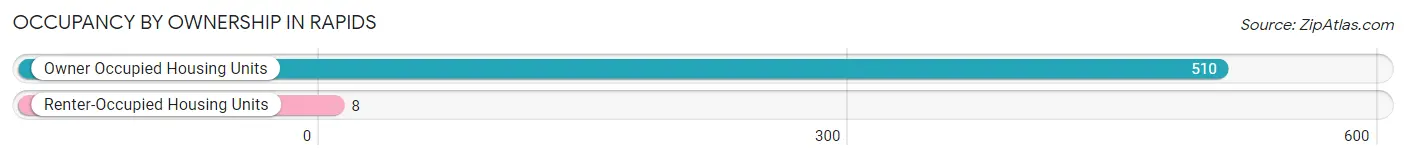
| Occupancy | # Housing Units | % Housing Units |
| Owner Occupied Housing Units | 510 | 98.5% |
| Renter-Occupied Housing Units | 8 | 1.5% |
| Total Occupied Housing Units | 518 | 100.0% |
Occupancy by Household Size in Rapids
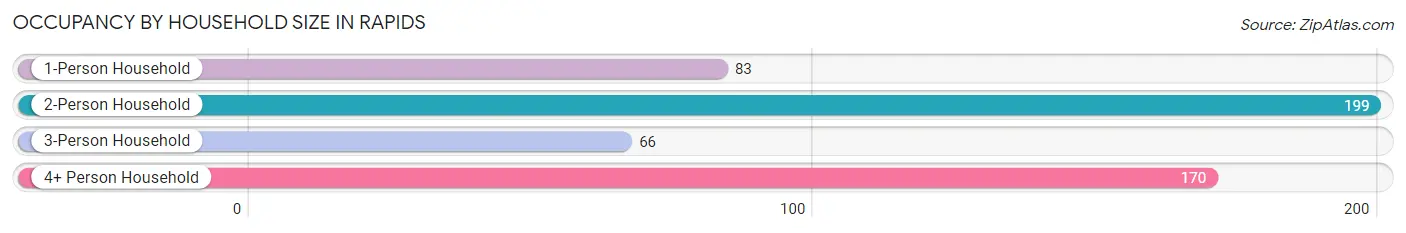
| Household Size | # Housing Units | % Housing Units |
| 1-Person Household | 83 | 16.0% |
| 2-Person Household | 199 | 38.4% |
| 3-Person Household | 66 | 12.7% |
| 4+ Person Household | 170 | 32.8% |
| Total Housing Units | 518 | 100.0% |
Occupancy by Ownership by Household Size in Rapids
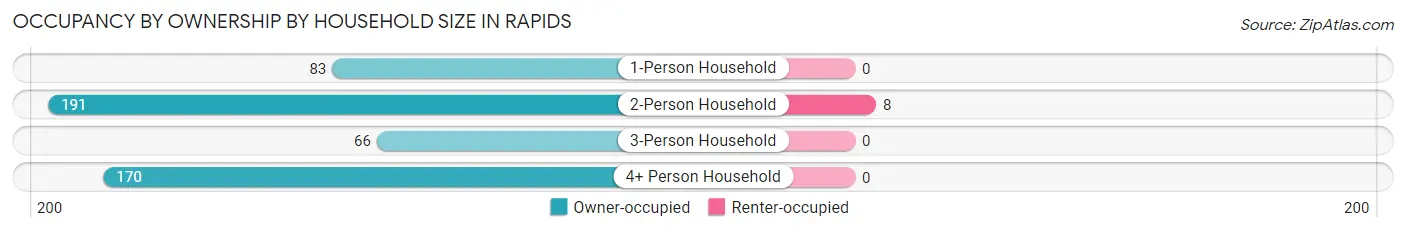
| Household Size | Owner-occupied | Renter-occupied |
| 1-Person Household | 83 (100.0%) | 0 (0.0%) |
| 2-Person Household | 191 (96.0%) | 8 (4.0%) |
| 3-Person Household | 66 (100.0%) | 0 (0.0%) |
| 4+ Person Household | 170 (100.0%) | 0 (0.0%) |
| Total Housing Units | 510 (98.5%) | 8 (1.5%) |
Occupancy by Educational Attainment in Rapids
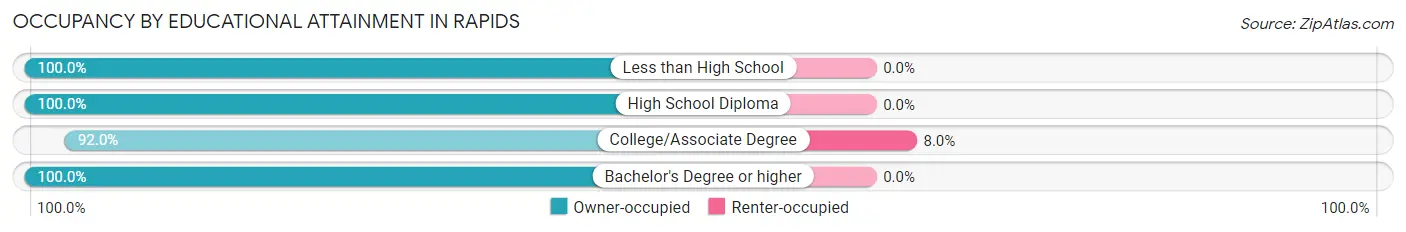
| Household Size | Owner-occupied | Renter-occupied |
| Less than High School | 11 (100.0%) | 0 (0.0%) |
| High School Diploma | 103 (100.0%) | 0 (0.0%) |
| College/Associate Degree | 92 (92.0%) | 8 (8.0%) |
| Bachelor's Degree or higher | 304 (100.0%) | 0 (0.0%) |
Occupancy by Age of Householder in Rapids
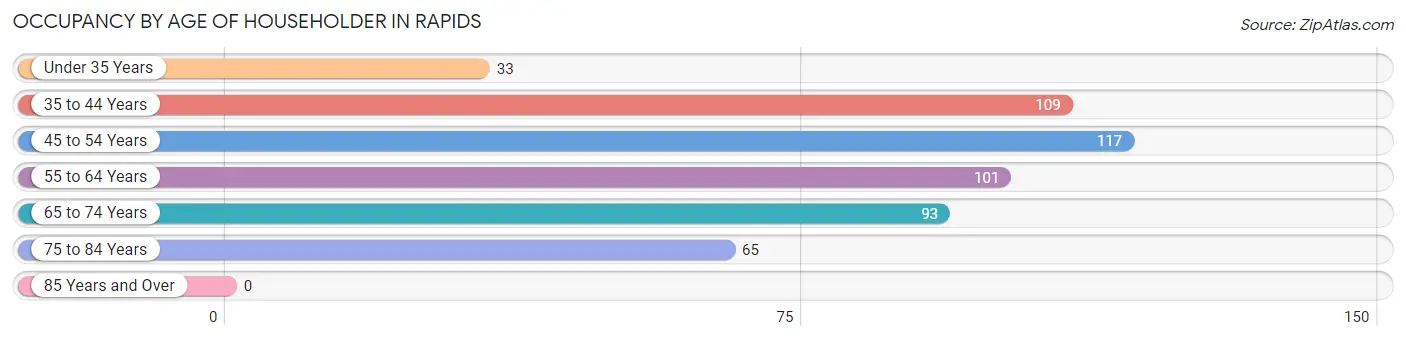
| Age Bracket | # Households | % Households |
| Under 35 Years | 33 | 6.4% |
| 35 to 44 Years | 109 | 21.0% |
| 45 to 54 Years | 117 | 22.6% |
| 55 to 64 Years | 101 | 19.5% |
| 65 to 74 Years | 93 | 17.9% |
| 75 to 84 Years | 65 | 12.6% |
| 85 Years and Over | 0 | 0.0% |
| Total | 518 | 100.0% |
Housing Finances in Rapids
Median Income by Occupancy in Rapids
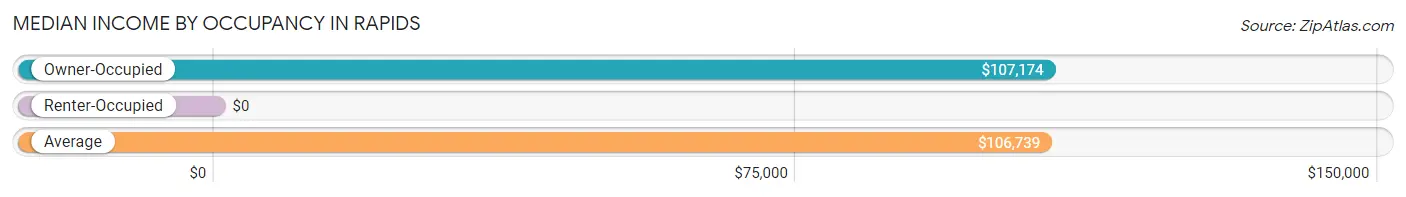
| Occupancy Type | # Households | Median Income |
| Owner-Occupied | 510 (98.5%) | $107,174 |
| Renter-Occupied | 8 (1.5%) | $0 |
| Average | 518 (100.0%) | $106,739 |
Occupancy by Householder Income Bracket in Rapids
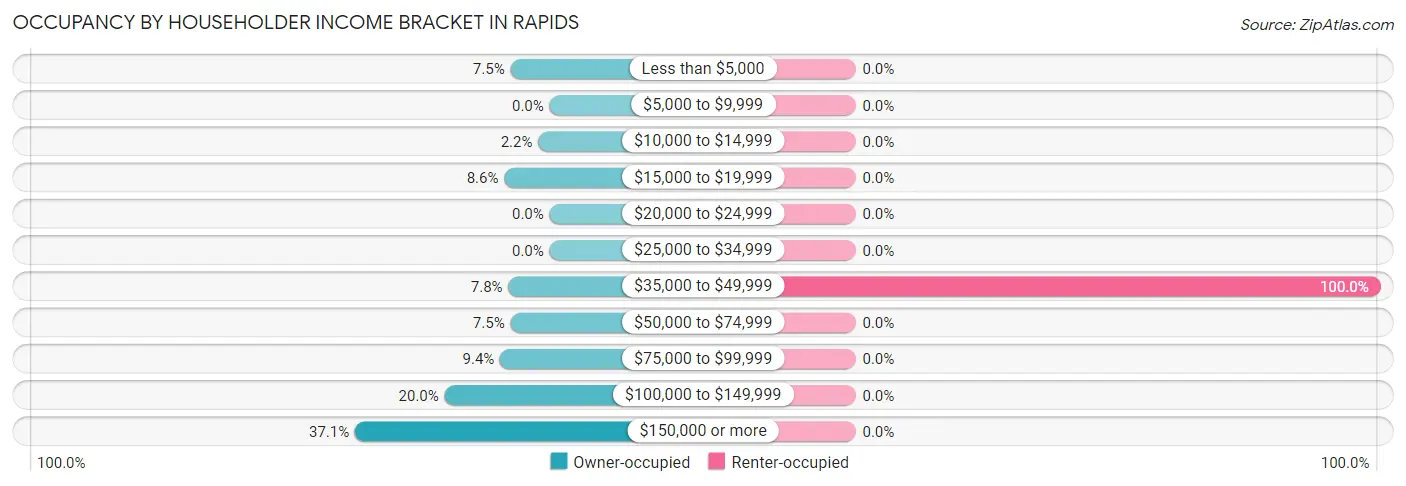
| Income Bracket | Owner-occupied | Renter-occupied |
| Less than $5,000 | 38 (7.4%) | 0 (0.0%) |
| $5,000 to $9,999 | 0 (0.0%) | 0 (0.0%) |
| $10,000 to $14,999 | 11 (2.2%) | 0 (0.0%) |
| $15,000 to $19,999 | 44 (8.6%) | 0 (0.0%) |
| $20,000 to $24,999 | 0 (0.0%) | 0 (0.0%) |
| $25,000 to $34,999 | 0 (0.0%) | 0 (0.0%) |
| $35,000 to $49,999 | 40 (7.8%) | 8 (100.0%) |
| $50,000 to $74,999 | 38 (7.4%) | 0 (0.0%) |
| $75,000 to $99,999 | 48 (9.4%) | 0 (0.0%) |
| $100,000 to $149,999 | 102 (20.0%) | 0 (0.0%) |
| $150,000 or more | 189 (37.1%) | 0 (0.0%) |
| Total | 510 (100.0%) | 8 (100.0%) |
Monthly Housing Cost Tiers in Rapids
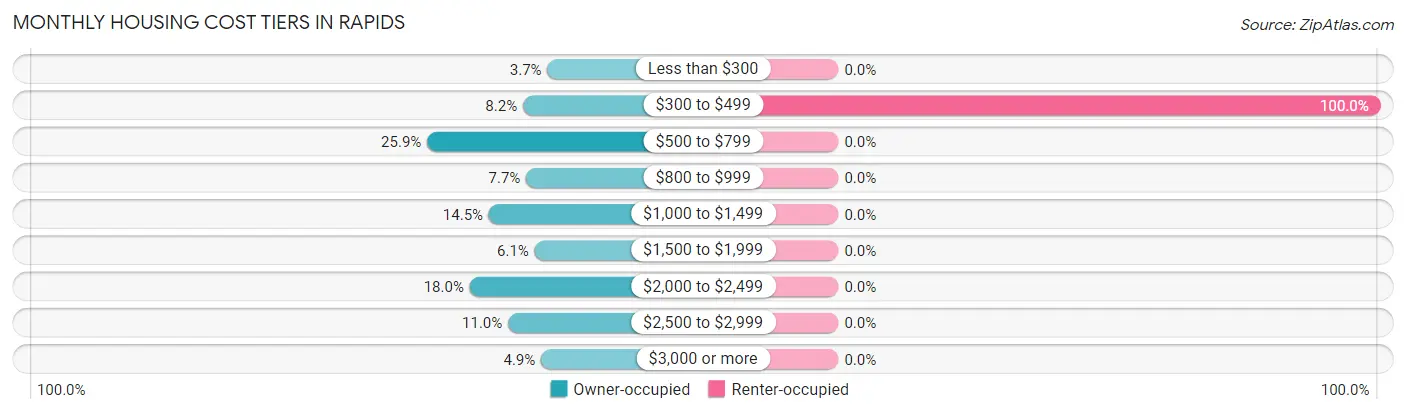
| Monthly Cost | Owner-occupied | Renter-occupied |
| Less than $300 | 19 (3.7%) | 0 (0.0%) |
| $300 to $499 | 42 (8.2%) | 8 (100.0%) |
| $500 to $799 | 132 (25.9%) | 0 (0.0%) |
| $800 to $999 | 39 (7.6%) | 0 (0.0%) |
| $1,000 to $1,499 | 74 (14.5%) | 0 (0.0%) |
| $1,500 to $1,999 | 31 (6.1%) | 0 (0.0%) |
| $2,000 to $2,499 | 92 (18.0%) | 0 (0.0%) |
| $2,500 to $2,999 | 56 (11.0%) | 0 (0.0%) |
| $3,000 or more | 25 (4.9%) | 0 (0.0%) |
| Total | 510 (100.0%) | 8 (100.0%) |
Physical Housing Characteristics in Rapids
Housing Structures in Rapids
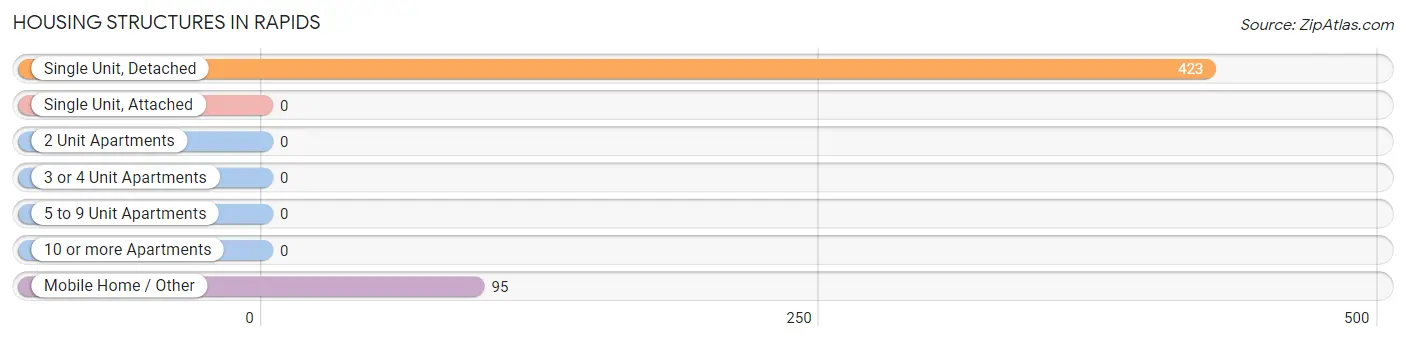
| Structure Type | # Housing Units | % Housing Units |
| Single Unit, Detached | 423 | 81.7% |
| Single Unit, Attached | 0 | 0.0% |
| 2 Unit Apartments | 0 | 0.0% |
| 3 or 4 Unit Apartments | 0 | 0.0% |
| 5 to 9 Unit Apartments | 0 | 0.0% |
| 10 or more Apartments | 0 | 0.0% |
| Mobile Home / Other | 95 | 18.3% |
| Total | 518 | 100.0% |
Housing Structures by Occupancy in Rapids
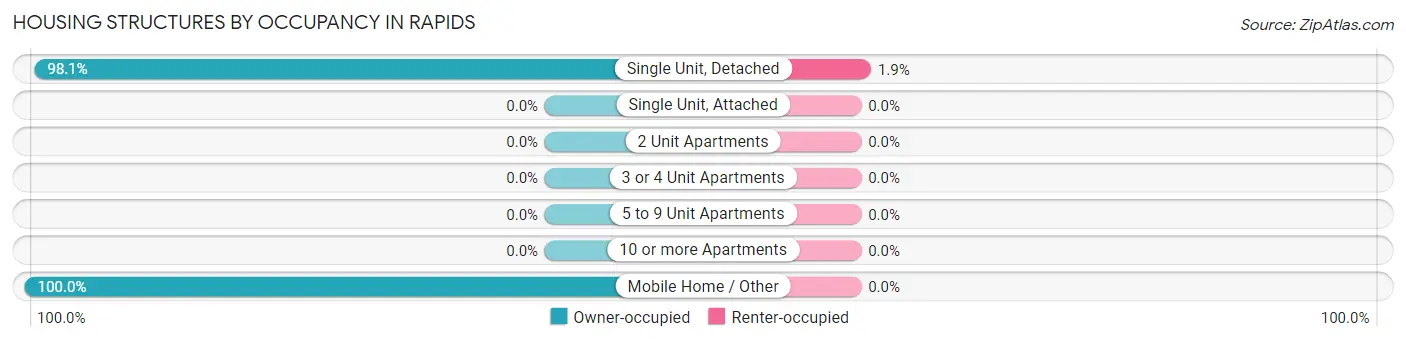
| Structure Type | Owner-occupied | Renter-occupied |
| Single Unit, Detached | 415 (98.1%) | 8 (1.9%) |
| Single Unit, Attached | 0 (0.0%) | 0 (0.0%) |
| 2 Unit Apartments | 0 (0.0%) | 0 (0.0%) |
| 3 or 4 Unit Apartments | 0 (0.0%) | 0 (0.0%) |
| 5 to 9 Unit Apartments | 0 (0.0%) | 0 (0.0%) |
| 10 or more Apartments | 0 (0.0%) | 0 (0.0%) |
| Mobile Home / Other | 95 (100.0%) | 0 (0.0%) |
| Total | 510 (98.5%) | 8 (1.5%) |
Housing Structures by Number of Rooms in Rapids
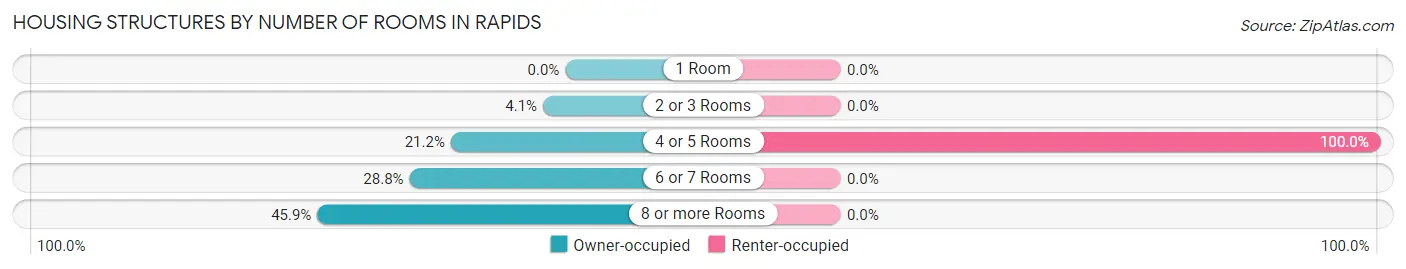
| Number of Rooms | Owner-occupied | Renter-occupied |
| 1 Room | 0 (0.0%) | 0 (0.0%) |
| 2 or 3 Rooms | 21 (4.1%) | 0 (0.0%) |
| 4 or 5 Rooms | 108 (21.2%) | 8 (100.0%) |
| 6 or 7 Rooms | 147 (28.8%) | 0 (0.0%) |
| 8 or more Rooms | 234 (45.9%) | 0 (0.0%) |
| Total | 510 (100.0%) | 8 (100.0%) |
Housing Structure by Heating Type in Rapids
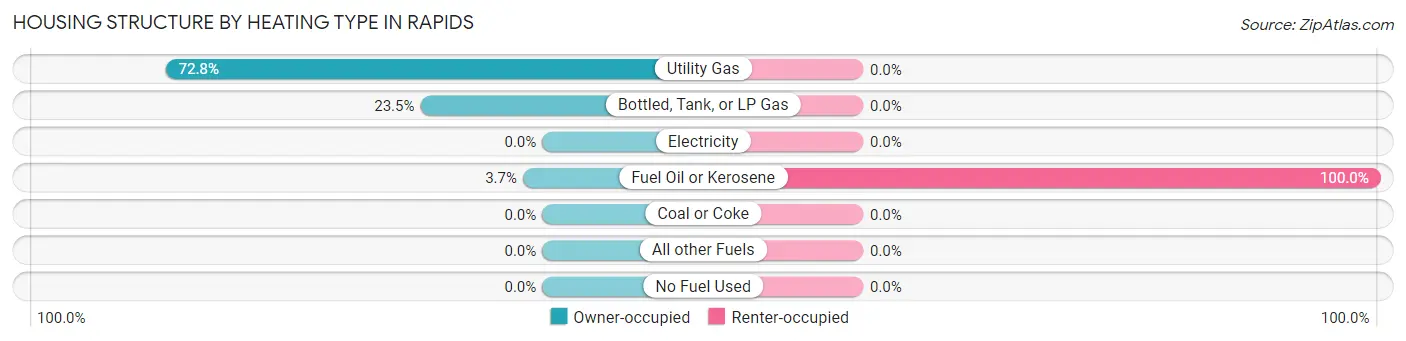
| Heating Type | Owner-occupied | Renter-occupied |
| Utility Gas | 371 (72.8%) | 0 (0.0%) |
| Bottled, Tank, or LP Gas | 120 (23.5%) | 0 (0.0%) |
| Electricity | 0 (0.0%) | 0 (0.0%) |
| Fuel Oil or Kerosene | 19 (3.7%) | 8 (100.0%) |
| Coal or Coke | 0 (0.0%) | 0 (0.0%) |
| All other Fuels | 0 (0.0%) | 0 (0.0%) |
| No Fuel Used | 0 (0.0%) | 0 (0.0%) |
| Total | 510 (100.0%) | 8 (100.0%) |
Household Vehicle Usage in Rapids
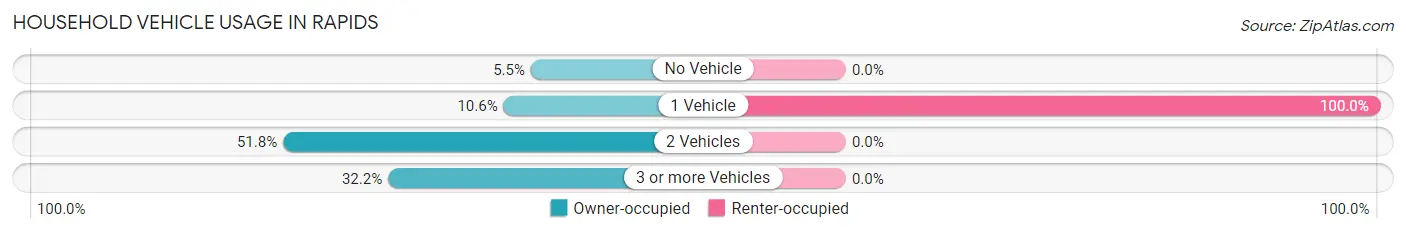
| Vehicles per Household | Owner-occupied | Renter-occupied |
| No Vehicle | 28 (5.5%) | 0 (0.0%) |
| 1 Vehicle | 54 (10.6%) | 8 (100.0%) |
| 2 Vehicles | 264 (51.8%) | 0 (0.0%) |
| 3 or more Vehicles | 164 (32.2%) | 0 (0.0%) |
| Total | 510 (100.0%) | 8 (100.0%) |
Real Estate & Mortgages in Rapids
Real Estate and Mortgage Overview in Rapids
| Characteristic | Without Mortgage | With Mortgage |
| Housing Units | 284 | 226 |
| Median Property Value | - | - |
| Median Household Income | $65,357 | $137 |
| Monthly Housing Costs | $619 | $25 |
| Real Estate Taxes | $3,949 | $0 |
Property Value by Mortgage Status in Rapids
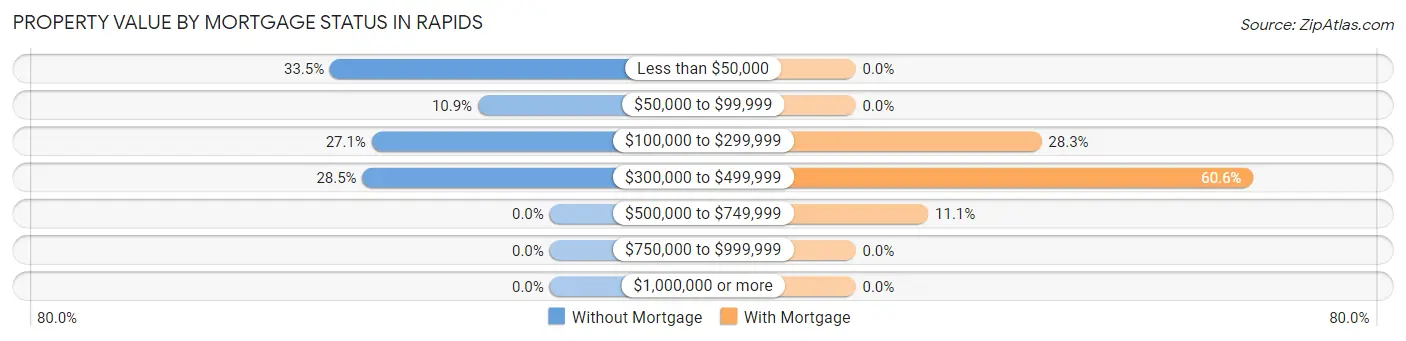
| Property Value | Without Mortgage | With Mortgage |
| Less than $50,000 | 95 (33.5%) | 0 (0.0%) |
| $50,000 to $99,999 | 31 (10.9%) | 0 (0.0%) |
| $100,000 to $299,999 | 77 (27.1%) | 64 (28.3%) |
| $300,000 to $499,999 | 81 (28.5%) | 137 (60.6%) |
| $500,000 to $749,999 | 0 (0.0%) | 25 (11.1%) |
| $750,000 to $999,999 | 0 (0.0%) | 0 (0.0%) |
| $1,000,000 or more | 0 (0.0%) | 0 (0.0%) |
| Total | 284 (100.0%) | 226 (100.0%) |
Household Income by Mortgage Status in Rapids
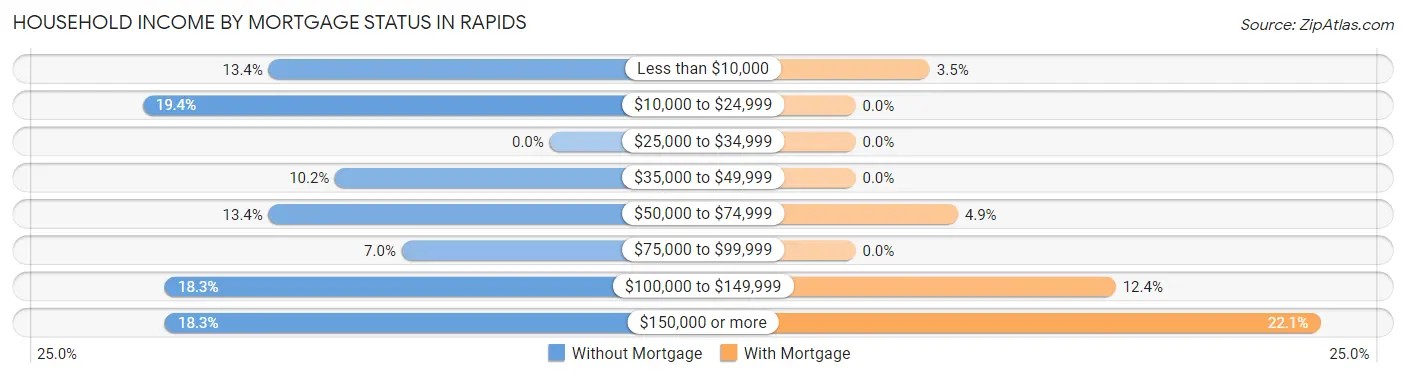
| Household Income | Without Mortgage | With Mortgage |
| Less than $10,000 | 38 (13.4%) | 8 (3.5%) |
| $10,000 to $24,999 | 55 (19.4%) | 0 (0.0%) |
| $25,000 to $34,999 | 0 (0.0%) | 0 (0.0%) |
| $35,000 to $49,999 | 29 (10.2%) | 0 (0.0%) |
| $50,000 to $74,999 | 38 (13.4%) | 11 (4.9%) |
| $75,000 to $99,999 | 20 (7.0%) | 0 (0.0%) |
| $100,000 to $149,999 | 52 (18.3%) | 28 (12.4%) |
| $150,000 or more | 52 (18.3%) | 50 (22.1%) |
| Total | 284 (100.0%) | 226 (100.0%) |
Property Value to Household Income Ratio in Rapids
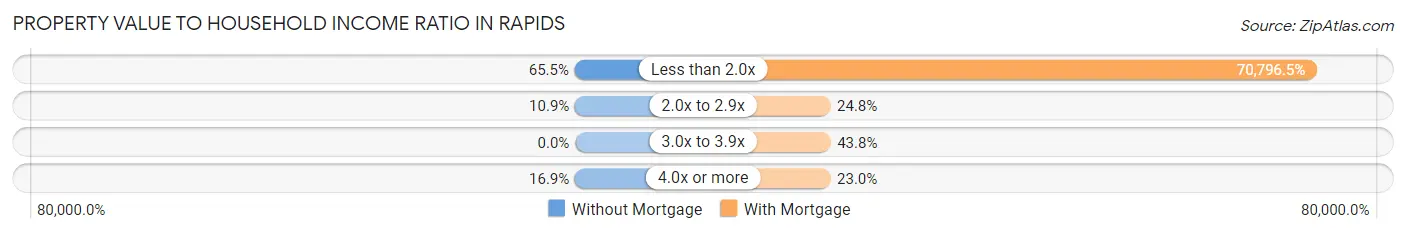
| Value-to-Income Ratio | Without Mortgage | With Mortgage |
| Less than 2.0x | 186 (65.5%) | 160,000 (70,796.5%) |
| 2.0x to 2.9x | 31 (10.9%) | 56 (24.8%) |
| 3.0x to 3.9x | 0 (0.0%) | 99 (43.8%) |
| 4.0x or more | 48 (16.9%) | 52 (23.0%) |
| Total | 284 (100.0%) | 226 (100.0%) |
Real Estate Taxes by Mortgage Status in Rapids
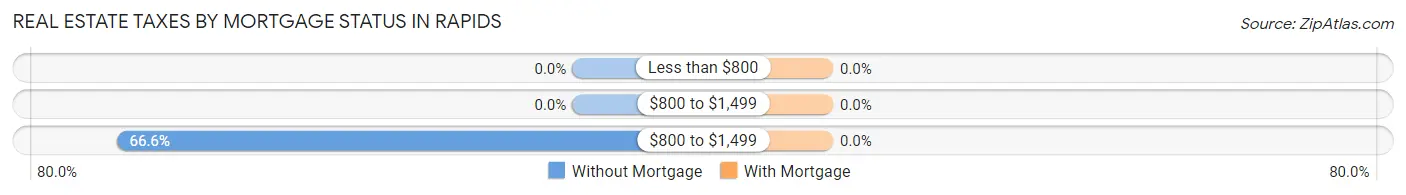
| Property Taxes | Without Mortgage | With Mortgage |
| Less than $800 | 0 (0.0%) | 0 (0.0%) |
| $800 to $1,499 | 0 (0.0%) | 0 (0.0%) |
| $800 to $1,499 | 189 (66.5%) | 0 (0.0%) |
| Total | 284 (100.0%) | 226 (100.0%) |
Health & Disability in Rapids
Health Insurance Coverage by Age in Rapids
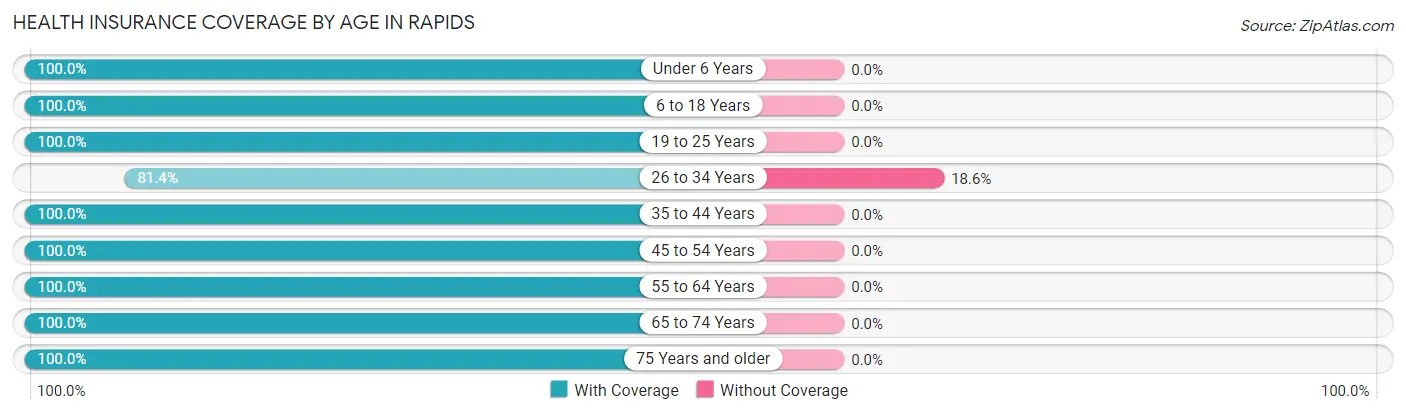
| Age Bracket | With Coverage | Without Coverage |
| Under 6 Years | 115 (100.0%) | 0 (0.0%) |
| 6 to 18 Years | 249 (100.0%) | 0 (0.0%) |
| 19 to 25 Years | 90 (100.0%) | 0 (0.0%) |
| 26 to 34 Years | 83 (81.4%) | 19 (18.6%) |
| 35 to 44 Years | 216 (100.0%) | 0 (0.0%) |
| 45 to 54 Years | 199 (100.0%) | 0 (0.0%) |
| 55 to 64 Years | 159 (100.0%) | 0 (0.0%) |
| 65 to 74 Years | 185 (100.0%) | 0 (0.0%) |
| 75 Years and older | 65 (100.0%) | 0 (0.0%) |
| Total | 1,361 (98.6%) | 19 (1.4%) |
Health Insurance Coverage by Citizenship Status in Rapids
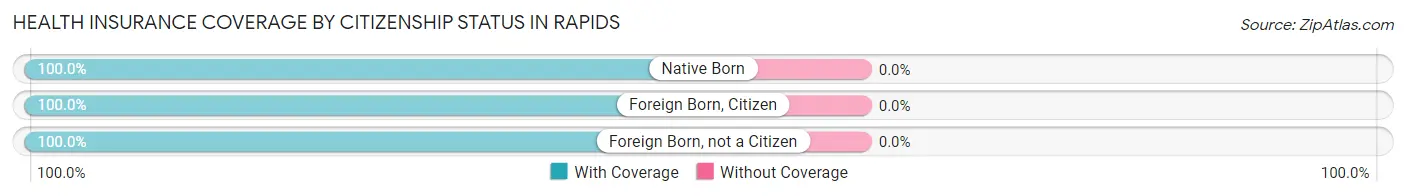
| Citizenship Status | With Coverage | Without Coverage |
| Native Born | 115 (100.0%) | 0 (0.0%) |
| Foreign Born, Citizen | 249 (100.0%) | 0 (0.0%) |
| Foreign Born, not a Citizen | 90 (100.0%) | 0 (0.0%) |
Health Insurance Coverage by Household Income in Rapids
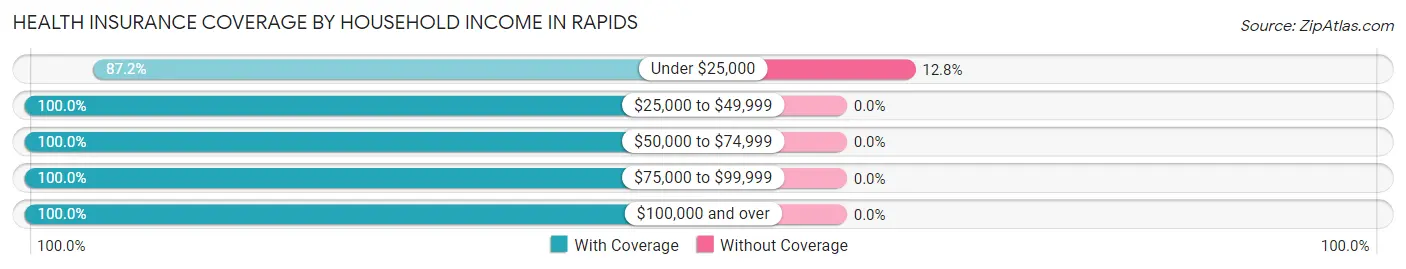
| Household Income | With Coverage | Without Coverage |
| Under $25,000 | 129 (87.2%) | 19 (12.8%) |
| $25,000 to $49,999 | 100 (100.0%) | 0 (0.0%) |
| $50,000 to $74,999 | 76 (100.0%) | 0 (0.0%) |
| $75,000 to $99,999 | 90 (100.0%) | 0 (0.0%) |
| $100,000 and over | 966 (100.0%) | 0 (0.0%) |
Public vs Private Health Insurance Coverage by Age in Rapids
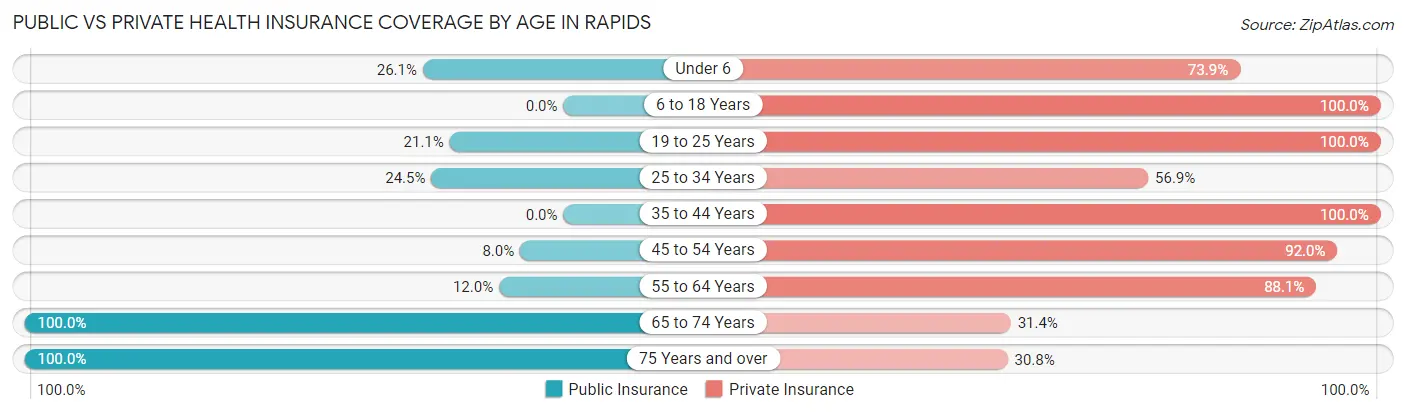
| Age Bracket | Public Insurance | Private Insurance |
| Under 6 | 30 (26.1%) | 85 (73.9%) |
| 6 to 18 Years | 0 (0.0%) | 249 (100.0%) |
| 19 to 25 Years | 19 (21.1%) | 90 (100.0%) |
| 25 to 34 Years | 25 (24.5%) | 58 (56.9%) |
| 35 to 44 Years | 0 (0.0%) | 216 (100.0%) |
| 45 to 54 Years | 16 (8.0%) | 183 (92.0%) |
| 55 to 64 Years | 19 (11.9%) | 140 (88.0%) |
| 65 to 74 Years | 185 (100.0%) | 58 (31.4%) |
| 75 Years and over | 65 (100.0%) | 20 (30.8%) |
| Total | 359 (26.0%) | 1,099 (79.6%) |
Disability Status by Sex by Age in Rapids
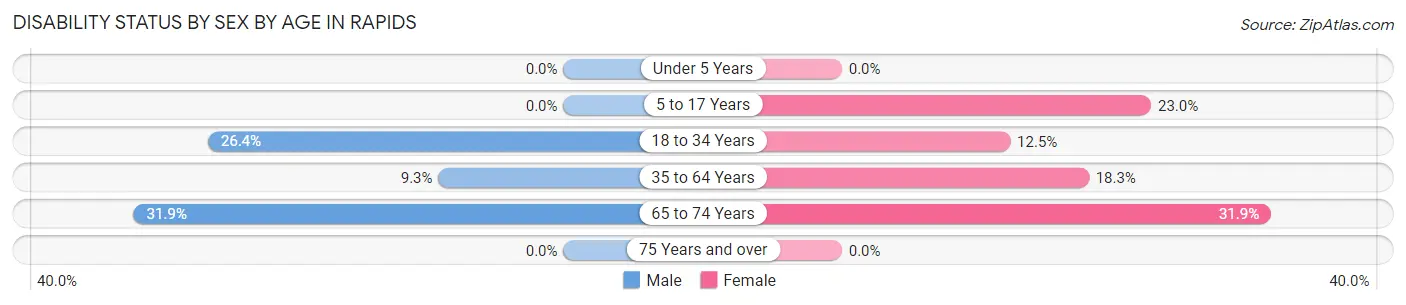
| Age Bracket | Male | Female |
| Under 5 Years | 0 (0.0%) | 0 (0.0%) |
| 5 to 17 Years | 0 (0.0%) | 45 (23.0%) |
| 18 to 34 Years | 19 (26.4%) | 15 (12.5%) |
| 35 to 64 Years | 31 (9.3%) | 44 (18.3%) |
| 65 to 74 Years | 30 (31.9%) | 29 (31.9%) |
| 75 Years and over | 0 (0.0%) | 0 (0.0%) |
Disability Class by Sex by Age in Rapids
Disability Class: Hearing Difficulty
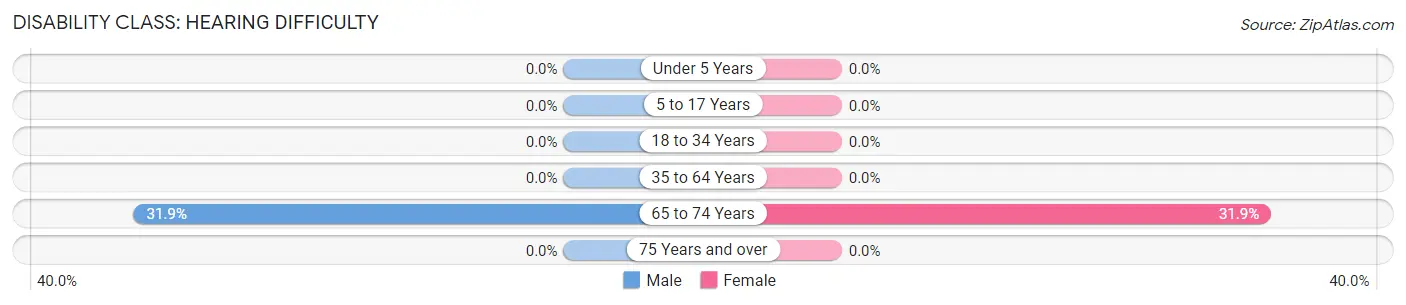
| Age Bracket | Male | Female |
| Under 5 Years | 0 (0.0%) | 0 (0.0%) |
| 5 to 17 Years | 0 (0.0%) | 0 (0.0%) |
| 18 to 34 Years | 0 (0.0%) | 0 (0.0%) |
| 35 to 64 Years | 0 (0.0%) | 0 (0.0%) |
| 65 to 74 Years | 30 (31.9%) | 29 (31.9%) |
| 75 Years and over | 0 (0.0%) | 0 (0.0%) |
Disability Class: Vision Difficulty
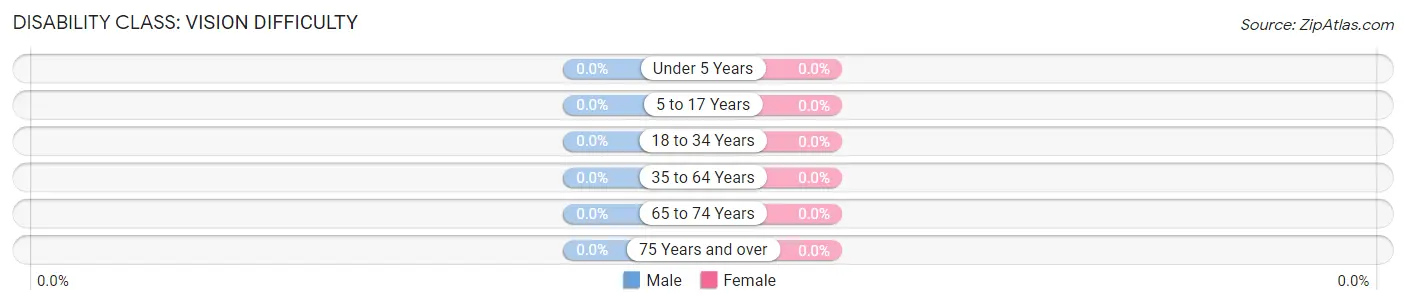
| Age Bracket | Male | Female |
| Under 5 Years | 0 (0.0%) | 0 (0.0%) |
| 5 to 17 Years | 0 (0.0%) | 0 (0.0%) |
| 18 to 34 Years | 0 (0.0%) | 0 (0.0%) |
| 35 to 64 Years | 0 (0.0%) | 0 (0.0%) |
| 65 to 74 Years | 0 (0.0%) | 0 (0.0%) |
| 75 Years and over | 0 (0.0%) | 0 (0.0%) |
Disability Class: Cognitive Difficulty
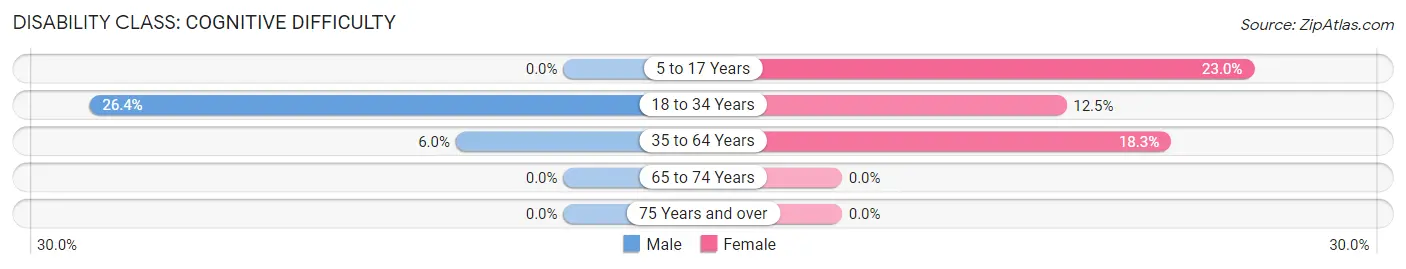
| Age Bracket | Male | Female |
| 5 to 17 Years | 0 (0.0%) | 45 (23.0%) |
| 18 to 34 Years | 19 (26.4%) | 15 (12.5%) |
| 35 to 64 Years | 20 (6.0%) | 44 (18.3%) |
| 65 to 74 Years | 0 (0.0%) | 0 (0.0%) |
| 75 Years and over | 0 (0.0%) | 0 (0.0%) |
Disability Class: Ambulatory Difficulty
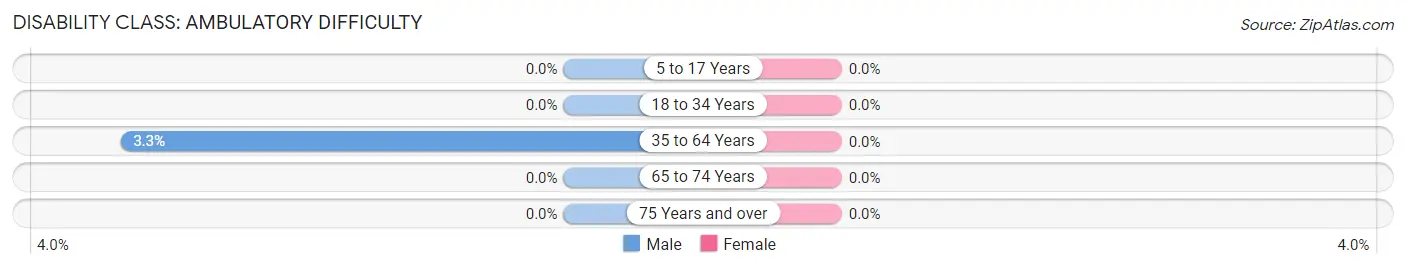
| Age Bracket | Male | Female |
| 5 to 17 Years | 0 (0.0%) | 0 (0.0%) |
| 18 to 34 Years | 0 (0.0%) | 0 (0.0%) |
| 35 to 64 Years | 11 (3.3%) | 0 (0.0%) |
| 65 to 74 Years | 0 (0.0%) | 0 (0.0%) |
| 75 Years and over | 0 (0.0%) | 0 (0.0%) |
Disability Class: Self-Care Difficulty
| Age Bracket | Male | Female |
| 5 to 17 Years | 0 (0.0%) | 0 (0.0%) |
| 18 to 34 Years | 0 (0.0%) | 0 (0.0%) |
| 35 to 64 Years | 0 (0.0%) | 0 (0.0%) |
| 65 to 74 Years | 0 (0.0%) | 0 (0.0%) |
| 75 Years and over | 0 (0.0%) | 0 (0.0%) |
Technology Access in Rapids
Computing Device Access in Rapids
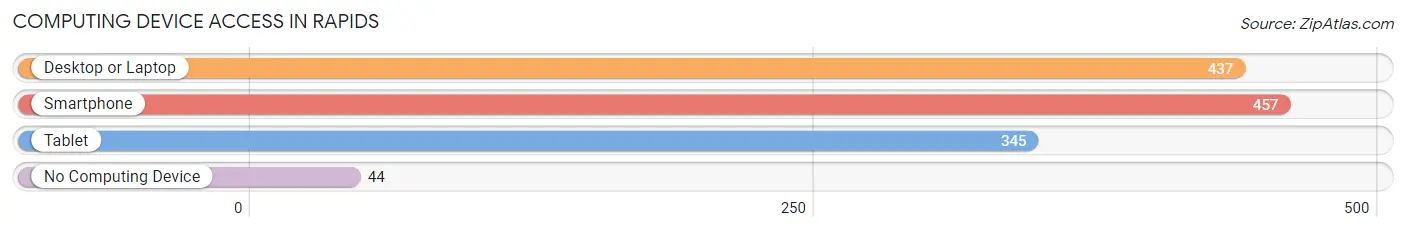
| Device Type | # Households | % Households |
| Desktop or Laptop | 437 | 84.4% |
| Smartphone | 457 | 88.2% |
| Tablet | 345 | 66.6% |
| No Computing Device | 44 | 8.5% |
| Total | 518 | 100.0% |
Internet Access in Rapids
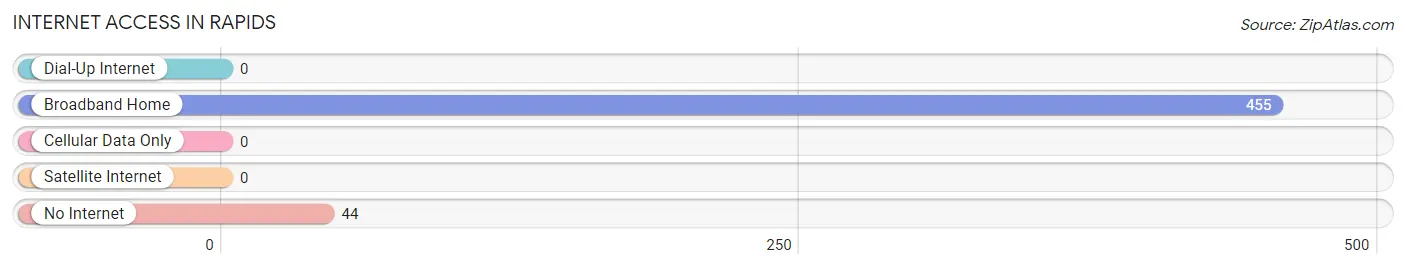
| Internet Type | # Households | % Households |
| Dial-Up Internet | 0 | 0.0% |
| Broadband Home | 455 | 87.8% |
| Cellular Data Only | 0 | 0.0% |
| Satellite Internet | 0 | 0.0% |
| No Internet | 44 | 8.5% |
| Total | 518 | 100.0% |
Rapids Summary
Rapids, New York is a small town located in Niagara County, New York. It is situated on the Niagara River, just south of Niagara Falls. The town was first settled in 1805 and was incorporated in 1812. Rapids is a small, rural community with a population of just over 1,000 people.
Geography
Rapids is located in the Niagara River Valley, which is part of the Great Lakes region. The town is situated on the Niagara River, just south of Niagara Falls. The Niagara River is a major waterway that connects Lake Erie and Lake Ontario. Rapids is bordered by the towns of Lewiston to the north, Porter to the east, and Niagara Falls to the south. The town is also home to the Rapids Dam, which was built in 1817 to provide power for the local mills.
The terrain of Rapids is mostly flat, with some rolling hills. The town is located in a temperate climate, with hot summers and cold winters. The average annual temperature is around 50 degrees Fahrenheit.
Economy
Rapids is a small, rural community with a limited economy. The town is home to several small businesses, including a few restaurants, a grocery store, and a few retail stores. The town is also home to a few manufacturing companies, including a paper mill and a plastics factory.
The town is also home to a few tourist attractions, including the Rapids Dam, the Niagara River, and the Niagara Falls. Tourism is an important part of the local economy, as visitors come to the area to take in the sights and enjoy the natural beauty of the area.
Demographics
As of the 2010 census, Rapids had a population of 1,072 people. The population is predominantly white, with a small percentage of African Americans, Hispanics, and Asians. The median household income is $41,250, and the median home value is $117,000.
The town is home to a few churches, including the Rapids United Methodist Church, the Rapids Baptist Church, and the Rapids Presbyterian Church. The town also has a few schools, including Rapids Elementary School and Rapids High School.
Conclusion
Rapids, New York is a small, rural community located in Niagara County, New York. It is situated on the Niagara River, just south of Niagara Falls. The town was first settled in 1805 and was incorporated in 1812. Rapids is a small, rural community with a population of just over 1,000 people. The town is home to a few small businesses, manufacturing companies, and tourist attractions. The population is predominantly white, with a small percentage of African Americans, Hispanics, and Asians. The town is home to a few churches and schools. Tourism is an important part of the local economy, as visitors come to the area to take in the sights and enjoy the natural beauty of the area.
Common Questions
What is Per Capita Income in Rapids?
Per Capita income in Rapids is $49,379.
What is the Median Family Income in Rapids?
Median Family Income in Rapids is $119,115.
What is the Median Household income in Rapids?
Median Household Income in Rapids is $106,739.
What is Income or Wage Gap in Rapids?
Income or Wage Gap in Rapids is 60.0%.
Women in Rapids earn 40.0 cents for every dollar earned by a man.
What is Inequality or Gini Index in Rapids?
Inequality or Gini Index in Rapids is 0.44.
What is the Total Population of Rapids?
Total Population of Rapids is 1,380.
What is the Total Male Population of Rapids?
Total Male Population of Rapids is 675.
What is the Total Female Population of Rapids?
Total Female Population of Rapids is 705.
What is the Ratio of Males per 100 Females in Rapids?
There are 95.74 Males per 100 Females in Rapids.
What is the Ratio of Females per 100 Males in Rapids?
There are 104.44 Females per 100 Males in Rapids.
What is the Median Population Age in Rapids?
Median Population Age in Rapids is 40.3 Years.
What is the Average Family Size in Rapids
Average Family Size in Rapids is 3.0 People.
What is the Average Household Size in Rapids
Average Household Size in Rapids is 2.7 People.
How Large is the Labor Force in Rapids?
There are 604 People in the Labor Forcein in Rapids.
What is the Percentage of People in the Labor Force in Rapids?
56.1% of People are in the Labor Force in Rapids.
What is the Unemployment Rate in Rapids?
Unemployment Rate in Rapids is 6.1%.