Portville, NY Map & Demographics
Portville Map
Portville Overview
$34,824
PER CAPITA INCOME
$81,538
AVG FAMILY INCOME
$59,500
AVG HOUSEHOLD INCOME
41.4%
WAGE / INCOME GAP [ % ]
58.6¢/ $1
WAGE / INCOME GAP [ $ ]
0.48
INEQUALITY / GINI INDEX
885
TOTAL POPULATION
401
MALE POPULATION
484
FEMALE POPULATION
82.85
MALES / 100 FEMALES
120.70
FEMALES / 100 MALES
46.2
MEDIAN AGE
3.1
AVG FAMILY SIZE
2.4
AVG HOUSEHOLD SIZE
423
LABOR FORCE [ PEOPLE ]
59.0%
PERCENT IN LABOR FORCE
6.1%
UNEMPLOYMENT RATE
Portville Zip Codes
Income in Portville
Income Overview in Portville
Per Capita Income in Portville is $34,824, while median incomes of families and households are $81,538 and $59,500 respectively.
| Characteristic | Number | Measure |
| Per Capita Income | 885 | $34,824 |
| Median Family Income | 230 | $81,538 |
| Mean Family Income | 230 | $105,928 |
| Median Household Income | 374 | $59,500 |
| Mean Household Income | 374 | $80,511 |
| Income Deficit | 230 | $0 |
| Wage / Income Gap (%) | 885 | 41.37% |
| Wage / Income Gap ($) | 885 | 58.63¢ per $1 |
| Gini / Inequality Index | 885 | 0.48 |
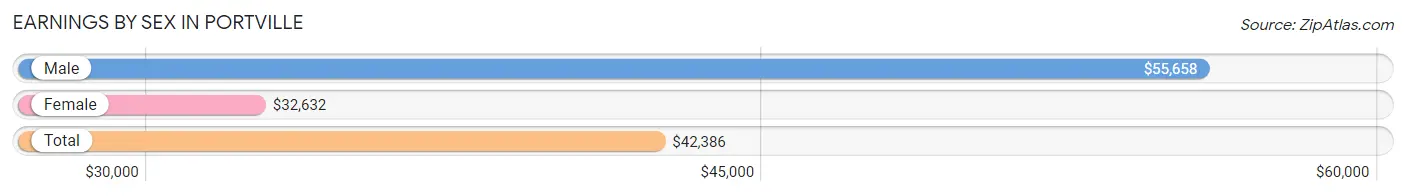
Earnings by Sex in Portville
Average Earnings in Portville are $42,386, $55,658 for men and $32,632 for women, a difference of 41.4%.
| Sex | Number | Average Earnings |
| Male | 216 (50.2%) | $55,658 |
| Female | 214 (49.8%) | $32,632 |
| Total | 430 (100.0%) | $42,386 |
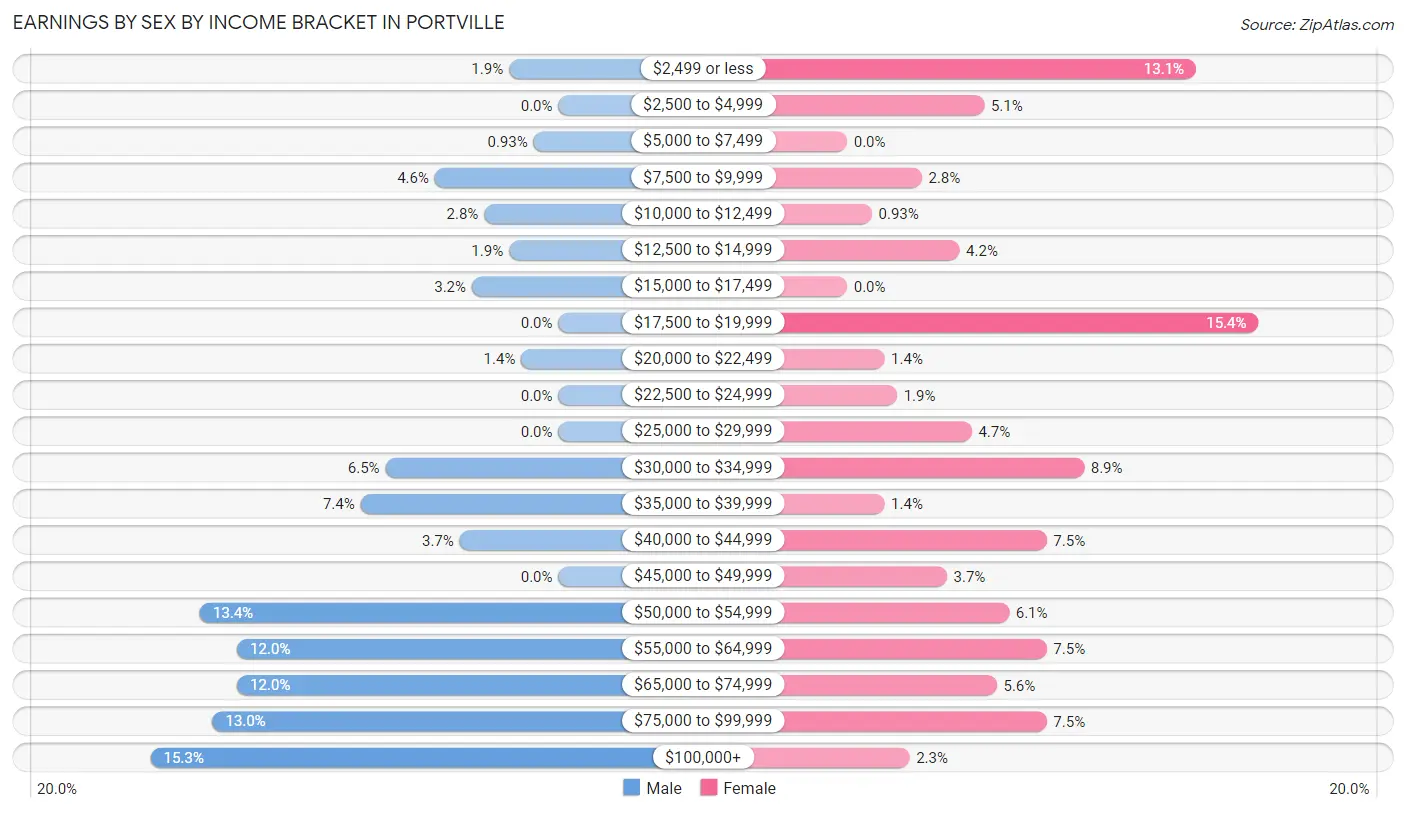
Earnings by Sex by Income Bracket in Portville
The most common earnings brackets in Portville are $100,000+ for men (33 | 15.3%) and $17,500 to $19,999 for women (33 | 15.4%).
| Income | Male | Female |
| $2,499 or less | 4 (1.8%) | 28 (13.1%) |
| $2,500 to $4,999 | 0 (0.0%) | 11 (5.1%) |
| $5,000 to $7,499 | 2 (0.9%) | 0 (0.0%) |
| $7,500 to $9,999 | 10 (4.6%) | 6 (2.8%) |
| $10,000 to $12,499 | 6 (2.8%) | 2 (0.9%) |
| $12,500 to $14,999 | 4 (1.8%) | 9 (4.2%) |
| $15,000 to $17,499 | 7 (3.2%) | 0 (0.0%) |
| $17,500 to $19,999 | 0 (0.0%) | 33 (15.4%) |
| $20,000 to $22,499 | 3 (1.4%) | 3 (1.4%) |
| $22,500 to $24,999 | 0 (0.0%) | 4 (1.9%) |
| $25,000 to $29,999 | 0 (0.0%) | 10 (4.7%) |
| $30,000 to $34,999 | 14 (6.5%) | 19 (8.9%) |
| $35,000 to $39,999 | 16 (7.4%) | 3 (1.4%) |
| $40,000 to $44,999 | 8 (3.7%) | 16 (7.5%) |
| $45,000 to $49,999 | 0 (0.0%) | 8 (3.7%) |
| $50,000 to $54,999 | 29 (13.4%) | 13 (6.1%) |
| $55,000 to $64,999 | 26 (12.0%) | 16 (7.5%) |
| $65,000 to $74,999 | 26 (12.0%) | 12 (5.6%) |
| $75,000 to $99,999 | 28 (13.0%) | 16 (7.5%) |
| $100,000+ | 33 (15.3%) | 5 (2.3%) |
| Total | 216 (100.0%) | 214 (100.0%) |
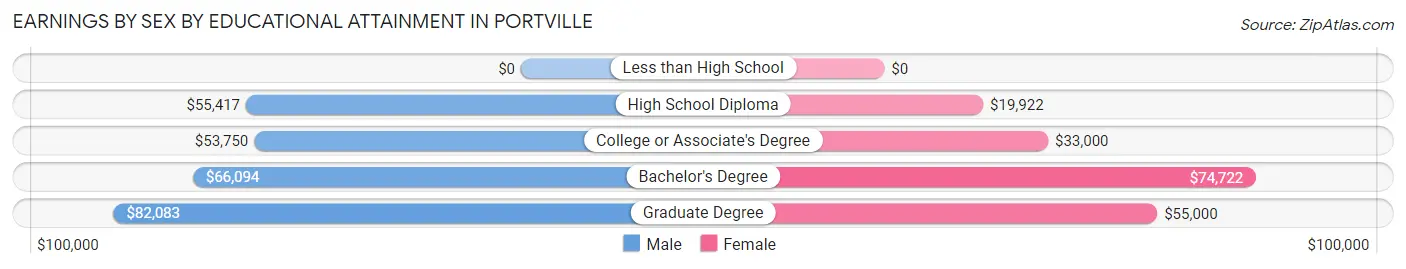
Earnings by Sex by Educational Attainment in Portville
Average earnings in Portville are $56,908 for men and $36,250 for women, a difference of 36.3%. Men with an educational attainment of graduate degree enjoy the highest average annual earnings of $82,083, while those with college or associate's degree education earn the least with $53,750. Women with an educational attainment of bachelor's degree earn the most with the average annual earnings of $74,722, while those with high school diploma education have the smallest earnings of $19,922.
| Educational Attainment | Male Income | Female Income |
| Less than High School | - | - |
| High School Diploma | $55,417 | $19,922 |
| College or Associate's Degree | $53,750 | $33,000 |
| Bachelor's Degree | $66,094 | $74,722 |
| Graduate Degree | $82,083 | $55,000 |
| Total | $56,908 | $36,250 |
Family Income in Portville
Family Income Brackets in Portville
According to the Portville family income data, there are 60 families falling into the $50,000 to $74,999 income range, which is the most common income bracket and makes up 26.1% of all families. Conversely, the less than $10,000 income bracket is the least frequent group with only 3 families (1.3%) belonging to this category.
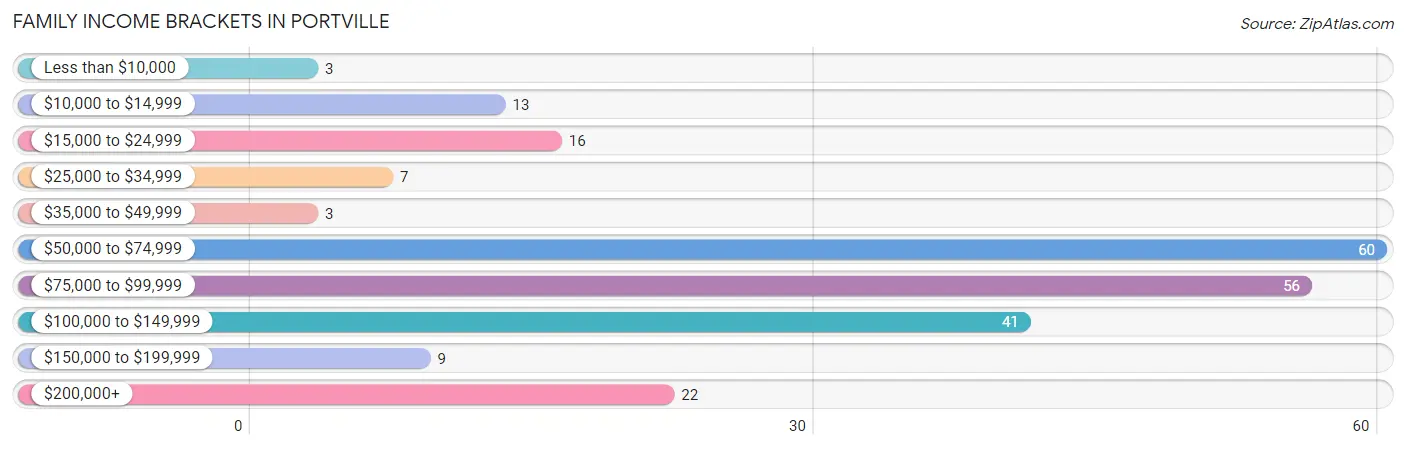
| Income Bracket | # Families | % Families |
| Less than $10,000 | 3 | 1.3% |
| $10,000 to $14,999 | 13 | 5.7% |
| $15,000 to $24,999 | 16 | 7.0% |
| $25,000 to $34,999 | 7 | 3.0% |
| $35,000 to $49,999 | 3 | 1.3% |
| $50,000 to $74,999 | 60 | 26.1% |
| $75,000 to $99,999 | 56 | 24.3% |
| $100,000 to $149,999 | 41 | 17.8% |
| $150,000 to $199,999 | 9 | 3.9% |
| $200,000+ | 22 | 9.6% |
Family Income by Famaliy Size in Portville
5-person families (11 | 4.8%) account for the highest median family income in Portville with $117,917 per family, while 2-person families (90 | 39.1%) have the highest median income of $36,875 per family member.
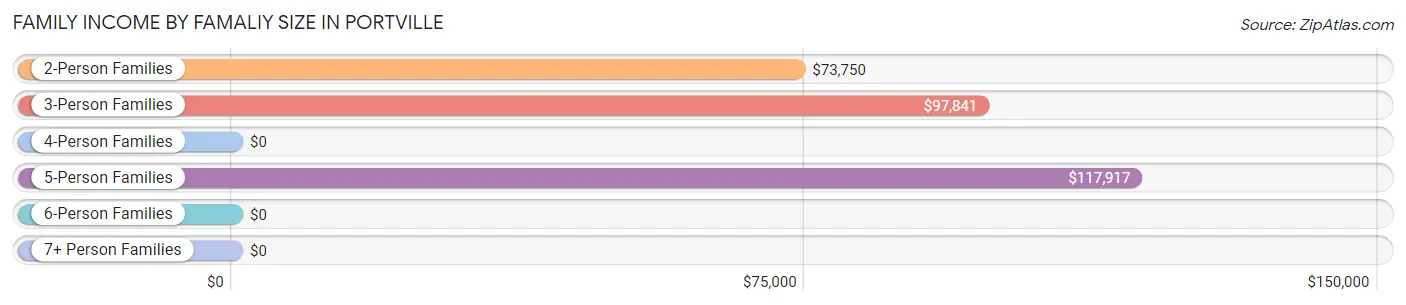
| Income Bracket | # Families | Median Income |
| 2-Person Families | 90 (39.1%) | $73,750 |
| 3-Person Families | 67 (29.1%) | $97,841 |
| 4-Person Families | 62 (27.0%) | $0 |
| 5-Person Families | 11 (4.8%) | $117,917 |
| 6-Person Families | 0 (0.0%) | $0 |
| 7+ Person Families | 0 (0.0%) | $0 |
| Total | 230 (100.0%) | $81,538 |
Family Income by Number of Earners in Portville
The median family income in Portville is $81,538, with families comprising 3+ earners (42) having the highest median family income of $158,333, while families with 1 earner (59) have the lowest median family income of $51,645, accounting for 18.3% and 25.7% of families, respectively.
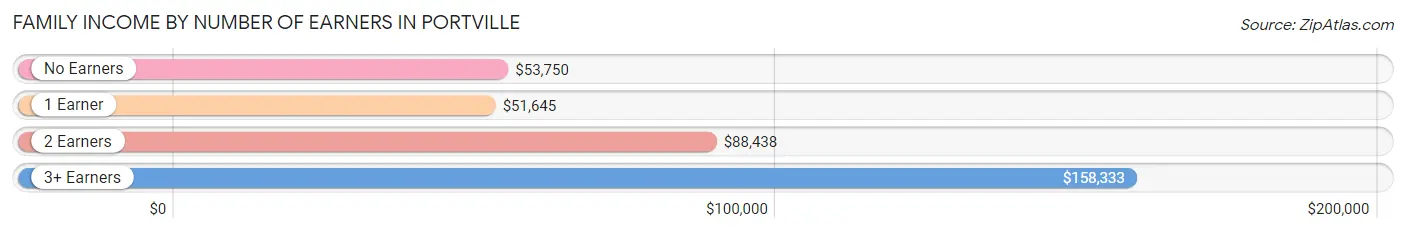
| Number of Earners | # Families | Median Income |
| No Earners | 56 (24.3%) | $53,750 |
| 1 Earner | 59 (25.7%) | $51,645 |
| 2 Earners | 73 (31.7%) | $88,438 |
| 3+ Earners | 42 (18.3%) | $158,333 |
| Total | 230 (100.0%) | $81,538 |
Household Income in Portville
Household Income Brackets in Portville
With 93 households falling in the category, the $50,000 to $74,999 income range is the most frequent in Portville, accounting for 24.9% of all households. In contrast, only 9 households (2.4%) fall into the $35,000 to $49,999 income bracket, making it the least populous group.
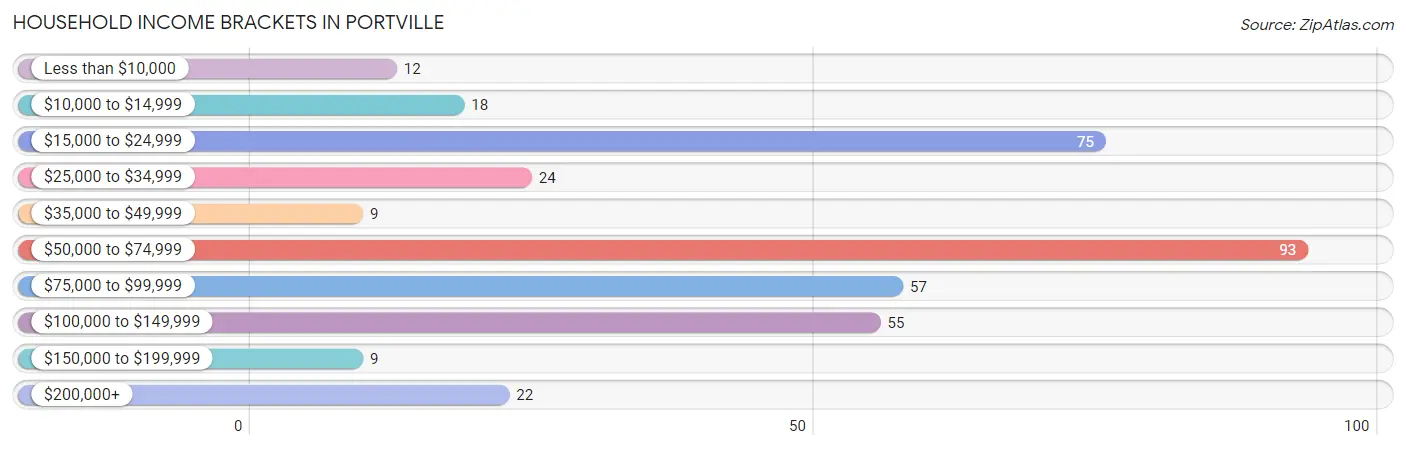
| Income Bracket | # Households | % Households |
| Less than $10,000 | 12 | 3.2% |
| $10,000 to $14,999 | 18 | 4.8% |
| $15,000 to $24,999 | 75 | 20.1% |
| $25,000 to $34,999 | 24 | 6.4% |
| $35,000 to $49,999 | 9 | 2.4% |
| $50,000 to $74,999 | 93 | 24.9% |
| $75,000 to $99,999 | 57 | 15.2% |
| $100,000 to $149,999 | 55 | 14.7% |
| $150,000 to $199,999 | 9 | 2.4% |
| $200,000+ | 22 | 5.9% |
Household Income by Householder Age in Portville
The median household income in Portville is $59,500, with the highest median household income of $97,833 found in the 25 to 44 years age bracket for the primary householder. A total of 56 households (15.0%) fall into this category. Meanwhile, the 15 to 24 years age bracket for the primary householder has the lowest median household income of $0, with 20 households (5.3%) in this group.
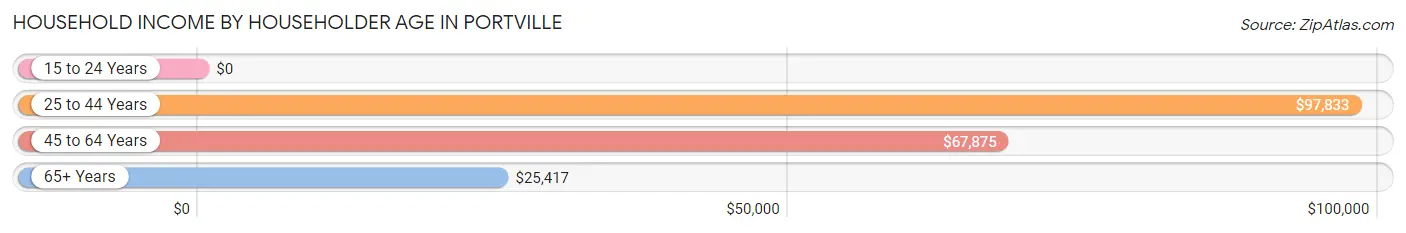
| Income Bracket | # Households | Median Income |
| 15 to 24 Years | 20 (5.3%) | $0 |
| 25 to 44 Years | 56 (15.0%) | $97,833 |
| 45 to 64 Years | 193 (51.6%) | $67,875 |
| 65+ Years | 105 (28.1%) | $25,417 |
| Total | 374 (100.0%) | $59,500 |
Poverty in Portville
Income Below Poverty by Sex and Age in Portville
With 6.0% poverty level for males and 12.8% for females among the residents of Portville, 55 to 64 year old males and 15 year old females are the most vulnerable to poverty, with 10 males (17.5%) and 9 females (60.0%) in their respective age groups living below the poverty level.
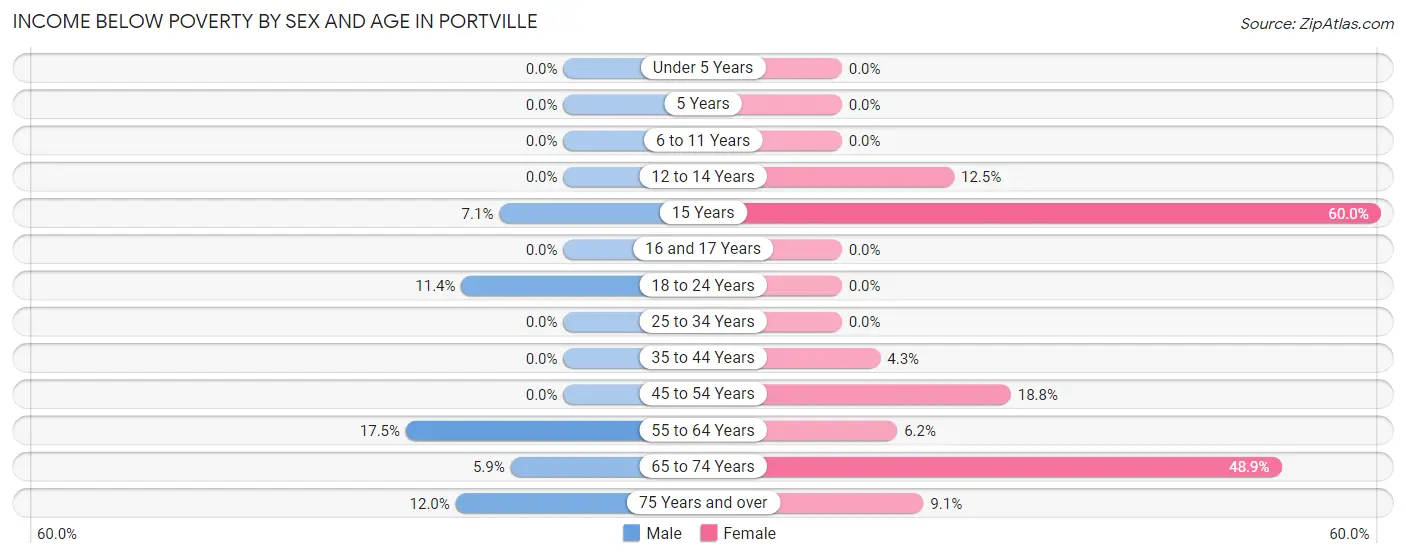
| Age Bracket | Male | Female |
| Under 5 Years | 0 (0.0%) | 0 (0.0%) |
| 5 Years | 0 (0.0%) | 0 (0.0%) |
| 6 to 11 Years | 0 (0.0%) | 0 (0.0%) |
| 12 to 14 Years | 0 (0.0%) | 3 (12.5%) |
| 15 Years | 3 (7.1%) | 9 (60.0%) |
| 16 and 17 Years | 0 (0.0%) | 0 (0.0%) |
| 18 to 24 Years | 5 (11.4%) | 0 (0.0%) |
| 25 to 34 Years | 0 (0.0%) | 0 (0.0%) |
| 35 to 44 Years | 0 (0.0%) | 3 (4.3%) |
| 45 to 54 Years | 0 (0.0%) | 16 (18.8%) |
| 55 to 64 Years | 10 (17.5%) | 5 (6.2%) |
| 65 to 74 Years | 3 (5.9%) | 23 (48.9%) |
| 75 Years and over | 3 (12.0%) | 3 (9.1%) |
| Total | 24 (6.0%) | 62 (12.8%) |
Income Above Poverty by Sex and Age in Portville
According to the poverty statistics in Portville, males aged under 5 years and females aged under 5 years are the age groups that are most secure financially, with 100.0% of males and 100.0% of females in these age groups living above the poverty line.
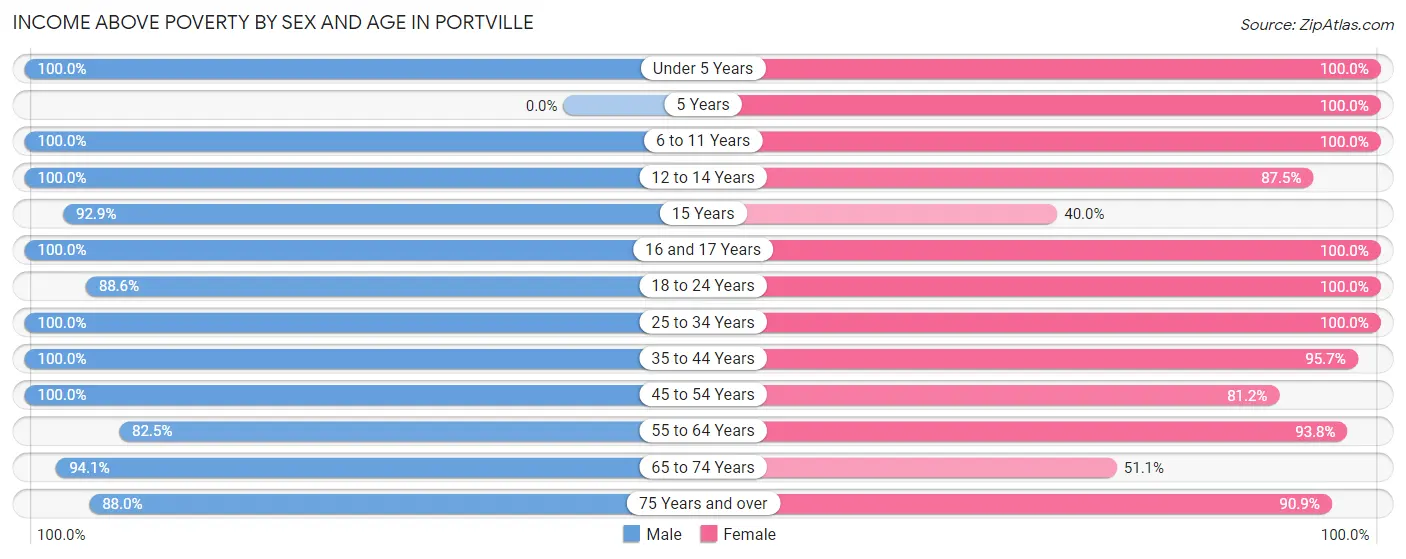
| Age Bracket | Male | Female |
| Under 5 Years | 6 (100.0%) | 9 (100.0%) |
| 5 Years | 0 (0.0%) | 12 (100.0%) |
| 6 to 11 Years | 10 (100.0%) | 38 (100.0%) |
| 12 to 14 Years | 12 (100.0%) | 21 (87.5%) |
| 15 Years | 39 (92.9%) | 6 (40.0%) |
| 16 and 17 Years | 15 (100.0%) | 22 (100.0%) |
| 18 to 24 Years | 39 (88.6%) | 26 (100.0%) |
| 25 to 34 Years | 16 (100.0%) | 22 (100.0%) |
| 35 to 44 Years | 45 (100.0%) | 67 (95.7%) |
| 45 to 54 Years | 78 (100.0%) | 69 (81.2%) |
| 55 to 64 Years | 47 (82.5%) | 76 (93.8%) |
| 65 to 74 Years | 48 (94.1%) | 24 (51.1%) |
| 75 Years and over | 22 (88.0%) | 30 (90.9%) |
| Total | 377 (94.0%) | 422 (87.2%) |
Income Below Poverty Among Married-Couple Families in Portville
The poverty statistics for married-couple families in Portville show that 3.0% or 6 of the total 198 families live below the poverty line. Families with no children have the highest poverty rate of 5.4%, comprising of 6 families. On the other hand, families with 1 or 2 children have the lowest poverty rate of 0.0%, which includes 0 families.
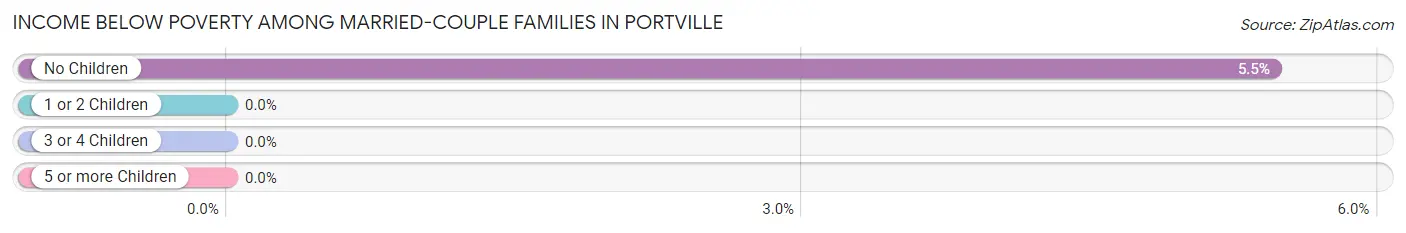
| Children | Above Poverty | Below Poverty |
| No Children | 104 (94.6%) | 6 (5.4%) |
| 1 or 2 Children | 80 (100.0%) | 0 (0.0%) |
| 3 or 4 Children | 8 (100.0%) | 0 (0.0%) |
| 5 or more Children | 0 (0.0%) | 0 (0.0%) |
| Total | 192 (97.0%) | 6 (3.0%) |
Income Below Poverty Among Single-Parent Households in Portville
According to the poverty data in Portville, 43.5% or 10 single-father households and 33.3% or 3 single-mother households are living below the poverty line. Among single-father households, those with 1 or 2 children have the highest poverty rate, with 10 households (50.0%) experiencing poverty. Likewise, among single-mother households, those with 1 or 2 children have the highest poverty rate, with 3 households (50.0%) falling below the poverty line.
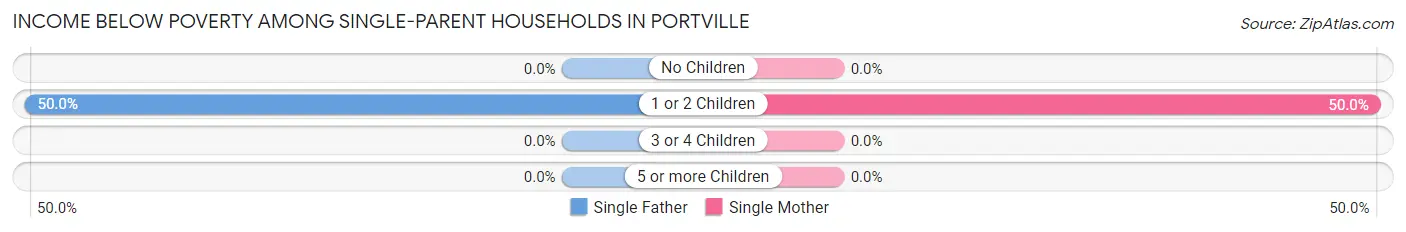
| Children | Single Father | Single Mother |
| No Children | 0 (0.0%) | 0 (0.0%) |
| 1 or 2 Children | 10 (50.0%) | 3 (50.0%) |
| 3 or 4 Children | 0 (0.0%) | 0 (0.0%) |
| 5 or more Children | 0 (0.0%) | 0 (0.0%) |
| Total | 10 (43.5%) | 3 (33.3%) |
Income Below Poverty Among Married-Couple vs Single-Parent Households in Portville
The poverty data for Portville shows that 6 of the married-couple family households (3.0%) and 13 of the single-parent households (40.6%) are living below the poverty level. Within the married-couple family households, those with no children have the highest poverty rate, with 6 households (5.4%) falling below the poverty line. Among the single-parent households, those with 1 or 2 children have the highest poverty rate, with 13 household (50.0%) living below poverty.
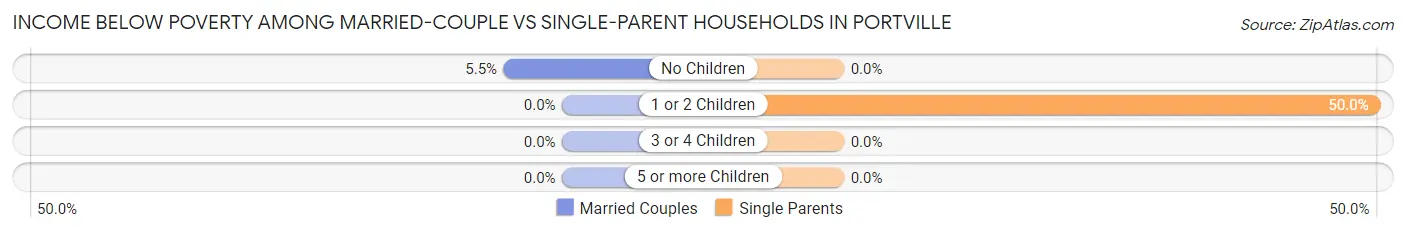
| Children | Married-Couple Families | Single-Parent Households |
| No Children | 6 (5.4%) | 0 (0.0%) |
| 1 or 2 Children | 0 (0.0%) | 13 (50.0%) |
| 3 or 4 Children | 0 (0.0%) | 0 (0.0%) |
| 5 or more Children | 0 (0.0%) | 0 (0.0%) |
| Total | 6 (3.0%) | 13 (40.6%) |
Race in Portville
The most populous races in Portville are White / Caucasian (817 | 92.3%), Two or more Races (66 | 7.5%), and Hispanic or Latino (11 | 1.2%).
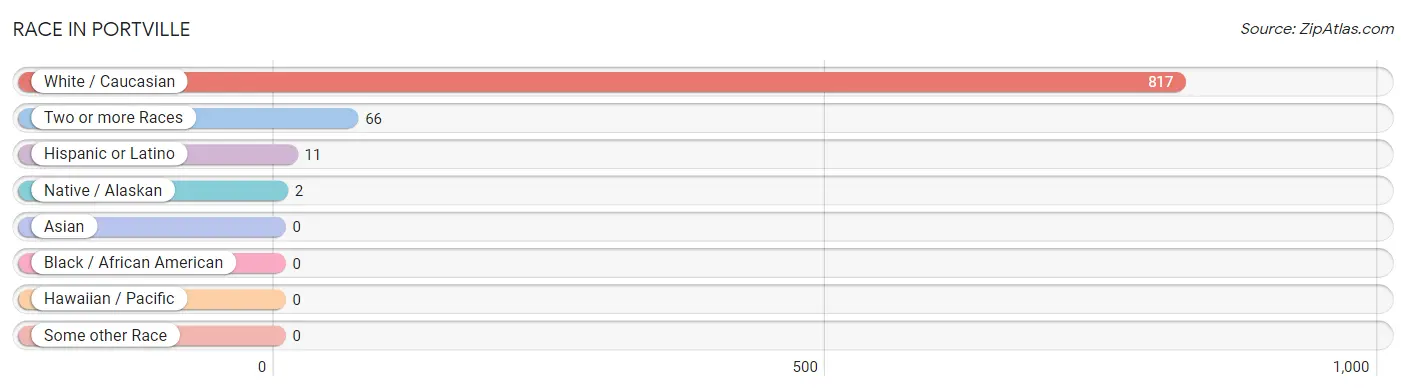
| Race | # Population | % Population |
| Asian | 0 | 0.0% |
| Black / African American | 0 | 0.0% |
| Hawaiian / Pacific | 0 | 0.0% |
| Hispanic or Latino | 11 | 1.2% |
| Native / Alaskan | 2 | 0.2% |
| White / Caucasian | 817 | 92.3% |
| Two or more Races | 66 | 7.5% |
| Some other Race | 0 | 0.0% |
| Total | 885 | 100.0% |
Ancestry in Portville
The most populous ancestries reported in Portville are German (250 | 28.2%), Irish (249 | 28.1%), English (230 | 26.0%), Italian (82 | 9.3%), and Polish (47 | 5.3%), together accounting for 97.0% of all Portville residents.
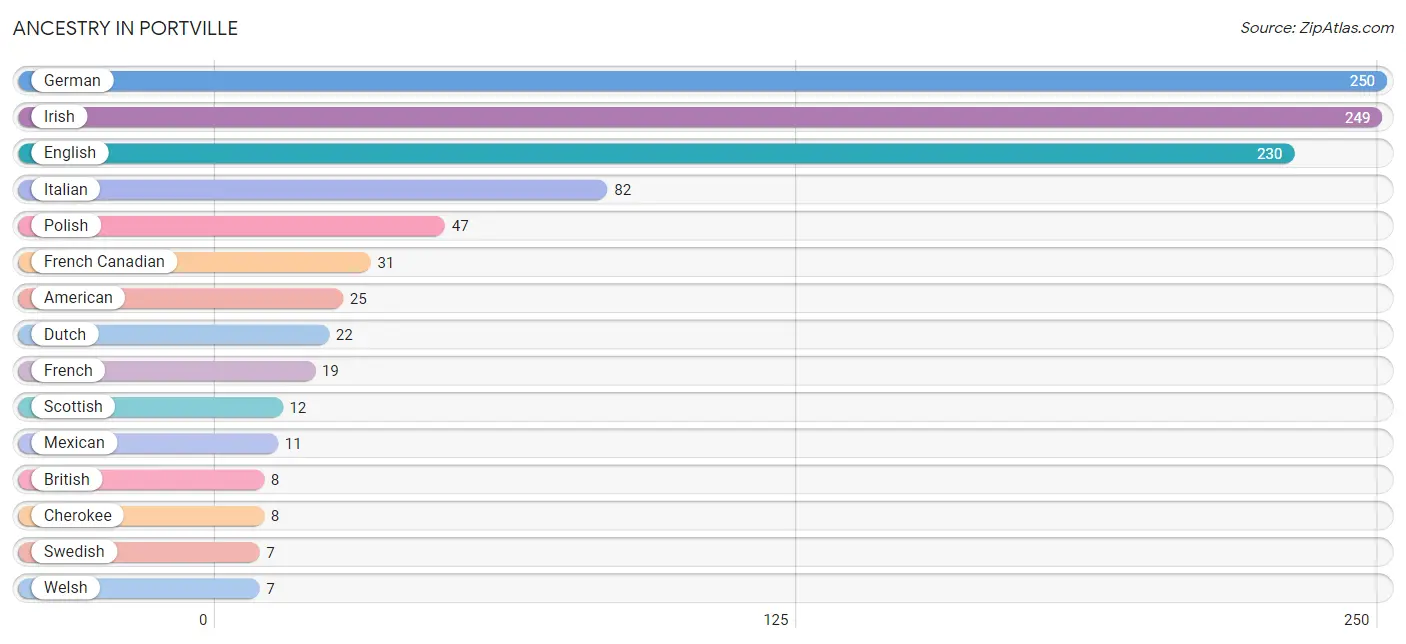
| Ancestry | # Population | % Population |
| American | 25 | 2.8% |
| British | 8 | 0.9% |
| Cherokee | 8 | 0.9% |
| Dutch | 22 | 2.5% |
| English | 230 | 26.0% |
| French | 19 | 2.1% |
| French Canadian | 31 | 3.5% |
| German | 250 | 28.2% |
| Irish | 249 | 28.1% |
| Iroquois | 4 | 0.4% |
| Italian | 82 | 9.3% |
| Mexican | 11 | 1.2% |
| Northern European | 3 | 0.3% |
| Pennsylvania German | 3 | 0.3% |
| Polish | 47 | 5.3% |
| Scandinavian | 4 | 0.4% |
| Scottish | 12 | 1.4% |
| Slavic | 2 | 0.2% |
| Slovak | 3 | 0.3% |
| Swedish | 7 | 0.8% |
| Swiss | 4 | 0.4% |
| Welsh | 7 | 0.8% | View All 22 Rows |
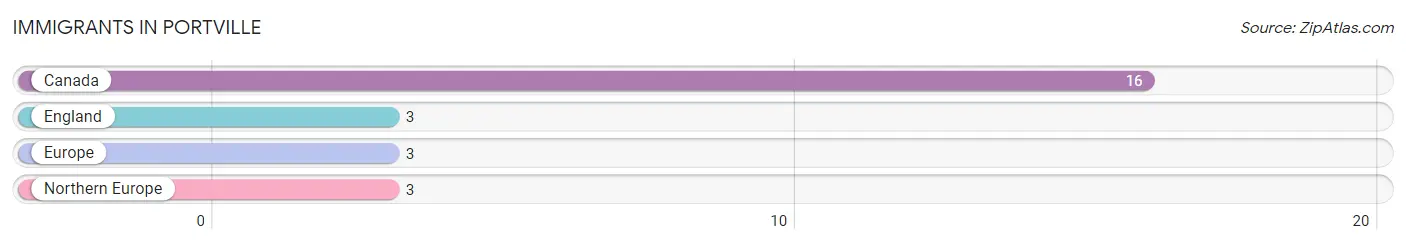
Immigrants in Portville
The most numerous immigrant groups reported in Portville came from Canada (16 | 1.8%), England (3 | 0.3%), Europe (3 | 0.3%), and Northern Europe (3 | 0.3%), together accounting for 2.8% of all Portville residents.
| Immigration Origin | # Population | % Population |
| Canada | 16 | 1.8% |
| England | 3 | 0.3% |
| Europe | 3 | 0.3% |
| Northern Europe | 3 | 0.3% | View All 4 Rows |
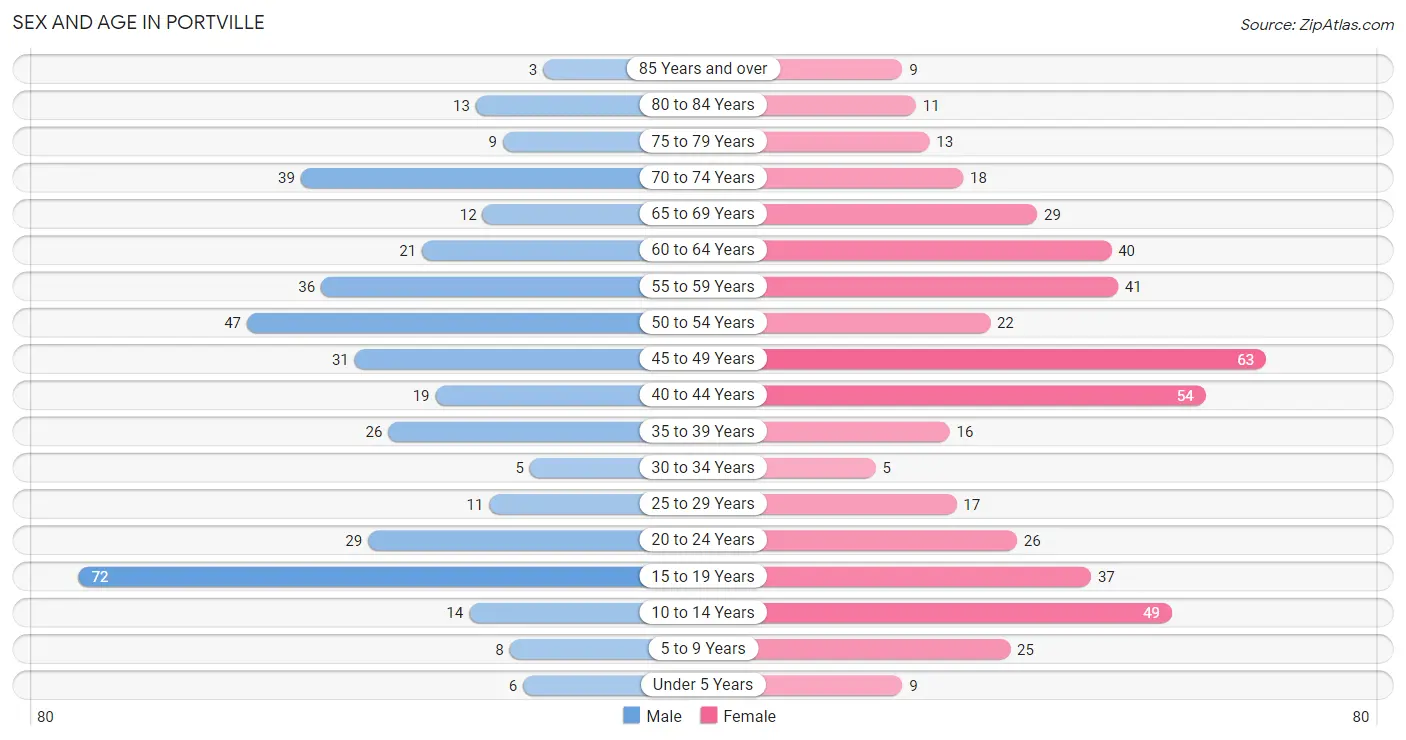
Sex and Age in Portville
Sex and Age in Portville
The most populous age groups in Portville are 15 to 19 Years (72 | 18.0%) for men and 45 to 49 Years (63 | 13.0%) for women.
| Age Bracket | Male | Female |
| Under 5 Years | 6 (1.5%) | 9 (1.9%) |
| 5 to 9 Years | 8 (2.0%) | 25 (5.2%) |
| 10 to 14 Years | 14 (3.5%) | 49 (10.1%) |
| 15 to 19 Years | 72 (18.0%) | 37 (7.6%) |
| 20 to 24 Years | 29 (7.2%) | 26 (5.4%) |
| 25 to 29 Years | 11 (2.7%) | 17 (3.5%) |
| 30 to 34 Years | 5 (1.3%) | 5 (1.0%) |
| 35 to 39 Years | 26 (6.5%) | 16 (3.3%) |
| 40 to 44 Years | 19 (4.7%) | 54 (11.2%) |
| 45 to 49 Years | 31 (7.7%) | 63 (13.0%) |
| 50 to 54 Years | 47 (11.7%) | 22 (4.5%) |
| 55 to 59 Years | 36 (9.0%) | 41 (8.5%) |
| 60 to 64 Years | 21 (5.2%) | 40 (8.3%) |
| 65 to 69 Years | 12 (3.0%) | 29 (6.0%) |
| 70 to 74 Years | 39 (9.7%) | 18 (3.7%) |
| 75 to 79 Years | 9 (2.2%) | 13 (2.7%) |
| 80 to 84 Years | 13 (3.2%) | 11 (2.3%) |
| 85 Years and over | 3 (0.7%) | 9 (1.9%) |
| Total | 401 (100.0%) | 484 (100.0%) |
Families and Households in Portville
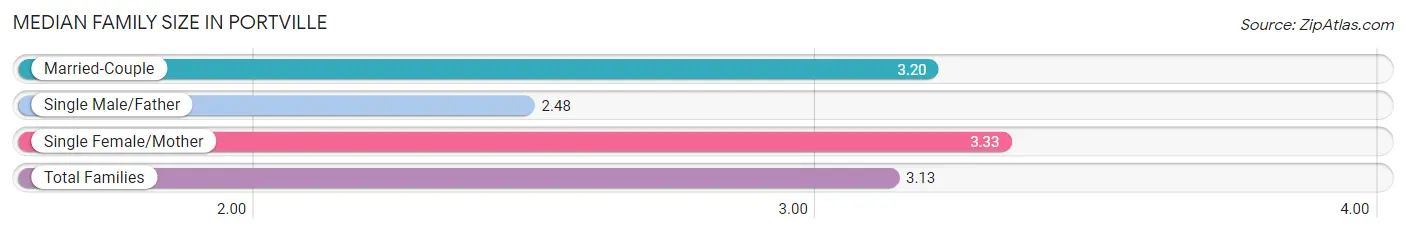
Median Family Size in Portville
The median family size in Portville is 3.13 persons per family, with single female/mother families (9 | 3.9%) accounting for the largest median family size of 3.33 persons per family. On the other hand, single male/father families (23 | 10.0%) represent the smallest median family size with 2.48 persons per family.
| Family Type | # Families | Family Size |
| Married-Couple | 198 (86.1%) | 3.20 |
| Single Male/Father | 23 (10.0%) | 2.48 |
| Single Female/Mother | 9 (3.9%) | 3.33 |
| Total Families | 230 (100.0%) | 3.13 |
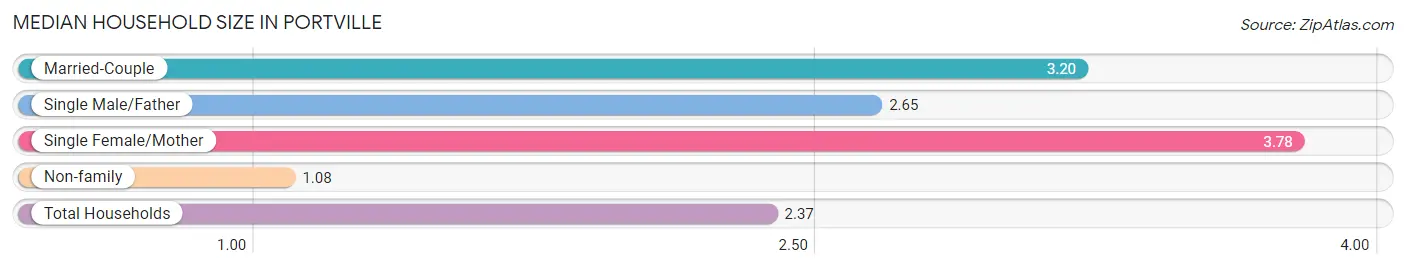
Median Household Size in Portville
The median household size in Portville is 2.37 persons per household, with single female/mother households (9 | 2.4%) accounting for the largest median household size of 3.78 persons per household. non-family households (144 | 38.5%) represent the smallest median household size with 1.08 persons per household.
| Household Type | # Households | Household Size |
| Married-Couple | 198 (52.9%) | 3.20 |
| Single Male/Father | 23 (6.1%) | 2.65 |
| Single Female/Mother | 9 (2.4%) | 3.78 |
| Non-family | 144 (38.5%) | 1.08 |
| Total Households | 374 (100.0%) | 2.37 |
Household Size by Marriage Status in Portville
Out of a total of 374 households in Portville, 230 (61.5%) are family households, while 144 (38.5%) are nonfamily households. The most numerous type of family households are 2-person households, comprising 90, and the most common type of nonfamily households are 1-person households, comprising 133.
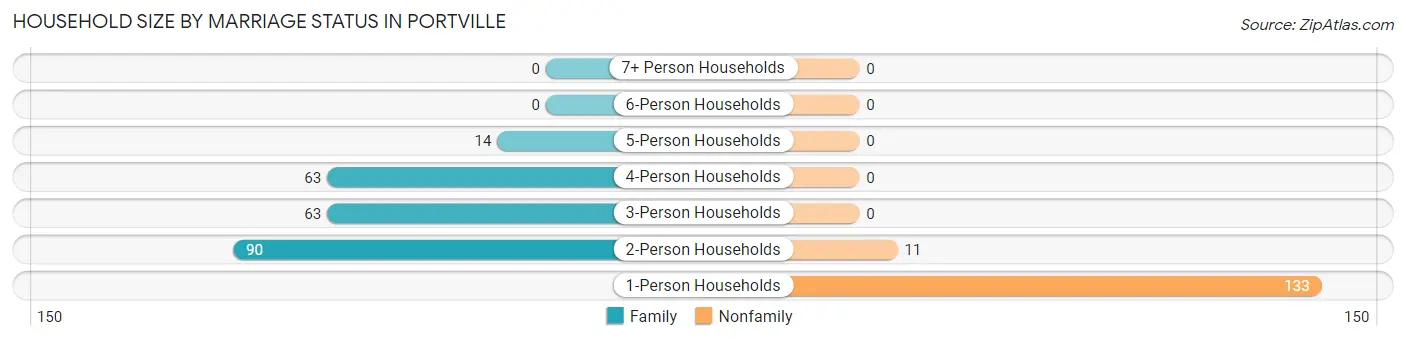
| Household Size | Family Households | Nonfamily Households |
| 1-Person Households | - | 133 (35.6%) |
| 2-Person Households | 90 (24.1%) | 11 (2.9%) |
| 3-Person Households | 63 (16.8%) | 0 (0.0%) |
| 4-Person Households | 63 (16.8%) | 0 (0.0%) |
| 5-Person Households | 14 (3.7%) | 0 (0.0%) |
| 6-Person Households | 0 (0.0%) | 0 (0.0%) |
| 7+ Person Households | 0 (0.0%) | 0 (0.0%) |
| Total | 230 (61.5%) | 144 (38.5%) |
Female Fertility in Portville
Fertility by Age in Portville
Average fertility rate in Portville is 49.0 births per 1,000 women. Women in the age bracket of 20 to 34 years have the highest fertility rate with 167.0 births per 1,000 women. Women in the age bracket of 20 to 34 years acount for 72.7% of all women with births.
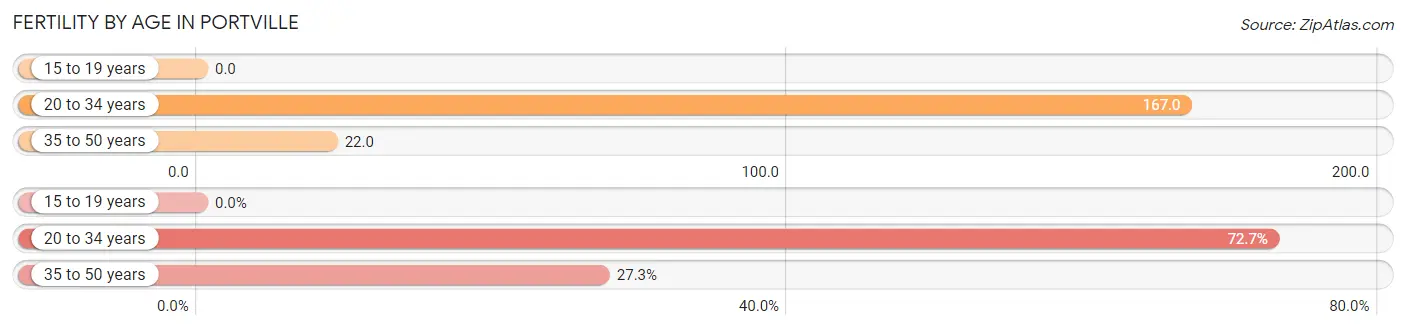
| Age Bracket | Women with Births | Births / 1,000 Women |
| 15 to 19 years | 0 (0.0%) | 0.0 |
| 20 to 34 years | 8 (72.7%) | 167.0 |
| 35 to 50 years | 3 (27.3%) | 22.0 |
| Total | 11 (100.0%) | 49.0 |
Fertility by Age by Marriage Status in Portville
27.3% of women with births (11) in Portville are married. The highest percentage of unmarried women with births falls into 20 to 34 years age bracket with 100.0% of them unmarried at the time of birth, while the lowest percentage of unmarried women with births belong to 35 to 50 years age bracket with 0.0% of them unmarried.
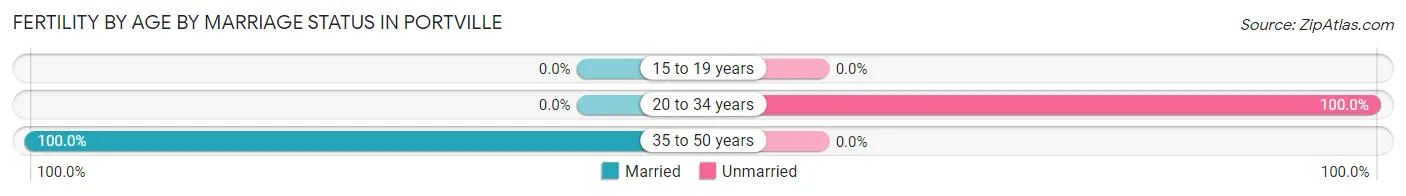
| Age Bracket | Married | Unmarried |
| 15 to 19 years | 0 (0.0%) | 0 (0.0%) |
| 20 to 34 years | 0 (0.0%) | 8 (100.0%) |
| 35 to 50 years | 3 (100.0%) | 0 (0.0%) |
| Total | 3 (27.3%) | 8 (72.7%) |
Fertility by Education in Portville
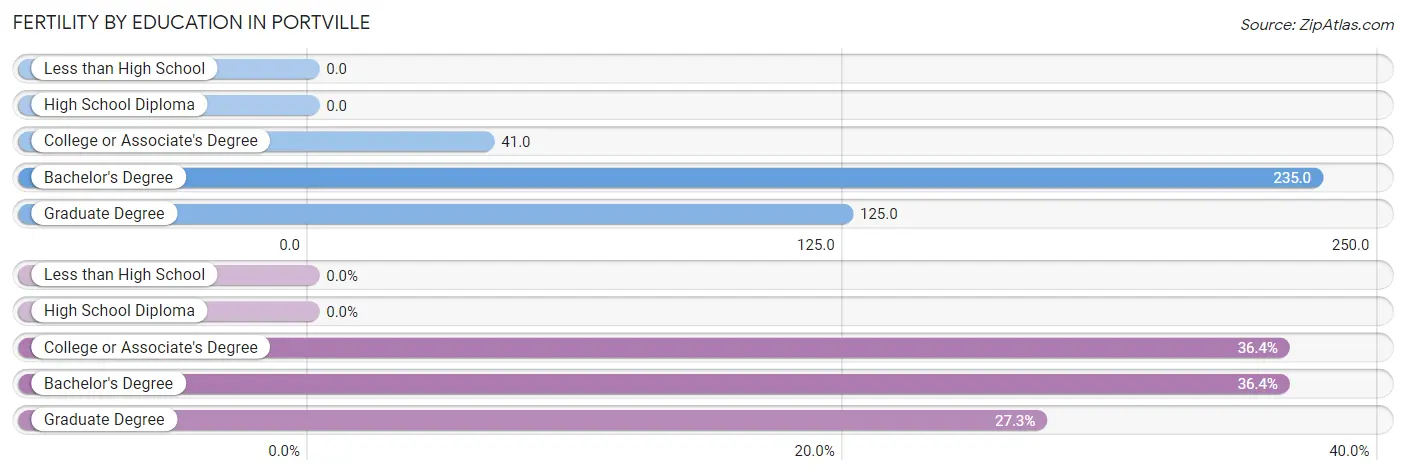
| Educational Attainment | Women with Births | Births / 1,000 Women |
| Less than High School | 0 (0.0%) | 0.0 |
| High School Diploma | 0 (0.0%) | 0.0 |
| College or Associate's Degree | 4 (36.4%) | 41.0 |
| Bachelor's Degree | 4 (36.4%) | 235.0 |
| Graduate Degree | 3 (27.3%) | 125.0 |
| Total | 11 (100.0%) | 49.0 |
Fertility by Education by Marriage Status in Portville
72.7% of women with births in Portville are unmarried. Women with the educational attainment of graduate degree are most likely to be married with 100.0% of them married at childbirth, while women with the educational attainment of college or associate's degree are least likely to be married with 100.0% of them unmarried at childbirth.
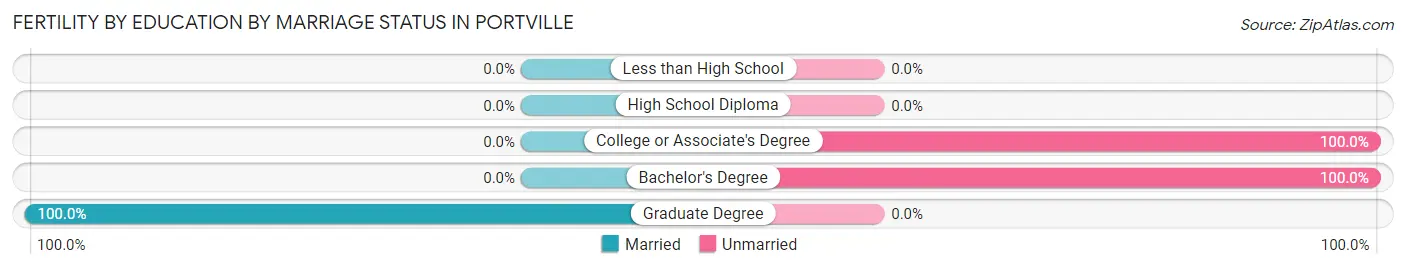
| Educational Attainment | Married | Unmarried |
| Less than High School | 0 (0.0%) | 0 (0.0%) |
| High School Diploma | 0 (0.0%) | 0 (0.0%) |
| College or Associate's Degree | 0 (0.0%) | 4 (100.0%) |
| Bachelor's Degree | 0 (0.0%) | 4 (100.0%) |
| Graduate Degree | 3 (100.0%) | 0 (0.0%) |
| Total | 3 (27.3%) | 8 (72.7%) |
Employment Characteristics in Portville
Employment by Class of Employer in Portville
Among the 389 employed individuals in Portville, private company employees (254 | 65.3%), not-for-profit organizations (57 | 14.6%), and local government employees (57 | 14.6%) make up the most common classes of employment.
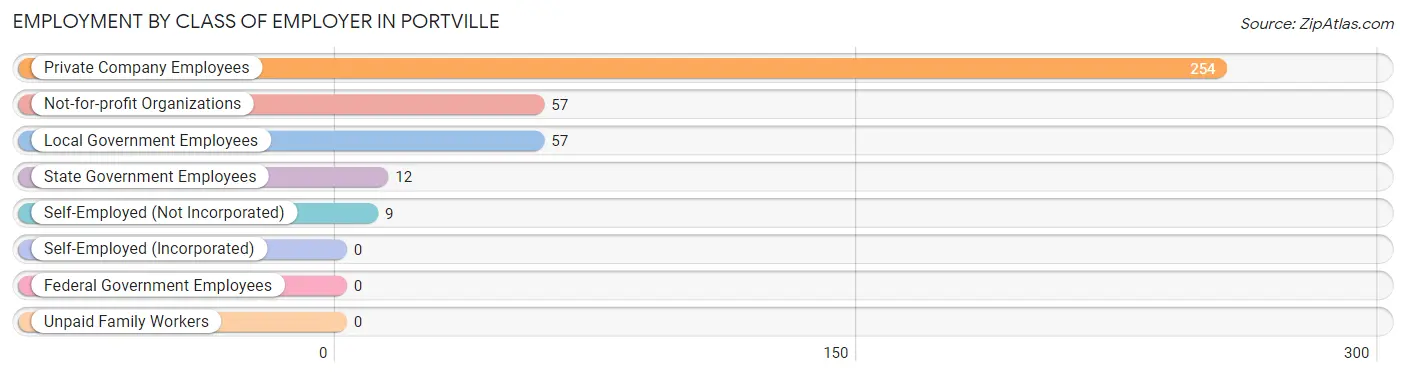
| Employer Class | # Employees | % Employees |
| Private Company Employees | 254 | 65.3% |
| Self-Employed (Incorporated) | 0 | 0.0% |
| Self-Employed (Not Incorporated) | 9 | 2.3% |
| Not-for-profit Organizations | 57 | 14.6% |
| Local Government Employees | 57 | 14.6% |
| State Government Employees | 12 | 3.1% |
| Federal Government Employees | 0 | 0.0% |
| Unpaid Family Workers | 0 | 0.0% |
| Total | 389 | 100.0% |
Employment Status by Age in Portville
According to the labor force statistics for Portville, out of the total population over 16 years of age (717), 59.0% or 423 individuals are in the labor force, with 6.1% or 26 of them unemployed. The age group with the highest labor force participation rate is 30 to 34 years, with 100.0% or 10 individuals in the labor force. Within the labor force, the 16 to 19 years age range has the highest percentage of unemployed individuals, with 15.2% or 5 of them being unemployed.
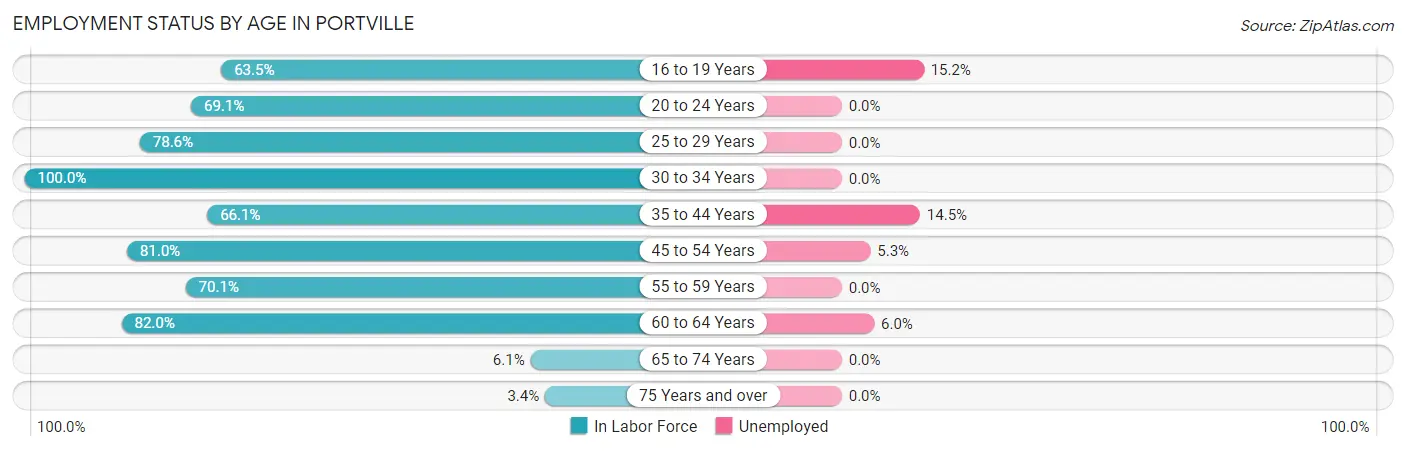
| Age Bracket | In Labor Force | Unemployed |
| 16 to 19 Years | 33 (63.5%) | 5 (15.2%) |
| 20 to 24 Years | 38 (69.1%) | 0 (0.0%) |
| 25 to 29 Years | 22 (78.6%) | 0 (0.0%) |
| 30 to 34 Years | 10 (100.0%) | 0 (0.0%) |
| 35 to 44 Years | 76 (66.1%) | 11 (14.5%) |
| 45 to 54 Years | 132 (81.0%) | 7 (5.3%) |
| 55 to 59 Years | 54 (70.1%) | 0 (0.0%) |
| 60 to 64 Years | 50 (82.0%) | 3 (6.0%) |
| 65 to 74 Years | 6 (6.1%) | 0 (0.0%) |
| 75 Years and over | 2 (3.4%) | 0 (0.0%) |
| Total | 423 (59.0%) | 26 (6.1%) |
Employment Status by Educational Attainment in Portville
According to labor force statistics for Portville, 75.8% of individuals (344) out of the total population between 25 and 64 years of age (454) are in the labor force, with 6.1% or 21 of them being unemployed. The group with the highest labor force participation rate are those with the educational attainment of bachelor's degree or higher, with 97.5% or 118 individuals in the labor force. Within the labor force, individuals with high school diploma education have the highest percentage of unemployment, with 11.5% or 11 of them being unemployed.
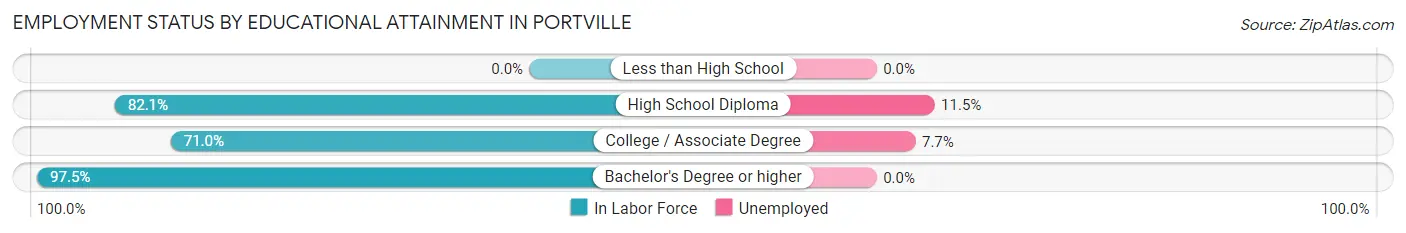
| Educational Attainment | In Labor Force | Unemployed |
| Less than High School | 0 (0.0%) | 0 (0.0%) |
| High School Diploma | 96 (82.1%) | 13 (11.5%) |
| College / Associate Degree | 130 (71.0%) | 14 (7.7%) |
| Bachelor's Degree or higher | 118 (97.5%) | 0 (0.0%) |
| Total | 344 (75.8%) | 28 (6.1%) |
Employment Occupations by Sex in Portville
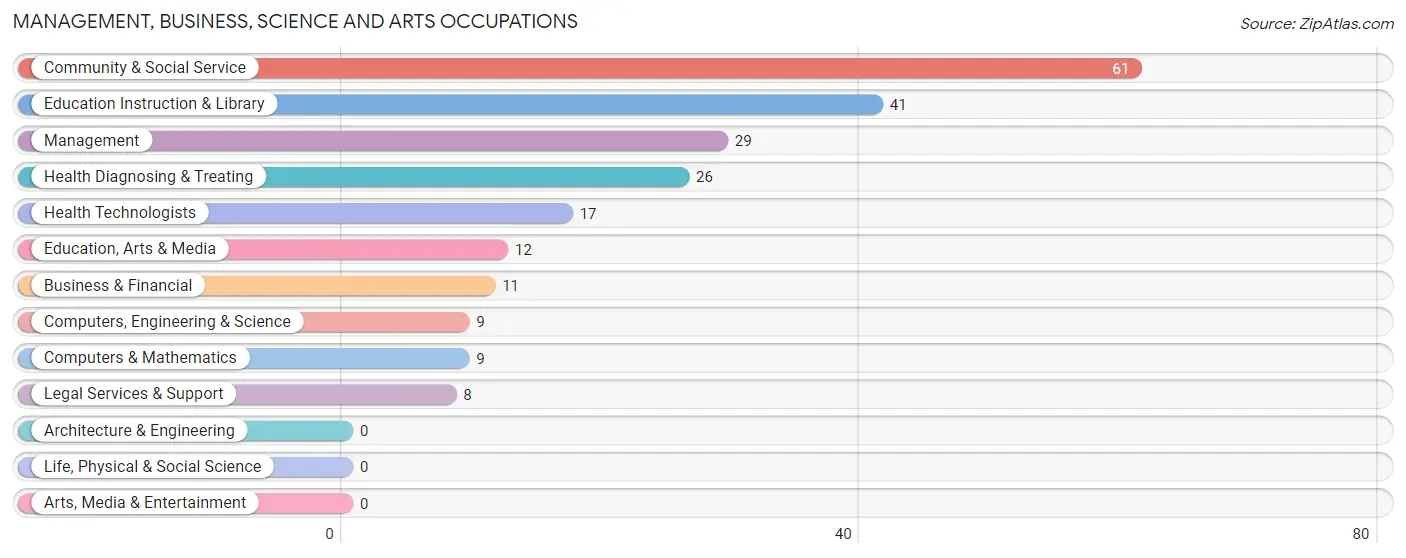
Management, Business, Science and Arts Occupations
The most common Management, Business, Science and Arts occupations in Portville are Community & Social Service (61 | 15.4%), Education Instruction & Library (41 | 10.3%), Management (29 | 7.3%), Health Diagnosing & Treating (26 | 6.6%), and Health Technologists (17 | 4.3%).
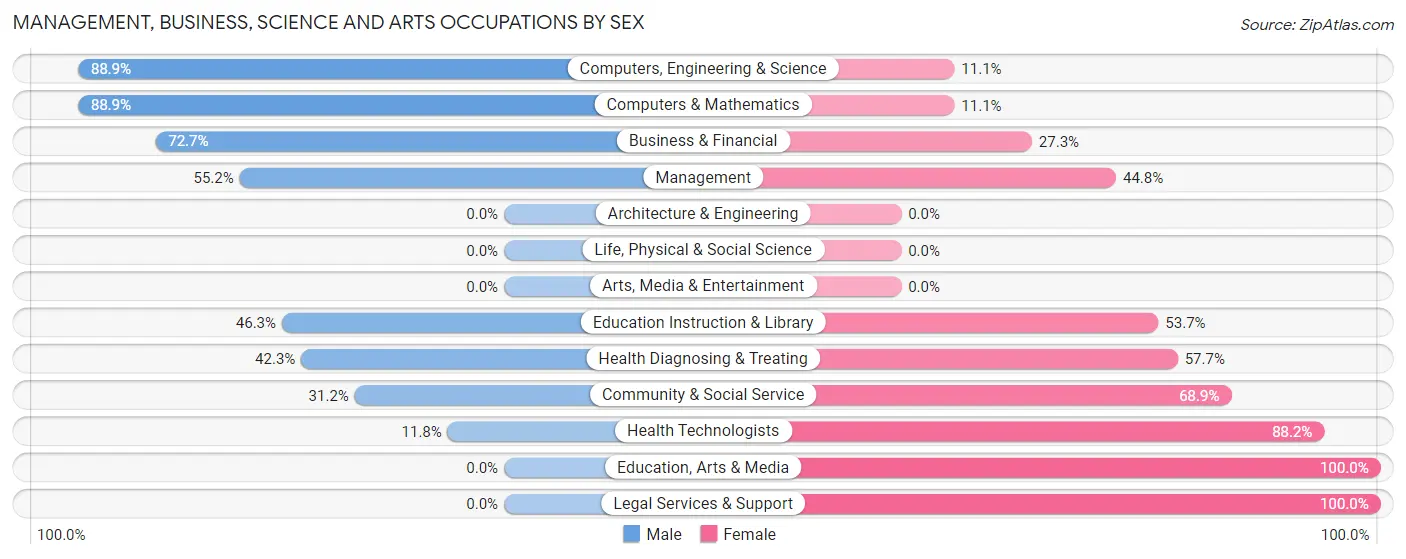
Management, Business, Science and Arts Occupations by Sex
Within the Management, Business, Science and Arts occupations in Portville, the most male-oriented occupations are Computers, Engineering & Science (88.9%), Computers & Mathematics (88.9%), and Business & Financial (72.7%), while the most female-oriented occupations are Education, Arts & Media (100.0%), Legal Services & Support (100.0%), and Health Technologists (88.2%).
| Occupation | Male | Female |
| Management | 16 (55.2%) | 13 (44.8%) |
| Business & Financial | 8 (72.7%) | 3 (27.3%) |
| Computers, Engineering & Science | 8 (88.9%) | 1 (11.1%) |
| Computers & Mathematics | 8 (88.9%) | 1 (11.1%) |
| Architecture & Engineering | 0 (0.0%) | 0 (0.0%) |
| Life, Physical & Social Science | 0 (0.0%) | 0 (0.0%) |
| Community & Social Service | 19 (31.1%) | 42 (68.9%) |
| Education, Arts & Media | 0 (0.0%) | 12 (100.0%) |
| Legal Services & Support | 0 (0.0%) | 8 (100.0%) |
| Education Instruction & Library | 19 (46.3%) | 22 (53.7%) |
| Arts, Media & Entertainment | 0 (0.0%) | 0 (0.0%) |
| Health Diagnosing & Treating | 11 (42.3%) | 15 (57.7%) |
| Health Technologists | 2 (11.8%) | 15 (88.2%) |
| Total (Category) | 62 (45.6%) | 74 (54.4%) |
| Total (Overall) | 205 (51.6%) | 192 (48.4%) |
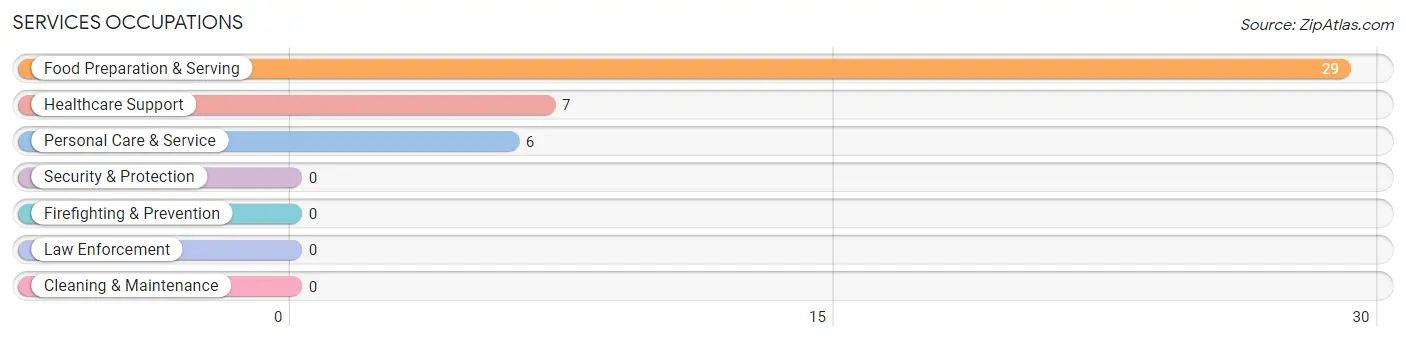
Services Occupations
The most common Services occupations in Portville are Food Preparation & Serving (29 | 7.3%), Healthcare Support (7 | 1.8%), and Personal Care & Service (6 | 1.5%).
Services Occupations by Sex
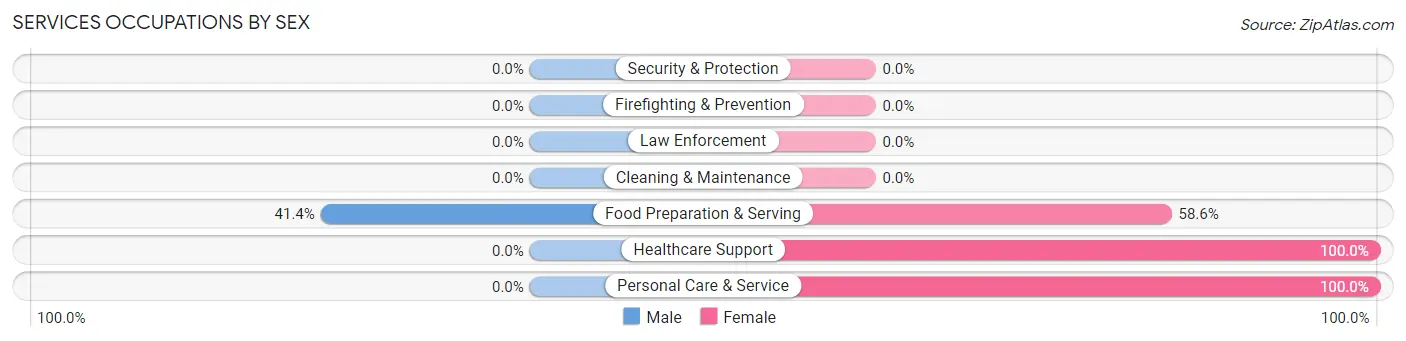
| Occupation | Male | Female |
| Healthcare Support | 0 (0.0%) | 7 (100.0%) |
| Security & Protection | 0 (0.0%) | 0 (0.0%) |
| Firefighting & Prevention | 0 (0.0%) | 0 (0.0%) |
| Law Enforcement | 0 (0.0%) | 0 (0.0%) |
| Food Preparation & Serving | 12 (41.4%) | 17 (58.6%) |
| Cleaning & Maintenance | 0 (0.0%) | 0 (0.0%) |
| Personal Care & Service | 0 (0.0%) | 6 (100.0%) |
| Total (Category) | 12 (28.6%) | 30 (71.4%) |
| Total (Overall) | 205 (51.6%) | 192 (48.4%) |
Sales and Office Occupations
The most common Sales and Office occupations in Portville are Office & Administration (83 | 20.9%), and Sales & Related (28 | 7.0%).

Sales and Office Occupations by Sex

| Occupation | Male | Female |
| Sales & Related | 17 (60.7%) | 11 (39.3%) |
| Office & Administration | 16 (19.3%) | 67 (80.7%) |
| Total (Category) | 33 (29.7%) | 78 (70.3%) |
| Total (Overall) | 205 (51.6%) | 192 (48.4%) |
Natural Resources, Construction and Maintenance Occupations
The most common Natural Resources, Construction and Maintenance occupations in Portville are Construction & Extraction (10 | 2.5%), and Installation, Maintenance & Repair (8 | 2.0%).
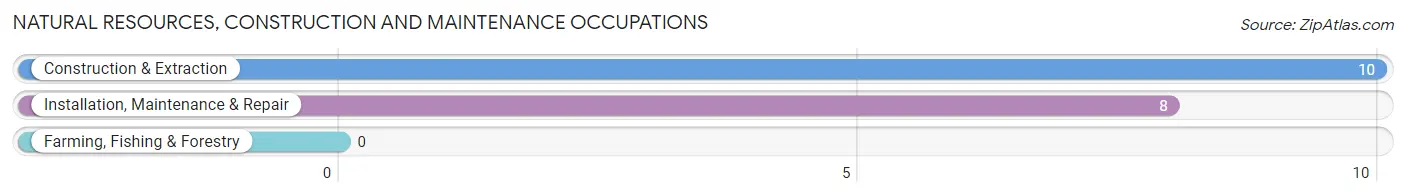
Natural Resources, Construction and Maintenance Occupations by Sex

| Occupation | Male | Female |
| Farming, Fishing & Forestry | 0 (0.0%) | 0 (0.0%) |
| Construction & Extraction | 10 (100.0%) | 0 (0.0%) |
| Installation, Maintenance & Repair | 8 (100.0%) | 0 (0.0%) |
| Total (Category) | 18 (100.0%) | 0 (0.0%) |
| Total (Overall) | 205 (51.6%) | 192 (48.4%) |
Production, Transportation and Moving Occupations
The most common Production, Transportation and Moving occupations in Portville are Production (38 | 9.6%), Transportation (36 | 9.1%), and Material Moving (16 | 4.0%).
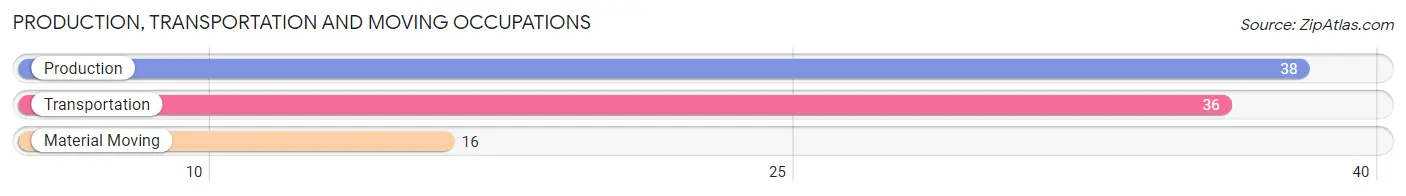
Production, Transportation and Moving Occupations by Sex
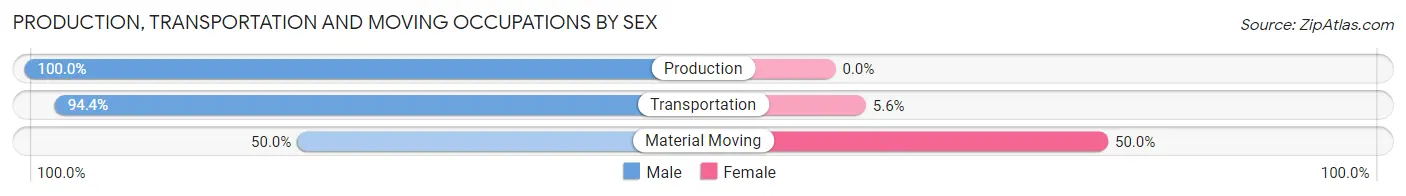
| Occupation | Male | Female |
| Production | 38 (100.0%) | 0 (0.0%) |
| Transportation | 34 (94.4%) | 2 (5.6%) |
| Material Moving | 8 (50.0%) | 8 (50.0%) |
| Total (Category) | 80 (88.9%) | 10 (11.1%) |
| Total (Overall) | 205 (51.6%) | 192 (48.4%) |
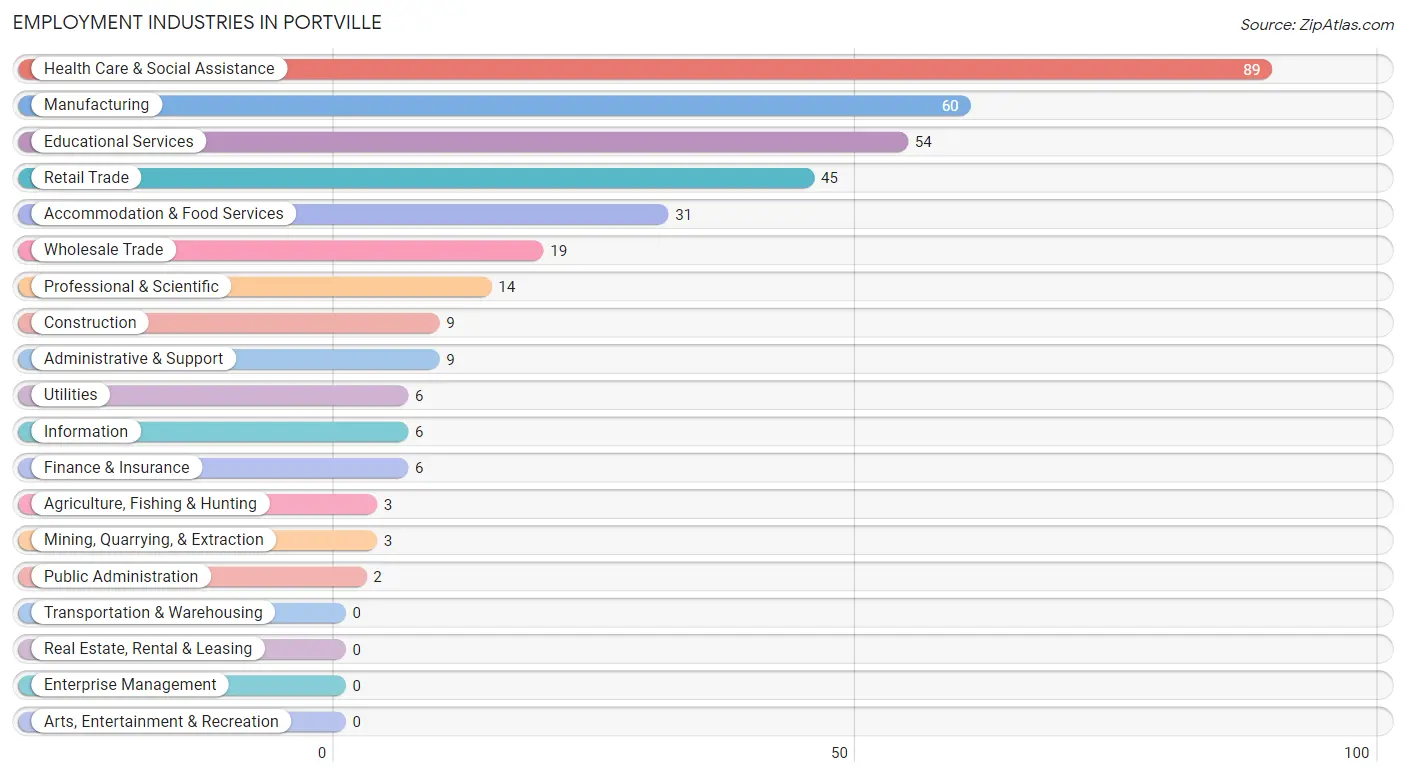
Employment Industries by Sex in Portville
Employment Industries in Portville
The major employment industries in Portville include Health Care & Social Assistance (89 | 22.4%), Manufacturing (60 | 15.1%), Educational Services (54 | 13.6%), Retail Trade (45 | 11.3%), and Accommodation & Food Services (31 | 7.8%).
Employment Industries by Sex in Portville
The Portville industries that see more men than women are Agriculture, Fishing & Hunting (100.0%), Mining, Quarrying, & Extraction (100.0%), and Construction (100.0%), whereas the industries that tend to have a higher number of women are Wholesale Trade (73.7%), Administrative & Support (66.7%), and Educational Services (64.8%).
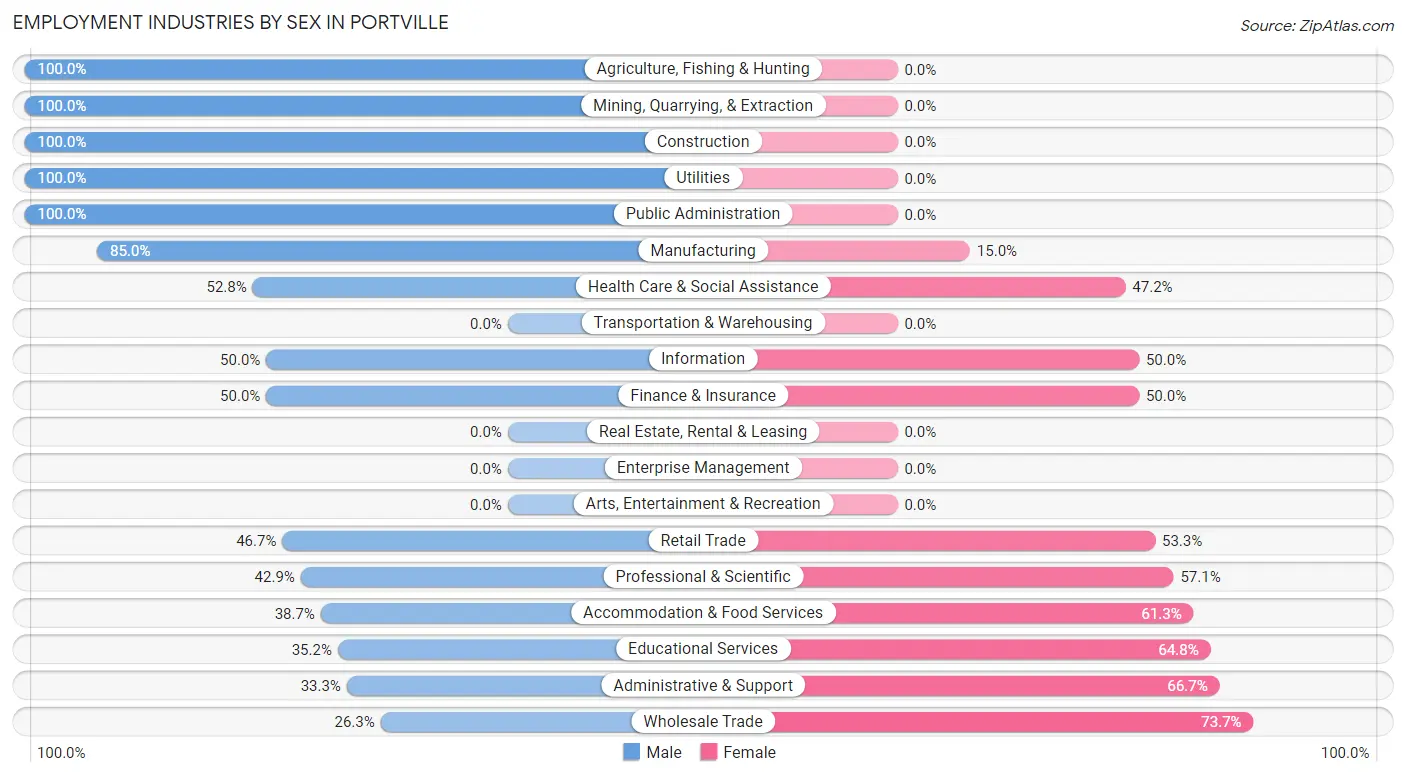
| Industry | Male | Female |
| Agriculture, Fishing & Hunting | 3 (100.0%) | 0 (0.0%) |
| Mining, Quarrying, & Extraction | 3 (100.0%) | 0 (0.0%) |
| Construction | 9 (100.0%) | 0 (0.0%) |
| Manufacturing | 51 (85.0%) | 9 (15.0%) |
| Wholesale Trade | 5 (26.3%) | 14 (73.7%) |
| Retail Trade | 21 (46.7%) | 24 (53.3%) |
| Transportation & Warehousing | 0 (0.0%) | 0 (0.0%) |
| Utilities | 6 (100.0%) | 0 (0.0%) |
| Information | 3 (50.0%) | 3 (50.0%) |
| Finance & Insurance | 3 (50.0%) | 3 (50.0%) |
| Real Estate, Rental & Leasing | 0 (0.0%) | 0 (0.0%) |
| Professional & Scientific | 6 (42.9%) | 8 (57.1%) |
| Enterprise Management | 0 (0.0%) | 0 (0.0%) |
| Administrative & Support | 3 (33.3%) | 6 (66.7%) |
| Educational Services | 19 (35.2%) | 35 (64.8%) |
| Health Care & Social Assistance | 47 (52.8%) | 42 (47.2%) |
| Arts, Entertainment & Recreation | 0 (0.0%) | 0 (0.0%) |
| Accommodation & Food Services | 12 (38.7%) | 19 (61.3%) |
| Public Administration | 2 (100.0%) | 0 (0.0%) |
| Total | 205 (51.6%) | 192 (48.4%) |
Education in Portville
School Enrollment in Portville
The most common levels of schooling among the 223 students in Portville are high school (103 | 46.2%), middle school (57 | 25.6%), and college / undergraduate (30 | 13.5%).
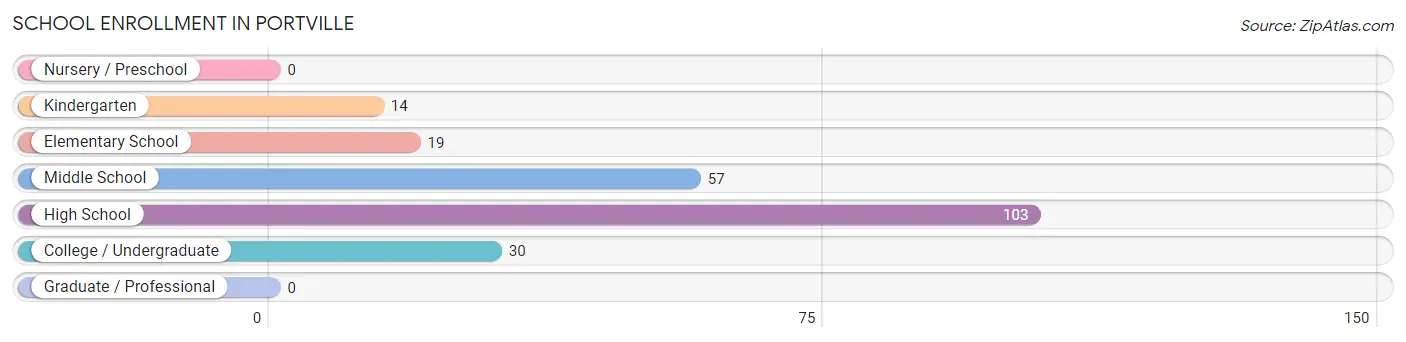
| School Level | # Students | % Students |
| Nursery / Preschool | 0 | 0.0% |
| Kindergarten | 14 | 6.3% |
| Elementary School | 19 | 8.5% |
| Middle School | 57 | 25.6% |
| High School | 103 | 46.2% |
| College / Undergraduate | 30 | 13.5% |
| Graduate / Professional | 0 | 0.0% |
| Total | 223 | 100.0% |
School Enrollment by Age by Funding Source in Portville
Out of a total of 223 students who are enrolled in schools in Portville, 12 (5.4%) attend a private institution, while the remaining 211 (94.6%) are enrolled in public schools. The age group of 5 to 9 year old has the highest likelihood of being enrolled in private schools, with 9 (27.3% in the age bracket) enrolled. Conversely, the age group of 15 to 17 year olds has the lowest likelihood of being enrolled in a private school, with 94 (100.0% in the age bracket) attending a public institution.
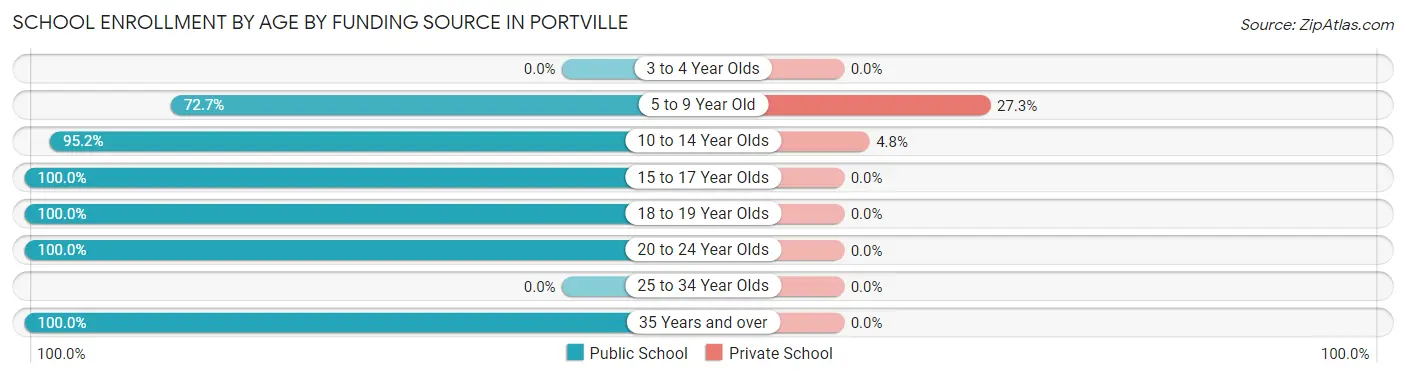
| Age Bracket | Public School | Private School |
| 3 to 4 Year Olds | 0 (0.0%) | 0 (0.0%) |
| 5 to 9 Year Old | 24 (72.7%) | 9 (27.3%) |
| 10 to 14 Year Olds | 60 (95.2%) | 3 (4.8%) |
| 15 to 17 Year Olds | 94 (100.0%) | 0 (0.0%) |
| 18 to 19 Year Olds | 10 (100.0%) | 0 (0.0%) |
| 20 to 24 Year Olds | 11 (100.0%) | 0 (0.0%) |
| 25 to 34 Year Olds | 0 (0.0%) | 0 (0.0%) |
| 35 Years and over | 12 (100.0%) | 0 (0.0%) |
| Total | 211 (94.6%) | 12 (5.4%) |
Educational Attainment by Field of Study in Portville
Business (26 | 17.0%), education (25 | 16.3%), science & technology (21 | 13.7%), liberal arts & history (16 | 10.5%), and bio, nature & agricultural (14 | 9.1%) are the most common fields of study among 153 individuals in Portville who have obtained a bachelor's degree or higher.
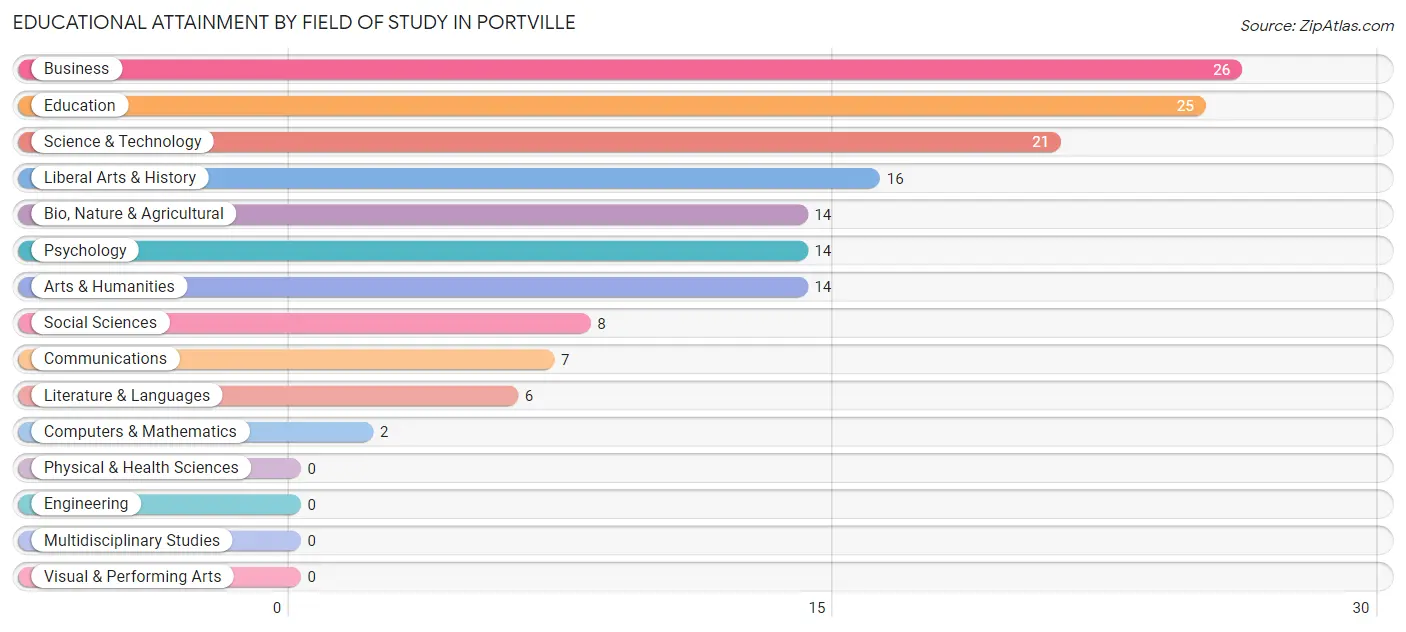
| Field of Study | # Graduates | % Graduates |
| Computers & Mathematics | 2 | 1.3% |
| Bio, Nature & Agricultural | 14 | 9.1% |
| Physical & Health Sciences | 0 | 0.0% |
| Psychology | 14 | 9.1% |
| Social Sciences | 8 | 5.2% |
| Engineering | 0 | 0.0% |
| Multidisciplinary Studies | 0 | 0.0% |
| Science & Technology | 21 | 13.7% |
| Business | 26 | 17.0% |
| Education | 25 | 16.3% |
| Literature & Languages | 6 | 3.9% |
| Liberal Arts & History | 16 | 10.5% |
| Visual & Performing Arts | 0 | 0.0% |
| Communications | 7 | 4.6% |
| Arts & Humanities | 14 | 9.1% |
| Total | 153 | 100.0% |
Transportation & Commute in Portville
Vehicle Availability by Sex in Portville
The most prevalent vehicle ownership categories in Portville are males with 2 vehicles (123, accounting for 60.0%) and females with 2 vehicles (75, making up 66.8%).
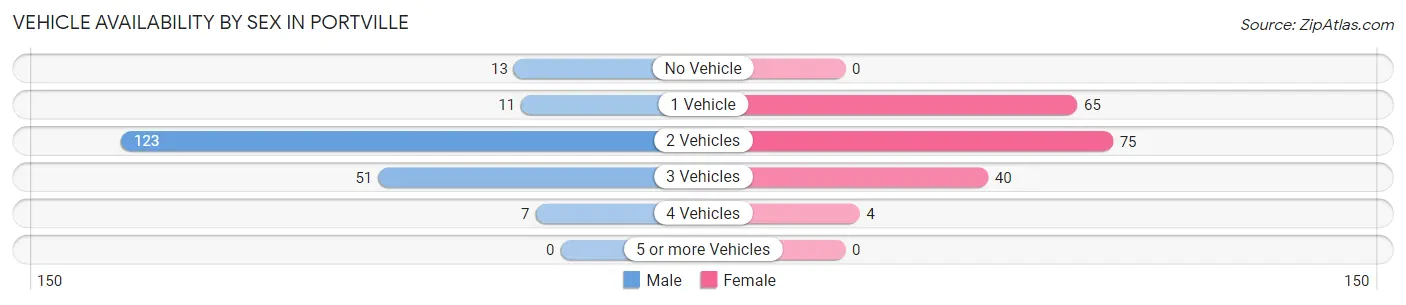
| Vehicles Available | Male | Female |
| No Vehicle | 13 (6.3%) | 0 (0.0%) |
| 1 Vehicle | 11 (5.4%) | 65 (35.3%) |
| 2 Vehicles | 123 (60.0%) | 75 (40.8%) |
| 3 Vehicles | 51 (24.9%) | 40 (21.7%) |
| 4 Vehicles | 7 (3.4%) | 4 (2.2%) |
| 5 or more Vehicles | 0 (0.0%) | 0 (0.0%) |
| Total | 205 (100.0%) | 184 (100.0%) |
Commute Time in Portville
The most frequently occuring commute durations in Portville are 15 to 19 minutes (100 commuters, 26.9%), 20 to 24 minutes (61 commuters, 16.4%), and less than 5 minutes (59 commuters, 15.9%).
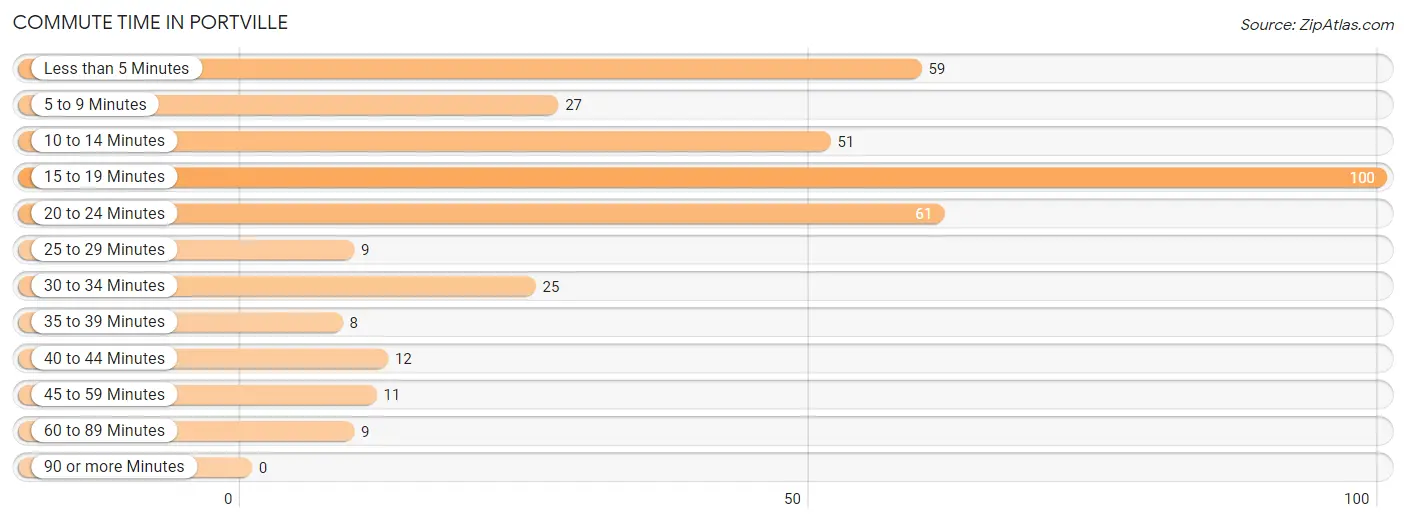
| Commute Time | # Commuters | % Commuters |
| Less than 5 Minutes | 59 | 15.9% |
| 5 to 9 Minutes | 27 | 7.3% |
| 10 to 14 Minutes | 51 | 13.7% |
| 15 to 19 Minutes | 100 | 26.9% |
| 20 to 24 Minutes | 61 | 16.4% |
| 25 to 29 Minutes | 9 | 2.4% |
| 30 to 34 Minutes | 25 | 6.7% |
| 35 to 39 Minutes | 8 | 2.1% |
| 40 to 44 Minutes | 12 | 3.2% |
| 45 to 59 Minutes | 11 | 3.0% |
| 60 to 89 Minutes | 9 | 2.4% |
| 90 or more Minutes | 0 | 0.0% |
Commute Time by Sex in Portville
The most common commute times in Portville are less than 5 minutes (42 commuters, 21.1%) for males and 15 to 19 minutes (68 commuters, 39.3%) for females.
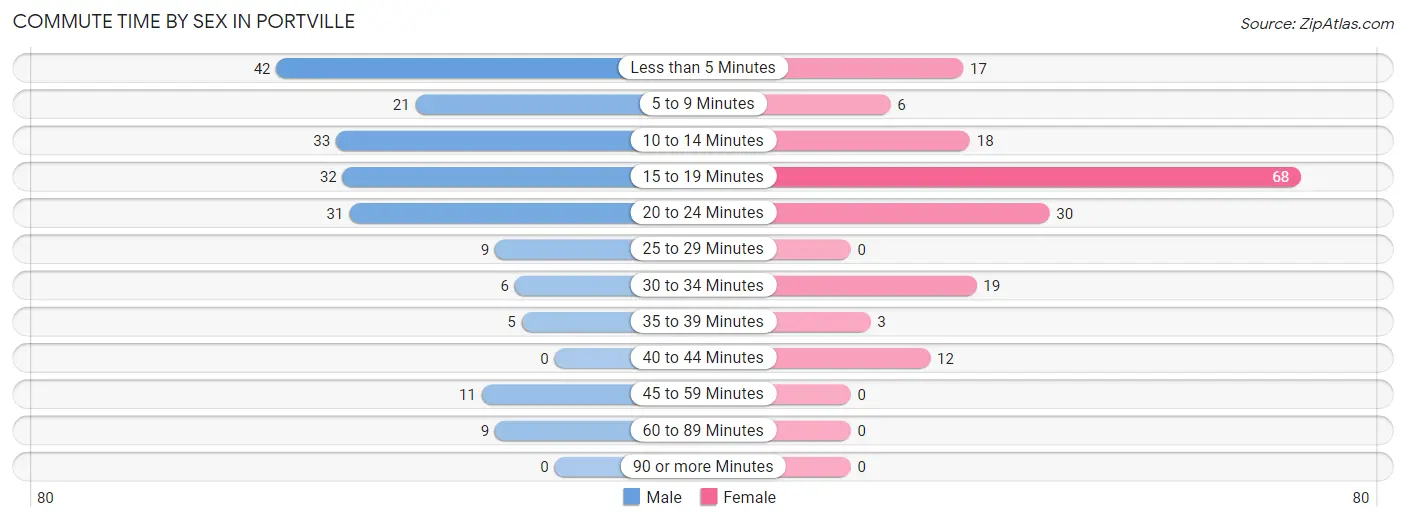
| Commute Time | Male | Female |
| Less than 5 Minutes | 42 (21.1%) | 17 (9.8%) |
| 5 to 9 Minutes | 21 (10.5%) | 6 (3.5%) |
| 10 to 14 Minutes | 33 (16.6%) | 18 (10.4%) |
| 15 to 19 Minutes | 32 (16.1%) | 68 (39.3%) |
| 20 to 24 Minutes | 31 (15.6%) | 30 (17.3%) |
| 25 to 29 Minutes | 9 (4.5%) | 0 (0.0%) |
| 30 to 34 Minutes | 6 (3.0%) | 19 (11.0%) |
| 35 to 39 Minutes | 5 (2.5%) | 3 (1.7%) |
| 40 to 44 Minutes | 0 (0.0%) | 12 (6.9%) |
| 45 to 59 Minutes | 11 (5.5%) | 0 (0.0%) |
| 60 to 89 Minutes | 9 (4.5%) | 0 (0.0%) |
| 90 or more Minutes | 0 (0.0%) | 0 (0.0%) |
Time of Departure to Work by Sex in Portville
The most frequent times of departure to work in Portville are 6:00 AM to 6:29 AM (30, 15.1%) for males and 7:30 AM to 7:59 AM (55, 31.8%) for females.
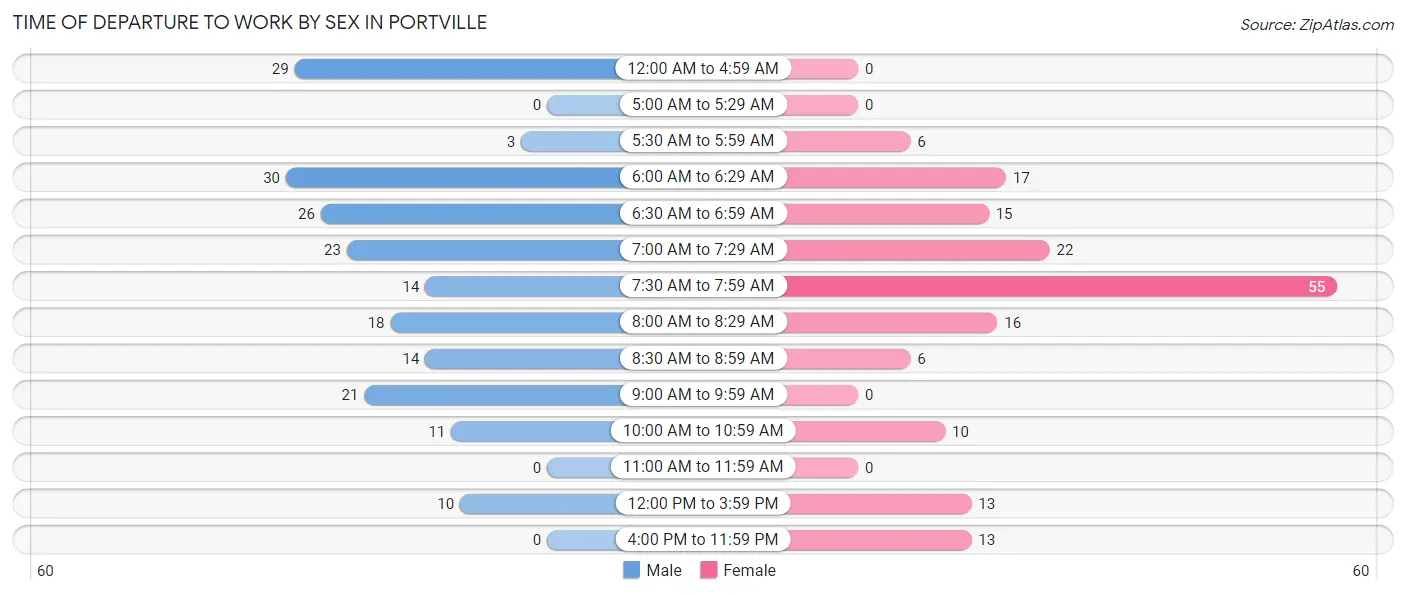
| Time of Departure | Male | Female |
| 12:00 AM to 4:59 AM | 29 (14.6%) | 0 (0.0%) |
| 5:00 AM to 5:29 AM | 0 (0.0%) | 0 (0.0%) |
| 5:30 AM to 5:59 AM | 3 (1.5%) | 6 (3.5%) |
| 6:00 AM to 6:29 AM | 30 (15.1%) | 17 (9.8%) |
| 6:30 AM to 6:59 AM | 26 (13.1%) | 15 (8.7%) |
| 7:00 AM to 7:29 AM | 23 (11.6%) | 22 (12.7%) |
| 7:30 AM to 7:59 AM | 14 (7.0%) | 55 (31.8%) |
| 8:00 AM to 8:29 AM | 18 (9.0%) | 16 (9.2%) |
| 8:30 AM to 8:59 AM | 14 (7.0%) | 6 (3.5%) |
| 9:00 AM to 9:59 AM | 21 (10.5%) | 0 (0.0%) |
| 10:00 AM to 10:59 AM | 11 (5.5%) | 10 (5.8%) |
| 11:00 AM to 11:59 AM | 0 (0.0%) | 0 (0.0%) |
| 12:00 PM to 3:59 PM | 10 (5.0%) | 13 (7.5%) |
| 4:00 PM to 11:59 PM | 0 (0.0%) | 13 (7.5%) |
| Total | 199 (100.0%) | 173 (100.0%) |
Housing Occupancy in Portville
Occupancy by Ownership in Portville
Of the total 374 dwellings in Portville, owner-occupied units account for 246 (65.8%), while renter-occupied units make up 128 (34.2%).
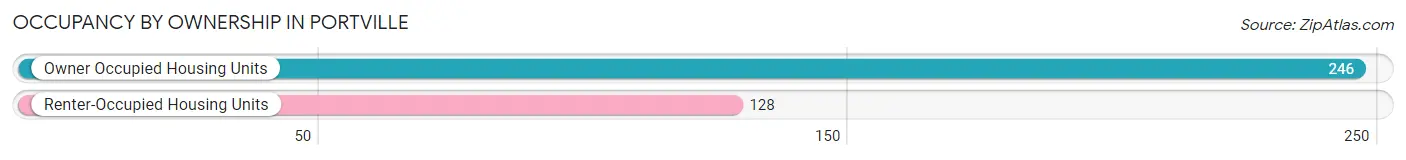
| Occupancy | # Housing Units | % Housing Units |
| Owner Occupied Housing Units | 246 | 65.8% |
| Renter-Occupied Housing Units | 128 | 34.2% |
| Total Occupied Housing Units | 374 | 100.0% |
Occupancy by Household Size in Portville
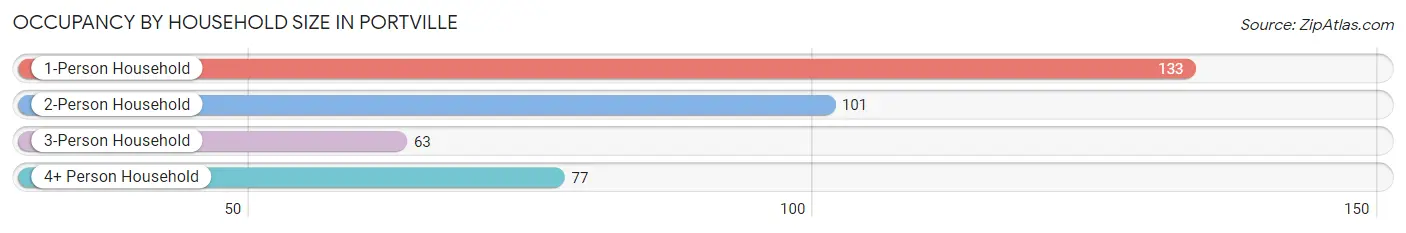
| Household Size | # Housing Units | % Housing Units |
| 1-Person Household | 133 | 35.6% |
| 2-Person Household | 101 | 27.0% |
| 3-Person Household | 63 | 16.8% |
| 4+ Person Household | 77 | 20.6% |
| Total Housing Units | 374 | 100.0% |
Occupancy by Ownership by Household Size in Portville
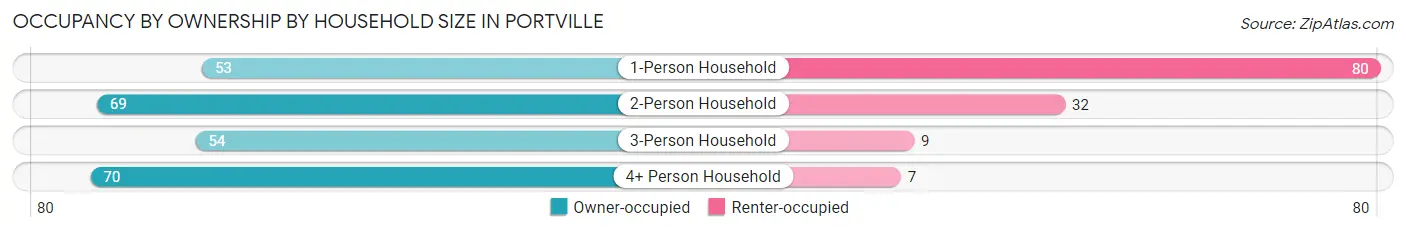
| Household Size | Owner-occupied | Renter-occupied |
| 1-Person Household | 53 (39.9%) | 80 (60.2%) |
| 2-Person Household | 69 (68.3%) | 32 (31.7%) |
| 3-Person Household | 54 (85.7%) | 9 (14.3%) |
| 4+ Person Household | 70 (90.9%) | 7 (9.1%) |
| Total Housing Units | 246 (65.8%) | 128 (34.2%) |
Occupancy by Educational Attainment in Portville
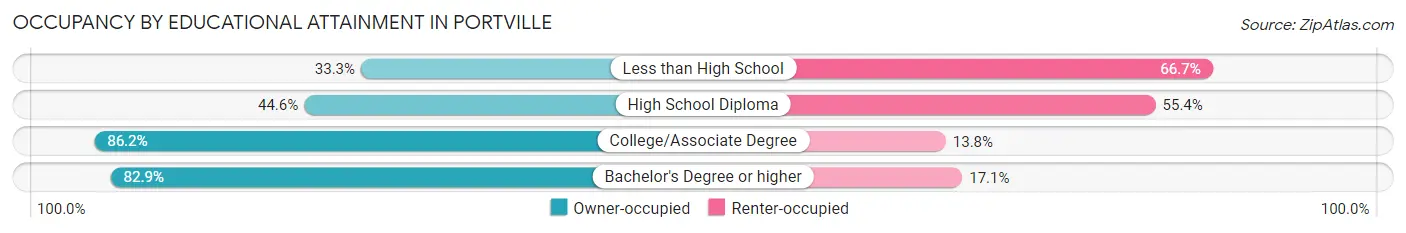
| Household Size | Owner-occupied | Renter-occupied |
| Less than High School | 10 (33.3%) | 20 (66.7%) |
| High School Diploma | 62 (44.6%) | 77 (55.4%) |
| College/Associate Degree | 106 (86.2%) | 17 (13.8%) |
| Bachelor's Degree or higher | 68 (82.9%) | 14 (17.1%) |
Occupancy by Age of Householder in Portville
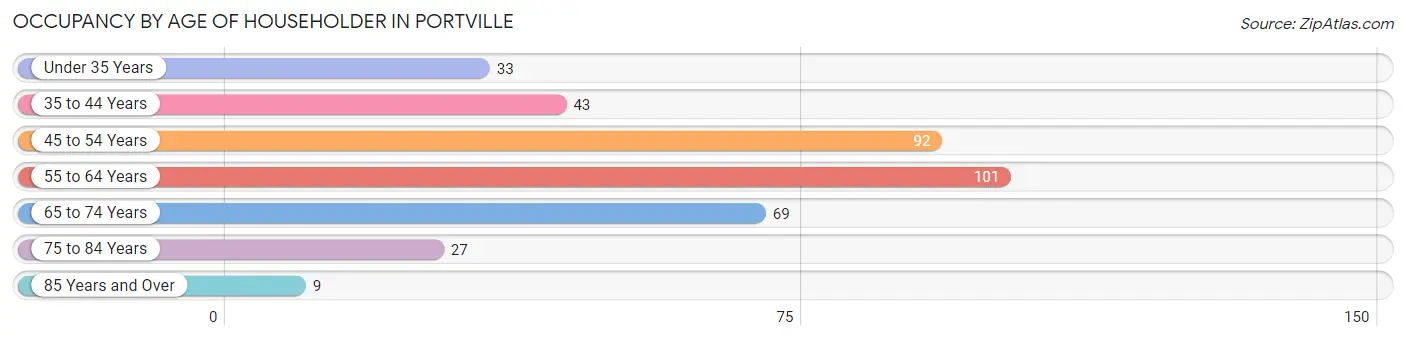
| Age Bracket | # Households | % Households |
| Under 35 Years | 33 | 8.8% |
| 35 to 44 Years | 43 | 11.5% |
| 45 to 54 Years | 92 | 24.6% |
| 55 to 64 Years | 101 | 27.0% |
| 65 to 74 Years | 69 | 18.4% |
| 75 to 84 Years | 27 | 7.2% |
| 85 Years and Over | 9 | 2.4% |
| Total | 374 | 100.0% |
Housing Finances in Portville
Median Income by Occupancy in Portville
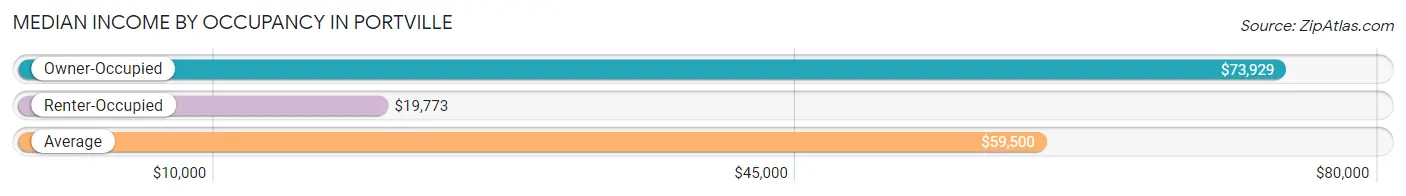
| Occupancy Type | # Households | Median Income |
| Owner-Occupied | 246 (65.8%) | $73,929 |
| Renter-Occupied | 128 (34.2%) | $19,773 |
| Average | 374 (100.0%) | $59,500 |
Occupancy by Householder Income Bracket in Portville
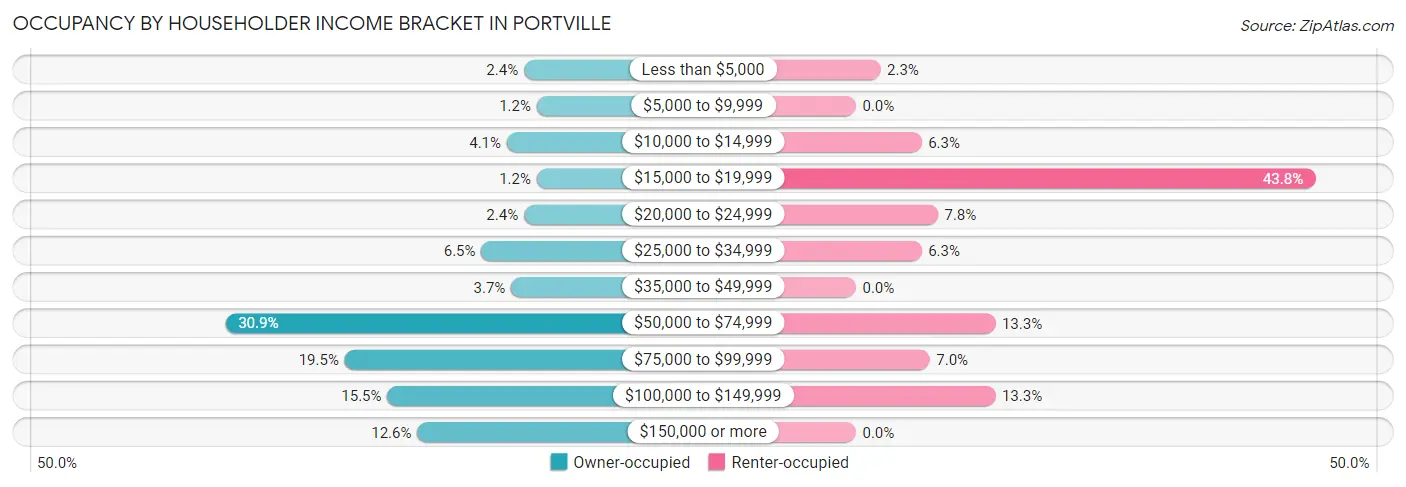
| Income Bracket | Owner-occupied | Renter-occupied |
| Less than $5,000 | 6 (2.4%) | 3 (2.3%) |
| $5,000 to $9,999 | 3 (1.2%) | 0 (0.0%) |
| $10,000 to $14,999 | 10 (4.1%) | 8 (6.2%) |
| $15,000 to $19,999 | 3 (1.2%) | 56 (43.8%) |
| $20,000 to $24,999 | 6 (2.4%) | 10 (7.8%) |
| $25,000 to $34,999 | 16 (6.5%) | 8 (6.2%) |
| $35,000 to $49,999 | 9 (3.7%) | 0 (0.0%) |
| $50,000 to $74,999 | 76 (30.9%) | 17 (13.3%) |
| $75,000 to $99,999 | 48 (19.5%) | 9 (7.0%) |
| $100,000 to $149,999 | 38 (15.4%) | 17 (13.3%) |
| $150,000 or more | 31 (12.6%) | 0 (0.0%) |
| Total | 246 (100.0%) | 128 (100.0%) |
Monthly Housing Cost Tiers in Portville
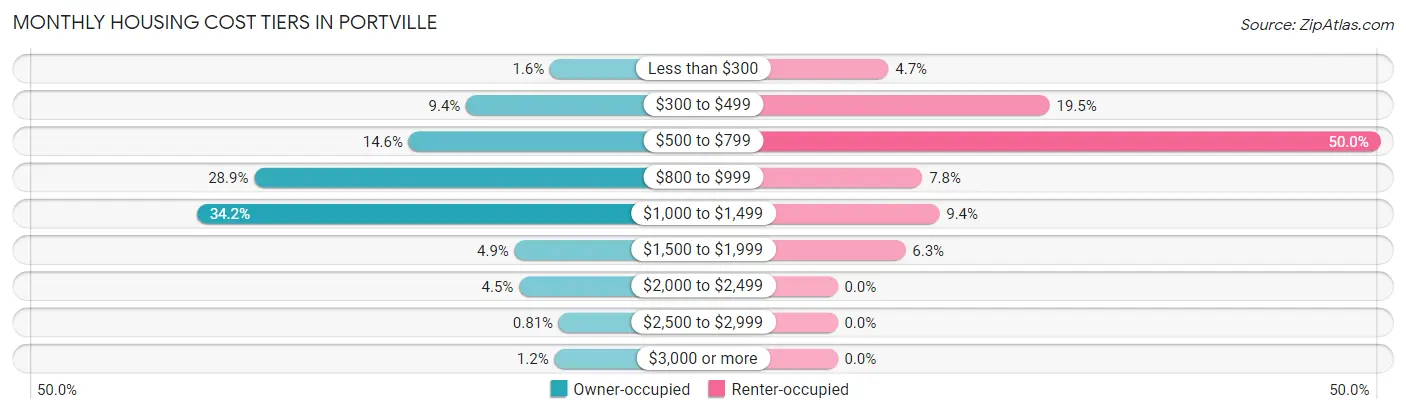
| Monthly Cost | Owner-occupied | Renter-occupied |
| Less than $300 | 4 (1.6%) | 6 (4.7%) |
| $300 to $499 | 23 (9.3%) | 25 (19.5%) |
| $500 to $799 | 36 (14.6%) | 64 (50.0%) |
| $800 to $999 | 71 (28.9%) | 10 (7.8%) |
| $1,000 to $1,499 | 84 (34.2%) | 12 (9.4%) |
| $1,500 to $1,999 | 12 (4.9%) | 8 (6.2%) |
| $2,000 to $2,499 | 11 (4.5%) | 0 (0.0%) |
| $2,500 to $2,999 | 2 (0.8%) | 0 (0.0%) |
| $3,000 or more | 3 (1.2%) | 0 (0.0%) |
| Total | 246 (100.0%) | 128 (100.0%) |
Physical Housing Characteristics in Portville
Housing Structures in Portville
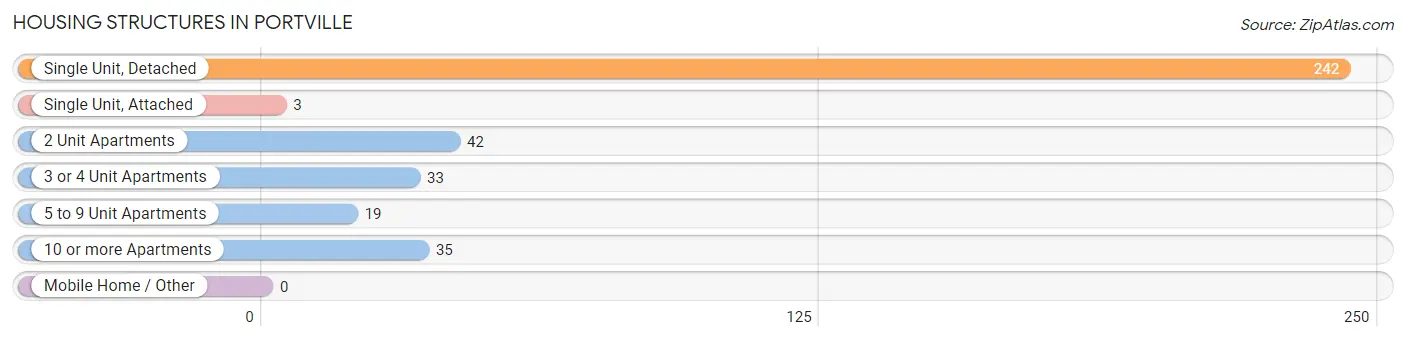
| Structure Type | # Housing Units | % Housing Units |
| Single Unit, Detached | 242 | 64.7% |
| Single Unit, Attached | 3 | 0.8% |
| 2 Unit Apartments | 42 | 11.2% |
| 3 or 4 Unit Apartments | 33 | 8.8% |
| 5 to 9 Unit Apartments | 19 | 5.1% |
| 10 or more Apartments | 35 | 9.4% |
| Mobile Home / Other | 0 | 0.0% |
| Total | 374 | 100.0% |
Housing Structures by Occupancy in Portville
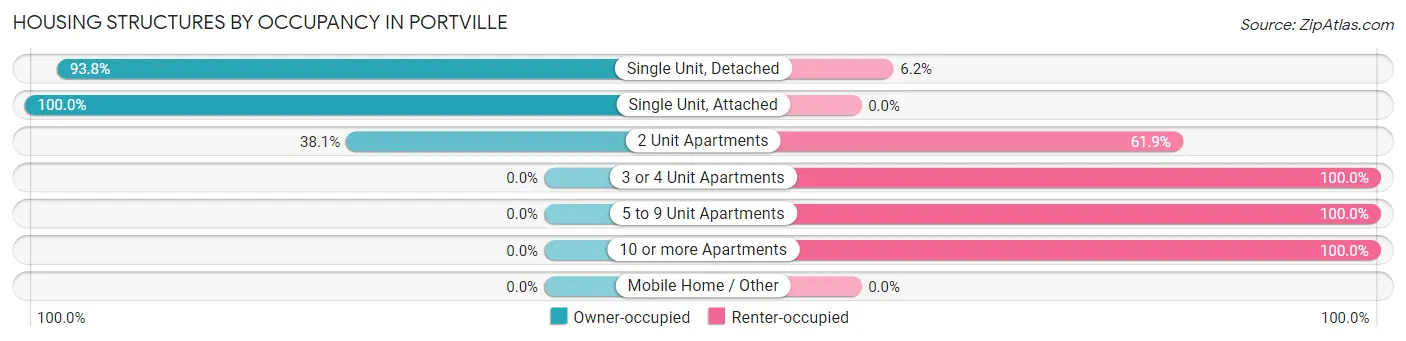
| Structure Type | Owner-occupied | Renter-occupied |
| Single Unit, Detached | 227 (93.8%) | 15 (6.2%) |
| Single Unit, Attached | 3 (100.0%) | 0 (0.0%) |
| 2 Unit Apartments | 16 (38.1%) | 26 (61.9%) |
| 3 or 4 Unit Apartments | 0 (0.0%) | 33 (100.0%) |
| 5 to 9 Unit Apartments | 0 (0.0%) | 19 (100.0%) |
| 10 or more Apartments | 0 (0.0%) | 35 (100.0%) |
| Mobile Home / Other | 0 (0.0%) | 0 (0.0%) |
| Total | 246 (65.8%) | 128 (34.2%) |
Housing Structures by Number of Rooms in Portville
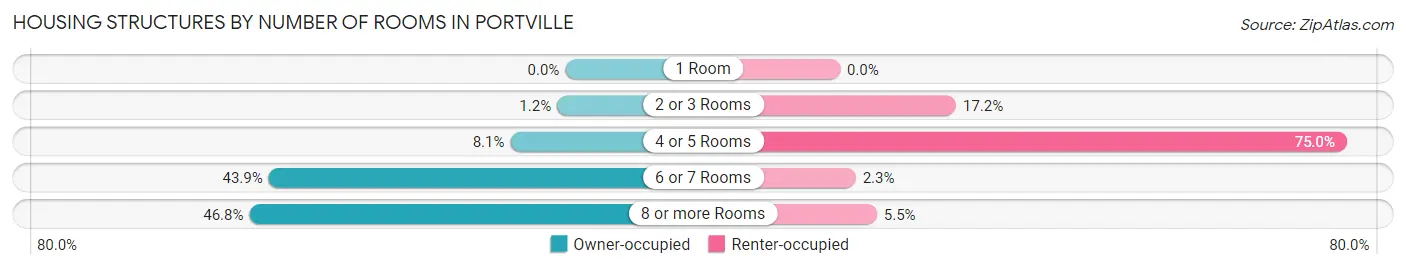
| Number of Rooms | Owner-occupied | Renter-occupied |
| 1 Room | 0 (0.0%) | 0 (0.0%) |
| 2 or 3 Rooms | 3 (1.2%) | 22 (17.2%) |
| 4 or 5 Rooms | 20 (8.1%) | 96 (75.0%) |
| 6 or 7 Rooms | 108 (43.9%) | 3 (2.3%) |
| 8 or more Rooms | 115 (46.8%) | 7 (5.5%) |
| Total | 246 (100.0%) | 128 (100.0%) |
Housing Structure by Heating Type in Portville
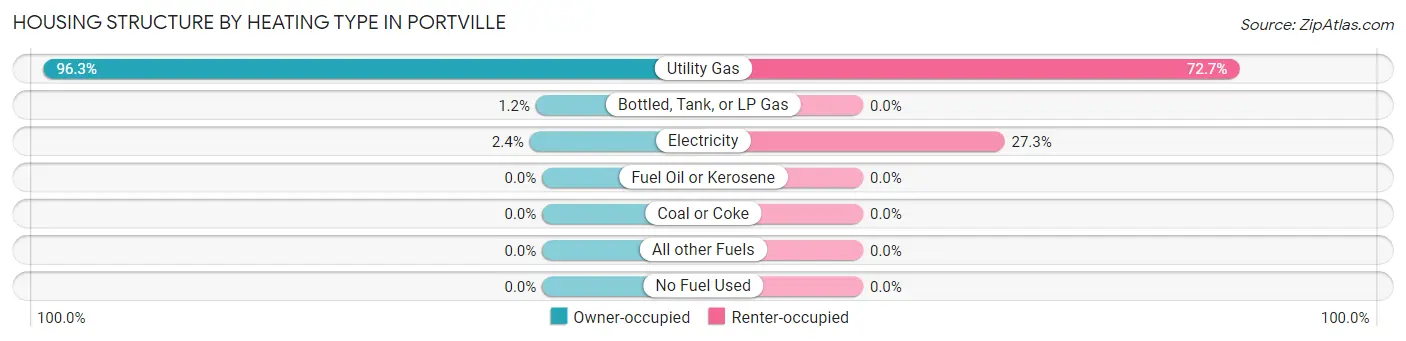
| Heating Type | Owner-occupied | Renter-occupied |
| Utility Gas | 237 (96.3%) | 93 (72.7%) |
| Bottled, Tank, or LP Gas | 3 (1.2%) | 0 (0.0%) |
| Electricity | 6 (2.4%) | 35 (27.3%) |
| Fuel Oil or Kerosene | 0 (0.0%) | 0 (0.0%) |
| Coal or Coke | 0 (0.0%) | 0 (0.0%) |
| All other Fuels | 0 (0.0%) | 0 (0.0%) |
| No Fuel Used | 0 (0.0%) | 0 (0.0%) |
| Total | 246 (100.0%) | 128 (100.0%) |
Household Vehicle Usage in Portville
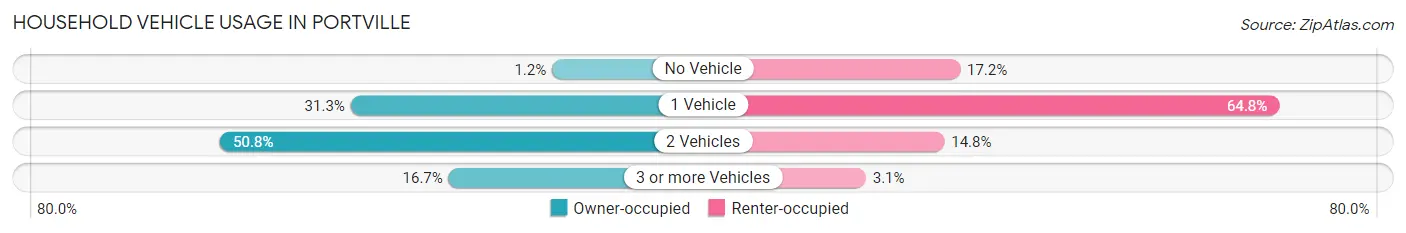
| Vehicles per Household | Owner-occupied | Renter-occupied |
| No Vehicle | 3 (1.2%) | 22 (17.2%) |
| 1 Vehicle | 77 (31.3%) | 83 (64.8%) |
| 2 Vehicles | 125 (50.8%) | 19 (14.8%) |
| 3 or more Vehicles | 41 (16.7%) | 4 (3.1%) |
| Total | 246 (100.0%) | 128 (100.0%) |
Real Estate & Mortgages in Portville
Real Estate and Mortgage Overview in Portville
| Characteristic | Without Mortgage | With Mortgage |
| Housing Units | 83 | 163 |
| Median Property Value | $91,900 | $102,900 |
| Median Household Income | $68,958 | $28 |
| Monthly Housing Costs | $585 | $3 |
| Real Estate Taxes | $2,567 | $0 |
Property Value by Mortgage Status in Portville
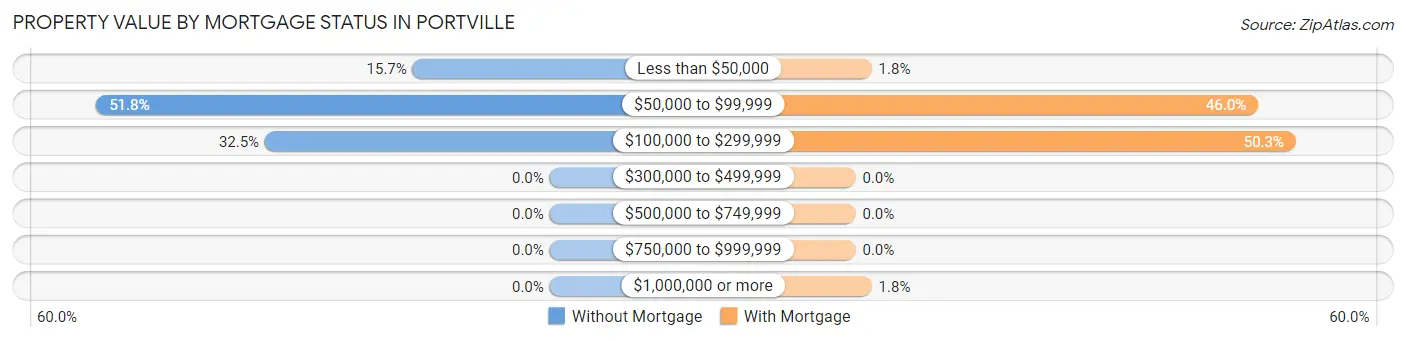
| Property Value | Without Mortgage | With Mortgage |
| Less than $50,000 | 13 (15.7%) | 3 (1.8%) |
| $50,000 to $99,999 | 43 (51.8%) | 75 (46.0%) |
| $100,000 to $299,999 | 27 (32.5%) | 82 (50.3%) |
| $300,000 to $499,999 | 0 (0.0%) | 0 (0.0%) |
| $500,000 to $749,999 | 0 (0.0%) | 0 (0.0%) |
| $750,000 to $999,999 | 0 (0.0%) | 0 (0.0%) |
| $1,000,000 or more | 0 (0.0%) | 3 (1.8%) |
| Total | 83 (100.0%) | 163 (100.0%) |
Household Income by Mortgage Status in Portville
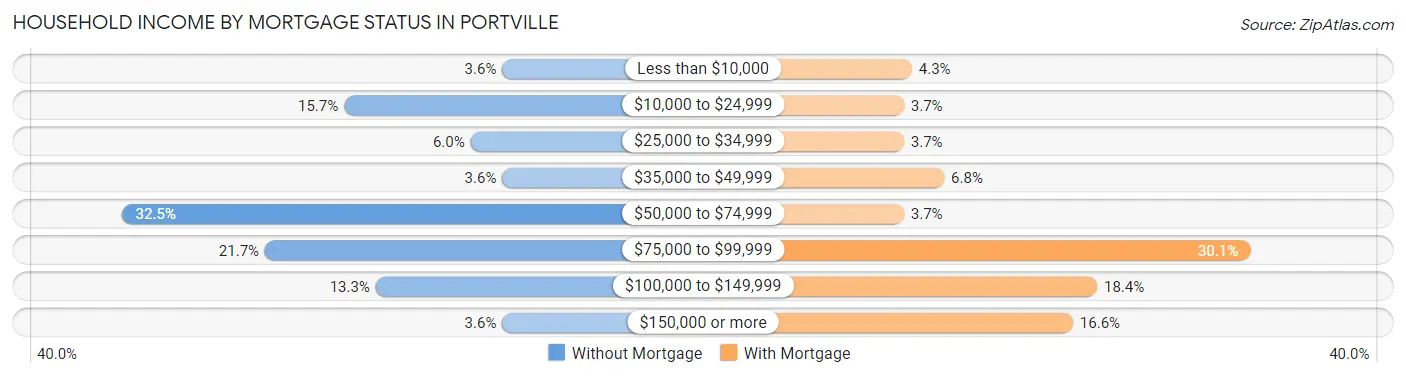
| Household Income | Without Mortgage | With Mortgage |
| Less than $10,000 | 3 (3.6%) | 7 (4.3%) |
| $10,000 to $24,999 | 13 (15.7%) | 6 (3.7%) |
| $25,000 to $34,999 | 5 (6.0%) | 6 (3.7%) |
| $35,000 to $49,999 | 3 (3.6%) | 11 (6.8%) |
| $50,000 to $74,999 | 27 (32.5%) | 6 (3.7%) |
| $75,000 to $99,999 | 18 (21.7%) | 49 (30.1%) |
| $100,000 to $149,999 | 11 (13.3%) | 30 (18.4%) |
| $150,000 or more | 3 (3.6%) | 27 (16.6%) |
| Total | 83 (100.0%) | 163 (100.0%) |
Property Value to Household Income Ratio in Portville
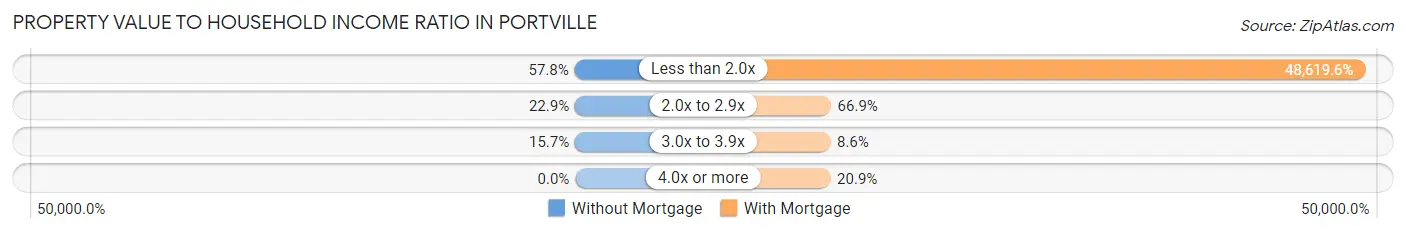
| Value-to-Income Ratio | Without Mortgage | With Mortgage |
| Less than 2.0x | 48 (57.8%) | 79,250 (48,619.6%) |
| 2.0x to 2.9x | 19 (22.9%) | 109 (66.9%) |
| 3.0x to 3.9x | 13 (15.7%) | 14 (8.6%) |
| 4.0x or more | 0 (0.0%) | 34 (20.9%) |
| Total | 83 (100.0%) | 163 (100.0%) |
Real Estate Taxes by Mortgage Status in Portville
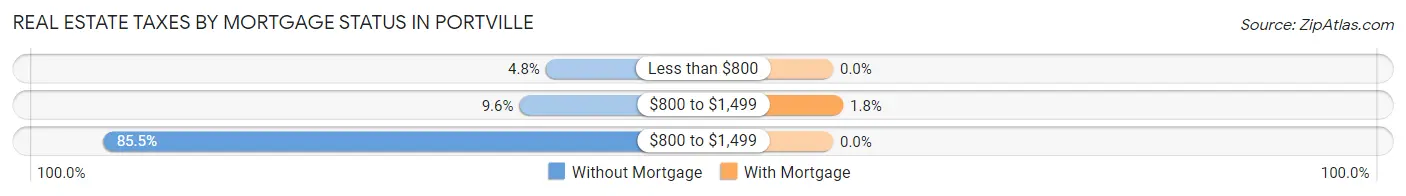
| Property Taxes | Without Mortgage | With Mortgage |
| Less than $800 | 4 (4.8%) | 0 (0.0%) |
| $800 to $1,499 | 8 (9.6%) | 3 (1.8%) |
| $800 to $1,499 | 71 (85.5%) | 0 (0.0%) |
| Total | 83 (100.0%) | 163 (100.0%) |
Health & Disability in Portville
Health Insurance Coverage by Age in Portville
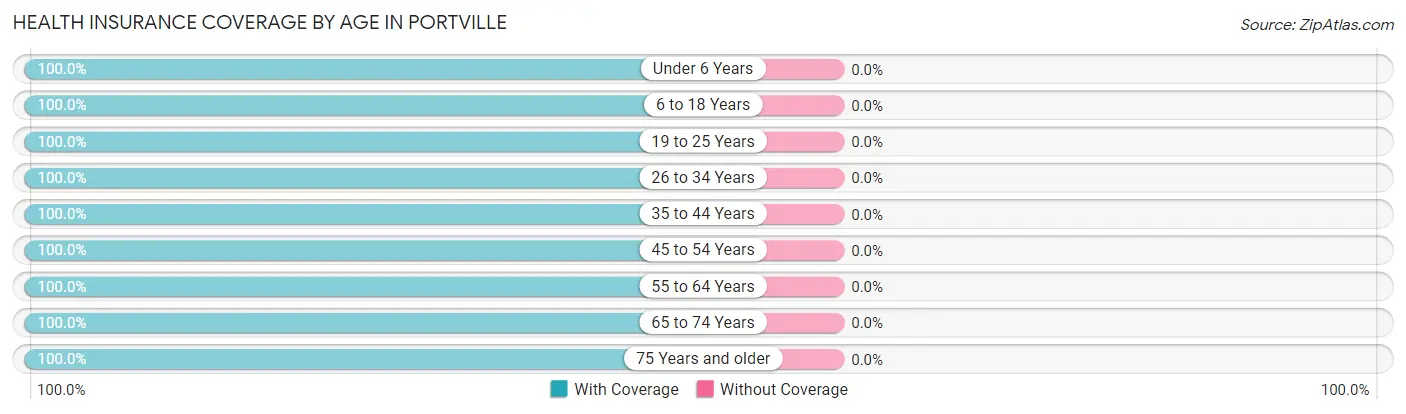
| Age Bracket | With Coverage | Without Coverage |
| Under 6 Years | 27 (100.0%) | 0 (0.0%) |
| 6 to 18 Years | 191 (100.0%) | 0 (0.0%) |
| 19 to 25 Years | 60 (100.0%) | 0 (0.0%) |
| 26 to 34 Years | 35 (100.0%) | 0 (0.0%) |
| 35 to 44 Years | 115 (100.0%) | 0 (0.0%) |
| 45 to 54 Years | 163 (100.0%) | 0 (0.0%) |
| 55 to 64 Years | 138 (100.0%) | 0 (0.0%) |
| 65 to 74 Years | 98 (100.0%) | 0 (0.0%) |
| 75 Years and older | 58 (100.0%) | 0 (0.0%) |
| Total | 885 (100.0%) | 0 (0.0%) |
Health Insurance Coverage by Citizenship Status in Portville
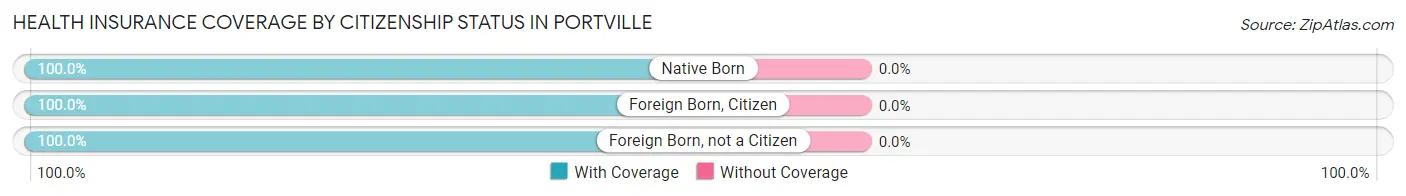
| Citizenship Status | With Coverage | Without Coverage |
| Native Born | 27 (100.0%) | 0 (0.0%) |
| Foreign Born, Citizen | 191 (100.0%) | 0 (0.0%) |
| Foreign Born, not a Citizen | 60 (100.0%) | 0 (0.0%) |
Health Insurance Coverage by Household Income in Portville
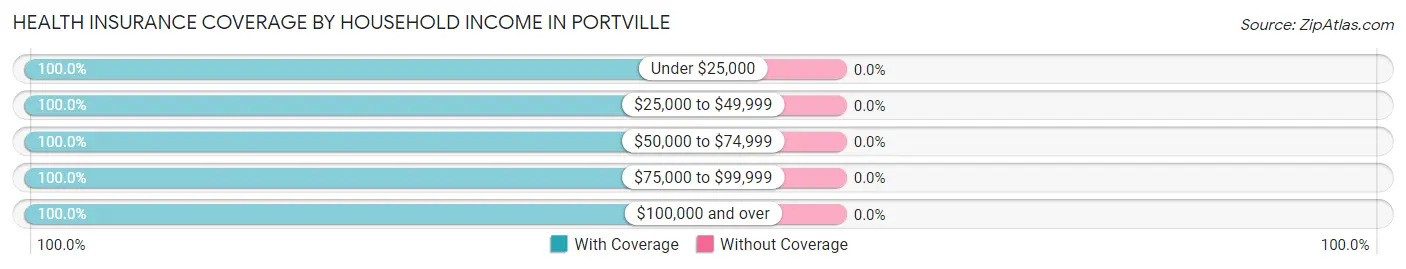
| Household Income | With Coverage | Without Coverage |
| Under $25,000 | 162 (100.0%) | 0 (0.0%) |
| $25,000 to $49,999 | 55 (100.0%) | 0 (0.0%) |
| $50,000 to $74,999 | 248 (100.0%) | 0 (0.0%) |
| $75,000 to $99,999 | 148 (100.0%) | 0 (0.0%) |
| $100,000 and over | 272 (100.0%) | 0 (0.0%) |
Public vs Private Health Insurance Coverage by Age in Portville
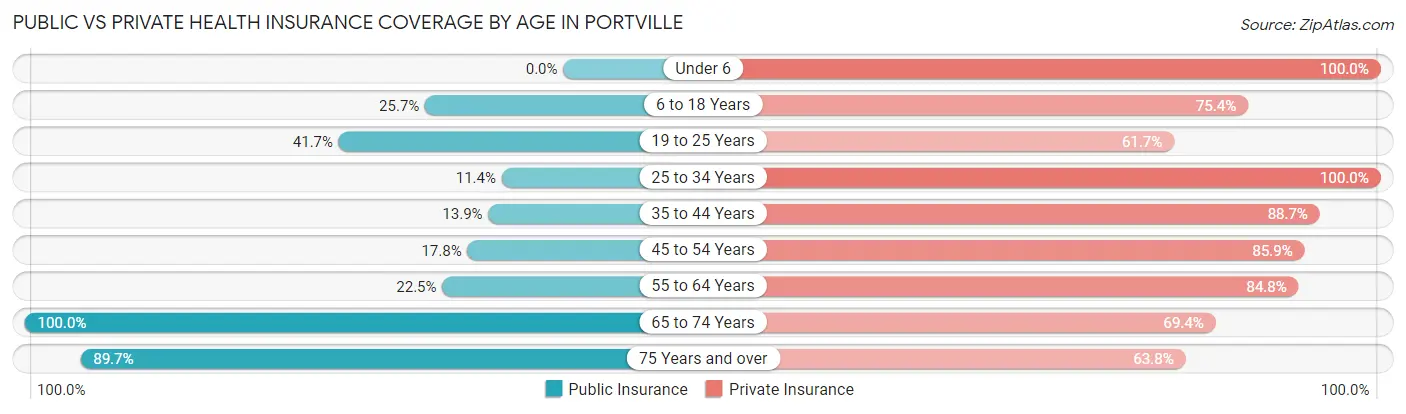
| Age Bracket | Public Insurance | Private Insurance |
| Under 6 | 0 (0.0%) | 27 (100.0%) |
| 6 to 18 Years | 49 (25.7%) | 144 (75.4%) |
| 19 to 25 Years | 25 (41.7%) | 37 (61.7%) |
| 25 to 34 Years | 4 (11.4%) | 35 (100.0%) |
| 35 to 44 Years | 16 (13.9%) | 102 (88.7%) |
| 45 to 54 Years | 29 (17.8%) | 140 (85.9%) |
| 55 to 64 Years | 31 (22.5%) | 117 (84.8%) |
| 65 to 74 Years | 98 (100.0%) | 68 (69.4%) |
| 75 Years and over | 52 (89.7%) | 37 (63.8%) |
| Total | 304 (34.4%) | 707 (79.9%) |
Disability Status by Sex by Age in Portville
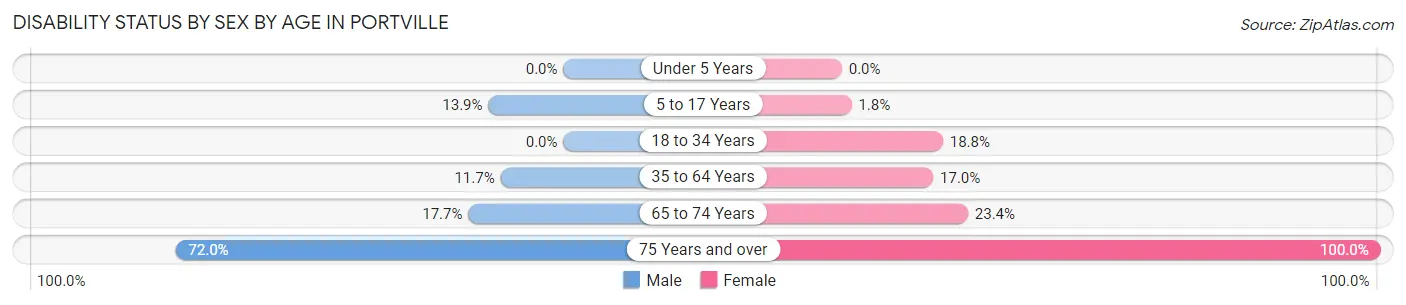
| Age Bracket | Male | Female |
| Under 5 Years | 0 (0.0%) | 0 (0.0%) |
| 5 to 17 Years | 11 (13.9%) | 2 (1.8%) |
| 18 to 34 Years | 0 (0.0%) | 9 (18.8%) |
| 35 to 64 Years | 21 (11.7%) | 40 (17.0%) |
| 65 to 74 Years | 9 (17.6%) | 11 (23.4%) |
| 75 Years and over | 18 (72.0%) | 33 (100.0%) |
Disability Class by Sex by Age in Portville
Disability Class: Hearing Difficulty
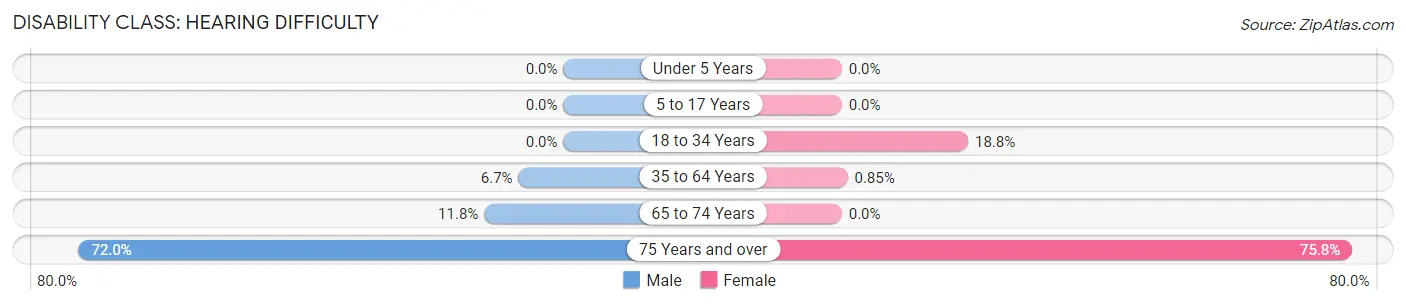
| Age Bracket | Male | Female |
| Under 5 Years | 0 (0.0%) | 0 (0.0%) |
| 5 to 17 Years | 0 (0.0%) | 0 (0.0%) |
| 18 to 34 Years | 0 (0.0%) | 9 (18.8%) |
| 35 to 64 Years | 12 (6.7%) | 2 (0.9%) |
| 65 to 74 Years | 6 (11.8%) | 0 (0.0%) |
| 75 Years and over | 18 (72.0%) | 25 (75.8%) |
Disability Class: Vision Difficulty
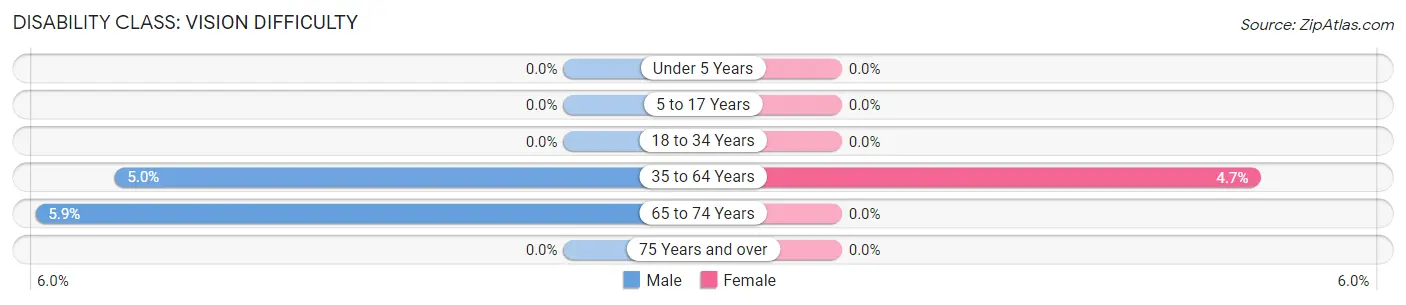
| Age Bracket | Male | Female |
| Under 5 Years | 0 (0.0%) | 0 (0.0%) |
| 5 to 17 Years | 0 (0.0%) | 0 (0.0%) |
| 18 to 34 Years | 0 (0.0%) | 0 (0.0%) |
| 35 to 64 Years | 9 (5.0%) | 11 (4.7%) |
| 65 to 74 Years | 3 (5.9%) | 0 (0.0%) |
| 75 Years and over | 0 (0.0%) | 0 (0.0%) |
Disability Class: Cognitive Difficulty
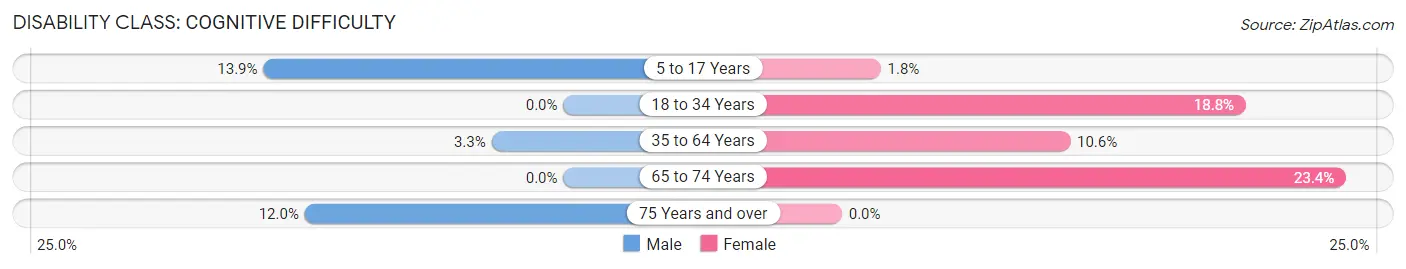
| Age Bracket | Male | Female |
| 5 to 17 Years | 11 (13.9%) | 2 (1.8%) |
| 18 to 34 Years | 0 (0.0%) | 9 (18.8%) |
| 35 to 64 Years | 6 (3.3%) | 25 (10.6%) |
| 65 to 74 Years | 0 (0.0%) | 11 (23.4%) |
| 75 Years and over | 3 (12.0%) | 0 (0.0%) |
Disability Class: Ambulatory Difficulty
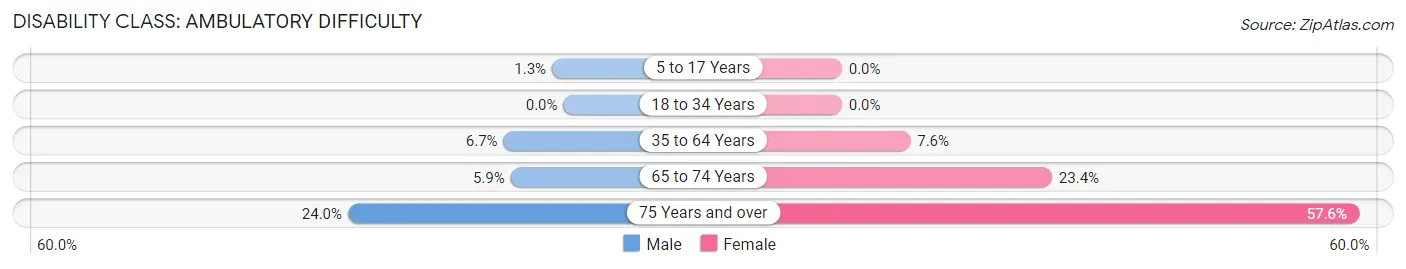
| Age Bracket | Male | Female |
| 5 to 17 Years | 1 (1.3%) | 0 (0.0%) |
| 18 to 34 Years | 0 (0.0%) | 0 (0.0%) |
| 35 to 64 Years | 12 (6.7%) | 18 (7.6%) |
| 65 to 74 Years | 3 (5.9%) | 11 (23.4%) |
| 75 Years and over | 6 (24.0%) | 19 (57.6%) |
Disability Class: Self-Care Difficulty
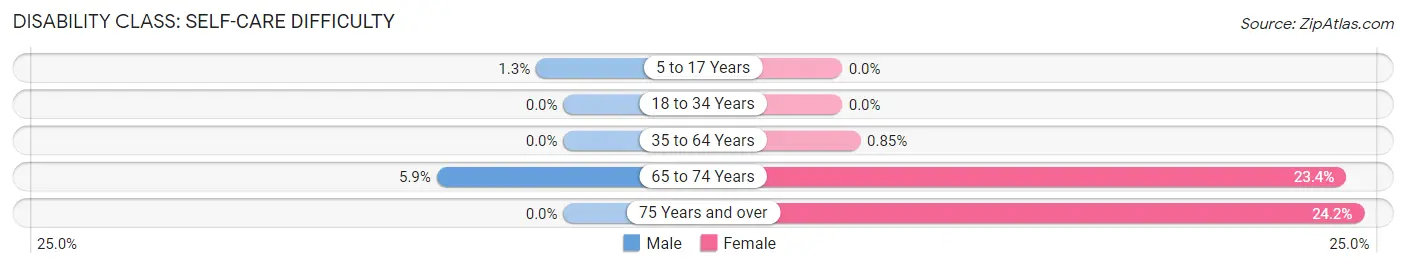
| Age Bracket | Male | Female |
| 5 to 17 Years | 1 (1.3%) | 0 (0.0%) |
| 18 to 34 Years | 0 (0.0%) | 0 (0.0%) |
| 35 to 64 Years | 0 (0.0%) | 2 (0.9%) |
| 65 to 74 Years | 3 (5.9%) | 11 (23.4%) |
| 75 Years and over | 0 (0.0%) | 8 (24.2%) |
Technology Access in Portville
Computing Device Access in Portville
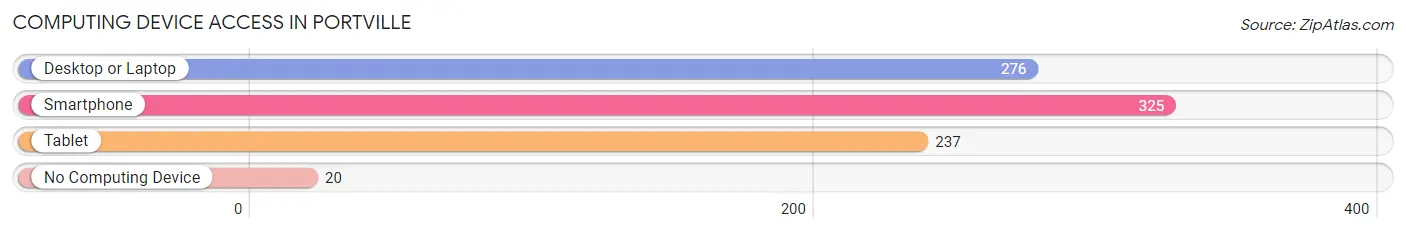
| Device Type | # Households | % Households |
| Desktop or Laptop | 276 | 73.8% |
| Smartphone | 325 | 86.9% |
| Tablet | 237 | 63.4% |
| No Computing Device | 20 | 5.3% |
| Total | 374 | 100.0% |
Internet Access in Portville
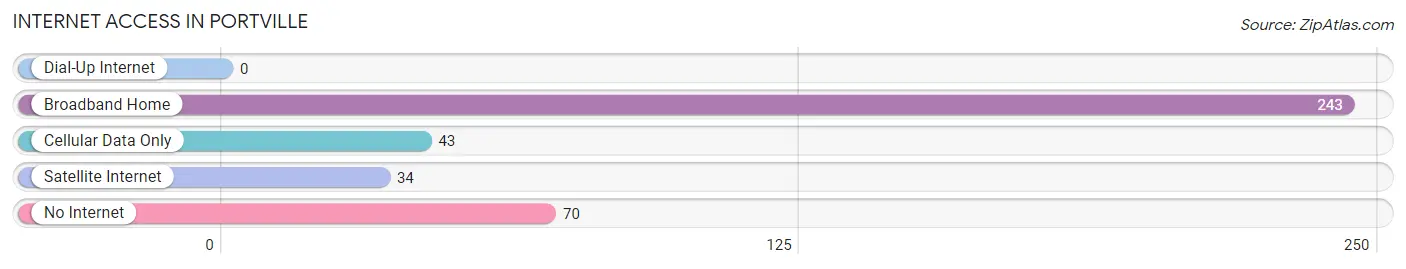
| Internet Type | # Households | % Households |
| Dial-Up Internet | 0 | 0.0% |
| Broadband Home | 243 | 65.0% |
| Cellular Data Only | 43 | 11.5% |
| Satellite Internet | 34 | 9.1% |
| No Internet | 70 | 18.7% |
| Total | 374 | 100.0% |
Portville Summary
Portville, New York is a small town located in Cattaraugus County, in the western part of the state. It is situated on the Allegheny River, near the Pennsylvania border. The town was founded in 1808 and has a population of approximately 2,000 people.
History
Portville was founded in 1808 by a group of settlers from Connecticut. The town was named after the nearby port of Portville, which was used to transport goods and people between the two states. The town was originally a farming community, but in the late 19th century, it became a center for the lumber industry. The lumber industry was the main source of employment for the town until the early 20th century, when the industry began to decline.
In the early 20th century, Portville began to develop into a tourist destination. The town was known for its scenic beauty and its proximity to the Allegheny River. The town also became a popular destination for fishing and hunting.
Geography
Portville is located in western New York, in Cattaraugus County. It is situated on the Allegheny River, near the Pennsylvania border. The town is surrounded by rolling hills and forests, and is home to several small lakes and streams. The town is located approximately 30 miles south of Buffalo and 60 miles east of Erie, Pennsylvania.
Economy
The economy of Portville is largely based on tourism. The town is a popular destination for fishing, hunting, and camping. There are several small businesses in the town, including restaurants, shops, and lodging. The town also has a small manufacturing sector, which produces furniture and other wood products.
Demographics
As of the 2010 census, the population of Portville was 2,000. The racial makeup of the town was 97.2% White, 0.7% African American, 0.3% Native American, 0.2% Asian, 0.1% Pacific Islander, and 1.5% from other races. The median household income was $37,500, and the median family income was $45,000. The per capita income was $19,000.
Conclusion
Portville, New York is a small town located in Cattaraugus County, in the western part of the state. It was founded in 1808 and has a population of approximately 2,000 people. The town is known for its scenic beauty and its proximity to the Allegheny River. The economy of Portville is largely based on tourism, and the town is a popular destination for fishing, hunting, and camping. The racial makeup of the town is predominantly White, with a small percentage of African American, Native American, Asian, and Pacific Islander residents. The median household income is $37,500, and the median family income is $45,000.
Common Questions
What is Per Capita Income in Portville?
Per Capita income in Portville is $34,824.
What is the Median Family Income in Portville?
Median Family Income in Portville is $81,538.
What is the Median Household income in Portville?
Median Household Income in Portville is $59,500.
What is Income or Wage Gap in Portville?
Income or Wage Gap in Portville is 41.4%.
Women in Portville earn 58.6 cents for every dollar earned by a man.
What is Inequality or Gini Index in Portville?
Inequality or Gini Index in Portville is 0.48.
What is the Total Population of Portville?
Total Population of Portville is 885.
What is the Total Male Population of Portville?
Total Male Population of Portville is 401.
What is the Total Female Population of Portville?
Total Female Population of Portville is 484.
What is the Ratio of Males per 100 Females in Portville?
There are 82.85 Males per 100 Females in Portville.
What is the Ratio of Females per 100 Males in Portville?
There are 120.70 Females per 100 Males in Portville.
What is the Median Population Age in Portville?
Median Population Age in Portville is 46.2 Years.
What is the Average Family Size in Portville
Average Family Size in Portville is 3.1 People.
What is the Average Household Size in Portville
Average Household Size in Portville is 2.4 People.
How Large is the Labor Force in Portville?
There are 423 People in the Labor Forcein in Portville.
What is the Percentage of People in the Labor Force in Portville?
59.0% of People are in the Labor Force in Portville.
What is the Unemployment Rate in Portville?
Unemployment Rate in Portville is 6.1%.